1 Market Briefing “Stocks & Bonds” 16th May 2002 Walter Henniges Managing Director Deutsche Bank...
22
1 Market Briefing “Stocks & Bonds” 16th May 2002 Walter Henniges Managing Director Deutsche Bank Head of Debt Capital Markets Frankfurt
-
Upload
gervase-hardy -
Category
Documents
-
view
220 -
download
3
Transcript of 1 Market Briefing “Stocks & Bonds” 16th May 2002 Walter Henniges Managing Director Deutsche Bank...

1
Market Briefing“Stocks & Bonds”
16th May 2002
Walter HennigesManaging Director
Deutsche BankHead of Debt Capital Markets Frankfurt

2
The Market for Bonds
Chapter 1

3
The Eurobond Issuance Volume
1997: €uro 301 Mrd. 1998: €uro 340 Mrd.
1999: €uro 481 Mrd. 2000: €uro 485 Mrd.
2001: €uro 609 Mrd.
During the past 5 years the market has gained more liquidity and sophistication on both the issuer’s and investor’s side.
The corportae bond segment has grown most impressively. In 1997 corporate bonds accounted for 5% while the share in 2001 grew to 34% of total issuance.
During the past 5 years the market has gained more liquidity and sophistication on both the issuer’s and investor’s side.
The corportae bond segment has grown most impressively. In 1997 corporate bonds accounted for 5% while the share in 2001 grew to 34% of total issuance.
Source: Bondware13 May 2002

4
Volume and Currencies
50.000
100.000
150.000
200.000
250.000
300.000
350.000
400.000
1990 1991 1992 1993 1994 1995 1996 1997 1998 1999 2000 2001 2002
USD EMU / EURO GBP SFR JPY Others
Source: Bondware14 May 2002
Within the last twelve years, the €uro gained the top position for bond issues in the Euromarket, with replacing the former
EMU currencies and more than doubling the USD in 1999 - 2001.
Within the last twelve years, the €uro gained the top position for bond issues in the Euromarket, with replacing the former
EMU currencies and more than doubling the USD in 1999 - 2001.

5
Sector development
Source: DB IndexQuant13 May 2002

6
Issuing into the Eurobond markets
Source: Bondware13 May 2002
Eurobond issuance was up 15% in 2001 compared to 2000
The Euro continues to gain market share in the Eurobond market with the Euro gaining six percentage points market share in 2001 compared to 2000
The Euro sector is continuing to expand in terms of its ability to absorb record volumes of issuance and its capacity for a broader range of credits
In 2001, the market experienced a record of defaults as a result of poor credit quality and a week economy
In 2002, market conditions are influenced by “Enronitis”, Argentinia and last year’s dismal performance in almost every industry sector.
2000 2001 2002 ytd
All Eurobond issuance
JPY8%
Others2%STG
13%
EUR53%
USD24% JPY
5%
Others2%STG
11%
EUR59%
USD23%

7
The Market for Euros - by Issuer Nationality
Source: Dealogic Bondware*until 31 March 2002
2001
Supras1%
Australasia1%
Far East1%
USA & Can9%
Others5%
W.Europe83%1996
8
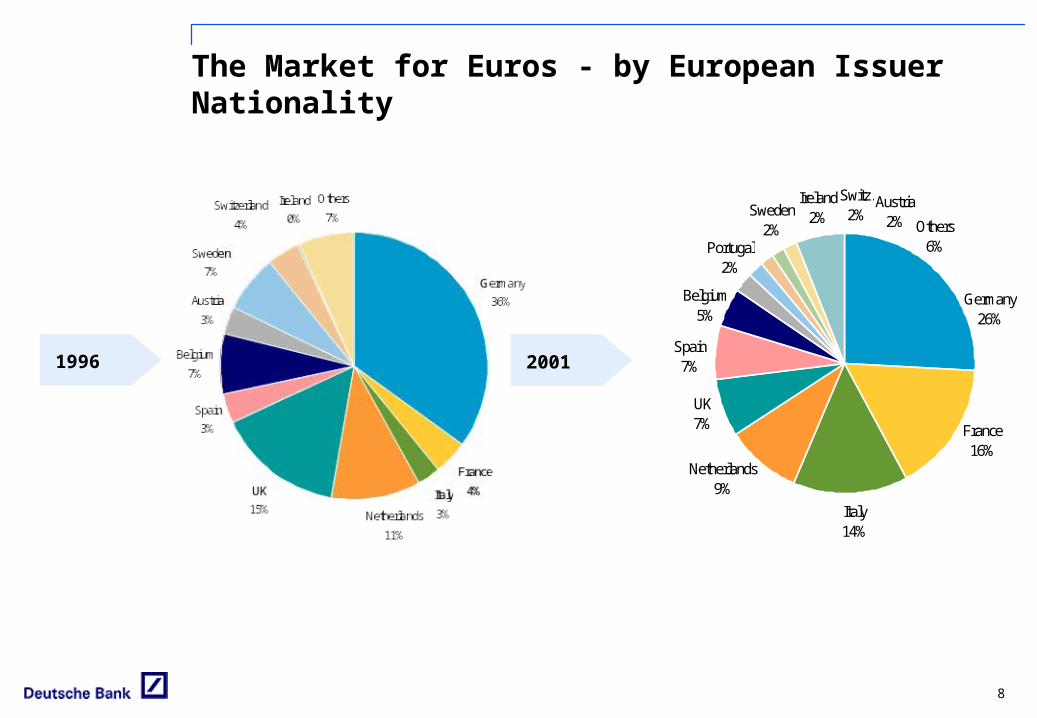
The Market for Euros - by European Issuer Nationality
Italy14%
Switz.2%
UK7%
Others6%Portugal
2%
Belgium5%
Sweden2%
Spain7%
Ireland2%
Austria2%
Netherlands9%
France16%
Germany26%
20011996
9
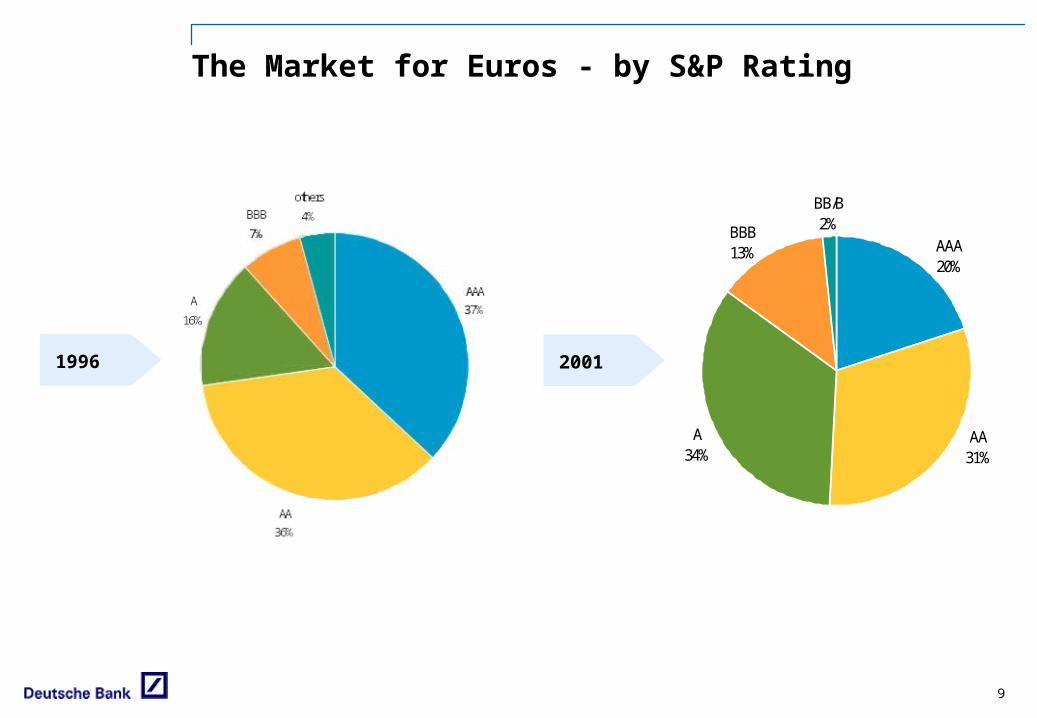
The Market for Euros - by S&P Rating
A34%
BB/B2%BBB
13%
AA31%
AAA20%
20011996

10
Who are the Issuers?
20011996
In 1996: mainly banks, agencies and sovereigns biggest issuers: EIB, KfW, EBRD, Abbey
National, Wells Fargo, Argentinia only a few corporate issuer, as VW, GMAC,
GECC, Toyota biggest single issue:
United Kingdom: 2 bn USD (equals 1,7 bn €uro)
In 2001: biggest portion still banks/finance increasing share of corporate issues,
partly to refinance M&A activities multi-billion issues from the telecom/
utility sector; France Telecom, British Telecom, Deutsche Telekom, Portugal Telecom, Sogerim, AT&T, DCX, RWE, Fiat, Unilever, Enel, Siemens, etc.
biggest single issue: Deutsche Telekom: 4,5 bn €uro

11
Investors approach
Eurobond Investors How investors value new issuers
Examination and approval of the credit, based on: Industry Risk Public Rating Internal Credit Committee Judgement
Establishing relative value based on: Similarly rated issues Secondary trading levels of comparable
issuers “Liquidity” value of the issue
Technical Factors: Maturity, duration and coupon target Current portfolio and redemption views on the underlying benchmark market
and outlook for the yield curve

12
Debt Capital Instruments
Chapter 2

13
Finance Instruments (overview)
Balance Sheet
Fixed assetsFixed assets
Shareholder EquityShareholder Equity
LiabilitiesLiabilities
Current assetsCurrent assets
Equity: Ordinary increase of
shareholders’ funds Revaluation or
increase of assets
Equity: Ordinary increase of
shareholders’ funds Revaluation or
increase of assets
Equity linked: Convertible Bond Exchangeable Bond Other forms of Hybrid
Capital
Equity linked: Convertible Bond Exchangeable Bond Other forms of Hybrid
Capital
Outside capital: Public Bond Private Placement Commercial Paper Syndicated Loans Bilateral Loans
Outside capital: Public Bond Private Placement Commercial Paper Syndicated Loans Bilateral Loans
Divestment:• Sale of unused
assets
Divestment:• Sale of unused
assets
Current Assets: Liquid assets Asset Securitisation
Current Assets: Liquid assets Asset Securitisation

14
Products: the key debt instruments (issuer’s perspective)
Commercial Paper Program
Debt Issuance Program „Stand Alone“Documentation
Documentation-platform
Name RecognitionName Recognition
Rating / Rating Advisory / Credit ResearchRating / Rating Advisory / Credit Research„Credit Story“
Bilateral and syndicated Loan /
SSD
Bilateral and syndicated Loan /
SSDCommercial Paper Syndicated BondInstrument
Private Placement/
EMTNs
The core product is the public syndicated bond. Bond structures range from a plain vanilla
Eurobond to hybrid capital.
The core product is the public syndicated bond. Bond structures range from a plain vanilla
Eurobond to hybrid capital.
From the above there is a clear cross selling potential for various OTC-derivative products. From the above there is a clear cross selling potential for various OTC-derivative products.

15
The role of the bank
Bank
Investor
IssuerOrigination
Sales
Rating Advisory
Trading
Syndicate
Derivatives

16
Environment
Chapter 3

17
Current Trends in the Fixed Income Markets
The BASEL II Capital Adequacy Framework will link the capital requirements of a bank to the individual risk of its outstanding loans. Therefore, banks will lift interest margins on international capital markets standards.
This will have a deep impact on smaller companies, as bigger companies have already established their market profile with international investors.
Credit AAA to A+ to A- BBB+ to BB - Below UnratedAssessment AA- BB -
Risk Weights ri 20% 50% 100% 150% 100%
Credit AAA to A+ to A- BBB+ to BB - Below UnratedAssessment AA- BB -
Risk Weights ri 20% 50% 100% 150% 100%
Kredite Anleihen USA
0
10
20
30
40
50
60
70
80
in %
DeutschlandLoans BondsGermany
USA

18
ECB’s and Fed’s Rate changesECB Fed
While the ECB lowered its interest rates five times since January 2001, the Federal Funds Rates dropped for eleven times since then.
Yield Curve - Euro Swap Annual
Source: Bloomberg13 May 2002

19
League Tables
Chapter 4
20
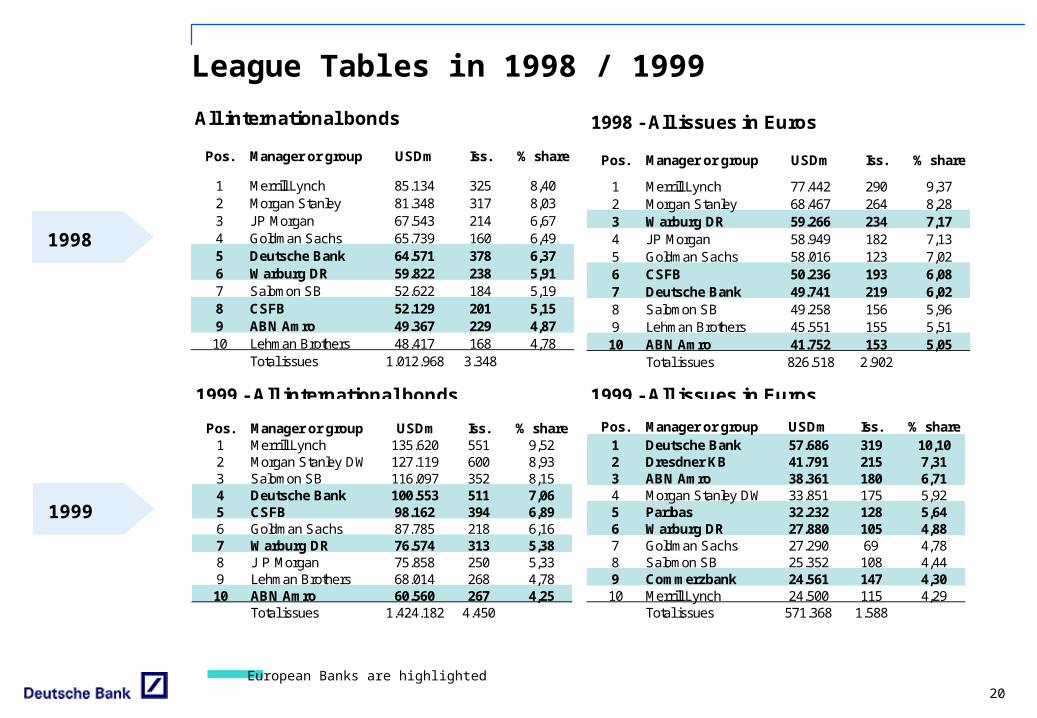
League Tables in 1998 / 1999
1999
1999 - All issues in Euros
Pos. Manager or group USDm Iss. % share1 Deutsche Bank 57.686 319 10,102 Dresdner KB 41.791 215 7,313 ABN Amro 38.361 180 6,714 Morgan Stanley DW 33.851 175 5,925 Paribas 32.232 128 5,646 Warburg DR 27.880 105 4,887 Goldman Sachs 27.290 69 4,788 Salomon SB 25.352 108 4,449 Commerzbank 24.561 147 4,3010 Merrill Lynch 24.500 115 4,29
Total issues 571.368 1.588
1999 - All international bonds
Pos. Manager or group USDm Iss. % share1 Merrill Lynch 135.620 551 9,522 Morgan Stanley DW 127.119 600 8,933 Salomon SB 116.097 352 8,154 Deutsche Bank 100.553 511 7,065 CSFB 98.162 394 6,896 Goldman Sachs 87.785 218 6,167 Warburg DR 76.574 313 5,388 J P Morgan 75.858 250 5,339 Lehman Brothers 68.014 268 4,7810 ABN Amro 60.560 267 4,25
Total issues 1.424.182 4.450
1998
All international bonds
Pos. Manager or group USDm Iss. % share
1 Merrill Lynch 85.134 325 8,402 Morgan Stanley 81.348 317 8,033 JP Morgan 67.543 214 6,674 Goldman Sachs 65.739 160 6,495 Deutsche Bank 64.571 378 6,376 Warburg DR 59.822 238 5,917 Salomon SB 52.622 184 5,198 CSFB 52.129 201 5,159 ABN Amro 49.367 229 4,8710 Lehman Brothers 48.417 168 4,78
Total issues 1.012.968 3.348
1998 - All issues in Euros
Pos. Manager or group USDm Iss. % share
1 Merrill Lynch 77.442 290 9,372 Morgan Stanley 68.467 264 8,283 Warburg DR 59.266 234 7,174 JP Morgan 58.949 182 7,135 Goldman Sachs 58.016 123 7,026 CSFB 50.236 193 6,087 Deutsche Bank 49.741 219 6,028 Salomon SB 49.258 156 5,969 Lehman Brothers 45.551 155 5,5110 ABN Amro 41.752 153 5,05
Total issues 826.518 2.902
European Banks are highlighted

21
League Tables in 2001 / 2000:
2001 - All international bonds
Pos. Manager or group USDbn Iss. % share1 Citigroup/SSB 205,01 392 11,62 Morgan Stanley DW 152,15 392 8,63 Deutsche Bank 150,58 464 8,54 JP Morgan Chase 143,30 320 8,15 Merrill Lynch 134,85 337 7,66 CSFB 119,70 334 6,87 UBS Warburg 99,13 322 5,68 Lehman Bros 96,86 185 5,59 Goldman Sachs 95,18 212 5,4
10 Barclays Capital 67,28 244 3,8Total issues 1.773,02 3.608
2001 - All bonds in Euros
Pos. Manager or group EURm Iss. % share1 Deutsche Bank 70.365 232 9,12 Citigroup/SSB 57.233 156 7,43 JP Morgan Chase 54.572 162 7,14 Merrill Lynch 50.163 157 6,55 Morgan Stanley DW 49.567 151 6,46 ABN Amro 44.174 149 5,77 BNP Paribas 42.085 135 5,58 DrKW 39.163 195 5,19 Goldman Sachs 37.680 119 4,9
10 CSFB 35.715 126 4,6Total issues 770.716 1.594
2001
2000 - All international bonds
Pos. Manager or group USDbn Iss. % share1 Merrill Lynch 159,40 524 10,592 Morgan Stanley DW 149,39 576 9,933 Salomon SB 149,37 461 9,934 Deutsche Bank 118,58 492 7,885 UBS Warburg 109,71 449 7,296 CSFB 105,79 408 7,037 JP Morgan 104,83 307 6,978 Goldman Sachs & Co 95,98 265 6,389 Lehman Bros 77,50 234 5,1510 ABN Amro 55,20 273 3,67
Total issues 1.504,68 4.408
2000 - All issues in Euros
Pos. Manager or group EURm Iss. % share1 Deutsche Bank 63.836 267 10,732 Morgan Stanley DW 43.634 171 7,333 Salomon SB 41.662 134 7,004 UBS Warburg 36.697 136 6,175 ABN Amro 34.147 165 5,746 Merrill Lynch 32.835 144 5,527 JP Morgan 32.096 119 5,408 CSFB 32.006 140 5,389 Dresdner KB 28.573 155 4,8010 BNP Paribas 28.338 137 4,76
Total issues 594.907 1.599
2000
European Banks are highlighted

22
Banks27.9%
Central Banks21.1%
Corporates 5.1%
Funds42.5%
Pension1.9%
Other0.1%
Retail0.2%
Insurance Companies1.1%
Austria1%
Belgium6%
Denmark3%
Finland3%
France3%
Germany8%
Greece0%
Ireland1%
Italy15%
Luxembourg1%
Netherlands3%
North America13%
Spain1%
Asia (not Japan)12%
Sweden1%
Portugal1%
Other Europe2%
Other5%
Japan9%
Switzerland5%
United Kingdom7%
European Investment Bank (Aaa/AAA)Global EUR 5 billion 4% EARN due January 2007
This issue represented a ground-breaking step for the EIB as is was • EIB's first Global issued off its Euro Area Reference Note (EARN) programme• EIB’s first fully book built issue• EIB’s first issue to utilise the pot syndication method• EIB's largest issue ever and the first EIB Euro issue to be immediately traded on
EuroMTS. The transaction was carefully prepared and pre-marketed over a two-week period
involving investor meetings, conference calls and sales force presentations across Asia, US and Europe.
The issue was positioned as the new, current coupon, 5 year surrogate sovereign benchmark filling a gap in AAA supply that had lain open since July.
Price guidance was announced soon after the 50 bp rate cut by the ECB on Thursday November 8th at a range of low 20s over the Bund 6% January 2007. By the end of book building on November 14th the book was oversubscribed with orders totalling nearly EUR 10 billion. The issue was priced the following day at the tight end of the range at +20bps. Once freed to trade, the bid spread tightened in to +19.5 bps.
The syndicate structure consisted of a 100% pot between the joint leads, with a retention for the co-leads as well as access to a co-lead only ”flexi-pot" of EUR 500 million. This second pot was managed by the EIB alone with additional bonds allocated according to the performance of each bank.
Over 300 accounts submitted orders for the paper, with order sizes ranging from less than EUR 1mn to over EUR 500mn. The average allocation for each investor was approximately EUR 25mn.
Announcement date: 5 November 2001Launch date: 14 November 2001Maturity date: 15 January 2007Reoffer Spread: 20bps over Bund 6% due January 2007Joint Lead Managers: BNP Paribas, Deutsche Bank, Morgan StanleySyndicate Group: 6 Senior Co-leads and 10 Co-leads
Issue Details
Deal Highlights
Investor type distribution *
Geographical distribution *
* Lead managers’ allocations only