
1 Maritime Awards Society of Canada Oceans Governance on Canada’s West Coast Shipping Industry...
26
1 Maritime Awards Society of Maritime Awards Society of Canada Canada Oceans Governance on Oceans Governance on Canada’s West Coast Canada’s West Coast Shipping Industry Shipping Industry Perspective Perspective Dunsmuir Lodge Dunsmuir Lodge University of Victoria University of Victoria Rick Bryant Chamber of Shipping June 8, 2007
-
Upload
elinor-webb -
Category
Documents
-
view
214 -
download
0
Transcript of 1 Maritime Awards Society of Canada Oceans Governance on Canada’s West Coast Shipping Industry...
1
Maritime Awards Society of Maritime Awards Society of CanadaCanada
Oceans Governance on Canada’s Oceans Governance on Canada’s West CoastWest Coast
Shipping Industry PerspectiveShipping Industry Perspective
Dunsmuir LodgeDunsmuir LodgeUniversity of VictoriaUniversity of Victoria
Rick BryantChamber of Shipping
June 8, 2007

2
Outline
• Overview of West Coast Shipping Activity
• Emerging Issues Drivers and Concerns in Marine Transportation
• Governance of Shipping

3
Marine Industry Economic Impact in Canada
Source - LeCG - Estimating Economic Impact of the Canadian Marine Transportation Industry – March 2004 – Preliminary Draft
Direct + Indirect Contribution to GDP(3751 Million Dollars)
77309
157
699
757
1449
124
1118150
NF PEI
NS NB
QUE ONT
MAN SASK
AL BC
BC
ONTARIO
QUEBEC
Maritimes
BC economic
impact 38%

4
Value of Trade Commodities(Billions of Canadian dollars)
MarineAll
ModesTrans-border
Exports 13.57 347.89
Imports 2.69 208.65
Total U.S. 16.26 556.54Other countries
Exports 40.57 63.68
Imports 60.67 146.06
Total 101.24 209.75
Total value of commodities shipped = $117.5B
Approximately 40% of the activity is in BC

5
Flag Shares of Shipping Volumes
95.4
50.2
40
99.9
4.5
0102030405060708090
100
Domestic Transborder Foreign
Pe
rce
nta
ge
of
To
tal
Canadian Flag US Flag Foreign Flag
Domestic shipping regulated by Coasting Trade Act – 95% Canadian
Trans-border shipping open competition – 50% Canadian
Import/Export open competition – 99.9% Foreign

6
Shipping and Growth in Global Trade
Key Average Global Growth Indicators (1990 -2004)
% Change
GDP 3.3Trade 6.4Container volume 8.9
Source: Cosco/ Drewry

7
International Shipping in BC
Bulk CarrierGeneral Cargo
Container Ship
TankerVehicle Carrier
Cruise Ship
Number of Voyages in BC, by Vessel Type
General Cargo,
482, 14%
Motor Vehicle Carrier, 228, 6%
Tanker, 267, 7%
Bulk Vessel,
1217, 34%
Container, 915, 26%
Cruise Ship, 434,
12%
Misc, 22, 1%

8
Coastal TowingThe Canadian Transportation Agency
estimates that the Canadian fleet of tugs and barges included 328 tugs and 1,203 barges and scows

9
Ferry Services in Canada
BC Ferries: 2004
• 22 million passengers
• 8.6 million vehicles
BC MOT
• 7.2 million passengers
• 3.3 million vehicles
La Société des traversiers du Québec
• 5.4 million passengers
• 2.7 million vehicles
Marine Atlantic
• 417,500 passengers
• 207,000 vehicles

10
Cruise IndustryCruise Ship Passengers
0
200,000
400,000
600,000
800,000
1,000,000
1,200,000
1,400,000
1999 2000 2001 2002 2003 2004 2005 2006
Victoria
Prince Rupert
Vancouver
Drop in Passenger Count in
Vancouver offset by growth in
Victoria and Prince Rupert
New opportunities in Cruise BC
11
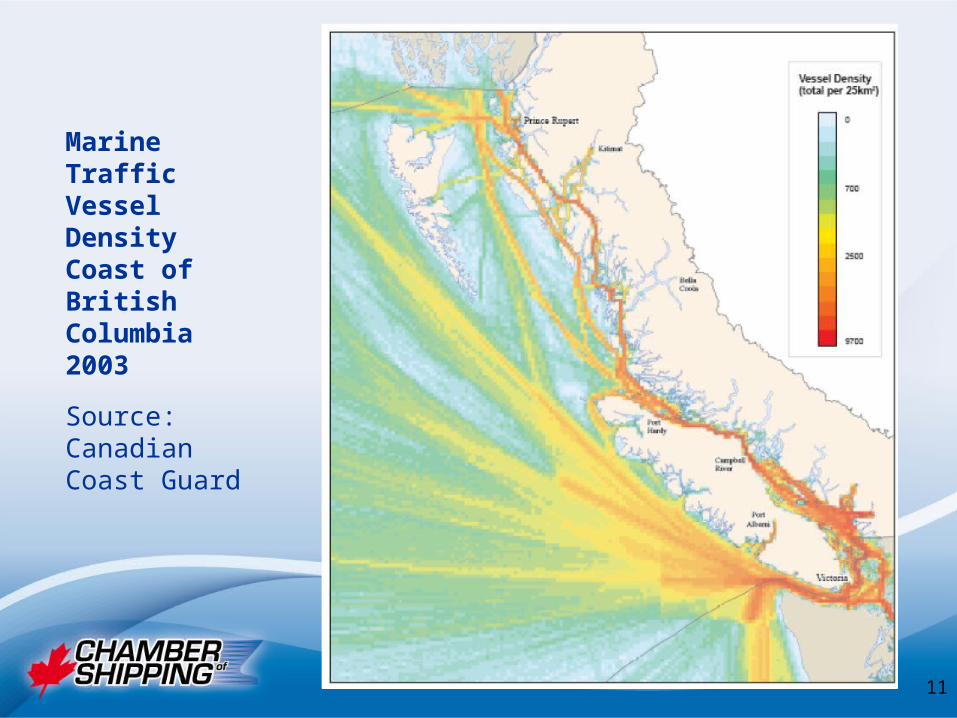
Marine Traffic Vessel Density Coast of British Columbia 2003
Source: Canadian Coast Guard

12
Emerging Issues

Driving Factors and Concerns
• Competition; For markets, between modes and between carriers
• Infrastructure capacity lagging trade growth• Sub-optimum performance of inter-modal
logistics system due to lack of integration • Fragmented marine policy and regulatory
responsibilities • Concerns over labour continuity and labour
supply• Threat of terrorism• Increasing environmental concerns• Poor public image and lack of awareness• Slow uptake of technology and innovation

14
Growth in Trade(Bigger Safer Cleaner Ships)
WESTAC commodity forecast projects significant growth in bulk and container shipping through 2015
• Bulk exports led by coal increase at 4%/year– 2004 - 63 million tonnes – 1200 ships– 2015 - 96 million tonnes – 1600 ships– Average size 50,000 dwt to 60,000 dwt
• Containers up 300%– 2004 1.8M TEU – 915 ships– 2015 5.4M TEU – 1350 ships– Average 2000 TEU to 4000 TEU

15
Environmental FootprintNational Marine and Industrial Council footprint issues
Areas Examined– Marine Air Pollution– Oil and Chemical Spills– Oily Wastes– Sewage Discharge– Other Wastes
Factors Considered– Current status of regulations, technology and action– Obstacles to reaching desired outcomes– Opportunities for government and industry
– Aquatic Invasive Species
– Port Development– Physical Impacts– Ship Recycling

16
BC OGV Contribution to GHG in Canada
758.0
1.3
CO2 Emissions
• Canada produced 758 mega tonnes (mt)of GHG in 2005, 2% of total global emissions.
• OGV emissions within 50 nautical miles - 1.3 mt
• Total marine activity approximately 1.8 mt in BC
• Growth roughly tied to trade volume
0.17%

17
North Coast TankersKitimat identified as site for three new tanker
trades• LNG - 120,000 dwt tankers - 5 per month
• OIL - 5 VLCC tankers per month
• Condensate - 20 ships per year
• Safety Considerations– Oil tankers are new with double hull and twin propulsion and
steering– New powerful tugs for berthing, escort and firefighting– Pilots, ships crew and tug crews trained as a team– LNG shipping – 80,000 transits without a major incident– World-wide tanker incidents dropped from 1000 in 1979 to
160 in 2006

18
Flags of ConveniencePort State Inspection Programs
(Reputation is worse than reality)
Excellent Performance
• Bahamas• Bermuda• China• Liberia• Marshall Islands• Philippines• Korea
Poor Performance• Bolivia• Cambodia• Georgia• Honduras• North Korea• St. Vincent• Tonga

19
Governance of Shipping

20
Industry Expectations in Ocean Management
• Full engagement in process• Clearly articulated expected outcomes• Coordinated single entity inter-departmental
government action• Best use of existing mechanisms• Consistency for all areas and between
applications• Adequate lead time for implementation• Clear and simple compliance requirements• Consistency with International Convention• Predictability of operational costs and risks• Risks linked to international insurance
practice and available coverage• Equity between carriers of all flags

21
International Maritime Organization (IMO)
• IMO founded in 1958 as a specialized agency of the United Nations responsible for measures to improve the safety of international shipping and to prevent marine pollution from ships.
• Member governments create international conventions that are enforced through domestic law that embody the regulations in the convention

22
Key IMO ConventionsSafety• Safety of Life at Sea • Load Lines• Preventing Collisions at Sea• Training Certification and Watch-keeping• Removal of Wrecks
Environment• Prevention of Pollution• Ocean Dumping• Anti-fouling• Ballast Water
Liability and Compensation• Civil Liability for Oil Pollution• International Fund for Compensation• Bunker oil Damage• HNS Liability

23
IMO Conventions Links to Oceans Management• Ocean Dumping – designation of areas.• AIS and LRIT – ship tracking• Ship Routeing Systems – traffic lanes• Vessel Traffic Services – mandatory
management• Removal of Wrecks – removal criteria• Places of Refuge – risk assessment and
selection• Sensitive Sea Areas – designation• Areas to be Avoided – designation• Sulphur Emissions Control Area - designation

24
Particularly Sensitive Sea Area Designation
A sea area where oceanographical, ecological and traffic conditions exist that require mandatory methods for prevention of pollution by oil, noxious liquids or garbage
Criteria for application to IMO – MEPC• Habitats of rare, threatened, or endangered species• Ecological processes of such areas are highly
dependent on biotically structured systems• critical spawning or breeding ground• highly susceptible to degradation by natural events or
the activities of people.• evidence that international shipping activities are
causing damage

25
GUIDELINES ON PLACES OF REFUGE
Masters and Salvors• Appraisal of the situation • Identification of hazards and assessment of risks • Identification of required actions • Contacting the authority of the coastal State • Establishment of responsibilities and communications• Response actions • Reporting proceduresGuidelines for actions expected of coastal States • Assessment of places of refuge • Event-specific assessment • Decision-making process for the use of a place of refuge
26
Use of TermpolTERMPOL• a multi-agency project assessment
managed by Transport Canada that requires proponent to identify pollution risk of new terminal operations and to identify and implement mitigation measures
TERMPOL could be used to create preconditions for projects of a particular type such as oil export terminals specifying pilotage, tug, VTS, navigation aids and other requirements


![INDEX [] · 2005-10-25 · 5 Bryant, John F, 27 Bryant, Levi Clinton, Sr, 109 Bryant, Lillie S, 101 Bryant, Linster, 101 Bryant, Litha L, 109 Bryant, Louisa M, 111 Bryant, Mary, 101](https://static.fdocuments.us/doc/165x107/5f4498e1f4a6be5e1a48d4d2/index-2005-10-25-5-bryant-john-f-27-bryant-levi-clinton-sr-109-bryant.jpg)