Presentation on Public Transportation’s Role in Responding ...
Upload
osborn-danielCategory
view
215download
1
1
Managing Travel For Planned Special Events:
The VA Department of Transportation’s Traffic Signal System Approach
National Transportation Operations Coalition (NTOC)Webcast on Planned Special Events
Ling Li, P.E.Katherine D. Jefferson
January 27, 2005

2
Presentation Outline
• Introduction• Program Planning• Event Operations Planning• Implementation Activities• Day-of-Event Activities• Post-Event Activities• Conclusion

3

4

5

6

7
Program Planning
• Byproduct of traffic signal optimization.
• Initiated by VDOT staff and in response to external requests for assistance.
• Evaluation of existing signal timings.• Stakeholder meetings.
8
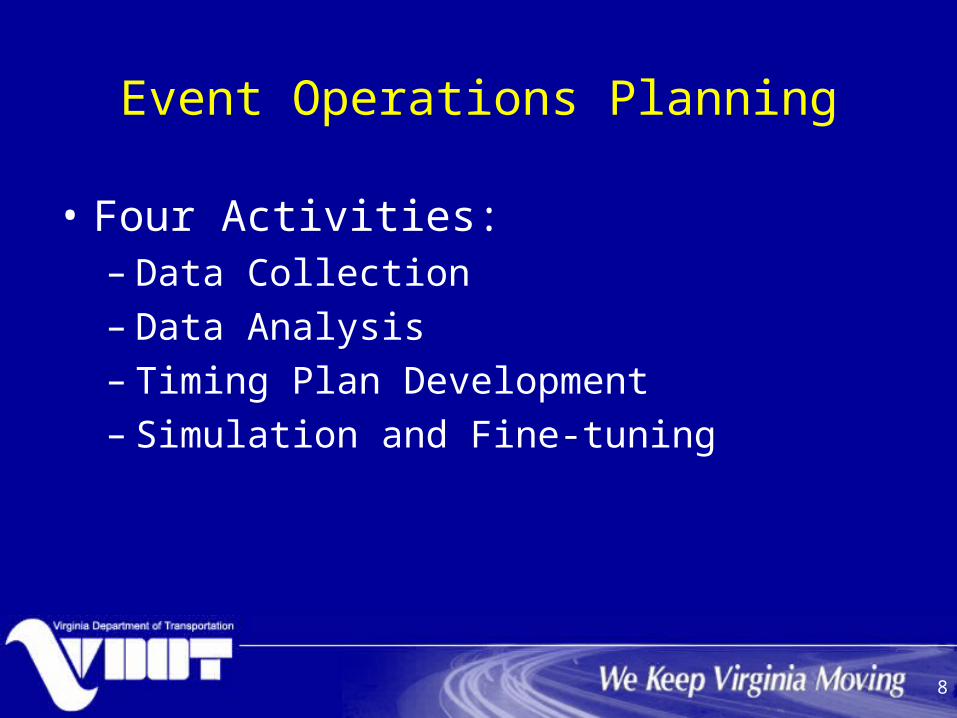
Event Operations Planning
• Four Activities:– Data Collection– Data Analysis– Timing Plan Development– Simulation and Fine-tuning
9
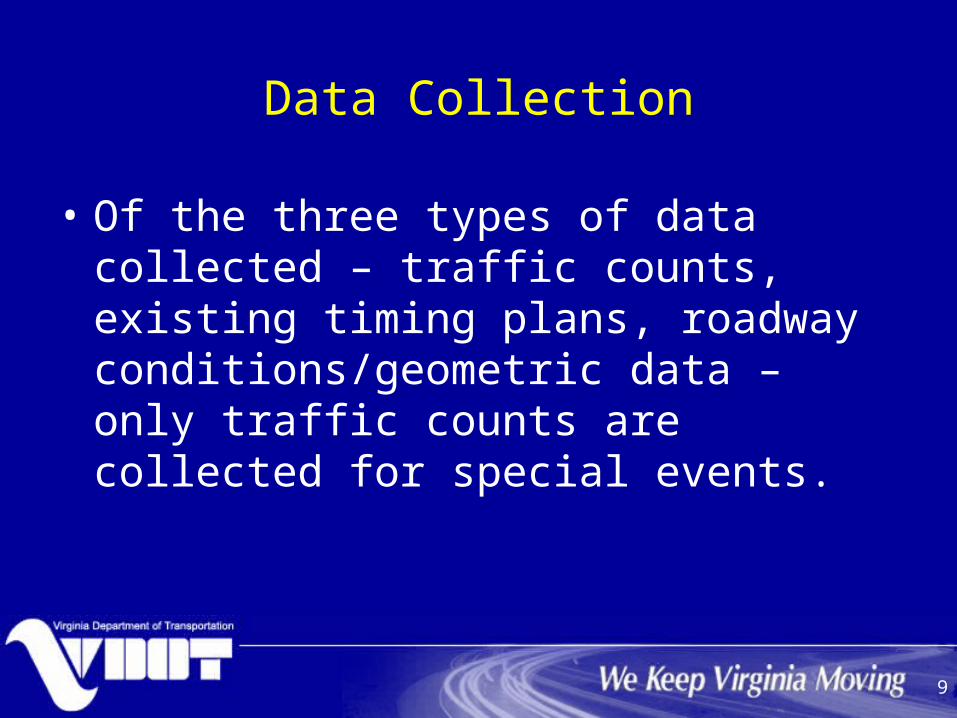
Data Collection
• Of the three types of data collected – traffic counts, existing timing plans, roadway conditions/geometric data – only traffic counts are collected for special events.
10
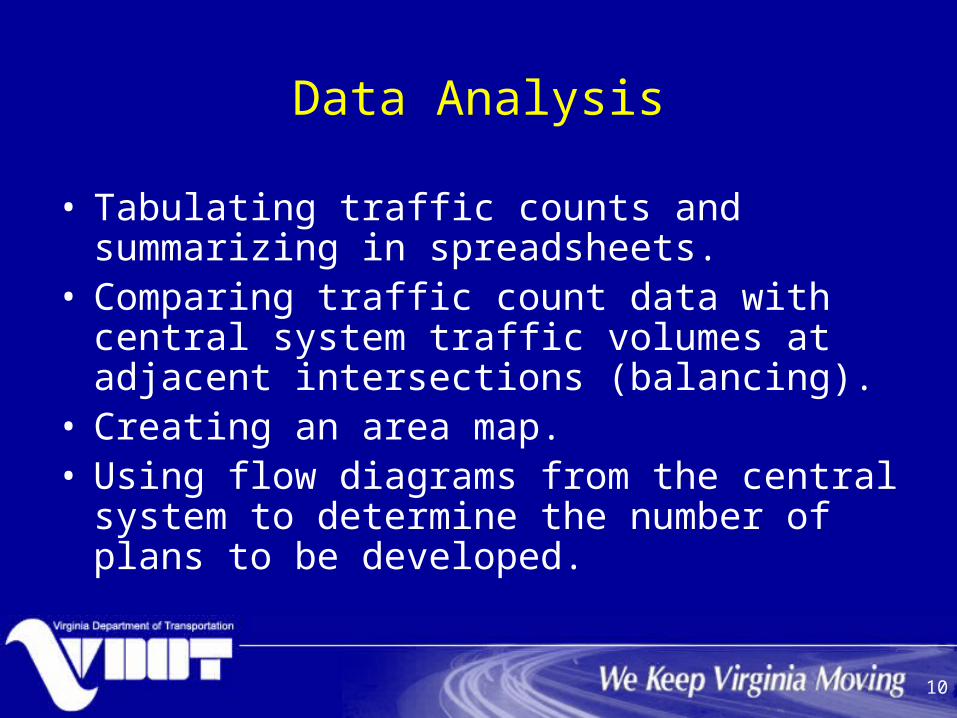
Data Analysis
• Tabulating traffic counts and summarizing in spreadsheets.
• Comparing traffic count data with central system traffic volumes at adjacent intersections (balancing).
• Creating an area map.• Using flow diagrams from the central
system to determine the number of plans to be developed.

11
Timing Plan Development/Optimization
• Level of Service (LOS) and delay calculated for each affected intersection.
• Coordination maintained.• Synchro used for optimization.• Adjustments made using Time-Space
Diagrams (iterative process).

12
Simulation and Fine-tuning/Validation
• SimTraffic used for simulation.• Simulations used to compare
optimized timing plans (from Synchro) with observed traffic conditions and known motorist tendencies.

13
Day-of-Event Activities
• On-site and control room monitoring.• Timing plan adjustments in
accordance with real-time traffic conditions.
• Internal (facility) traffic control challenges.

14

15
Post-Event Activities
• Debriefing Sessions– Evaluate timing plan effectiveness.– Identify intersection modifications,
transportation and operational improvements.
– Create feedback loop for timing plan development for future events.

16
Traffic Volume at Tysons Corner Center ( Rt.7 & Mall Entrance)
0
1000
2000
3000
4000
5000
6000
7000
11/2
6/2
004
11/2
7/2
004
11/2
8/2
004
11/2
9/2
004
11/3
0/2
004
12/1
/2004
12/2
/2004
12/3
/2004
12/4
/2004
12/5
/2004
12/6
/2004
12/7
/2004
12/8
/2004
12/9
/2004
12/1
0/2
004
12/1
1/2
004
12/1
2/2
004
12/1
3/2
004
12/1
4/2
004
12/1
5/2
004
12/1
6/2
004
12/1
7/2
004
12/1
8/2
004
12/1
9/2
004
12/2
0/2
004
12/2
1/2
004
12/2
2/2
004
12/2
3/2
004
12/2
4/2
004
12/2
5/2
004
12/2
6/2
004
12/2
7/2
004
12/2
8/2
004
12/2
9/2
004
12/3
0/2
004
12/3
1/2
004
1/1
/2005
Date
To
tal
In/O
ut
Bo
un
d T
raff
ic (
5 h
ou
rs)
0
1000
2000
3000
4000
5000
6000
7000
InBound Traffic Outbound Traffic InBound Traffic Outbound Traffic

17
0
20
40
60
80
100
120
7:30
PM
8:00
PM
8:30
PM
9:00
PM
9:30
PM
10:0
0 P
M
10:3
0 P
M
11:0
0 P
M
11:3
0 P
M
12:0
0 A
M
12:3
0 A
M
1:00
AM
1:30
AM
2:00
AM
2:30
AM
3:00
AM
Time
Vol
ume
(per
15
min
)
EB LT (9/2/00)

18
0
50
100
150
200
250
300
350
7:30
PM
8:00
PM
8:30
PM
9:00
PM
9:30
PM
10:0
0 P
M
10:3
0 P
M
11:0
0 P
M
11:3
0 P
M
12:0
0 A
M
12:3
0 A
M
1:00
AM
1:30
AM
2:00
AM
2:30
AM
3:00
AM
Time
Vol
ume
(per
15
min
)
SB LT (9/2/200)

19
Conclusion
• Inter-jurisdictional Coordination (IJC):– Has become routine and extends beyond
planned special events to emergency response plan development and continual data sharing.
• Staff participation on MWCOG ITS Task Force Signal Committee.
• Regular bi-monthly meetings of signal system managers and engineers.
20
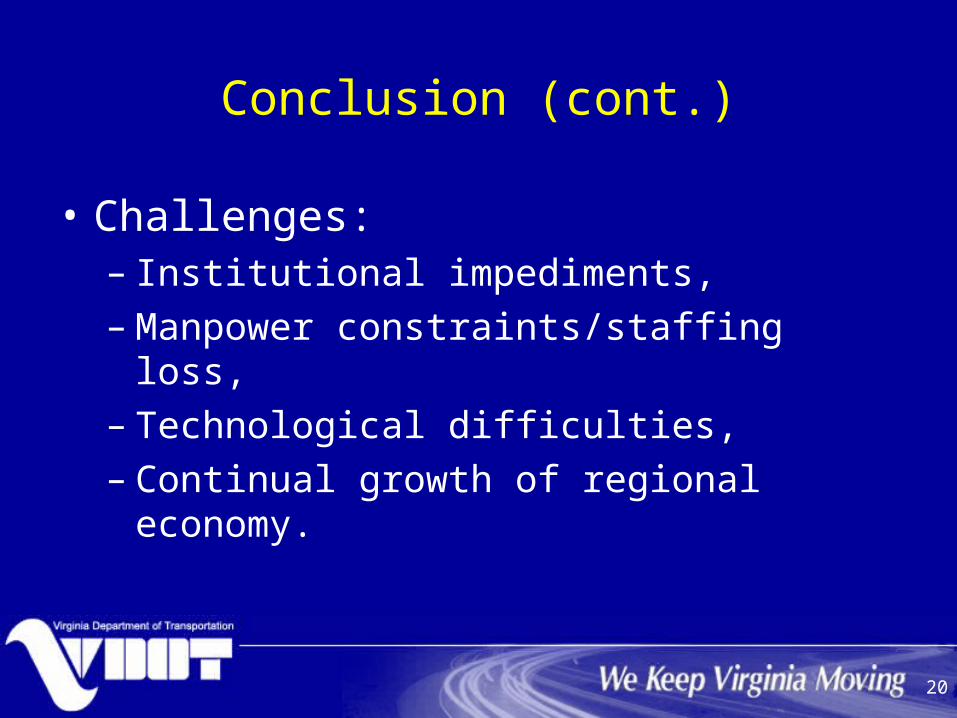
Conclusion (cont.)
• Challenges:– Institutional impediments, – Manpower constraints/staffing loss, – Technological difficulties, – Continual growth of regional economy.

21
Conclusion (cont.)
• Role of ITS technologies:– Enables continual signal timing plan
development.– Enables development of
recommendations for additions and/or improvements to other traffic control devices.
– Enables provision of traveler information to influence route choice.