
1 Local Mobility Management for Networked Femtocells Based...
35
1 Local Mobility Management for Networked Femtocells Based on X2 Traffic Forwarding Tao Guo, Atta Ul Quddus, Ning Wang, and Rahim Tafazolli Abstract Femtocell is becoming a promising solution to face the explosive growth of mobile broadband usage in cellular networks. While each femtocell only covers a small area, a massive deployment is expected in the near future forming networked femtocells. An immediate challenge is to provide seamless mobility support for networked femtocells with minimal support from mobile core networks. In this paper, we propose efficient local mobility management schemes for networked femtocells based on X2 traffic forwarding under the 3GPP Long Term Evolution Advanced (LTE-A) framework. Instead of implementing the path switch operation at core network entity for each handover, a local traffic forwarding chain is constructed to use the existing Internet backhaul and the local path between the local anchor femtocell and the target femtocell for ongoing session communications. Both analytical studies and simulation experiments are conducted to evaluate the proposed schemes and compare them with the original 3GPP scheme. The results indicate that the proposed schemes can significantly reduce the signaling cost and relieve the processing burden of mobile core networks with the reasonable distributed cost for local traffic forwarding. In addition, the proposed schemes can enable fast session recovery to adapt to the self-deployment nature of the femtocells. Index Terms Femtocell, LTE-A, mobility management, traffic forwarding. I. I NTRODUCTION The prevalence of smartphones and flat data tariffs place huge capacity demands on mobile operators’ networks. This has triggered the development of the next generation wireless standards The authors are with the Centre for Communication Systems Research, University of Surrey, United Kingdom, GU2 7XH (e-mail: {t.guo, a.quddus, n.wang, r.tafazolli}@surrey.ac.uk).
Transcript of 1 Local Mobility Management for Networked Femtocells Based...

1
Local Mobility Management for Networked
Femtocells Based on X2 Traffic Forwarding
Tao Guo, Atta Ul Quddus, Ning Wang, and Rahim Tafazolli
Abstract
Femtocell is becoming a promising solution to face the explosive growth of mobile broadband
usage in cellular networks. While each femtocell only covers a small area, a massive deployment is
expected in the near future forming networked femtocells. An immediate challenge is to provide seamless
mobility support for networked femtocells with minimal support from mobile core networks. In this
paper, we propose efficient local mobility management schemes for networked femtocells based on
X2 traffic forwarding under the 3GPP Long Term Evolution Advanced (LTE-A) framework. Instead
of implementing the path switch operation at core network entity for each handover, a local traffic
forwarding chain is constructed to use the existing Internet backhaul and the local path between the local
anchor femtocell and the target femtocell for ongoing session communications. Both analytical studies
and simulation experiments are conducted to evaluate the proposed schemes and compare them with
the original 3GPP scheme. The results indicate that the proposed schemes can significantly reduce the
signaling cost and relieve the processing burden of mobile core networks with the reasonable distributed
cost for local traffic forwarding. In addition, the proposed schemes can enable fast session recovery to
adapt to the self-deployment nature of the femtocells.
Index Terms
Femtocell, LTE-A, mobility management, traffic forwarding.
I. INTRODUCTION
The prevalence of smartphones and flat data tariffs place huge capacity demands on mobile
operators’ networks. This has triggered the development of the next generation wireless standards
The authors are with the Centre for Communication Systems Research, University of Surrey, United Kingdom, GU2 7XH
(e-mail: {t.guo, a.quddus, n.wang, r.tafazolli}@surrey.ac.uk).

2
such as 3GPP Long Term Evolution Advanced (LTE-A) [1] and Worldwide Interoperability
for Microwave Access (WiMAX) IEEE 802.16m [2]. Although advanced access schemes and
antenna systems have been adopted in both standards, the capacity of a single cell is still very
limited compared to the huge user demands. Realizing that more than 50 percent of voice calls
and more than 70 percent of data traffic originate indoors as indicated in recent studies [3] [4],
the femtocell technology has been recognized as a key advancement to face the explosive growth
of mobile broadband usage [5]. A femtocell, also called home base station, is a low-cost, low-
power, and short-range wireless access point usually deployed indoors and connected to a mobile
operator’s network via residential broadband access, e.g. Digital Subscriber Line (DSL) or cable
connection. It is usually deployed under the coverage of an overlaid macrocell and operates in
the same licensed spectrum as the macrocells. It is expected that millions of femtocells will
be deployed in the near future. Multiple femtocells deployed in certain area may form a new
network architecture, referred as networked femtocells [6].
Mobility management is a fundamental problem in cellular networks, which consists of Han-
dover (HO) management and location management. Handover management supports the cell
switch of mobile users in connected mode with ongoing sessions during their movement. Location
management tracks the locations of the mobile users in idle mode to facilitate the fast incoming
service delivery. The small coverage, massive deployment, and long Internet backhaul of fem-
tocells provide new challenges for mobility management, especially for inter-femto handover
scenario. Whereas inter-femto handover may not be an issue for residential environment, we
envisage that frequent handovers among femtocells will occur in scenarios such as shopping mall,
high street, enterprise and conference events. Furthermore, with the rapidly increased demand
to offload traffic from mobile cellular networks, a large number of femtocells are expected to
be deployed in hotspot areas by the operators for public access. Currently, 3GPP LTE-A adopts
a scheme for inter-femto handover similar to the scheme used for inter-macro handover. After a
mobile establishes the radio connection with the target cell, the target cell will inform the core
network entities to switch the data path and the corresponding resource at the source cell will be
released. This scheme performs well for handover in conventional macrocell networks. Since the
coverage of a macrocell is normally up to several kilometers, only few handovers occur during
a typical session. The data path switch after each handover can reduce the transmission latency
over the data path. However, when a mobile moves between femtocells, handovers will be much
3
more frequent than macrocell scenarios due to the much smaller coverage of each femtocell.
Further considering the dense deployment of femtocells, the frequent data path switch operations
will cause significant signaling load to the core network entities. Furthermore, excessive data
path switch operations may also degrade the users’ Quality of Experience (QoE). The main
factor affecting the users’ QoE is not the absolute delay but the delay jitter. When a path switch
operation is initiated at the core network, the nth packet is sent to the UE along the old path
while the n+1th packet is sent to the UE along the new path. Given the delay-varying Internet
backhauls, the interval from the time the UE receives the nth packet to the time the UE receives
the n + 1th packet (i.e. the first packet from the new path) may be large if the new path has a
non-negligible larger delay than the old path. The delay jitter for the following arriving packets
along the same path should be relatively small.
Although a number of research work has been recently conducted for femtocells, they mostly
focus on radio access aspects, such as interference management [7] and coverage optimization
[8]. Little work has been done for mobility management in femtocell networks, especially for
inter-femto handover scenario. In this paper, we propose two local mobility management schemes
for networked femtocells based on X2 traffic forwarding. Instead of switching the data path after
each handover, the target femtocell can use the local path between the previous serving femtocell
and itself for ongoing session communications without sending the path switch request to the core
network entities. A X2 traffic forwarding chain will be established from the original local anchor
point to the current serving femtocell. Since the local traffic forwarding may increase the end-to-
end communication latency and consume the local resource, a threshold of the forwarding chain
should be defined to balance the trade- off between the path switch cost and traffic forwarding
cost. The first scheme, namely Traffic Forwarding with Cascading Path (TF CP),cascades the
target femtocell to the previous source femtocell via the local path after a handover. The second
scheme, namely Traffic Forwarding with Shortest Path (TF SP), implements local path switch
if the target femtocell has a shorter path to the original local anchor point than the cascading
path. We develop analytical models based on Markov chains and conduct simulation studies
for model validation and performance comparison. The results show that the proposed schemes
can significantly reduce the signaling cost and relieve the processing burden of the mobile core
network compared to the standard scheme, especially when the core path switch cost and users’
mobility rates are high. Compared to the standard scheme, the incurred extra data delivery latency
4
is within the reasonable range and the traffic load at local links is distributed within the local
network. Their cost can be traded off with the signaling cost by adjusting the threshold of the
forwarding chain.
The rest of this paper is organized as follows. The related work is described in Section II.
Section III describes the system architecture and deployment scenario. In Section IV, the two
proposed local mobility management scheme with traffic forwarding are presented in details.
The analytical models are developed in Section V. In Section VI, both analytical and simulation
results are presented to show the performance of the proposed schemes. Conclusion is given in
Section VII.
II. RELATED WORK
The existing work on mobility management in femtocell networks can be grouped into han-
dover management and location management. In [9], handover trigger algorithms considering
signal strength and user velocity are proposed for hierarchical macro-femto networks to reduce
the number of unnecessary handovers. In [10], a handover algorithm for inbound mobility from
a macrocell to a femtocell is proposed to tackle the transmission power asymmetry problem. For
inbound handover, the scanning time may be considerably long due to the massive deployment of
femtocells. A cache scheme for femtocell reselection is proposed in [11] to speed up the switch
from the macro-tier to femto-tier. To reduce the signaling cost to the mobile core network and
improve the scalability of the femtocell deployment, [12] proposes to use a femto gateway
located between the femtocells and the mobile core network to act as the mobility anchor point
for inter-femto handover. However, the femto gateway is still deployed at the mobile operators’
premise. Therefore, the signaling cost still burdens the mobile core network and the latency
over the Internet backhaul is unavoidable. In standard 3GPP femtocell architecture, even though
two femto users reside in the same campus or enterprise area, the call signaling and voice
traffic has to be routed via the core network, incurring unnecessary cost. Recent work [13]
[14] introduces a new network element called Enterprise Femtocell GateWay (EFGW) within
the local enterprise femtocell networks to facilitate local mobility management. However, the
extra deployment cost of the new elements will be incurred and the application is limited to
the femtocells maintained by the same owner. [15] proposes a Femto Private Branch Exchange
(FPBX) architecture to replace an expensive normal call between two femto users with a local

5
extension call. An implicit location update approach is used to log the location of the users,
and thus enable the local call routing. Frequent location update may happen when the users
move between femtocells and macrocells. In [16], a Cell Priority Transition (CPT) mechanism
is proposed to reduce the location update cost. The standard 3GPP cell selection procedure is
modified such that a mobile will keep camping on the macrocell when it moves into a femtocell.
The cell selection, location update, and call establishment will be implemented when a call event
arrives. Therefore, the reduced location update cost comes at a price of the increased number of
handovers.
The proposed schemes in this paper are inspired by the idea of pointer forwarding scheme,
which is first introduced in [17] to reduce location management cost in cellular network. If a
mobile changes registration areas frequently but receives calls relatively infrequently, it can set
up a forwarding pointer from the previous Visitor Location Register (VLR) instead of updating
the Home Location Register (HLR) as the latter event is more expensive. Calls to a mobile will
query the HLR to determine the first VLR where the mobile was registered, and then follow a
forwarding chain to the current VLR. Since then, this idea has been widely extended to various
networks, such as mobile IP networks [18][19] and wireless mesh networks [20]. The pointer
forwarding schemes in the literature are proposed to reduce location management cost, and
thus, they are interested in the trade-off between the total registration cost and the call delivery
cost when a call arrives. In this paper, we first propose local mobility management schemes
based on traffic forwarding for LTE-A based networked femtocells to reduce the path switch
cost during handover. The tunneling mechanisms have been extensively employed in mobile IP
networks [21], WiMAX networks [2] and etc. For example, when a handover occurs between
base stations belonging to different Access Service Networks (ASNs) in WiMAX, the old ASN
gateway can become the traffic anchor point and the traffic can be still sent to the old ASN
gateway, which then tunnels the traffic to the new ASN gateway. The ASN gateway relocation
can be performed later after the link layer handover is completed. In this way, the handover
latency is reduced by avoiding ASN gateway relocation during the handover. Normally only two
neighbors are considered in the above tunneling scenarios. However, a mobile may travel across
several femtocells during one session in networked femtocells due to the small coverage and
dense deployment of the femtocells. The forwarding chain mechanisms need to be investigated
in this scenario.

6
III. SYSTEM ARCHITECTURE
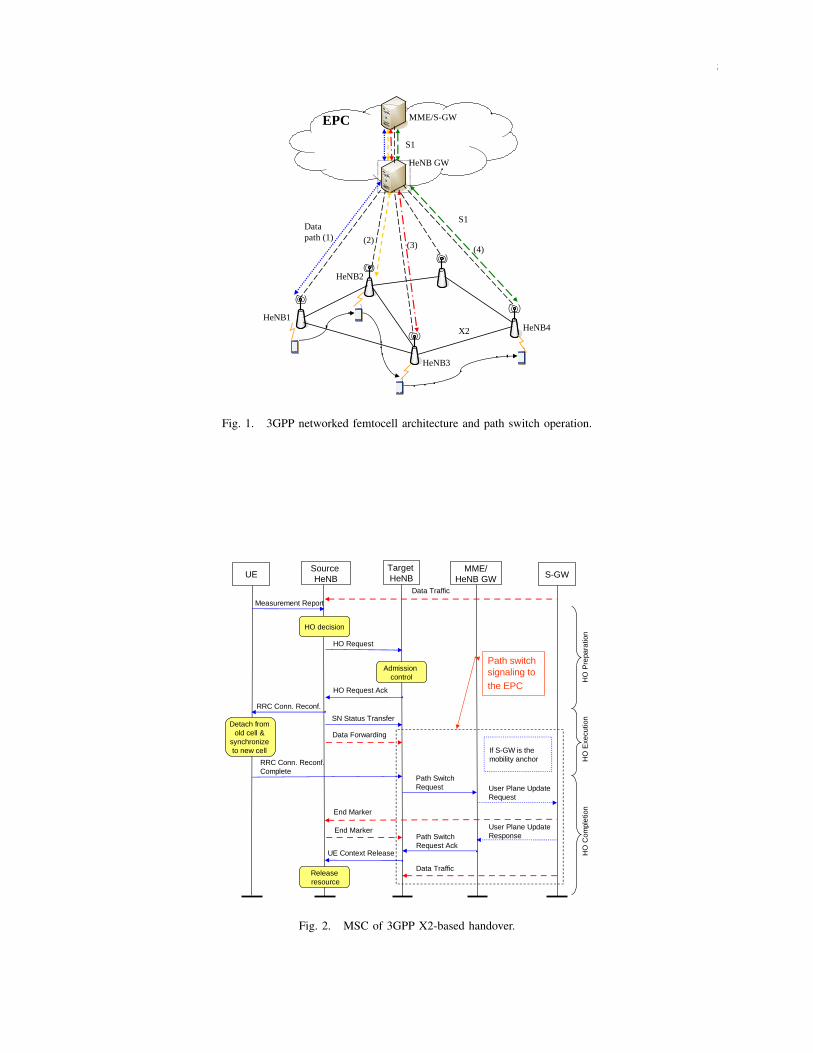
A 3GPP LTE-A networked femtocell architecture is considered as shown in Fig.1,in which a
number of femtocells are deployed forming a local network. In the following sections, we will use
3GPP terminology for description purpose, e.g. Evolved Node B (eNB) for macro base station,
Home Evolved Node B (HeNB) for femto base station, User Equipment (UE) for mobile station.
The detailed descriptions of each functional entity and network architecture can be found in [1].
Each HeNB is connected to the Mobility Management Entity (MME) and Serving Gateway (S-
GW) in the Evolved Packet Core (EPC) via S1-MME and S1-U interfaces, respectively. A HeNB
Gateway (HeNB GW) can be optionally deployed to act as a concentrator for the Control-Plane
(CP) signaling and optionally for the User-Plane (UP) data traffic. The purpose of introducing
the HeNB GW by 3GPP is to support a large number of HeNBs in a scalable manner without
modifying the S1 interfaces between the HeNB and the EPC. Therefore, a HeNB GW appears to
an MME as a HeNB, while it appears to a HeNB as an MME. However, a HeNB GW is deployed
at the edge of the mobile core network and the signaling messages exchanged between it and
HeNBs still need to traverse the Internet backhaul. And this centralized management entity can
still become a bottleneck if massive signaling messages from/to HeNBs need to be processed.
The direct X2 connection between femtocells has been supported in 3GPP since release 10
and has been further defined in recent release 11 [1]. Direct X2 backhaul links are considered as
a key requirement for inter-HeNB mobility enhancement [22] and interference management [23].
In principle, a HeNB can maintain an X2 interface between every HeNB in the local network and
itself. However, this implies that each HeNB needs to maintain a number of active Stream Control
Transmission Protocol (SCTP) sessions all the time, which are difficult to be supported by a cost-
constrained HeNB and even by an eNB. Therefore, similar to the X2 interfaces between eNBs
[24], HeNB should normally only maintain the X2 interfaces with its immediate neighboring
cells (instead of a full mesh) with overlapping radio coverage . Thus, it is worth mentioning
that the complexity in the establishment of direct backhaul links does not increase with the
growth of network size, so the implementation of direct backhaul links is not an issue even with
a large number of femtocells. The X2 connection setup between HeNBs can be described as
follows based on [1]: When a HeNB is plugged into the network, it switches to operational mode
and scans its environment. If neighboring HeNBs are detected, the HeNB registers its local IP

7
address and the detected neighbor information at the HeNB GW (or at the MME if the HeNB
GW is absent). The HeNB-GW already has the local IP addresses of other operational HeNBs,
and thus it can respond to the newly added HeNB with this information. A direct X2 interface
is then setup between the newly added HeNB and its neighboring HeNBs. Note that although
X2 interface is a logical interface by definition and can traverse any physical path in principle,
it is assumed in this paper to be within the local network. This is a reasonable assumption when
HeNBs are within the same subnet or connected with each other according to the IP routing
table.
Different from eNBs that are open to all the UEs, three access control strategies may be applied
to HeNBs: closed access, open access and hybrid access. 3GPP has introduced the concept of a
Closed Subscriber Group (CSG) to identify a group of UEs that are permitted to access one or
more HeNBs having restricted access. In closed access mode, only UEs that are CSG-members
can access the services via the HeNB. In open access mode, the HeNB provides services to all
the UEs within its coverage without restriction. In hybrid access mode, UEs that are not member
of the CSG can have limited access to the HeNB as long as the services received by the CSG
members are not degraded. The access control may be implemented at the MME. In this case,
X2-based handover between HeNBs is not possible. If no access control at the MME is needed,
i.e., when the handover is between HeNBs in closed/hybrid access mode having the same CSG
ID or when the target HeNB has open access, X2-base handover can be adopted. In this paper,
we consider a scenario that no access control is needed at the MME. Example scenarios include
the enterprise scenario in which femtocells have the same CSG ID and the high street scenario
in which femtocells are deployed by the store owners and are open to public.
IV. LOCAL MOBILITY MANAGEMENT WITH X2 TRAFFIC FORWARDING
In this section, we first present the X2-based inter-femto handover procedure defined by 3GPP.
Then we introduce the proposed Traffic Forwarding with Cascading Path (TF CP) scheme and
Traffic Forwarding with Shortest Path (TF SP) scheme.
A. 3GPP Scheme
In the recent 3GPP standard [1], direct X2 interface is supported between HeNBs, and thus
an X2-based HO can be utilized when UEs move between HeNBs similar to the X2-based HO

8
between eNBs. The Message Sequence Chart (MSC) for the X2-based HO between HeNBs
is shown in Fig.2,which consists of three phases: HO preparation, HO execution, and HO
completion.
A UE measures the signal strength received from the neighboring HeNBs at the end of each
measurement interval. If the HO criterion is satisfied, the HO preparation phase will be initiated.
The source HeNB will send a HO Request to the target HeNB over the X2 interface. If the target
HeNB can admit this request, an acknowledgment with configuration information will be sent
back to the source HeNB over the X2 interface. The configuration information will be forwarded
to the UE via the air interface.
In the HO execution phase, the UE will detach from the source HeNB and synchronize to
the target HeNB. Meanwhile, the source HeNB will send a SN Status Transfer message to the
target HeNB conveying the bearer sequence number status and the data received from the EPC
will be forwarded to the target HeNB over the X2 interface.
After the synchronization is completed, in case that the mobility anchor point is located at the
HeNB GW, the target HeNB will send a Path Switch Request to the HeNB GW to switch the
data path and the HeNB GW will switch the data path from the source HeNB to the target HeNB
and respond with a Path Switch Request Ack to the target HeNB. After the data path is switched,
the HeNB GW will send an “end marker” along the old path. Upon receiving the Path Switch
Request Ack, the target HeNB will inform success of HO to the source HeNB and triggers the
release of radio and control-plane related resources associated to the UE context from the source
HeNB by sending a UE Context Release message to the source HeNB. The release of the data
forwarding resource at the source HeNB will be triggered after the “end marker” of the data
arrives. In case that the mobility anchor point is located at the MME, the Path Switch Request
will be forwarded to the MME and the MME will inform the corresponding S-GW to switch the
path. After the MME receives the response from the S-GW, the MME will send a Path Switch
Request Ack to the target HeNB, which is then followed by a similar resource release procedure.
This completes the HO procedure.
Note that a data forwarding mechanism is already proposed by 3GPP to forward the data from
the source HeNB to the target HeNB for lossless session mobility, however, this is only used
during the HO procedure. An example is shown in Fig.1 to indicate the data path switch after
each HO.

9
B. Traffic Forwarding with Cascading Path
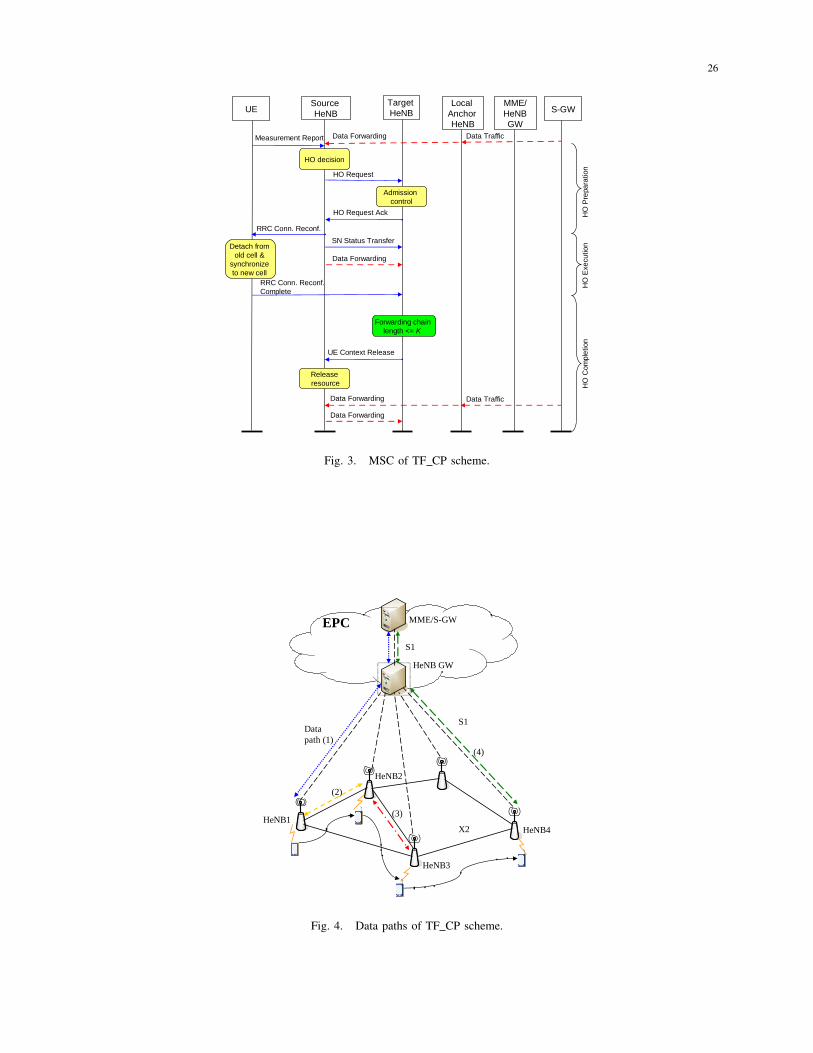
The MSC of this proposed scheme is shown in Fig.3.The target HeNB does not have to
send a Path Switch Request to the EPC each time a HO occurs. When an UE moves across
the boundary of the covering areas of two neighboring HeNBs, it disassociates with the source
HeNB and associates with the target HeNB. After the synchronization between the UE and the
target HeNB is completed, the target HeNB will not send the Path Switch Request to the EPC
as long as the length of the forwarding chain does not exceed a predefined threshold K. Note
that other criteria may be considered to determine whether or not to trigger traffic forwarding
such as the end-to-end latency. For simplicity, the forwarding chain length in terms of hops is
considered in this paper since this length is closely related to the end-to-end latency and total
resource required for local traffic forwarding. As in the original 3GPP handover procedure, the
target HeNB will send the UE Context Release message to the source HeNB to inform success
of HO and trigger radio and control-plane resource release. The resource for data forwarding at
the source HeNB will remain reserved for the UE since no “end marker” is recevied and the
data received from the EPC will be forwarded to the target HeNB along the forwarding chain.
If the threshold of the forwarding chain is exceeded, the normal data path switch operation
will be applied. The EPC will switch the data path from the head of the forwarding chain to the
target HeNB and send an “end marker” along the old path until the tail of the forwarding chain.
The resource for data forwarding on a forwarding node will be released after the “end marker”
is received. After the data path switch operation, the target HeNB becomes the new local traffic
anchor point, i.e. the head of a new forwarding chain if any. Fig.4 shows an example of the
data paths of the TF CP scheme during mobility, where the threshold of the forwarding chain
K = 2.
The target HeNB may have been already on the forwarding chain. To remove the loop, a
Forwarding List including all the node identities on the current forwarding chain and their
orders is included in the SN Status Transfer message and sent from the source HeNB to the
target HeNB during the HO execution phase. The target HeNB can check the forwarding chain
status for the UE. If the target HeNB finds that it has been already on the forwarding chain,
it will reset the forwarding chain length and send an “end maker” along the rest of the old
forwarding chain to release the resource for data forwarding. In case that the UE moves out

10
from a femtocell and moves into a macrocell, the HO signaling has to reach the MME and the
S-GW is the mobility anchor point. Therefore, the forwarding chain will be reset to zero and
the data path at the S-GW will be switched from the HeNB to the eNB.
For the proposed traffic forwarding scheme, the mobility is transparent to the EPC, i.e. the
EPC thinks that the head of the forwarding chain is the current serving cell for the UE. The
proposed scheme is also transparent to the UE. Therefore, the proposed scheme can be easily
fit into the current 3GPP scope, since no upgrade is required from the EPC side or the UE side.
Due to the self-deployment nature of the HeNBs, a HeNB may be switched off or failed when
it is on a forwarding chain. Therefore, a mechanism is needed to fast resume the sessions in this
case. In the TF CP scheme, the next HeNB on the forwarding chain will detect the failure of its
previous-hop neighbor (The implementation of the failure detection is left to the manufacturer
’s discretion.) and send a Path Switch Request message to the core network entity. The core
network entity will switch the data path to the next HeNB on the forwarding chain after the
failed one. The forwarding list after the recovery will be updated. During this process, the data
packets sent along the old path may be lost and the upper layer mechanisms will be responsible
for the packet loss recovery if needed.
C. Traffic Forwarding with Shortest Path
In the TF CP scheme, the forwarding chain is formed by simply cascading the HeNBs along
the trajectory of the UEs. In many cases, the UEs may move around the local anchor point in its
surrounding area resulting in the possibility of finding a shorter path compared to the original
forwarding chain. In the TF SP scheme, the HeNB will advertize its neighbor list within the
local network and thus, each HeNB will possess the network topology information and calculate
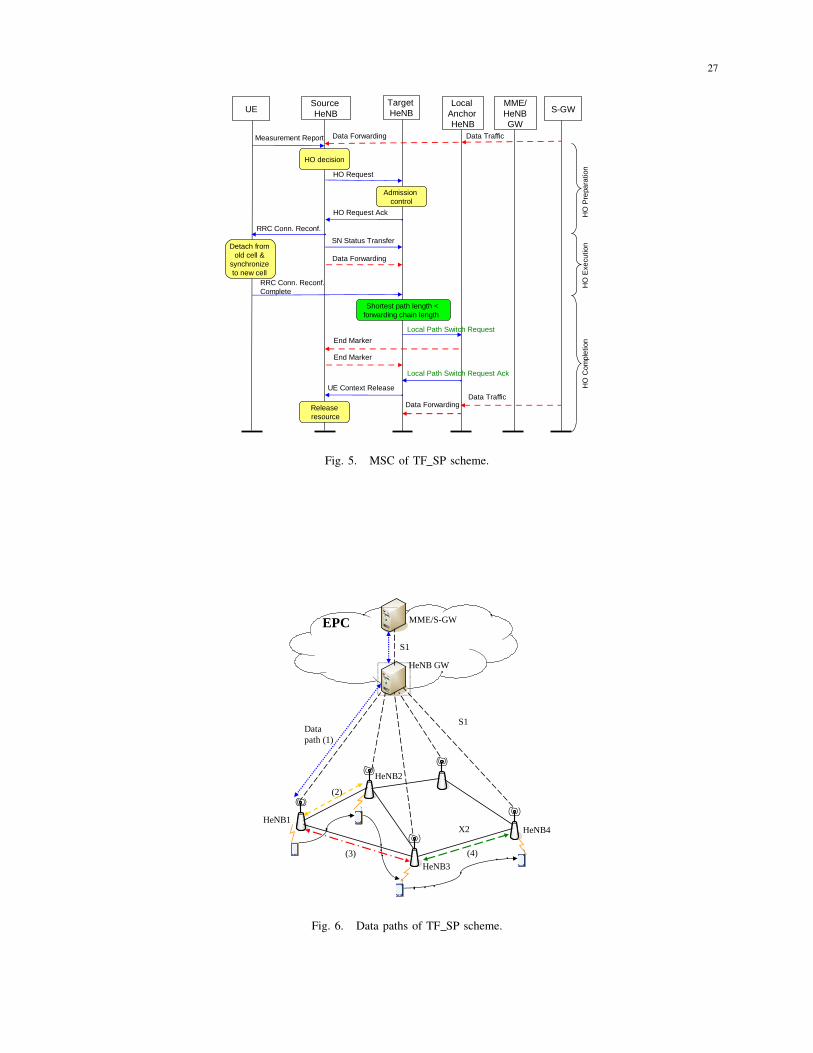
the per-pair shortest path in advance. In HO completion phase as shown in Fig.5,the target HeNB
will compare the forwarding list with the shortest path to the local anchor point. If the length of
the shortest path is less than the length of the forwarding chain, the target HeNB will initiate a
local path switch operation. A Local Path Switch Request will be sent to the local anchor point
along the shortest path. If the request is admitted, the local anchor point will respond with a
Local Path Switch Request Ack. During the message exchange process, the resource required on
the new path will be requested and allocated. The data path will be now along the shortest path
from the local anchor point to the target HeNB. An “end marker” will be send from the local
11
anchor point along the old forwarding chain to release the resource for data forwarding. And
during the local path switch process, the current forwarding chain will continue forwarding the
data to the target HeNB until the “end marker” is received, and thus, there is no data loss during
this process.
An example is shown in Fig.6 to illustrate the data path of the TF SP scheme, where a UE is
moving along the trajectory HeNB1 → HeNB2 → HeNB3 → HeNB4 and HeNB1 is the current
local traffic anchor point. In the TF CP scheme, a local path is formed following the trajectory
of the UE. For example, when the UE arrives at HeNB3, the end-to-end data path from the EPC
should be (1)+(2)+(3) as shown in Fig.4, thus resulting in a forwarding chain of length 2. On
the other hand, the TF SP scheme will implement a local path switch operation resulting in a
forwarding chain of length 1.
In case of a HeNB on the forwarding chain being switched off or failed, the next-hop HeNB on
the forwarding list can detect the failure of its neighbor and calculate a new shortest path to the
HeNB that is the previous-hop node of the failed one on the forwarding chain. A local recovery
mechanism is implemented by sending a Local Path Switch Request message to the precedent
HeNB of the failed one on the forwarding chain along the new shortest path. In addition, all the
neighbor HeNBs of the failed one will advertize the failure information within the local network
such that the corresponding affected per-pair shortest paths will be recalculated. The total length
of the forwarding chain after the local recovery may exceed the threshold. However, the current
serving HeNB, i.e. the tail of the forwarding chain, will initiate the local path switch or the core
path switch after the network topology and per-pair shortest paths are updated. The threshold is
allowed to be temporarily relaxed since the session continuity has the first priority.
V. ANALYTICAL MODEL
In this section, the performance of the TF SP scheme and the standard 3GPP scheme are
analyzed for a grid network topology. It is difficult to model the loop removal of the TF CP
scheme since it depends on the users’ trajectory history. Therefore, it will be studied in the next
section via simulations. However, the recovery mechanisms of both proposed schemes will be
analytically compared in this section. For clarification, Table I summarizes the parameters used
in this section.
12
A. Discrete-Time Markov Chain model
In the grid network topology considered in this paper as shown in Fig.7(a), each HeNB
has four neighbors and a UE can move randomly from the current cell to one of its four
neighbors with equal probability. The grid-like femtocell deployment has been widely used in
the femtocell-related performance analysis as suggested by 3GPP [25], which can be used to
model the office or terraced house environment. Let S(1)0 denote the local anchor point and
S(j)i (1 ≤ i ≤ K, 1 ≤ j ≤ 4i) represent the cell location at which the HeNB has the shortest path
of length i (ring i) towards the local anchor point, where K is the threshold of the forwarding
chain and j is the cell index at ring i. A location state aggregation method similar to [19] is
used here to model the UE mobility. The original cell location states that the UE can reach in
Fig.7(a) can be aggregated according to the grid symmetry as shown in figurename 7(b). When
a UE moves out of the coverage of the local anchor point S(1)0 , no matter the direction of the
UE movement, the forwarding chain will be increased by 1. Therefore, the states S(1)1 , S
(2)1 ,
S(3)1 , S(4)
1 can be aggregated to a single state S(1)1 . When i = 2, the states S
(1)2 , S(3)
2 , S(5)2 , S(7)
2
can be aggregated to a state S(1)2 since the UE at these states has 3/4 probability to increase its
forwarding chain and 1/4 probability to decrease it, while the states S(2)2 , S(4)
2 , S(6)2 S
(8)2 can be
aggregated to another state S(2)2 since the UE at these states has 1/2 probability to increase its
forwarding chain and 1/2 probability to decrease it. Similarly, when i = K, the 4K states can
be aggregated to the ⌈K+12
⌉ states, where ⌈x⌉ denotes the smallest integer not less than x.
The evolution of a UE’s activity is modeled as a stochastic process that occurs in a sequence
of discrete steps. The duration of a time slot is τ time unit. It is assumed that the UE state can
only change at the end of each time slot and only one change is allowed at a time. Clearly,
the system evolution can reflect the real-life characteristics when the time slot is sufficiently
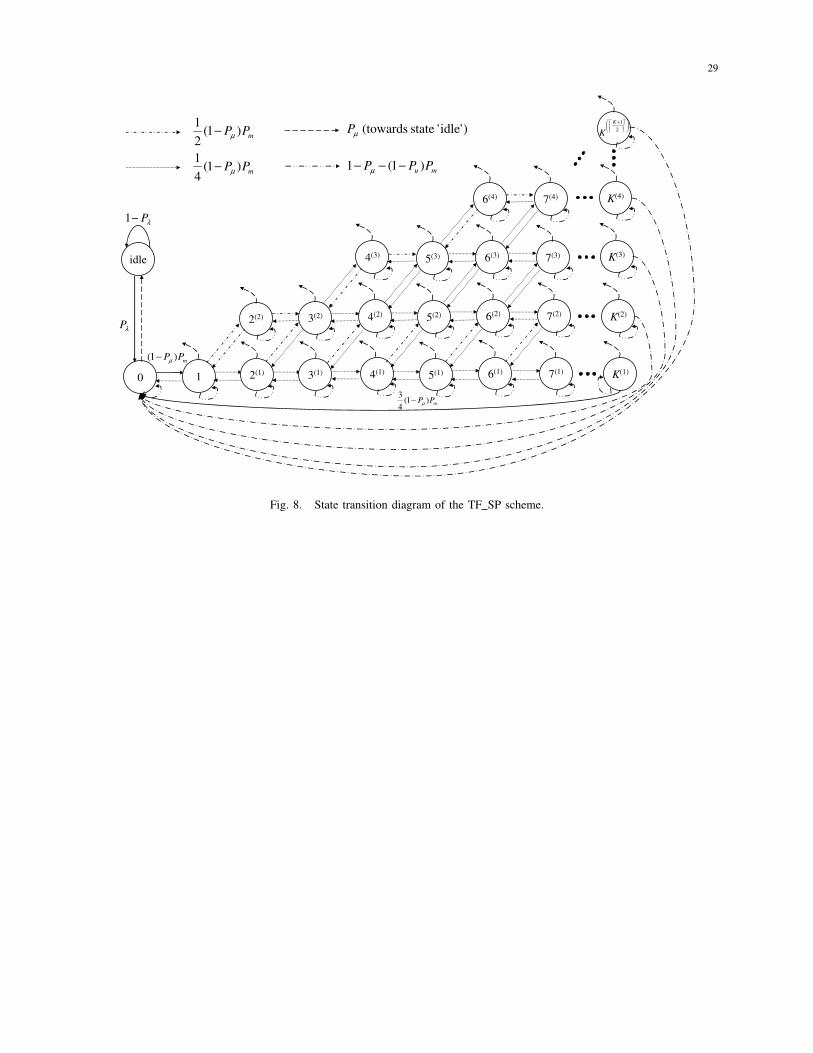
small. Based on this assumption, a Discrete-Time Markov Chain (DTMC) model is developed
to model the evolution of the UE state when the traffic forwarding scheme is used, as shown
in Fig.8.The state Sidle denotes the state at which a UE has no ongoing sessions. The state
S(j)i (0 ≤ i ≤ K, 1 ≤ j ≤ ⌈ i+1
2⌉) represents the aggregated state at which a UE with ongoing
sessions has a forwarding chain of length i. When a UE is at the state Sidle, the probability of
a session arriving (incoming or outgoing) during a time slot τ is Pλ. Thus, the current HeNB
becomes the local anchor point and the UE moves to the state S(1)0 with this probability and
13
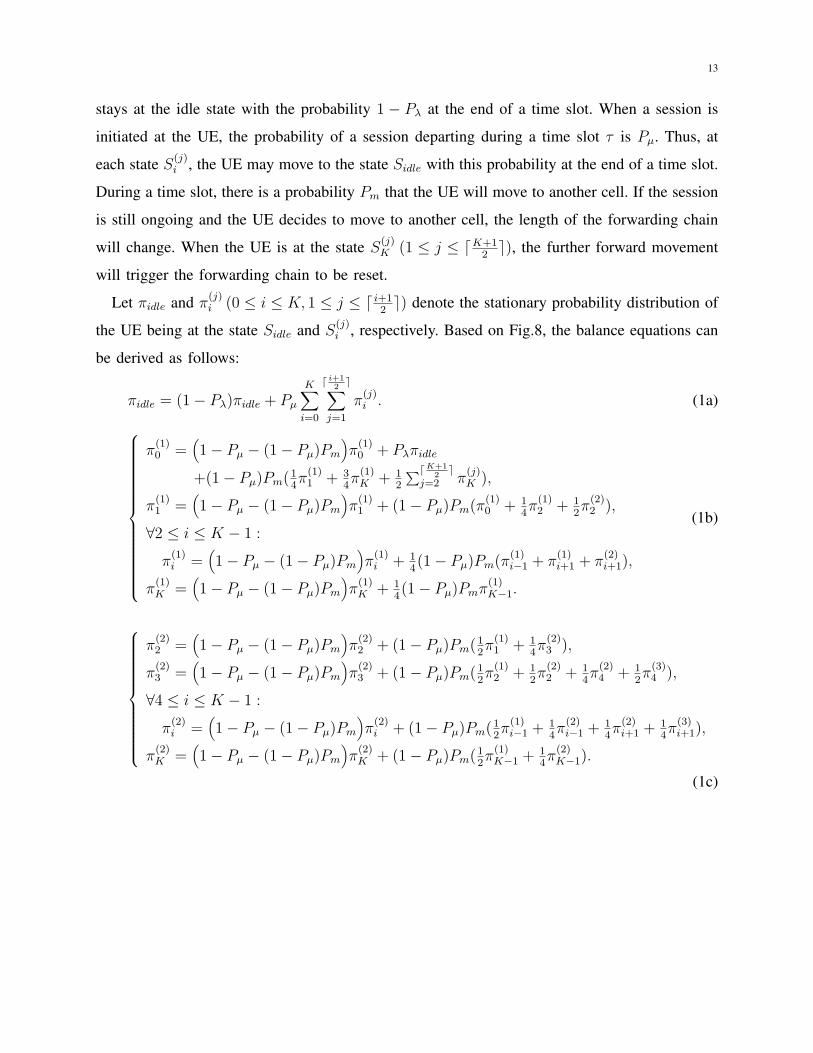
stays at the idle state with the probability 1 − Pλ at the end of a time slot. When a session is
initiated at the UE, the probability of a session departing during a time slot τ is Pµ. Thus, at
each state S(j)i , the UE may move to the state Sidle with this probability at the end of a time slot.
During a time slot, there is a probability Pm that the UE will move to another cell. If the session
is still ongoing and the UE decides to move to another cell, the length of the forwarding chain
will change. When the UE is at the state S(j)K (1 ≤ j ≤ ⌈K+1
2⌉), the further forward movement
will trigger the forwarding chain to be reset.
Let πidle and π(j)i (0 ≤ i ≤ K, 1 ≤ j ≤ ⌈ i+1
2⌉) denote the stationary probability distribution of
the UE being at the state Sidle and S(j)i , respectively. Based on Fig.8, the balance equations can
be derived as follows:
πidle = (1− Pλ)πidle + Pµ
K∑i=0
⌈ i+12
⌉∑j=1
π(j)i . (1a)
π(1)0 =
(1− Pµ − (1− Pµ)Pm
)π(1)0 + Pλπidle
+(1− Pµ)Pm(14π(1)1 + 3
4π(1)K + 1
2
∑⌈K+12
⌉j=2 π
(j)K ),
π(1)1 =
(1− Pµ − (1− Pµ)Pm
)π(1)1 + (1− Pµ)Pm(π
(1)0 + 1
4π(1)2 + 1
2π(2)2 ),
∀2 ≤ i ≤ K − 1 :
π(1)i =
(1− Pµ − (1− Pµ)Pm
)π(1)i + 1
4(1− Pµ)Pm(π
(1)i−1 + π
(1)i+1 + π
(2)i+1),
π(1)K =
(1− Pµ − (1− Pµ)Pm
)π(1)K + 1
4(1− Pµ)Pmπ
(1)K−1.
(1b)
π(2)2 =
(1− Pµ − (1− Pµ)Pm
)π(2)2 + (1− Pµ)Pm(
12π(1)1 + 1
4π(2)3 ),
π(2)3 =
(1− Pµ − (1− Pµ)Pm
)π(2)3 + (1− Pµ)Pm(
12π(1)2 + 1
2π(2)2 + 1
4π(2)4 + 1
2π(3)4 ),
∀4 ≤ i ≤ K − 1 :
π(2)i =
(1− Pµ − (1− Pµ)Pm
)π(2)i + (1− Pµ)Pm(
12π(1)i−1 +
14π(2)i−1 +
14π(2)i+1 +
14π(3)i+1),
π(2)K =
(1− Pµ − (1− Pµ)Pm
)π(2)K + (1− Pµ)Pm(
12π(1)K−1 +
14π(2)K−1).
(1c)

14
∀4 ≤ i ≤ K − 1 and i is even :
π(⌈ i+1
2⌉)
i =(1− Pµ − (1− Pµ)Pm
)π(⌈ i+1
2⌉)
i + 14(1− Pµ)Pm(π
(⌈ i+12
⌉−1)
i−1 + π(⌈ i+1
2⌉)
i+1 ),
∀4 ≤ i ≤ K − 1 and i is odd :
π(⌈ i+1
2⌉)
i =(1− Pµ − (1− Pµ)Pm
)π(⌈ i+1
2⌉)
i
+(1− Pµ)Pm(14π(⌈ i+1
2⌉−1)
i−1 + 12π(⌈ i+1
2⌉)
i−1 + 14π(⌈ i+1
2⌉)
i+1 + 12π(⌈ i+1
2⌉+1)
i+1 ),
∀4 ≤ i ≤ K − 3 and ∀3 ≤ j ≤ ⌈ i+12⌉ :
π(j)i+2 =
(1− Pµ − (1− Pµ)Pm
)π(j)i+2
+14(1− Pµ)Pm(π
(j−1)i+1 + π
(j)i+1 + π
(j)i+3 + π
(j+1)i+3 ),
∀3 ≤ j ≤ ⌈K+12
⌉ − 1 :
π(j)K =
(1− Pµ − (1− Pµ)Pm
)π(j)K + 1
4(1− Pµ)Pm(π
(j−1)K−1 + π
(j)K−1).
(1d)
If K is even :
π(⌈K+1
2⌉)
K =(1− Pµ − (1− Pµ)Pm
)π(⌈K+1
2⌉)
K + 14(1− Pµ)Pmπ
(⌈K+12
⌉−1)
K−1 ,
If K is odd :
π(⌈K+1
2⌉)
K =(1− Pµ − (1− Pµ)Pm
)π(⌈K+1
2⌉)
K
+(1− Pµ)Pm(14π(⌈K+1
2⌉−1)
K−1 + 12π(⌈K+1
2⌉)
K−1 ).
(1e)
πidle +K∑i=0
⌈ i+12
⌉∑j=1
π(j)i = 1. (1f)
By solving (1a) - (1f), the stationary probability distributions can be derived. In the following,
we derive the parameters used in the Markov chain model: the probability of a session arriving,
the probability of a session departing, and the probability of a UE moving to another cell during
a time slot τ . Assuming that the sessions arrive as a Poisson process with rate λ, the duration
of a session has an exponential distribution with mean 1/µ, and the cell residence time also has
an exponential distribution with mean 1/m (m is also called mobility rate), we obtain:
Pλ = λτ,
Pµ = µτ,
Pm = mτ.
(2)
15
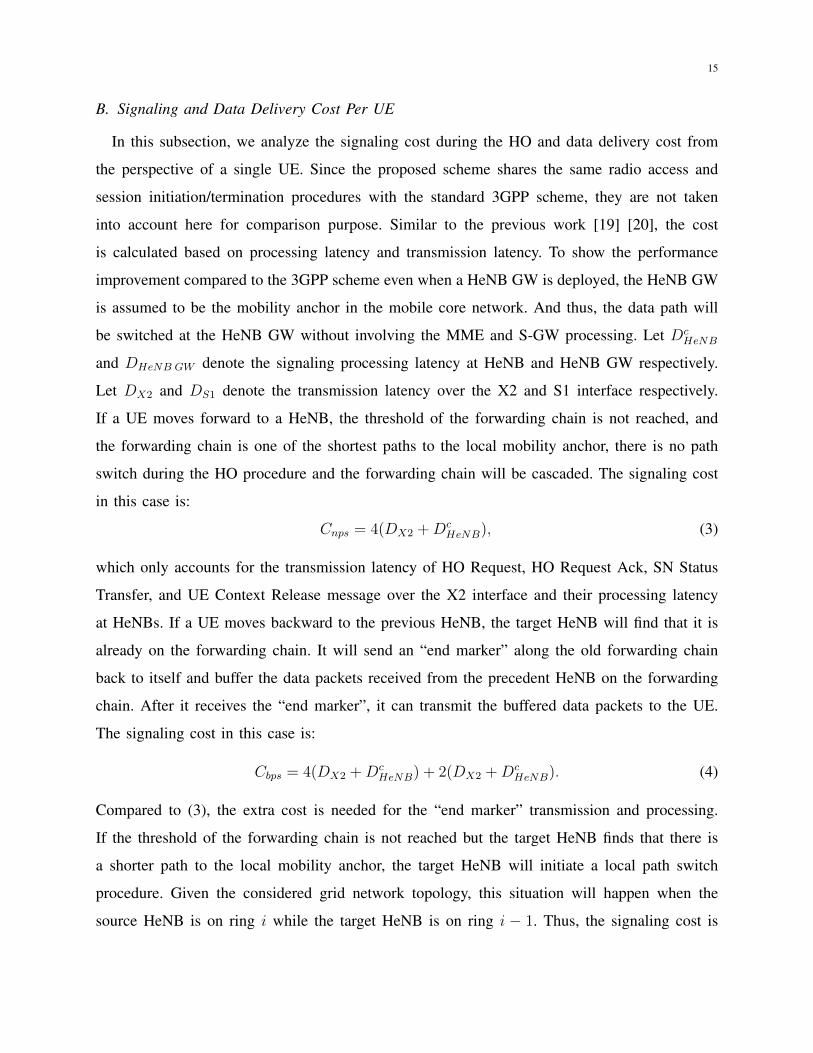
B. Signaling and Data Delivery Cost Per UE
In this subsection, we analyze the signaling cost during the HO and data delivery cost from
the perspective of a single UE. Since the proposed scheme shares the same radio access and
session initiation/termination procedures with the standard 3GPP scheme, they are not taken
into account here for comparison purpose. Similar to the previous work [19] [20], the cost
is calculated based on processing latency and transmission latency. To show the performance
improvement compared to the 3GPP scheme even when a HeNB GW is deployed, the HeNB GW
is assumed to be the mobility anchor in the mobile core network. And thus, the data path will
be switched at the HeNB GW without involving the MME and S-GW processing. Let DcHeNB
and DHeNB GW denote the signaling processing latency at HeNB and HeNB GW respectively.
Let DX2 and DS1 denote the transmission latency over the X2 and S1 interface respectively.
If a UE moves forward to a HeNB, the threshold of the forwarding chain is not reached, and
the forwarding chain is one of the shortest paths to the local mobility anchor, there is no path
switch during the HO procedure and the forwarding chain will be cascaded. The signaling cost
in this case is:
Cnps = 4(DX2 +DcHeNB), (3)
which only accounts for the transmission latency of HO Request, HO Request Ack, SN Status
Transfer, and UE Context Release message over the X2 interface and their processing latency
at HeNBs. If a UE moves backward to the previous HeNB, the target HeNB will find that it is
already on the forwarding chain. It will send an “end marker” along the old forwarding chain
back to itself and buffer the data packets received from the precedent HeNB on the forwarding
chain. After it receives the “end marker”, it can transmit the buffered data packets to the UE.
The signaling cost in this case is:
Cbps = 4(DX2 +DcHeNB) + 2(DX2 +Dc
HeNB). (4)
Compared to (3), the extra cost is needed for the “end marker” transmission and processing.
If the threshold of the forwarding chain is not reached but the target HeNB finds that there is
a shorter path to the local mobility anchor, the target HeNB will initiate a local path switch
procedure. Given the considered grid network topology, this situation will happen when the
source HeNB is on ring i while the target HeNB is on ring i − 1. Thus, the signaling cost is
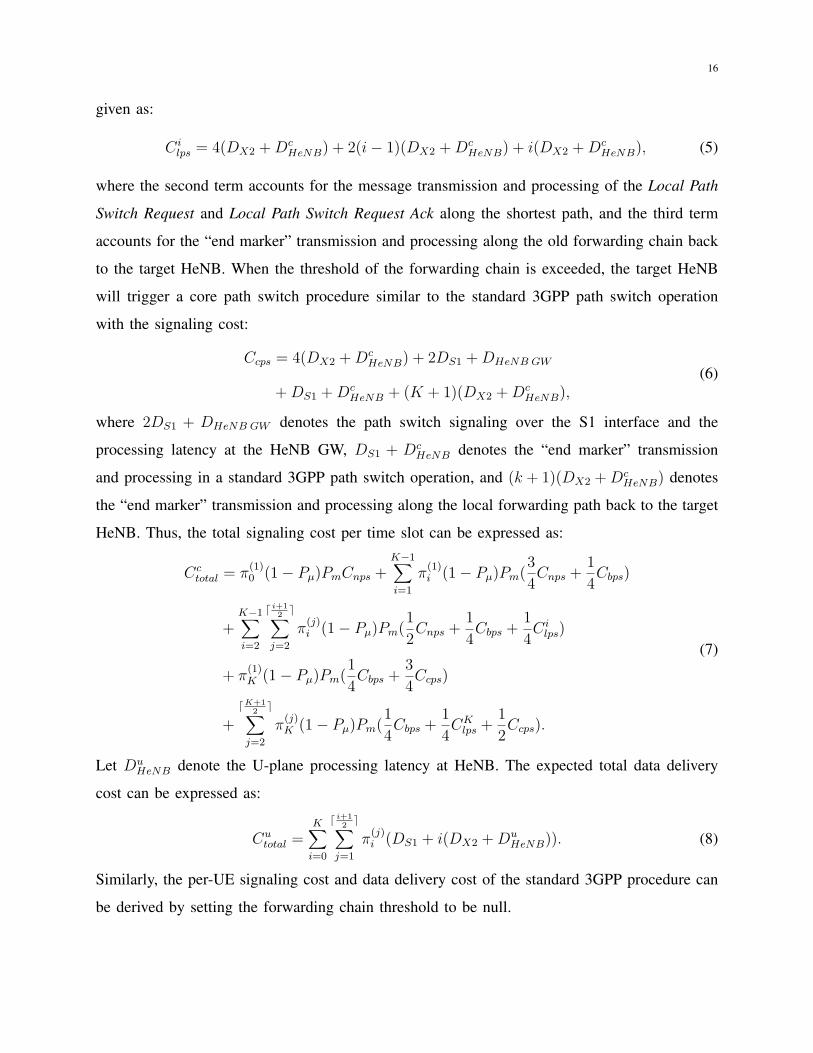
16
given as:
Cilps = 4(DX2 +Dc
HeNB) + 2(i− 1)(DX2 +DcHeNB) + i(DX2 +Dc
HeNB), (5)
where the second term accounts for the message transmission and processing of the Local Path
Switch Request and Local Path Switch Request Ack along the shortest path, and the third term
accounts for the “end marker” transmission and processing along the old forwarding chain back
to the target HeNB. When the threshold of the forwarding chain is exceeded, the target HeNB
will trigger a core path switch procedure similar to the standard 3GPP path switch operation
with the signaling cost:
Ccps = 4(DX2 +DcHeNB) + 2DS1 +DHeNB GW
+DS1 +DcHeNB + (K + 1)(DX2 +Dc
HeNB),(6)
where 2DS1 + DHeNB GW denotes the path switch signaling over the S1 interface and the
processing latency at the HeNB GW, DS1 + DcHeNB denotes the “end marker” transmission
and processing in a standard 3GPP path switch operation, and (k + 1)(DX2 +DcHeNB) denotes
the “end marker” transmission and processing along the local forwarding path back to the target
HeNB. Thus, the total signaling cost per time slot can be expressed as:
Cctotal = π
(1)0 (1− Pµ)PmCnps +
K−1∑i=1
π(1)i (1− Pµ)Pm(
3
4Cnps +
1
4Cbps)
+K−1∑i=2
⌈ i+12
⌉∑j=2
π(j)i (1− Pµ)Pm(
1
2Cnps +
1
4Cbps +
1
4Ci
lps)
+ π(1)K (1− Pµ)Pm(
1
4Cbps +
3
4Ccps)
+
⌈K+12
⌉∑j=2
π(j)K (1− Pµ)Pm(
1
4Cbps +
1
4CK
lps +1
2Ccps).
(7)
Let DuHeNB denote the U-plane processing latency at HeNB. The expected total data delivery
cost can be expressed as:
Cutotal =
K∑i=0
⌈ i+12
⌉∑j=1
π(j)i (DS1 + i(DX2 +Du
HeNB)). (8)
Similarly, the per-UE signaling cost and data delivery cost of the standard 3GPP procedure can
be derived by setting the forwarding chain threshold to be null.
17
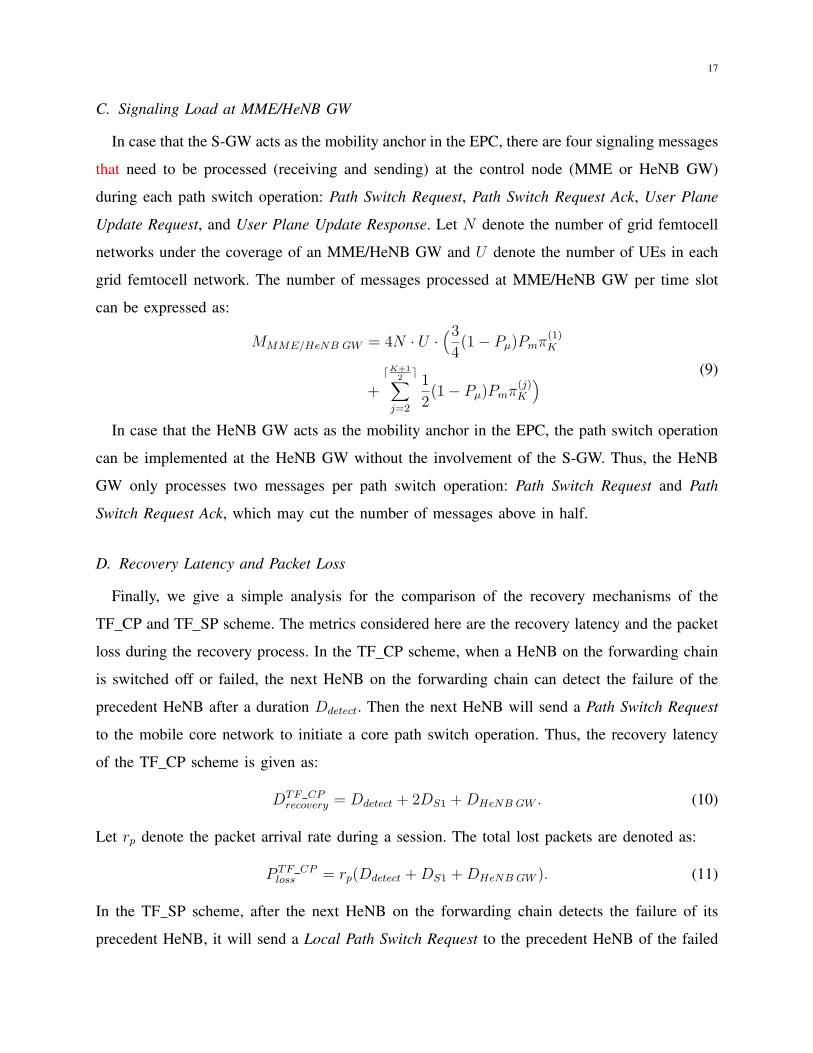
C. Signaling Load at MME/HeNB GW
In case that the S-GW acts as the mobility anchor in the EPC, there are four signaling messages
that need to be processed (receiving and sending) at the control node (MME or HeNB GW)
during each path switch operation: Path Switch Request, Path Switch Request Ack, User Plane
Update Request, and User Plane Update Response. Let N denote the number of grid femtocell
networks under the coverage of an MME/HeNB GW and U denote the number of UEs in each
grid femtocell network. The number of messages processed at MME/HeNB GW per time slot
can be expressed as:
MMME/HeNB GW = 4N · U ·(34(1− Pµ)Pmπ
(1)K
+
⌈K+12
⌉∑j=2
1
2(1− Pµ)Pmπ
(j)K
) (9)
In case that the HeNB GW acts as the mobility anchor in the EPC, the path switch operation
can be implemented at the HeNB GW without the involvement of the S-GW. Thus, the HeNB
GW only processes two messages per path switch operation: Path Switch Request and Path
Switch Request Ack, which may cut the number of messages above in half.
D. Recovery Latency and Packet Loss
Finally, we give a simple analysis for the comparison of the recovery mechanisms of the
TF CP and TF SP scheme. The metrics considered here are the recovery latency and the packet
loss during the recovery process. In the TF CP scheme, when a HeNB on the forwarding chain
is switched off or failed, the next HeNB on the forwarding chain can detect the failure of the
precedent HeNB after a duration Ddetect. Then the next HeNB will send a Path Switch Request
to the mobile core network to initiate a core path switch operation. Thus, the recovery latency
of the TF CP scheme is given as:
DTF CPrecovery = Ddetect + 2DS1 +DHeNB GW . (10)
Let rp denote the packet arrival rate during a session. The total lost packets are denoted as:
P TF CPloss = rp(Ddetect +DS1 +DHeNB GW ). (11)
In the TF SP scheme, after the next HeNB on the forwarding chain detects the failure of its
precedent HeNB, it will send a Local Path Switch Request to the precedent HeNB of the failed

18
one on the forwarding chain. Considering S(1)1 in Fig.6 as the failed HeNB and S
(1)0 as the
precedent HeNB of the failed one, the forwarding chain section starting from S(1)0 can be either
{S(1)0 , S
(1)1 , S
(1)2 } or {S(1)
0 , S(1)1 , S
(2)2 } the recovery latency can be expressed as:
DTF SPrecovery = Ddetect +
π(1)2
π(1)2 + π
(2)2
8(DX2 +DcHeNB)
+π(2)2
π(1)2 + π
(2)2
4(DX2 +DcHeNB).
(12)
In case that a buffering mechanism is used at the precedent HeNB of the failed one, i.e.
unsuccessfully transmitted packets will be buffered for certain period, the packet loss can be
ignorable. Otherwise, it can be denoted as:
P TF SPloss = rp(Ddetect +
π(1)2
π(1)2 + π
(2)2
4(DX2 +DcHeNB)
+π(2)2
π(1)2 + π
(2)2
2(DX2 +DcHeNB)).
(13)
Note that the buffering mechanism cannot be applied to the TF CP scheme using core recovery.
After a forwarding HeNB fails, the packets that have been sent out from the S-GW before the
recovery request is received will be dropped.
VI. PERFORMANCE EVALUATION
In this section, we evaluate the performance of the proposed schemes and the 3GPP scheme
via the analytical models and discrete-event simulations. To achieve the statistical validity, the
simulation for each scenario is run for 5 million events. The default parameter setting used in
the evaluation is listed in Table II.In the following, we may vary the values of some parameters
to show their impacts on the performance. The 3GPP related parameter values are based on [26].
A. Signaling and Data Delivery Cost Per UE
We first evaluate the signaling cost during HO and the data delivery cost in terms of the
transmission and processing latency of the messages from the perspective of a single UE. In
order to validate the analytical models and show the impact of the long forwarding chain, the
size of the local grid femtocell network is assumed to be sufficiently large in the simulation. The
Internet backhaul plays an important role in differentiating the femtocells from the traditional
19
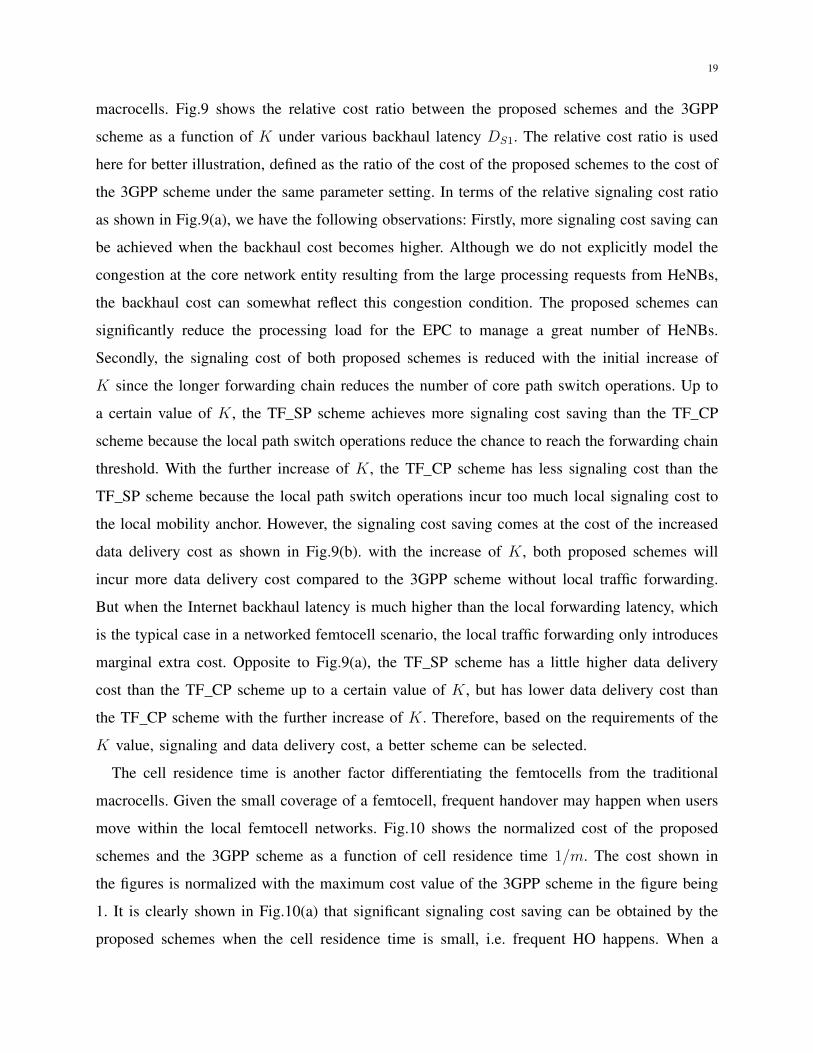
macrocells. Fig.9 shows the relative cost ratio between the proposed schemes and the 3GPP
scheme as a function of K under various backhaul latency DS1. The relative cost ratio is used
here for better illustration, defined as the ratio of the cost of the proposed schemes to the cost of
the 3GPP scheme under the same parameter setting. In terms of the relative signaling cost ratio
as shown in Fig.9(a), we have the following observations: Firstly, more signaling cost saving can
be achieved when the backhaul cost becomes higher. Although we do not explicitly model the
congestion at the core network entity resulting from the large processing requests from HeNBs,
the backhaul cost can somewhat reflect this congestion condition. The proposed schemes can
significantly reduce the processing load for the EPC to manage a great number of HeNBs.
Secondly, the signaling cost of both proposed schemes is reduced with the initial increase of
K since the longer forwarding chain reduces the number of core path switch operations. Up to
a certain value of K, the TF SP scheme achieves more signaling cost saving than the TF CP
scheme because the local path switch operations reduce the chance to reach the forwarding chain
threshold. With the further increase of K, the TF CP scheme has less signaling cost than the
TF SP scheme because the local path switch operations incur too much local signaling cost to
the local mobility anchor. However, the signaling cost saving comes at the cost of the increased
data delivery cost as shown in Fig.9(b). with the increase of K, both proposed schemes will
incur more data delivery cost compared to the 3GPP scheme without local traffic forwarding.
But when the Internet backhaul latency is much higher than the local forwarding latency, which
is the typical case in a networked femtocell scenario, the local traffic forwarding only introduces
marginal extra cost. Opposite to Fig.9(a), the TF SP scheme has a little higher data delivery
cost than the TF CP scheme up to a certain value of K, but has lower data delivery cost than
the TF CP scheme with the further increase of K. Therefore, based on the requirements of the
K value, signaling and data delivery cost, a better scheme can be selected.
The cell residence time is another factor differentiating the femtocells from the traditional
macrocells. Given the small coverage of a femtocell, frequent handover may happen when users
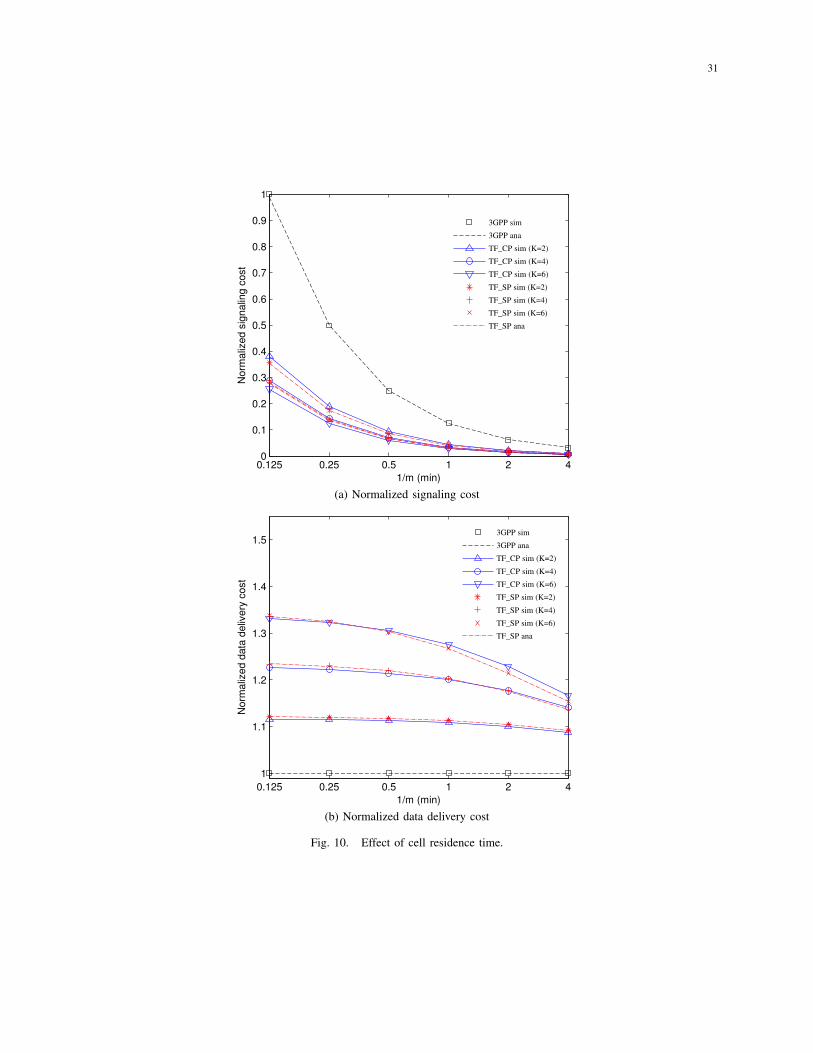
move within the local femtocell networks. Fig.10 shows the normalized cost of the proposed
schemes and the 3GPP scheme as a function of cell residence time 1/m. The cost shown in
the figures is normalized with the maximum cost value of the 3GPP scheme in the figure being
1. It is clearly shown in Fig.10(a) that significant signaling cost saving can be obtained by the
proposed schemes when the cell residence time is small, i.e. frequent HO happens. When a

20
user stays connected with a HeNB for a relatively long period, the signaling cost generated by
the 3GPP scheme is not that significant. In addition, a long forwarding chain will be preferred
under high mobility to reduce the signaling cost. Fig.10(b) shows that the data delivery cost
of the proposed schemes will reduce with the increase of the cell residence time since a UE
will traverse less HeNBs during its communication session. The data delivery cost of the 3GPP
scheme is independent of the cell residence time as the core path will be switched at each HO.
The impact of the session duration on the normalized cost is shown in Fig.11. The session
duration will not affect the signaling cost and the data delivery cost of the 3GPP scheme. When
the session duration is sufficiently short, the proposed schemes with different forwarding chain
thresholds achieve a similar performance for both costs. Because a communication session will be
likely to end before a core path switch operation is triggered. As the session duration increases,
both the signaling cost and the data delivery cost of the proposed schemes will increase. And the
schemes with a higher threshold of the forwarding chain will have less signaling cost but more
data delivery cost. For all the above analytical results,it is clearly shown that they closely match
the simulation results. Therefore, the proposed analytical models accurately capture the behaviors
of the studied schemes and can be used to derive the optimal threshold of the forwarding chain
for minimizing the handover cost based on the specific requirements and environments.
B. Signaling Load at EPC
The impact of the signaling load on the EPC is evaluated in this subsection in terms of the
number of messages processed at the MME/HeNB GW. We consider the case that the S-GW is
used as the mobility anchor point in the EPC during the HO process. While the analytical model
provides accurate results under the assumption that the local grid femtocell network is sufficiently
large, it may not fully reflect the characteristics in real world where a local grid femtocell network
has a limited scale. Thus, we focus on the simulation results in this subsection. We consider that
500 grid femtocell networks are deployed under the coverage area of an MME/HeNB GW and
each one is a 5×5 grid consisting of 25 femtocells. In each grid network, 50 UEs are randomly
deployed and they move randomly within the local network from the current cell to one of its
neighbors with equal probability.
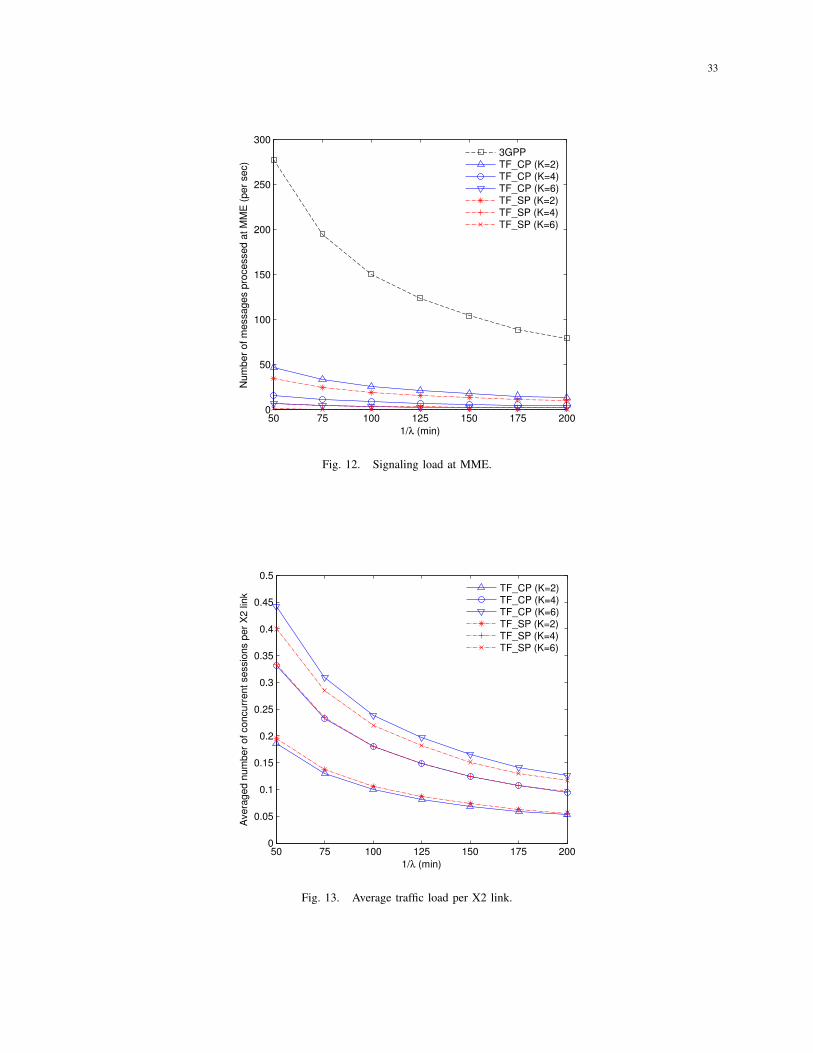
Fig.12 shows the number of signaling messages processed at the MME (HeNB GW) per
second with respect to the inter-session arrival interval 1/λ. Other simulation parameter values

21
are the same as in Table II. It is shown that both the TF CP scheme and the TF SP scheme
can significantly reduce the number of signaling messages need to be processed at the MME
even when the allowed maximum length of the forwarding chain is only 2 hops. The longer the
forwarding chain is allowed to become, the more signaling overhead can be saved at the MME.
More saving can be achieved by the TF SP scheme compared to the TF CP scheme since the
local path optimization can reduce the chance that the forwarding chain reaches its threshold.
C. Data Traffic Load of Local X2 Links
The reduction of the signaling load at the EPC may come at the cost of the increased data
traffic load/utilized bandwidth of the local X2 links. In this subsection, we evaluate the impact
of the forwarding chain on the local traffic load in terms of the number of concurrent sessions
on an X2 link via simulations. For comparison purpose, the same simulation environment as the
previous subsection is used. Fig.13 shows the average number of concurrent sessions per X2 link
over all the X2 links and over the whole simulation time in a local femtocell network. Clearly,
the average traffic load per X2 link is increased as the user sessions arrive more frequently.
However, it is still reasonably low even when the inter-session arrival interval per UE is only
50 minutes relative to the transport capacity of the local links.
In addition to the average traffic load conditions, a more important metric is the instantaneous
traffic load distribution in the local network during the entire time duration, which can reflect
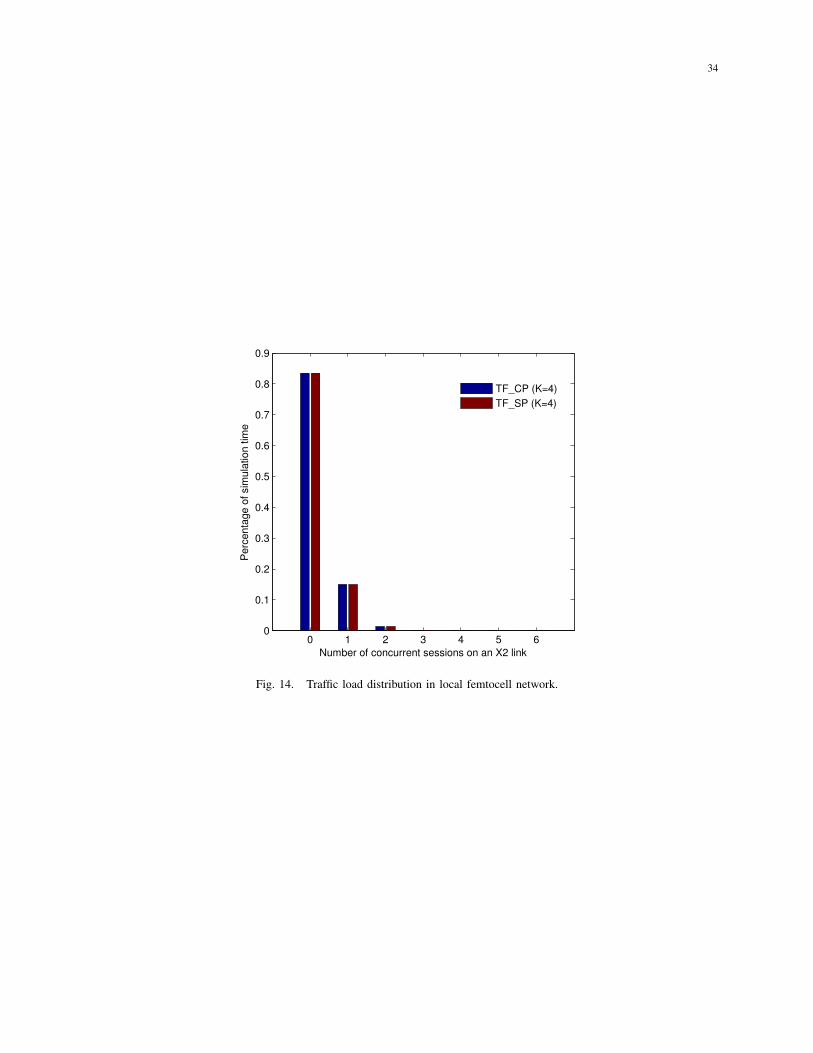
the traffic load on an X2 link in the worst case. Fig.14 shows the percentage of the time over the
whole simulation time that a certain number of concurrent sessions resides on a single X2 link
over all the X2 links when the threshold of the forwarding chain K = 4 and the inter-session
arrival interval 1/λ = 100 minutes. It can be found that the number of concurrent sessions
traversing an X2 link is limited to two most of the simulation time. The percentage of time
that an X2 link needs to carry 5 concurrent sessions is only 1.1e-06 for the TF CP scheme and
1.6e-06 for the TF SP scheme. And no X2 link needs to carry 6 or more concurrent sessions
at any time instant. This implies that the traffic load incurred by the forwarding chain can be
efficiently distributed over the local network. The bottleneck effect on an X2 link is negligible.

22
D. Recovery Latency and Packet Loss
For the failure detection time and packet arrival rate given in Table II, the average recovery
latency and lost packets during the recovery process of the proposed schemes are calculated and
listed in Table III. Given the low recovery latency as shown in this Table, a small buffer at a
HeNB will be enough to completely eliminate the packet loss for the TF SP scheme. For the
purpose of comparing the two proposed schemes, we consider the case that there is no buffering
mechanism used at the HeNBs in the TF SP scheme, which reflects a worst case scenario. It is
shown that the TF SP scheme using local recovery has less recovery latency and lost packets
than the TF CP scheme using core recovery. And both schemes can recover the communication
session within a short period and only incur limited packet loss. Therefore, the proposed schemes
are suitable for the self-deployed femtocells.
VII. CONCLUSION
Given the small coverage, massive deployment, long Internet backhaul of femtocells, mobility
management in femtocells faces new challenges. In this paper, we propose two local mobility
management schemes based on X2 traffic forwarding for networked femtocells to reduce the
inter-femto handover cost. Instead of implementing the path switch operation at the EPC for each
handover, a local traffic forwarding chain is constructed to reuse the old Internet backhaul path.
Analytical and simulation studies show that remarkable signaling cost saving can be achieved
per UE compared to the standard 3GPP scheme, especially when the core path switch cost and
the mobility rates are high. In particular, the TF SP scheme has less signaling cost and a little
more data delivery cost than the TF CP scheme when the threshold of the forwarding chain is
small while it has more signaling cost and less data delivery cost when the threshold is large.
Based on the specific session and cost requirements, mobility pattern and topology availability,
an appropriate threshold and traffic forwarding scheme can be selected. Simulation results also
show that the processing load in terms of the number of signaling messages processed at the EPC
can be significantly reduced while the local traffic load is relatively moderate and well distributed
over the local networks. In addition, both schemes can recover the communication session within
a short period and only incur limited packet loss in case that a HeNB on the forwarding chain
is switched off or failed. As a final remark, the proposed schemes are transparent to the EPC
and the UEs and no upgrade is required from either side. The modifications are only needed for
23
the femto base stations. Given the deployment of the femtocells is still at the early stage and
the standardization activities are ongoing, the proposed schemes can be easily incorporated into
the current standard.
ACKNOWLEDGMENT
This work has been performed in the framework of the ICT project ICT-4-248523 BeFEMTO,
which is partly funded by the European Union. The authors would like to acknowledge the
contributions of their colleagues from the BeFEMTO consortium.
REFERENCES
[1] Evolved Universal Terrestrial Radio Access (E-UTRA) and Evolved Universal Terrestrial Radio Access Network (E-
UTRAN); Overall description; Stage 2 (Release 11), 3GPP Std. TS 36.300 v11.1.0, Mar. 2012.
[2] IEEE 802.16m Draft Amendment to IEEE Standard for Local and Metropolitan Area Networks, IEEE Std. 802.16m/D11,
Jan. 2011.
[3] J.-G. A. V. Chandrasekhar and A. Gatherer, “Femtocell networks: a survey,” IEEE Commun. Mag., vol. 46, no. 9, pp.
59–67, 2008.
[4] Femto Forum. [Online]. Available: http://www.femtoforum.org/
[5] A. Quddus, T. Guo, M. Shariat, B. Hunt, A. Imran, Y. Ko, and R. Tafazolli, “Next generation femtocells: an enabler
for high efficiency multimedia transmission,” IEEE ComSoc, Multimedia Communications TC, E-Letter, vol. 5, no. 5, pp.
27–31, 2010.
[6] ICT-BeFEMTO Project. [Online]. Available: http://www.ict-befemto.eu
[7] V. Chandrasekhar and J. G. Andrews, “Uplink capacity and interference avoidance for two-tier cellular networks,” in Proc.
IEEE Global Commun. (GLOBECOM), Washington, DC, USA, 2007.
[8] L. T. W. Ho and H. Claussen, “Effects of user-deployed, co-channel femtocells on the call drop probability in a residential
scenario,” in Proc. IEEE Indoor and Mobile Radio Commun. (PIMRC), Athens, Greece, 2007.
[9] S. Wu, X. Zhang, R. Zheng, Z. Yin, Y. Fang, and D. Yang, “Handover study concerning mobility in the two-hierarchy
network,” in Proc. IEEE Veh. Tech. Conf. (VTC-Spring), Barcelona, Spain, 2009.
[10] J.-M. Moon and D.-H. Cho, “Efficient handoff algorithm for inbound mobility in hierarchical macro/femto cell networks,”
IEEE Commun. Letters, vol. 13, no. 10, pp. 755–757, 2009.
[11] H.-Y. Lee and Y.-B. Lin, “A cache scheme for femtocell reselection,” IEEE Commun. Letters, vol. 14, no. 1, pp. 27–29,
2010.
[12] L. Wang, Y. Zhang, and Z. Wei, “Mobility management schemes at radio network layer for LTE femtocells,” in Proc.
IEEE Veh. Tech. Conf. (VTC-Spring), Barcelona, Spain, 2009.
[13] F. A. Zdarsky, A. Maeder, and S. Schmid, “Localization of data and control plane traffic in enterprise femtocell networks,”
in Proc. IEEE Veh. Tech. Conf. (VTC-Spring) BeFEMTO Workshop, Budapest, Hungary, 2011.
[14] ICT-BeFEMTO Deliverable D5.1: Femtocell Access Control, Networking, Mobility, and Management Concepts, Dec.
2010. [Online]. Available: http://www.ict-befemto.eu/publications/deliverables.html

24
[15] Y.-B. Lin, C.-H. Gan, and C.-F. Liang, “Reducing call routing cost for femtocells,” IEEE Trans. Wireless Commun., vol. 9,
no. 7, pp. 2302–2309, 2010.
[16] S.-N. Wang, P. Lin, C.-H. Gan, and H.-L. Fu, “A study for location update cost in a femtocell network,” in Proc. IEEE
Veh. Tech. Conf. (VTC-Fall), Ottawa, Canada, 2010.
[17] R. Jain and Y.-B. Lin, “An auxiliary user location strategy employing forwarding pointers to reduce network impacts of
PCS,” Wirel. Netw., vol. 1, no. 2, pp. 197–210, 1995.
[18] W. Ma and Y. Fang, “Dynamic hierarchical mobility management strategy for mobile IP networks,” IEEE J. Sel. Areas
Commun., vol. 22, no. 4, pp. 664–676, 2004.
[19] R. Langar, N. Bouabdallah, and R. Boutaba, “A comprehensive analysis of mobility management in MPLS-based wireless
access networks,” IEEE/ACM Trans. Netw., vol. 16, no. 4, pp. 918–931, 2008.
[20] Y. Li and I.-R. Chen, “Design and performance analysis of mobility management schemes based on pointer forwarding
for wireless mesh networks,” IEEE Trans. Mobile Comput., vol. 10, no. 3, pp. 349–361, 2011.
[21] D. Johnson, C. Perkins, and J. Arkko, Mobility Support in IPv6, IETF Std. RFC 3775, Jun. 2004.
[22] HNB and HeNB Mobility Enhancements, 3GPP Work Item Description, RP-110183, to be completed by Dec. 2012.
[23] S. Rangan and R. Madan, “Belief propagation methods for intercell interference coordination in femtocell networks,” IEEE
J. Sel. Areas Commun., vol. 30, no. 3, pp. 631–640, 2012.
[24] Evolved Universal Terrestrial Radio Access Network (E-UTRAN);X2 general aspects and principles (Release 10), 3GPP
Std. TS 36.420 v10.2.0, Sep. 2011.
[25] Evolved Universal Terrestrial Radio Access (E-UTRA); TDD Home eNode B (HeNB) Radio Frequency (RF) requirements
analysis (Release 10), 3GPP Std. TR 36.922 v10.0.0, Apr. 2011.
[26] Feasibility study for evolved Universal Terrestrial Radio Access (UTRA) and Universal Terrestrial Radio Access Network
(UTRAN) (Release 10), 3GPP Std. TR 25.912 v10.0.0, Mar. 2011.
25
� �
�������
���������
�
��
�
����
�����
�����
�����
������ � ������
���
�����
Fig. 1. 3GPP networked femtocell architecture and path switch operation.
� �
�������
��
��� ���
������
�����������
������������������
����������
�������
�����������
����� ����
����� �������!
��"�"���#������$#
%����&��'�����
��"�"���#������$#�
"�������
%����(�$����
���������)�
�*��(����+��
�����'������
,��(��'���(�
�� ����
,��(��'���(�
�� �������!
�����,������������
�� ����
�����,������������
��������
-$����������(��
��.����*����(��
�������!��
�������!��
���"����/���������
,��(��'���(�
�� ����� ����
�(���,"�
�������
���������
��������������$��
%�������$$��
%�������$$��
���,����������
����/�������
���"���������
Fig. 2. MSC of 3GPP X2-based handover.
26
� �
�������
��
��� ���
�� ������
������������������
����������
�������
�����������
����������
�������������
��!�!���"������#"
$����%��&�����
��!�!���"������#"�
!�������
$����'�#����
���������(�
�)��'����*��
�����&������
���+����������
����,�������
���!���������
��������������#��
-�����
���'���
��
���.
��
��
���!����,���������
�������
���������
$����%��&�����
$����%��&�����
$�������##��
$�������##��
%��&����� ��'����
��� �'�/0����
$����%��&�����
Fig. 3. MSC of TF CP scheme.
� �
�������
���������
�
����
�����
�����
�����
������ �
���
���
�
���
�� �����
Fig. 4. Data paths of TF CP scheme.
27
� �
�������
��
��� ���
�� ������
������������������
����������
�������
�����������
����������
�������������
��!�!���"������#"
$����%��&�����
��!�!���"������#"�
!�������
$����'�#����
���������(�
�)��'����*��
�����&������
���+����������
����,�������
���!���������
��������������#��
�'����������'���� �'�-�
#��&����� ��'������� �'��
.�����
���'���
��
���/
��
��
.�����+��'��&���'��������
���!����,���������
�������
���������
.�����+��'��&���'�����������
$����%��&�����
������� ��
������� ��
$����%��&�����
$�������##��
$�������##��
Fig. 5. MSC of TF SP scheme.
� �
�������
���������
�
������
�����
�����
�����
������ �
���
���
�����
���
�
Fig. 6. Data paths of TF SP scheme.

28
S01S
12
S11
S14
S13
S21
S22
S23
S24
S25
S28
S26
S27
S31
S32
S33
S34
S35
S36
S37
S38
S39
S312
S311
S310
(a) Original states
S01S
11
S11
S11
S11
S21
S22
S21
S22
S21
S22
S22
S21
S31
S32
S32
S31
S32
S32
S31
S32
S32
S32
S32
S31
(b) After state aggregation
Fig. 7. Grid femtocell network.
29
0
idle
1 2(1)
mPP )1( µ−
λP
λP−1
2(2)
3(1) 4(1)
3(2) 4(2)
4(3)
K(1)
K(2)
K(3)
5(1)
5(2)
5(3)
mPP )1(
4
1µ−
mPP )1(
2
1µ−
6(1)
6(2)
6(3)
6(4)
7(1)
7(2)
7(3)
7(4)
+
2
1K
K
K(4)
)idle'' state (towards µP
mPP )1(
4
3µ−
muPPP )1(1 −−− µ
Fig. 8. State transition diagram of the TF SP scheme.

30
1 2 3 4 5 6 7 8 9 100.1
0.2
0.3
0.4
0.5
0.6
0.7
K
Rela
tive s
ignalin
g c
ost ra
tio
TF_CP sim (DS1
=20 ms)
TF_CP sim (DS1
=50 ms)
TF_CP sim (DS1
=80 ms)
TF_SP sim (DS1
=20 ms)
TF_SP sim (DS1
=50 ms)
TF_SP sim (DS1
=80 ms)
TF_SP ana
(a) Relative signaling cost ratio
1 2 3 4 5 6 7 8 9 101
1.1
1.2
1.3
1.4
1.5
1.6
1.7
1.8
1.9
2
K
Rela
tive d
ata
deliv
ery
cost ra
tio
TF_CP sim (DS1
=20 ms)
TF_CP sim (DS1
=50 ms)
TF_CP sim (DS1
=80 ms)
TF_SP sim (DS1
=20 ms)
TF_SP sim (DS1
=50 ms)
TF_SP sim (DS1
=80 ms)
TF_SP ana
(b) Relative data delivery cost ratio
Fig. 9. Effect of forwarding chain threshold and backhaul latency.
31
0.125 0.25 0.5 1 2 40
0.1
0.2
0.3
0.4
0.5
0.6
0.7
0.8
0.9
1
1/m (min)
Norm
aliz
ed s
ignalin
g c
ost
3GPP sim
3GPP ana
TF_CP sim (K=2)
TF_CP sim (K=4)
TF_CP sim (K=6)
TF_SP sim (K=2)
TF_SP sim (K=4)
TF_SP sim (K=6)
TF_SP ana
(a) Normalized signaling cost
0.125 0.25 0.5 1 2 4
1
1.1
1.2
1.3
1.4
1.5
1/m (min)
Norm
aliz
ed d
ata
deliv
ery
cost
3GPP sim
3GPP ana
TF_CP sim (K=2)
TF_CP sim (K=4)
TF_CP sim (K=6)
TF_SP sim (K=2)
TF_SP sim (K=4)
TF_SP sim (K=6)
TF_SP ana
(b) Normalized data delivery cost
Fig. 10. Effect of cell residence time.

32
0.5 1 2 4 8 16 32
0.2
0.3
0.4
0.5
0.6
0.7
0.8
0.9
1
1/µ (min)
Norm
aliz
ed s
ignalin
g c
ost
3GPP sim
3GPP ana
TF_CP sim (K=2)
TF_CP sim (K=4)
TF_CP sim (K=6)
TF_SP sim (K=2)
TF_SP sim (K=4)
TF_SP sim (K=6)
TF_SP ana
(a) Normalized signaling cost
0.5 1 2 4 8 16 32
1
1.05
1.1
1.15
1.2
1.25
1.3
1.35
1.4
1/µ (min)
Norm
aliz
ed d
ata
deliv
ery
cost
3GPP sim
3GPP ana
TF_CP sim (K=2)
TF_CP sim (K=4)
TF_CP sim (K=6)
TF_SP sim (K=2)
TF_SP sim (K=4)
TF_SP sim (K=6)
TF_SP ana
(b) Normalized data delivery cost
Fig. 11. Effect of session duration.
33
50 75 100 125 150 175 2000
50
100
150
200
250
300
1/λ (min)
Num
ber
of m
essages p
rocessed a
t M
ME
(per
sec)
3GPPTF_CP (K=2)TF_CP (K=4)TF_CP (K=6)TF_SP (K=2)TF_SP (K=4)TF_SP (K=6)
Fig. 12. Signaling load at MME.
50 75 100 125 150 175 2000
0.05
0.1
0.15
0.2
0.25
0.3
0.35
0.4
0.45
0.5
1/λ (min)
Avera
ged n
um
ber
of concurr
ent sessio
ns p
er
X2 lin
k
TF_CP (K=2)TF_CP (K=4)TF_CP (K=6)TF_SP (K=2)TF_SP (K=4)TF_SP (K=6)
Fig. 13. Average traffic load per X2 link.
34
0 1 2 3 4 5 60
0.1
0.2
0.3
0.4
0.5
0.6
0.7
0.8
0.9
Number of concurrent sessions on an X2 link
Perc
enta
ge o
f sim
ula
tion tim
e
TF_CP (K=4)
TF_SP (K=4)
Fig. 14. Traffic load distribution in local femtocell network.

35
TABLE IPARAMETERS USED IN ANALYSIS
Parameter Notation
τ Time slot duration of Markov chain
λ Session arrival rate
µ Session departure rate
m UE mobility rate
K Threshold of forwarding chain
DX2 Transmission latency over X2
DS1 Transmission latency over S1
DcHeNB C-plane processing latency at HeNB
DuHeNB U-plane processing latency at HeNB
DHeNB GW UE context retrieval and processing latency at HeNB GW
N Number of grid femtocell networks controlled by an MME/HeNB GW
U Number of UEs in a grid femtocell network
Ddetect HeNB failure detection latency
rp Packet arrival rate during a session
TABLE IIPARAMETER SETTING
Parameter Value Parameter Value
τ 0.001 min DX2 5 ms
λ 0.01 /min DS1 50 ms
µ 0.1 /min DcHeNB 4 ms
m 1 /min DuHeNB 1 ms
K 2,4,6 DHeNB GW 15 ms
N 500 U 50
rp 60 /sec Ddetect 50 ms
TABLE IIICOMPARISON OF RECOVERY MECHANISMS
Schemes Average Recovery Latency Average Lost Packets
TF CP 165.00 ms 6.90
TF SP 100.63 ms 4.52