1 liv Introduction
70
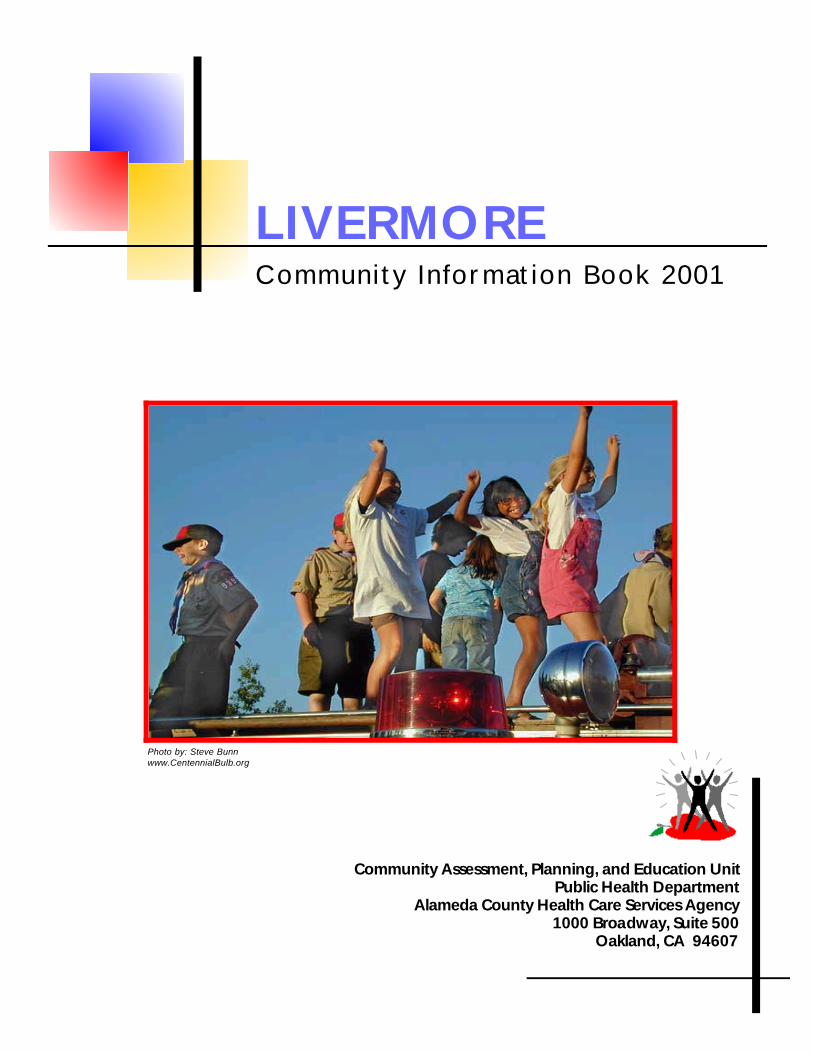
Community Assessment, Planning, and Education Unit Public Health Department Alameda County Health Care Services Agency 1000 Broadway, Suite 500 Oakland, CA 94607 LIVERMORE Community Information Book 2001 Photo by: Steve Bunn www.CentennialBulb.org
Transcript of 1 liv Introduction
Community Assessment, Planning, and Education Unit Public Health Department
Alameda County Health Care Services Agency 1000 Broadway, Suite 500
Oakland, CA 94607
LIVERMORE Community Information Book 2001
Photo by: Steve Bunn www.CentennialBulb.org

LIVERMORE Community Information Book 2001
Prepared by: Alameda County Public Health Department
Community Assessment, Planning, and Education (CAPE) Unit Sandra Witt, Dr.P.H., Director
Lead Staff:
Sangsook Cho, Ph.D. Sonia Jain, MPH
Gem Le, MPH Jane Martin, Dr.P.H.
Nobuko Mizoguchi, MPH/MPP
August 2001

Alameda County Public Health Department Arnold Perkins, Director
Art Chen, M.D., Health Officer
Health Care Services Agency David Kears, Director
This report is available online at
http://www.co.alameda.ca.us/public health
For copies or comments, please contact:
Community Assessment, Planning, and Education (CAPE) Unit Alameda County Public Health Department
1000 Broadway, 5th Floor Oakland, CA 94607
Telephone: (510) 267-8020
Acknowledgements The Community Assessment, Planning, and Education (CAPE) Unit of the Alameda County Public Health Department wishes to thank the following individuals for their support and contributions. Community Assessment, Planning, and Education Unit Maria Hernandez Liz Maker Joan Mazzetti Hemal Parikh Darouny Somsanith Office of the Director Support Staff Priscilla Fung Gail Potier Margaret Rivas Information Systems Gary Oliver Health Education Review Committee Paul Cummings Zakiya Somburu Alameda County Social Services Agency Jim Cunniff

Table of Contents
Introduction 1 Community Maps
Neighborhood History 6
Demographics and Social Profile 7
Census 2000 • Population Characteristics • Households • Languages Spoken• Income • Poverty •
Employment and Occupations• Education • Housing
Health Indicators
Maternal and Child Health 22 Overall Births • Infant Deaths•
Low Birth Weight • Early Prenatal Care • Teen Births • Child Abuse and Neglect Hospitalization 30 Leading Causes • Asthma • Diabetes • Injury Overall Deaths 45 Leading Causes
Education 49 School Profiles
Government 51
City Council • Alameda County Board of Supervisors • State Assembly and Senate • U.S. Congress and Senate
References 66
Livermore Community Information Book 2001
Alameda County Public Health Department Page 1
Introduction Why a community information book? The Alameda County Public Health Department is working together with neighborhood residents to build healthier communities. Partnerships are being formed for the Public Health Department to share health information with residents and for residents to share information on the assets and strengths of their communities with the Public Health Department. Information on the community assets, health problems, and community concerns are all important in order to make effective, long-term change and build healthier communities. This information book is meant to be a useful tool and a way to share Public Health information with the community. As Community Health Teams and residents join together to look at strengths of the community, information on community assets and strengths can be added to this book. The purpose of the community information book is to:
describe the geography of the community and those who live in it look at the health and social issues that are affecting the community.
Who is this book for? This book is for community health team members, public health nurses, community outreach workers, anyone who works or lives in the community and wants to find out about the neighborhood and its health issues, or wants to plan programs or activities in the community.
How should Community Health Teams and Community Partners use this book? Here are some ways that you can use the community information book:
Orient new staff to the community or reinforce the knowledge of old-timers
Prioritize and/or plan for programs and activities
Community Information Book 2001!

Livermore Community Information Book 2001
Alameda County Public Health Department Page 2
Identify issues that are important to the community
Write grants
Use as a starting point for, or in addition to, your own collection of information about the community
We need your help! Community residents and people working in the community are the experts! Help us improve this community information book by letting us know what you think about it and how we can improve it. Please contact us at:
Alameda County Public Health Department Community Assessment, Planning and Education (CAPE) Unit
1000 Broadway, Suite 500 Oakland, CA 94607
Phone: (510) 267-8020 Fax: 267-3212
We encourage reproduction of this material, but please credit
the Community Assessment, Planning and Education Unit Alameda County Public Health Department.
Thank you!
Livermore Community Information Book 2001
Alameda County Public Health Department Page 3
Community Maps Information contained in this community information book covers the Livermore portion of Alameda County Public Health Department's Community Health Team Area in Supervisorial District 1. The map on the next page shows where all the Community Health Team Areas are located. The census tract included in this information book is 4514. In Census 2000, this census tract was divided into two new census tracts, 4514.01 and 4514.02. You can see this area shaded in light green on the map on the last page of this section.

0 2.5
miles5
CASTRO VALLEYSAN LEANDRO
ASHLAND
PIEDMONT
PLEASANTON
NEWARK
UNION CITY
SAN LORENZO
CHERRYLAND
HAYWARD
ALAMEDA
EMERYVILLE
ALBANY
BERKELEY
DUBLIN
FREMONT
LIVERMORE
OAKLAND
Source of population data: Claritas; Produced by Alameda County Public Health Department Information Systems CAPE Unit 9/02/99
1
34
2
5
North Oakland
West Oakland
Chinatown/San Antonio
Fruitvale
East Oakland
Ashland/Cherryland
South Hayward/Harder-Tennyson
Contempo and Decoto
Centerville
Livermore
Community Health Team Areas
Supervisorial District Boundaries
Census Tract Boundaries
Alameda County Public Health Department Community Health Team Areas
1 Supervisorial District Number
CommunityHealth TeamAreas - 1998Population andCensus TractDefinition: North Oakland
West Oakland
Chinatown/San Antonio
Fruitvale
East Oakland
Ashland/Cherryland
S Hayward/Harder-Tennyson
Contempo and Decoto
Centerville
Livermore
Population: 29,210Tracts: 4007-4014, 4028
Population: 19,052Tracts: 4015-4019, 4021-4027
Population: 38,217Tracts: 4030-4031, 4033 4054-4060
Population: 47,725Tracts: 4061-4063, 4065-4066, 4070-4072
Population: 75,054Tracts: 4073-4076, 4084-4089, 4091-4097, 4102-4104
Population: 29,593Tracts: 4337-4340, 4355-4356
Population: 32,782Tracts: 4374-4378, 4382.01, 4382.02
Population: 20,796Tracts: 4402,4403.04, 4403.06, 4403.08
Population: 47,439Tracts: 4417, 4419.02, 4425-4428, 4445
Population: 10,676Tracts: 4514
San Francisco Bay
Contra Costa County
Alameda County
Alameda County
Santa Clara County
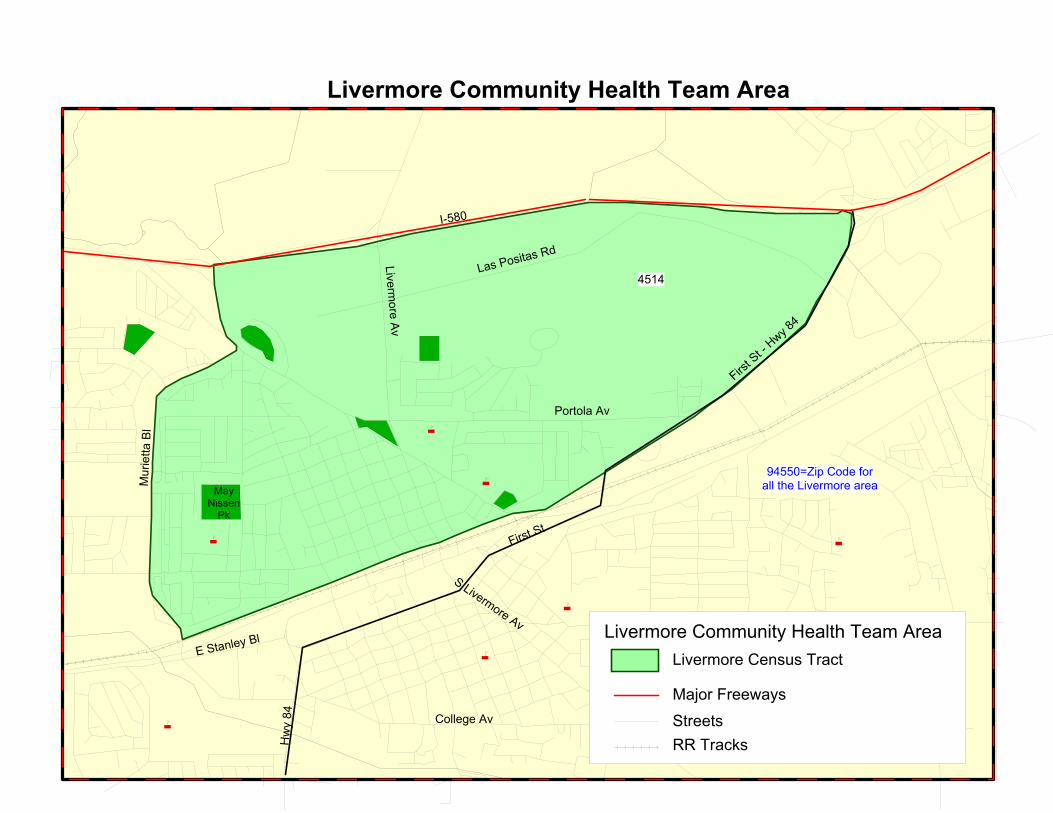
94550=Zip Code forall the Livermore area
4514
Livermore Community Health Team Area
Livermore Community Health Team AreaLivermore Census Tract
Major FreewaysStreets
I-580
Portola Av
Livermore Av
Las Positas Rd
Mur
ietta
Bl
First S
t - Hwy 8
4
First St
Hw
y 84
E Stanley Bl
College Av
S Livermore Av
MayNissen
Pk
RR Tracks

Livermore Community Information Book 2001
Alameda County Public Health Department Page 6
Neighborhood History History of Livermore
Here is a brief history of Livermore as posted on the City of Livermore website:
The Livermore Valley was originally settled by Costonoan Indians. During the Spanish era the Livermore region was part of Mission San Jose. Livermore, California was established in 1869 by William Mendenhall who laid the town next to the railroad. It was named for Robert Livermore, an English sailor who settled in the area in 1835. Robert Livermore married Josefa Higuera Molina in 1838. Their home was the Rancho Las Positas, which encompassed much of the present day city. Livermore was the largest and fastest growing city in the region for many years. For much of its history, Livermore has been an agricultural community. Vineyards and ranches continue within and around the city today. The Livermore Rodeo began in 1918 to raise funds for the Red Cross during World War I. The Livermore Stockmen's Rodeo Association has brought rodeo to Livermore for 77 years. World War II brought significant changes to the region with the introduction of an airfield and a major military base. In 1952, the University of California established what is now called the Lawrence Livermore National Laboratory to do research on nuclear energy.
Source: http://www.ci.livermore.ca.us/history.html

Livermore Community Information Book 2001
Alameda County Public Health Department Page 7
Demographic & Social Profile Knowing who lives in the neighborhood is one way to get to know the community in which you live or work. This section describes the social and demographic characteristics of Livermore residents. Demographic characteristics are information about the population, such as race, ethnicity, age, and sex. The information contained in this section comes from different sources. We have used the most recent data available, including the new 2000 Census data. At this time, only the total population and race/ethnicity information are available through Census 2000. Therefore, we rely on 1999 estimates for other social and demographic information.

Livermore Community Information Book 2001
Alameda County Public Health Department Page 8
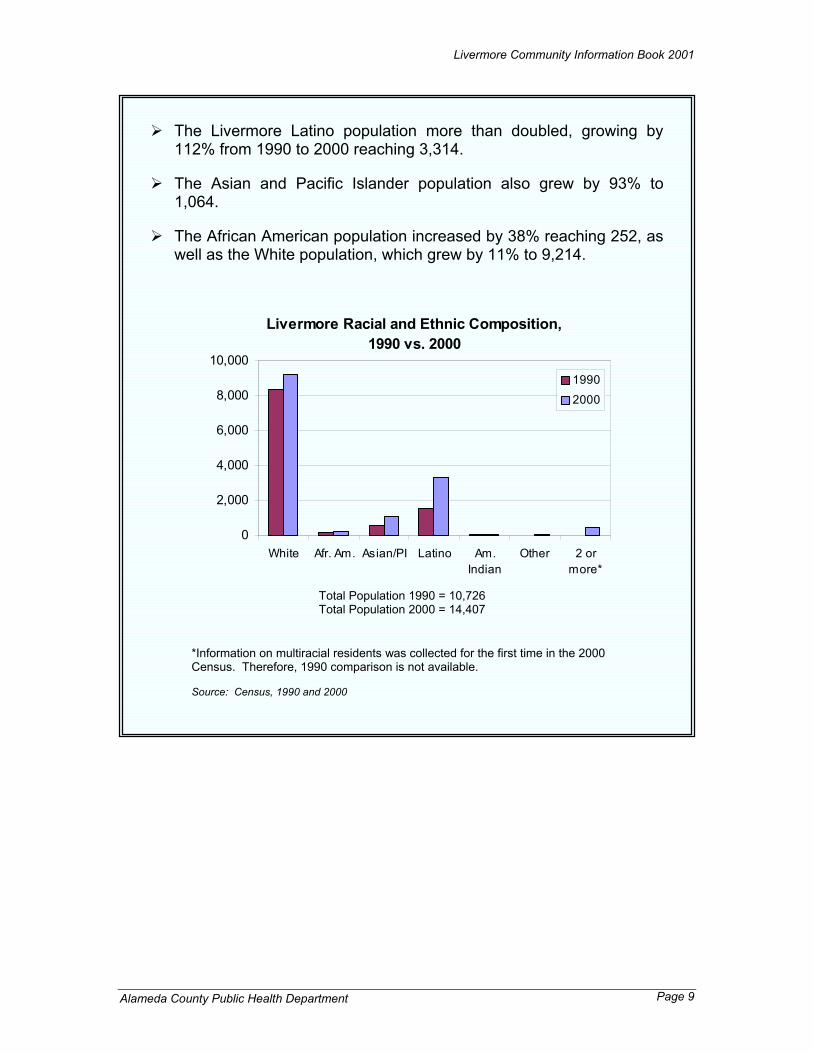
Census 2000 The latest figures from Census 2000 show that 14,407 people live in Livermore, an increase of 34% since 1990. The race and ethnicity information from the Census show that Livermore is home to people of diverse cultures and backgrounds. Livermore consists of 65% Whites, 23% Latinos, 7% Asian and
Pacific Islanders, 3% residents reporting two or more races, 2%African Americans, and less than 1% American Indians. In AlamedaCounty, the racial and ethnic make-up is 41% Whites, 21%Asian/Pacific Islanders, 19% Latinos, 15% African Americans, 4%residents reporting two or more races, and less than 1% AmericanIndians.
Of the Asian and Pacific Islanders, approximately 5% are NativeHawaiians and other Pacific Islanders, and 95% are Asians.
Source: Census, 2000
Total Population = 14,407
Livermore Racial and Ethnic Composition, 2000
African American
2%
Asian and Pacific
Islanders7%
Two or more races
3%
American Indian<1%
Latino23%
White65%
Livermore Community Information Book 2001
Alameda County Public Health Department Page 9
The Livermore Latino population more than doubled, growing by112% from 1990 to 2000 reaching 3,314.
The Asian and Pacific Islander population also grew by 93% to1,064.
The African American population increased by 38% reaching 252, aswell as the White population, which grew by 11% to 9,214.
*Information on multiracial residents was collected for the first time in the 2000 Census. Therefore, 1990 comparison is not available. Source: Census, 1990 and 2000
Total Population 1990 = 10,726 Total Population 2000 = 14,407
Livermore Racial and Ethnic Composition, 1990 vs. 2000
0
2,000
4,000
6,000
8,000
10,000
White Afr. Am. Asian/PI Latino Am.Indian
Other 2 ormore*
19902000

Livermore Community Information Book 2001
Alameda County Public Health Department Page 10
Population Characteristics
Livermore is an intergenerational neighborhood with men and women of all ages. The 2000 Census data on age and sex is not yet available. The following information is based on 1999 estimates. In 1999, Livermore had as many men (50%) as there were women (50%).
This was similar to Alameda County, which had 51% women and 49% men.
Children under 14 years of age made up 26% of the community in Livermore, as compared to 21% in Alameda County as a whole.
Seniors (65 and older) made up 7% of the Livermore population, as compared to 11% countywide.
Households
In 1999, there were 4,514 households in the Livermore community, a 17.6% increase over the 3,840 households counted in 1990.
Livermore Age Distribution by Sex, 1999
30% 20% 10% 0% 10% 20% 30%
< 5
15-24
35-44
55-64
75-84
Age
Male Female
Total = 6,261 Total = 6,360
Source: Claritas, 1999
Livermore Community Information Book 2001
Alameda County Public Health Department Page 11
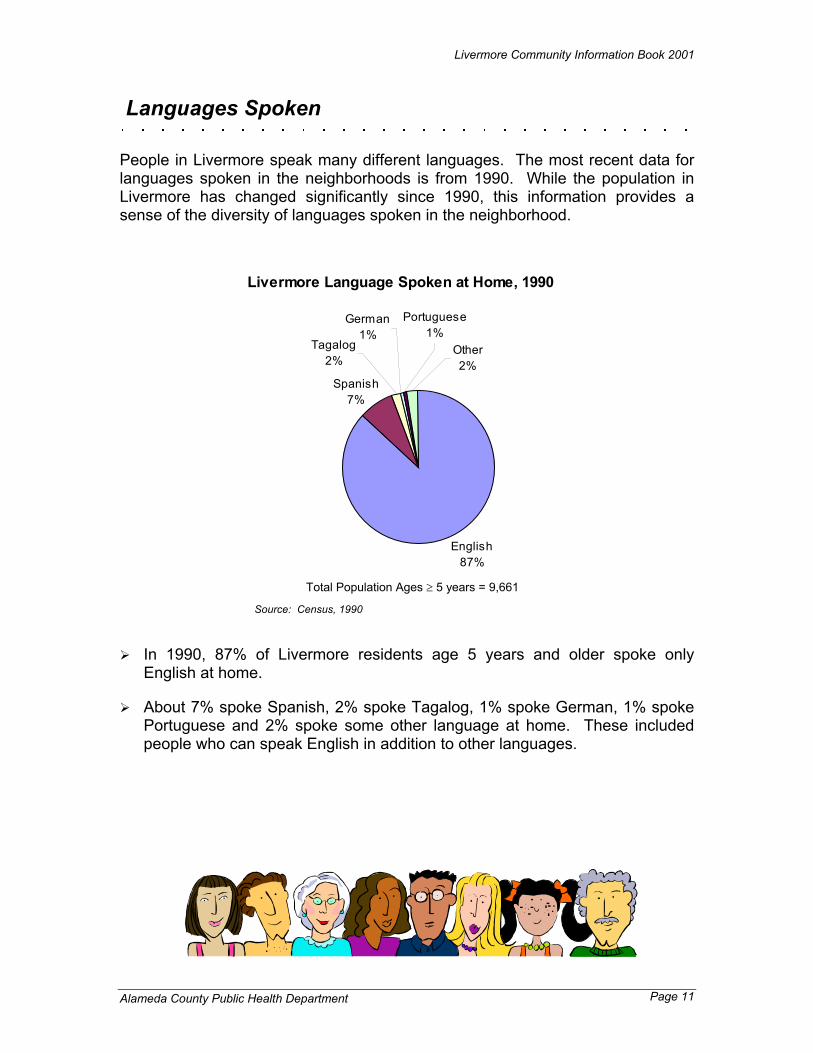
Languages Spoken
People in Livermore speak many different languages. The most recent data for languages spoken in the neighborhoods is from 1990. While the population in Livermore has changed significantly since 1990, this information provides a sense of the diversity of languages spoken in the neighborhood.
In 1990, 87% of Livermore residents age 5 years and older spoke only English at home.
About 7% spoke Spanish, 2% spoke Tagalog, 1% spoke German, 1% spoke Portuguese and 2% spoke some other language at home. These included people who can speak English in addition to other languages.
Livermore Language Spoken at Home, 1990
English87%
Spanish7%
Tagalog2%
German1%
Portuguese1%
Other2%
Total Population Ages ≥ 5 years = 9,661
Source: Census, 1990

Livermore Community Information Book 2001
Alameda County Public Health Department Page 12
Income
Income level is often associated with the health status of a community. Higher income is generally associated with better health status and access to health care, while lower income is often associated with poorer health status and less access to health care.
About one-fifths (20%) of households in Livermore earned an income of less
than $30,000 in 1999, as compared to 28% in Alameda County as a whole.
In 1997, half of all households in Alameda County earned more than $46,795 (U.S. Census Bureau). In Livermore, the same figure in 1999 was $60,167 (Claritas).
Livermore Household Income Distribution, 1999
<$30K20%
$30-50K19%
$50-75K27%
$75-100K18%
>$100K16%
Source: Claritas, 1999
Total Number of Households = 4,514

Livermore Community Information Book 2001
Alameda County Public Health Department
Page 13
Poverty
There are different ways to measure the number of people living in poverty. One way is through their participation in government programs that are available to low-income families. This section discusses people's participation in two programs: CalWORKs and Medi-Cal. The percent of people who participate in these two programs helps us estimate the number of people who are living in poverty in Livermore. Because not everyone who is poor participates in these programs, the estimates are conservative. CalWORKs and Medi-Cal Participation
In December 1999, about 6% of
Livermore residents were participating in either CalWORKs or Medi-Cal only. This compares to about 9.4% countywide.
CalWORKs and MediCal Only Participation Livermore vs. Alameda County, 12/1999
1.33.8
4.6
5.6
0%
2%
4%
6%
8%
10%
12%
Livermore Alameda County
Perc
ent P
rogr
am P
artic
ipan
ts
% MediCal Only% CalWORKs
CalWORKs: California's welfare program is called California WorkOpportunity and Responsibility to Kids or CalWORKs. It gives cash aid andservices to eligible families with children. It was previously known as AFDC(Aid to Families with Dependent Children) and GAIN (Greater Avenues toIndependence). The number of people who participate in CalWORKs is anestimate of the number of children and parents living in poverty. Medi-Cal provides health insurance coverage to low-income families andindividuals who are elderly or disabled. More people are eligible for Medi-Calthan for CalWORKs. The Medi-Cal data presented here represents peoplewho participate only in Medi-Cal. All CalWORKs participants are eligible forMedi-Cal. However, Medi-Cal participants who are also enrolled inCalWORKs are not included here to prevent overlap. Looking at the numberof people who participate in Medi-Cal in addition to CalWORKs participationwill give us a sense of the number of people living in poverty.
Source: Alameda County Social Services Agency
Total Pop. = 12,621 Total Pop. = 1,408,813
Livermore Community Information Book 2001
Alameda County Public Health Department
Page 14
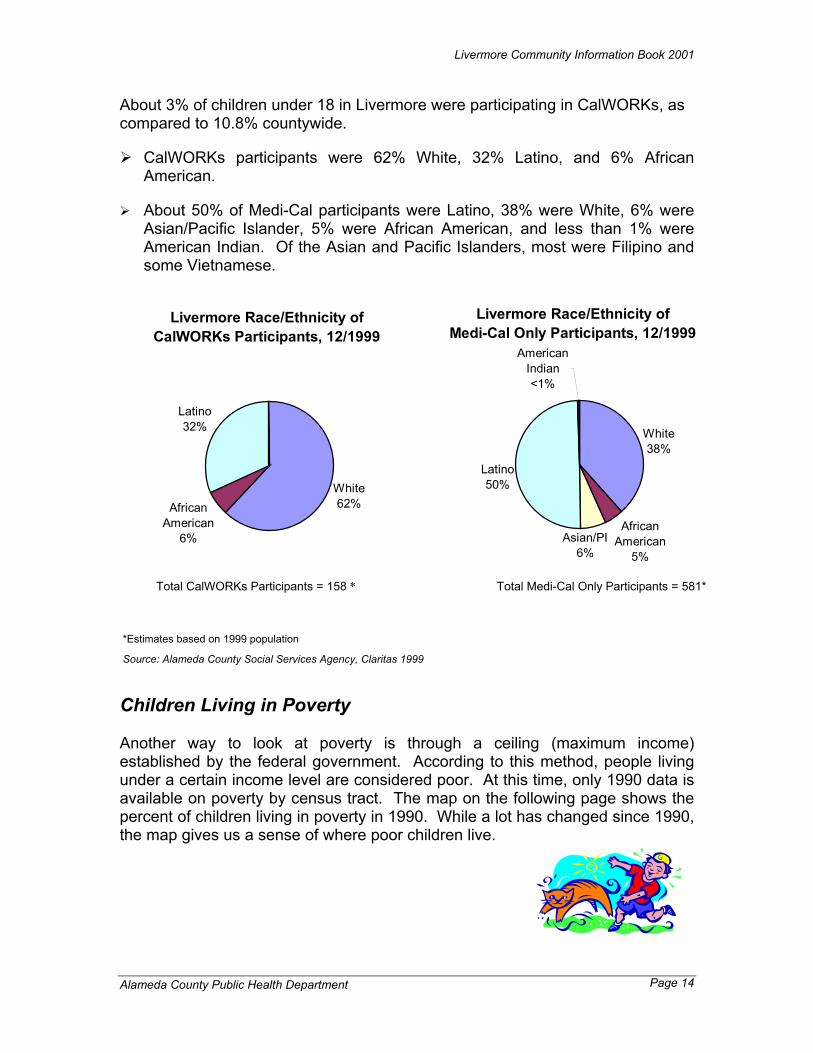
About 3% of children under 18 in Livermore were participating in CalWORKs, as compared to 10.8% countywide.
CalWORKs participants were 62% White, 32% Latino, and 6% African American.
About 50% of Medi-Cal participants were Latino, 38% were White, 6% were Asian/Pacific Islander, 5% were African American, and less than 1% were American Indian. Of the Asian and Pacific Islanders, most were Filipino and some Vietnamese.
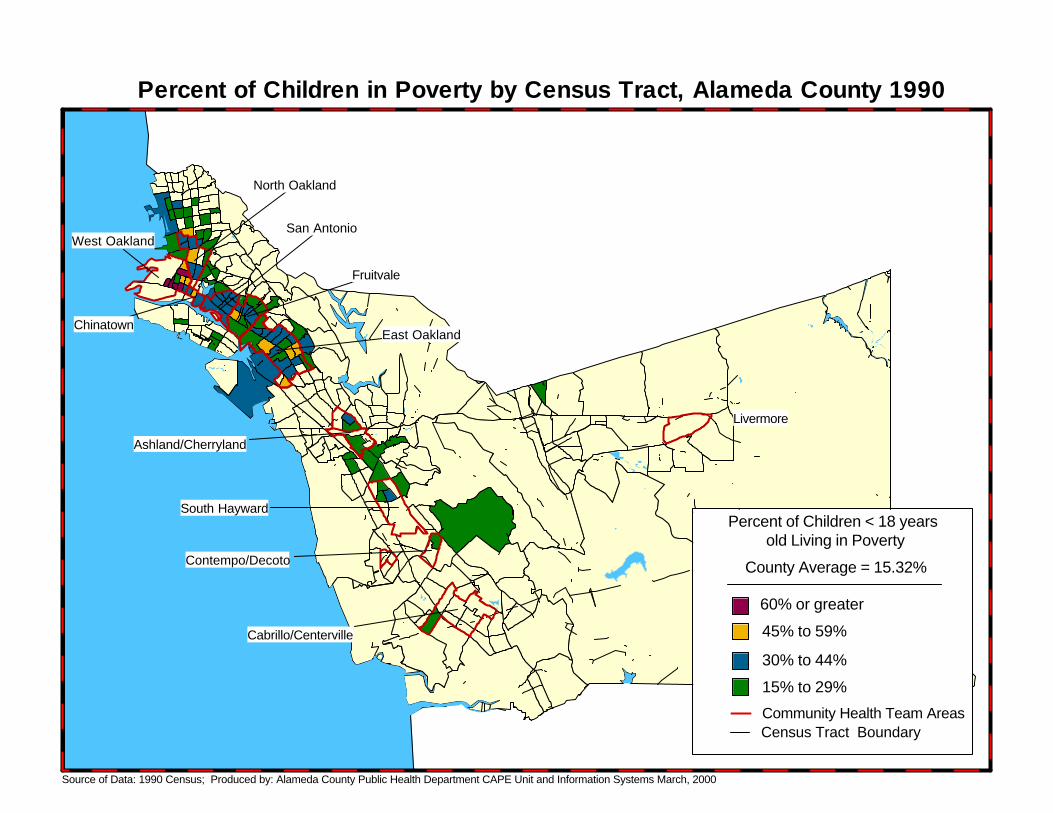
Children Living in Poverty Another way to look at poverty is through a ceiling (maximum income) established by the federal government. According to this method, people living under a certain income level are considered poor. At this time, only 1990 data is available on poverty by census tract. The map on the following page shows the percent of children living in poverty in 1990. While a lot has changed since 1990, the map gives us a sense of where poor children live.
*Estimates based on 1999 population
Source: Alameda County Social Services Agency, Claritas 1999
Total Medi-Cal Only Participants = 581* Total CalWORKs Participants = 158 *
Livermore Race/Ethnicity of CalWORKs Participants, 12/1999
Latino32%
White62%African
American6%
Livermore Race/Ethnicity of Medi-Cal Only Participants, 12/1999
White38%
Latino50%
African American
5%
American Indian<1%
Asian/PI6%
Cabrillo/Centerville
West Oakland
Chinatown
San Antonio
North Oakland
Fruitvale
East Oakland
Ashland/Cherryland
South Hayward
Contempo/Decoto
Livermore
Percent of Children in Poverty by Census Tract, Alameda County 1990
Source of Data: 1990 Census; Produced by: Alameda County Public Health Department CAPE Unit and Information Systems March, 2000
Percent of Children < 18 years old Living in Poverty
15% to 29%
45% to 59%60% or greater
County Average = 15.32%
Community Health Team AreasCensus Tract Boundary
30% to 44%
Livermore Community Information Book 2001
Alameda County Public Health Department Page 16
Employment and Occupations
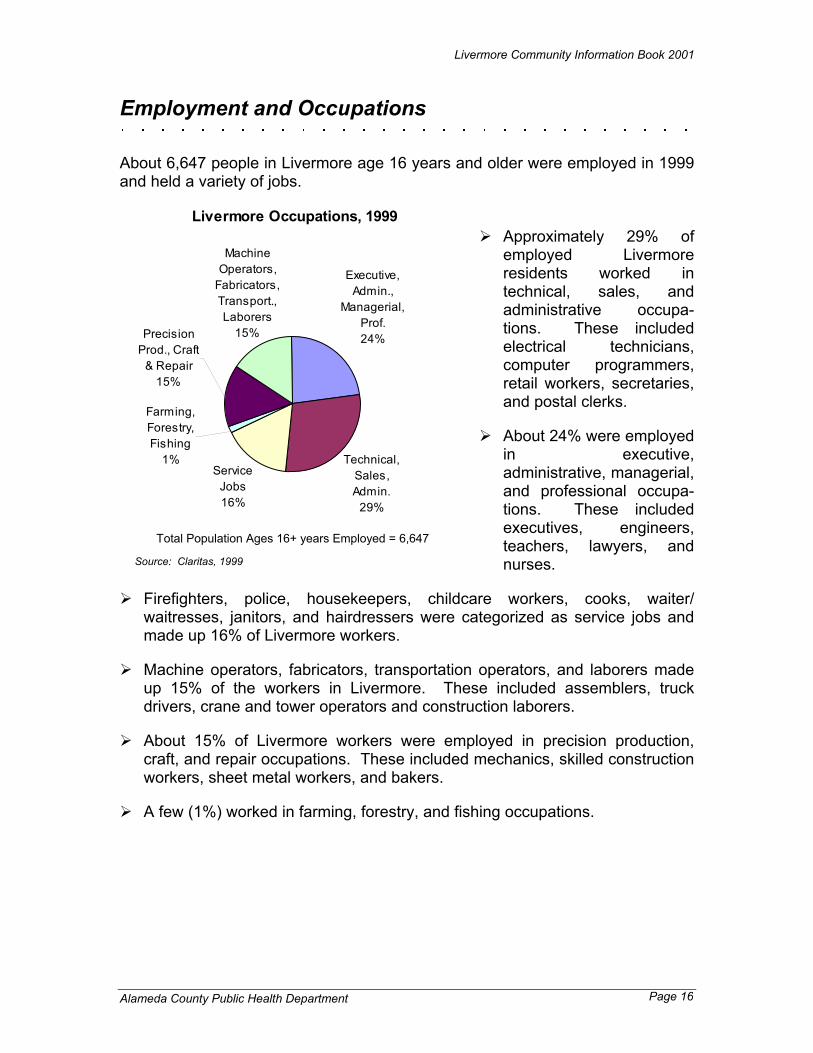
About 6,647 people in Livermore age 16 years and older were employed in 1999 and held a variety of jobs.
Approximately 29% of
employed Livermore residents worked in technical, sales, and administrative occupa-tions. These included electrical technicians, computer programmers, retail workers, secretaries, and postal clerks.
About 24% were employed in executive, administrative, managerial, and professional occupa-tions. These included executives, engineers, teachers, lawyers, and nurses.
Firefighters, police, housekeepers, childcare workers, cooks, waiter/ waitresses, janitors, and hairdressers were categorized as service jobs and made up 16% of Livermore workers.
Machine operators, fabricators, transportation operators, and laborers made up 15% of the workers in Livermore. These included assemblers, truck drivers, crane and tower operators and construction laborers.
About 15% of Livermore workers were employed in precision production, craft, and repair occupations. These included mechanics, skilled construction workers, sheet metal workers, and bakers.
A few (1%) worked in farming, forestry, and fishing occupations.
Livermore Occupations, 1999
Precision Prod., Craft
& Repair15%
Executive, Admin.,
Managerial, Prof.24%
Farming, Forestry, Fishing
1%Service
Jobs16%
Machine Operators,
Fabricators, Transport., Laborers
15%
Technical, Sales, Admin.
29%
Total Population Ages 16+ years Employed = 6,647
Source: Claritas, 1999
Livermore Community Information Book 2001
Alameda County Public Health Department Page 17
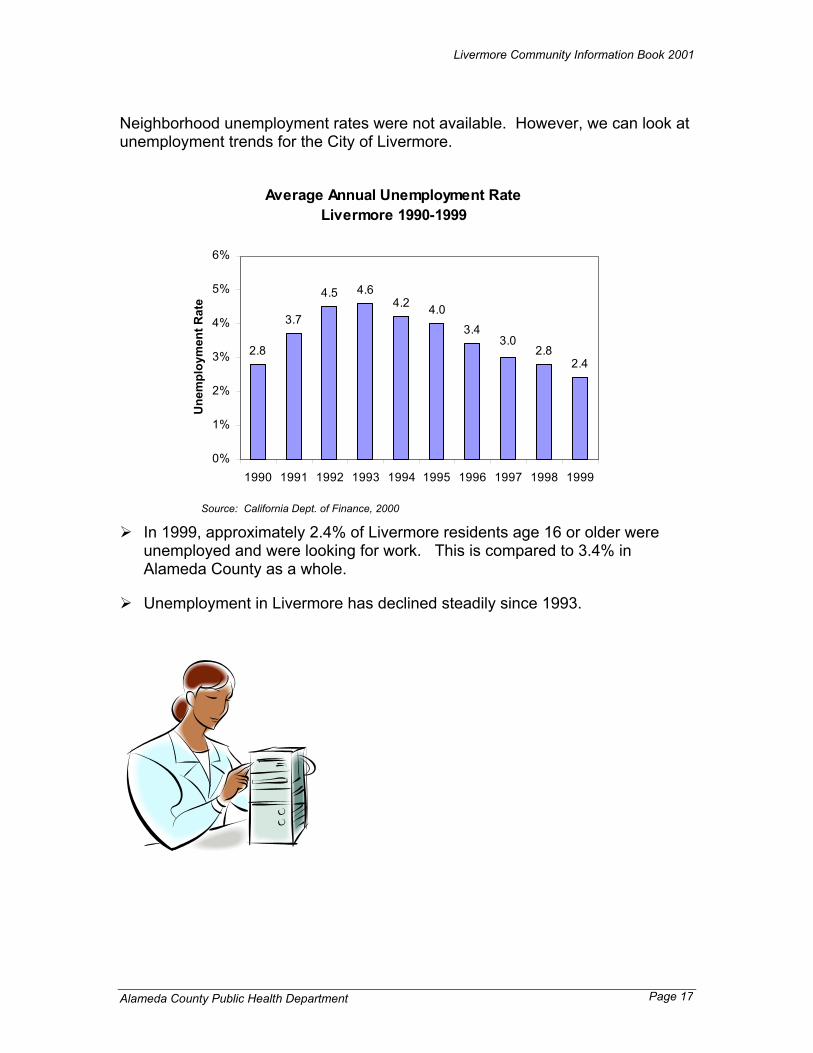
Neighborhood unemployment rates were not available. However, we can look at unemployment trends for the City of Livermore.
In 1999, approximately 2.4% of Livermore residents age 16 or older were
unemployed and were looking for work. This is compared to 3.4% in Alameda County as a whole.
Unemployment in Livermore has declined steadily since 1993.
Source: California Dept. of Finance, 2000
Average Annual Unemployment RateLivermore 1990-1999
2.42.8
3.03.4
4.04.24.64.5
3.7
2.8
0%
1%
2%
3%
4%
5%
6%
1990 1991 1992 1993 1994 1995 1996 1997 1998 1999
Une
mpl
oym
ent R
ate

Livermore Community Information Book 2001
Alameda County Public Health Department Page 18
Education
Education is an important part of neighborhood well-being. People in Livermore had varying levels of education.
In Livermore, about 21% of residents aged 25 and older had completed college (bachelor’s degree) or held a graduate/professional degree. For Alameda County as a whole, this figure was 29%.
About 23% in Livermore had completed some college (but had not graduated) and 9% had completed an associate degree, as compared to 22% who had attended some college and 8% who had completed an associate degree in Alameda County as a whole.
Approximately 28% of Livermore residents had graduated from high school or passed the General Educational Development (GED) exam. In Alameda County as a whole, 23% had finished high school or held a GED certificate.
Eighteen percent of Livermore residents ages 25 and over did not have a high school degree. This figure was the same in Alameda County as a whole.
Liv e rmore E ducational Attainme nt, 1999
8
1 8
1 1
2 2
2 3
1 1
7
9
1 4
7
2 3
2 8
1 3
5
0% 5% 10% 15% 20% 25% 30%
< 9 th g ra d e
9 th -1 2 th g ra d e , N o d ip lo m a
H ig h S ch G ra d /G E D
S o m e co lle g e , n o d e g re e
As s o c ia te
B a ch e lo r's
G ra d u a te / P ro fe s s io n a l L ive rm o reAla m e d a C o .
Source: Claritas, 1999
Total Adults Ages 25+ = 7,831

Livermore Community Information Book 2001
Alameda County Public Health Department Page 19
Housing The Bay Area's housing situation has changed rapidly within the past few years. Up-to-date information on housing in the neighborhoods is not available at this time, but here is some city-level information.
In Livermore, there were about 26,130 housing units in the year 2000. This was almost 5% of the total housing units in Alameda County.
Approximately 3.9% of housing units in Livermore were vacant in 2000.
On average, there were 3 persons per household in Livermore.
Livermore/Alameda County Housing Estimates, 2000
Area Number of Housing
Units Vacancy Average Number of
Persons per Household
Livermore 26,130 3.9 % 3.0
Total Alameda County 536,495 5.0 % 2.8 Source: California Department of Finance, 2000
Livermore Community Information Book 2001
Alameda County Public Health Department Page 20
Health Indicators This section covers health information on 1) maternal and child health, 2) hospitalization and 3) deaths. Each topic includes several indicators. For each indicator, we have used the most recent data available for the neighborhood and made comparisons to Alameda County. Also, whenever possible, we have included comparisons to the Healthy People 2000 objective, age and race breakdowns, and trends. In presenting neighborhood level information, we faced many limitations due to the small number of cases. Sometimes we were not able to provide breakdowns by age and race, so we present the overall rates only. In some instances, we could not calculate a reliable rate and only provide the number of cases. We also use three-year averages for some indicators to make rates from small numbers more reliable.
What is a Health Indicator? A measure of health and wellbeing in a population. Why Look at Health Indicators?
To help identify areas of need To monitor changes and trends in the health of the community To serve as a guide in planning programs
What are Healthy People 2000 Objectives? Healthy People 2000 objectives are benchmarks developed by the U.S.Department of Health and Human Services to measure and improve thepublic's health. Many local, state, and national organizations use theseobjectives for health planning and action. Healthy People 2000 objectives are organized into three main goals: 1. Increase the years of healthy life for Americans, 2. Reduce health disparities among Americans, and 3. Achieve access to preventive services for all Americans. To achieve these goals, Healthy People 2000 has set objectives for specific health indicators.

Livermore Community Information Book 2001
Alameda County Public Health Department Page 21

Livermore Community Information Book 2001
Alameda County Public Health Department
Page 22
Maternal and Child Health
Pregnant women and their infants are key members of the community. The health of mothers and their babies is often used as an important measure of the overall health of a community. Factors associated with healthy mothers and babies include: Receiving early quality prenatal care
Giving birth between ages 19 - 34
Non-smoking mothers and fathers
Drug and alcohol-free parents
Good nutrition
This section discusses indicators traditionally chosen to represent the status of maternal and child health in a community. These include overall births, infant deaths, low birth weight, early entry into prenatal care, teen births, and child abuse/neglect.
Livermore Community Information Book 2001
Alameda County Public Health Department
Page 23
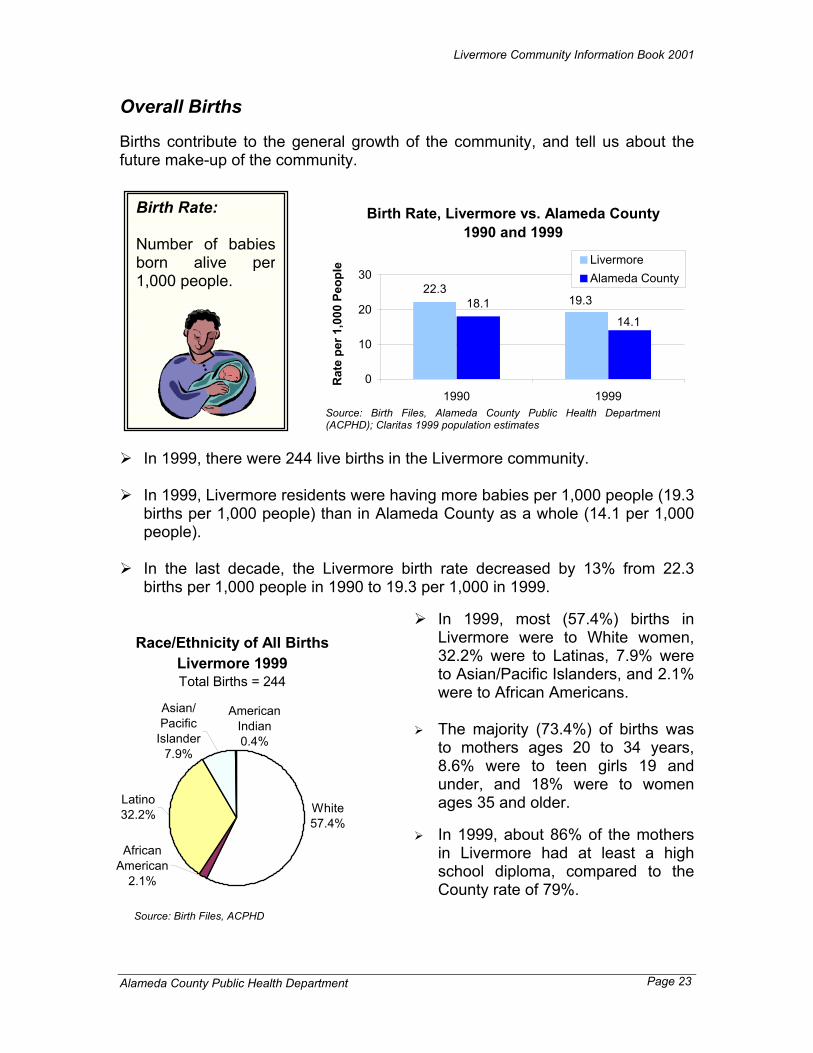
Overall Births Births contribute to the general growth of the community, and tell us about the future make-up of the community.
In 1999, there were 244 live births in the Livermore community.
In 1999, Livermore residents were having more babies per 1,000 people (19.3
births per 1,000 people) than in Alameda County as a whole (14.1 per 1,000 people).
In the last decade, the Livermore birth rate decreased by 13% from 22.3
births per 1,000 people in 1990 to 19.3 per 1,000 in 1999.
In 1999, most (57.4%) births in Livermore were to White women, 32.2% were to Latinas, 7.9% were to Asian/Pacific Islanders, and 2.1% were to African Americans.
The majority (73.4%) of births was
to mothers ages 20 to 34 years, 8.6% were to teen girls 19 and under, and 18% were to women ages 35 and older.
In 1999, about 86% of the mothers
in Livermore had at least a high school diploma, compared to the County rate of 79%.
Birth Rate: Number of babiesborn alive per1,000 people.
Source: Birth Files, ACPHD
Source: Birth Files, Alameda County Public Health Department(ACPHD); Claritas 1999 population estimates
Birth Rate, Livermore vs. Alameda County 1990 and 1999
22.318.1 19.3
14.1
0
10
20
30
1990 1999
Rat
e pe
r 1,0
00 P
eopl
e LivermoreAlameda County
Race/Ethnicity of All Births Livermore 1999 Total Births = 244
Asian/ Pacific
Islander7.9%
Latino32.2% White
57.4%
African American
2.1%
American Indian0.4%

Livermore Community Information Book 2001
Alameda County Public Health Department
Page 24
Infant Deaths
Rate of infant deaths is often used to measure the health status of a community, as it signifies the overall health of mothers and their ability to access health care. It is highly sensitive to changes in the social, physical, and economic environment of the community. Some infant deaths, such as those caused by congenital anomalies (i.e. problems with formation of the baby
before birth), are difficult to prevent. However, many infant deaths can be prevented. Examples include deaths caused by car crashes, abuse, poor nutrition, and accidents at home. Also, inadequate prenatal care, substance abuse and smoking by mother during pregnancy, preterm birth, low birth weight, and complications during pregnancy are associated with high risk of infant deaths. From 1990 to 1998, there were 12 infant deaths in the Livermore community.
The primary cause of infant deaths in Livermore were problems that develop
around the time of birth (perinatal conditions), such as infections in the mother, malnutrition and slow growth of the unborn baby, and birth trauma.
Infant Death: The death of ababy before thefirst birthday.

Livermore Community Information Book 2001
Alameda County Public Health Department
Page 25
Low Birth Weight Achieving a healthy weight is crucial for a newborn's survival. Babies born with low birth weight (LBW) have a greater risk of illness and death. Therefore, improvements in infant birth weight can contribute substantially to reducing a baby's risk of illness and death.
From 1997 to 1999, about 4.9% of the babies born in Livermore were low birth weight, as compared to the County rate of 6.9%. There were about 13 low birth weight (LBW) births in Livermore per year. The national objective for year 2000 for percent of babies born low birth weight is 5%.
In the last decade, percent of babies born weighing less than 2,500 grams in
Livermore has not declined.
In Livermore, 6.2% of babies born to White mothers were born low birth
weight.
Percent Low Birth Weight Babies, Livermore* 1990 - 1999
0%2%4%6%8%
10%
1990 1991 1992 1993 1994 1995 1996 1997 1998 1999
% L
BW
Bab
ies
Low Birth WeightInfants: Babies weighing lessthan 2,500 grams (5 lbs, 8 oz) at birth.
Source: Birth Files, ACPHD
Source: Birth Files, ACPHD *Small Numbers add variability.
Percent Low Birth Weight Babies Livermore, 1997-99 (3-year Average)
6.9%4.9%
0%
2%
4%
6%
8%
Livermore Alameda County
Perc
ent L
BW
HP 2000=5%
NoMizog

Livermore Community Information Book 2001
Alameda County Public Health Department
Page 26
Early Prenatal Care Pregnant women are encouraged to get prenatal care during the first three months of their pregnancy. Early prenatal care is important in: identifying and treating health problems early in the
pregnancy to reduce future complications; recognizing risk factors in the mother’s behavior
such as drug and alcohol abuse that put the fetus at risk for poor birth outcomes;
providing a healthy start for newborns.
Many factors affect a woman's ability to receive early prenatal care. These include the lack of culturally appropriate pregnancy testing sites, young age of mother, and multiple previous pregnancies. Domestic violence, cultural beliefs, drug abuse, single parenthood, and poverty also can prevent women from receiving timely prenatal care.
Between 1997 and 1999, most pregnant women (90.2%) in Livermore sought
early prenatal care. This compares to the County rate of 87.4% and meets the National Year 2000 Objective of 90%.
Prenatal Care: Pregnancy- related health care provided to women during pregnancy.
Source: Birth Files, ACPHD
Early Entry into Prenatal Care 1997-99 (3-year Average)
87.4%90.2%
0%
30%
60%
90%
Livermore Alameda County
% E
arly
Pre
nata
l Car
e HP 2000=90%
NoMizog
Livermore Community Information Book 2001
Alameda County Public Health Department
Page 27
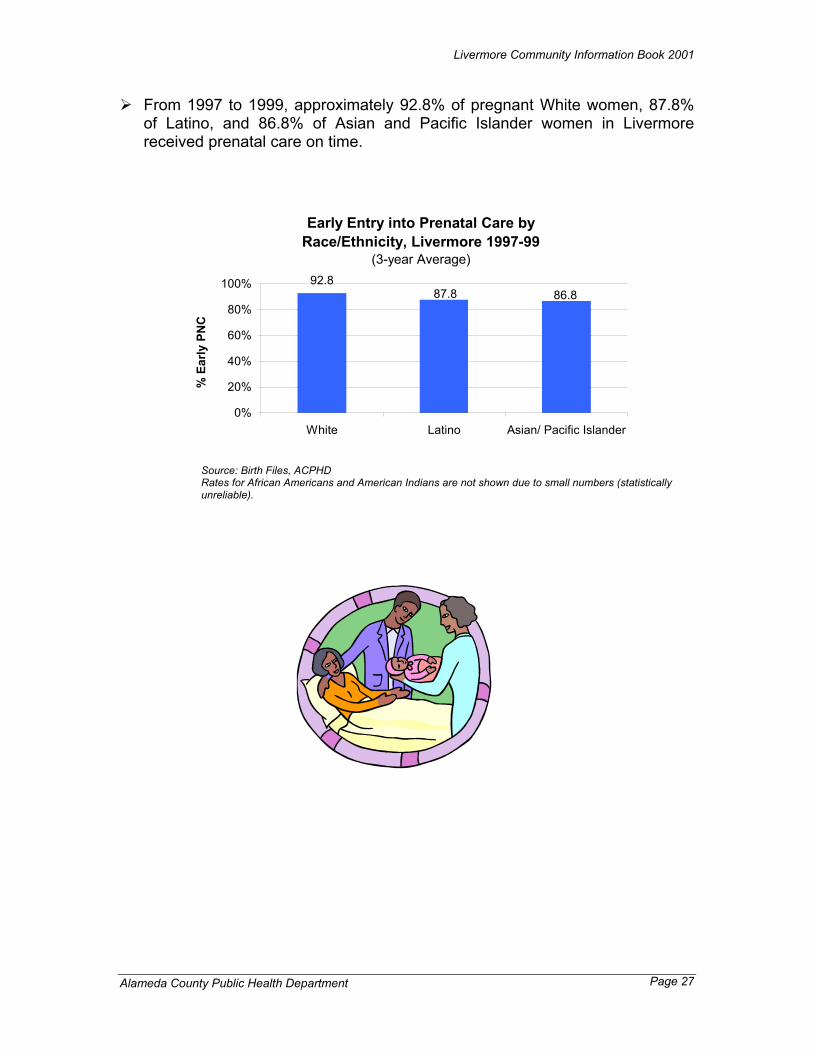
From 1997 to 1999, approximately 92.8% of pregnant White women, 87.8% of Latino, and 86.8% of Asian and Pacific Islander women in Livermore received prenatal care on time.
Source: Birth Files, ACPHD Rates for African Americans and American Indians are not shown due to small numbers (statistically unreliable).
Early Entry into Prenatal Care by Race/Ethnicity, Livermore 1997-99
(3-year Average)
86.887.892.8
0%
20%
40%
60%
80%
100%
White Latino Asian/ Pacific Islander
% E
arly
PN
C

Livermore Community Information Book 2001
Alameda County Public Health Department
Page 28
Teen Births Youth are an important part of the community. They bring to the community many assets, including their energy and creativity. Helping young people grow up to be healthy, caring, and responsible adults is one way to build a healthy community. The more assets young people have, the more likely they are to be healthy, succeed in school, resist danger, and persevere in difficult times. These assets include support from caring adults, high self-esteem, positive role models, and a positive view of his or her future. These assets help youth overcome the many challenges including lack of accessible health care, poverty, lack of after-school and community activities, violence and substance abuse. One of the major challenges teenagers face is unintentionally becoming a parent. Being a teen parent makes it more difficult for teens to achieve their educational goals, get a good job, and become financially independent. From 1997 to 1999, there was an average of 8 births per year to girls ages
15-17 in Livermore. The rate was 28.8 births per 1,000 girls, which is similar to the County rate of 24.7 per 1,000.
Teen Birth Rate1997-99 (3-year Average)
24.728.8
010203040
Livermore Alameda CountyBirt
hs p
er 1
,000
Girl
s 15
-17
Understanding Teen Births Teen births are the number of babiesborn to girls ages 15-17. The number of teen births is not thesame as the number of teenpregnancies. One study showed thatabout half (51%) of all teenpregnancies end in birth, 35% inabortion, and 14% in miscarriage(Guttmacher Institute, 1994).Therefore, the number of teenpregnancy may be much higher thanteen birth.
Source: Birth Files, ACPHD; Claritas 1999 estimates

Livermore Community Information Book 2001
Alameda County Public Health Department
Page 29
Child Abuse and Neglect Child abuse and neglect are complex issues that need to be addressed in a multitude of ways. Child abuse consists of any act that endangers or impairs a child's physical or emotional health and development. Child abuse includes physical, emotional, and sexual abuse, as well as physical and emotional neglect. Child abusers are found among people of all income levels, religious and ethnic groups, and are often ordinary people who are having problems coping with their own stressful life situation. It is very difficult to measure the actual number of child abuse cases in a community. Data reported
here is the number of cases that were investigated and confirmed by the Alameda County Social Services Agency as child abuse. Since many child abuse cases are not reported, this figure may underestimate the actual rate. The rate of child abuse cases in Livermore cannot be calculated reliably.
However, in Alameda County as a whole, as of December 1999, about 6 out of 1,000 children were confirmed as abused or neglected.
Rate of Child Abuse/Neglect: Number of abused orneglected childrenages 0-17 per 1,000.

Livermore Community Information Book 2001
Alameda County Public Health Department Page 30
Hospitalization
Information on hospitalization provides important clues to a population’s health problems. In this section, leading causes of hospitalization are shown for the zip code that covers the Livermore Community Health Team area. This is followed by sections on asthma, diabetes and injury hospitalizations. Livermore lies in zip code 94550. However, this zip code covers an area larger than the city of Livermore or the Livermore Community Health Team area. Therefore, the information on hospitalization presented here reflects the population of the larger geographic area.
What do the hospitalization data tell us? They tell us about those illnesses or injuries that are serious enough to get
people admitted to the hospital. They tell us the number of hospital discharges. Thus, a person hospitalized
twice is counted twice. They give us information at the zip code level, so if a zip code covers a large
area, we cannot know if the illnesses are evenly dispersed within that zip code or if they are concentrated in certain areas.
They do not tell us about the prevalence of a given illness in the population
since many who have the illness are not hospitalized for it.
Livermore Community Information Book 2001
Alameda County Public Health Department Page 31
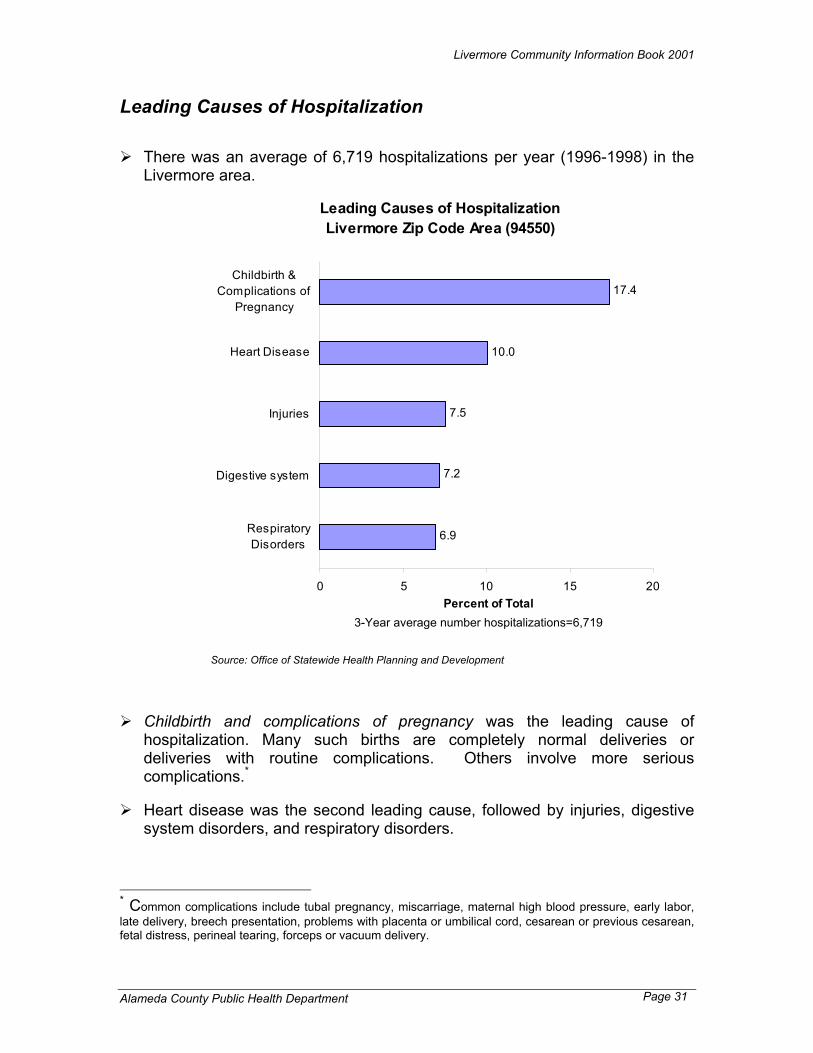
Leading Causes of Hospitalization There was an average of 6,719 hospitalizations per year (1996-1998) in the
Livermore area.
Childbirth and complications of pregnancy was the leading cause of
hospitalization. Many such births are completely normal deliveries or deliveries with routine complications. Others involve more serious complications.*
Heart disease was the second leading cause, followed by injuries, digestive
system disorders, and respiratory disorders.
* Common complications include tubal pregnancy, miscarriage, maternal high blood pressure, early labor, late delivery, breech presentation, problems with placenta or umbilical cord, cesarean or previous cesarean, fetal distress, perineal tearing, forceps or vacuum delivery.
Leading Causes of HospitalizationLivermore Zip Code Area (94550)
17.4
10.0
7.5
7.2
6.9
0 5 10 15 20
Childbirth &Complications of
Pregnancy
Heart Disease
Injuries
Digestive system
RespiratoryDisorders
Percent of Total
Source: Office of Statewide Health Planning and Development
3-Year average number hospitalizations=6,719

Livermore Community Information Book 2001
Alameda County Public Health Department Page 32
Heart Disease commonly includes high blood pressure, heart attack, blood clot in the lungs, irregular heart beat, heart failure and other kinds of heart disease, both acute and chronic.
The most common types of injuries were fractures, followed by head injuries,
other types of wounds, and poisoning. Digestive system disorders commonly include ulcers, appendicitis, abdominal
hernias, gastroenteritis, colitis, chronic liver disease, diseases of the gall bladder and pancreas.
Respiratory Disorders commonly include upper respiratory infections,
bronchitis, pneumonia, and asthma. Mental disorders, which are seen among the five leading causes of
hospitalization for some race/ethnic groups in the next section, commonly include alcohol and drug dependence and associated psychotic states, schizophrenic disorders, other types of psychotic disorders, depression, and adjustment reaction disorders.
Livermore Community Information Book 2001
Alameda County Public Health Department Page 33
The leading causes of hospitalization vary among different racial/ethnic groups and by community. The table below shows the leading causes of hospitalization for each race/ethnic group. The numbers in parentheses reflect the yearly average number of hospitalizations for a given cause.
Among Latinos, childbirth and complications of pregnancy was the leading
cause of hospitalization, followed by digestive system disorders, injuries, heart disease, and respiratory disorders.
Among African Americans, childbirth and complications of pregnancy was the
leading cause of hospitalization, followed by heart disease, mental disorders, respiratory disorders and injuries, digestive system disorders and ill-defined symptoms.**
Among Asian/Pacific Islanders, childbirth and complications of pregnancy was
the leading cause of hospitalization, followed by heart disease, respiratory disorders, digestive system disorders, mental disorders, injuries, and cancer.
Among Whites, childbirth and complications of pregnancy was the leading
cause of hospitalization, followed by heart disease, injuries, digestive system disorders, and respiratory disorders.
Asian/Pacific Islanders were the only racial/ethnic group for which cancer
ranked in the top five. Further work is needed to see if Asian/Pacific Islanders have higher rates of hospitalization for cancer or if cancer ranks in the top five
** Ill-defined symptoms constitute a group of primary diagnosis codes that capture symptoms, signs and conditions for which there is not a single definite diagnosis. In the absence of more in-depth case study or medical work-up, the main problem is coded in this group. The most common problems coded in this manner include blackouts, fainting, dizziness, chest pain and abdominal pain.
Note: Ranks for American Indians are not shown due to the small number of hospitalizations.*Includes complications of both childbirth and pregnancy.
Leading Causes of Hospitalization by Race/Ethnicity (3-Year Average, 1996-98), Zip Code 94550African Asian/
Rank Latino American Pacific Islander White1 Childbirth/Comp Preg* (164) Childbirth/Comp Preg* (18) Childbirth/Comp Preg* (58) Childbirth/Comp Preg* (866)
2 Digestive system (32) Heart Disease (15) Heart Disease (21) Heart Disease (594)
3 Injuries (31) Mental Disorders (9) Respiratory Disorders (16) Injuries (437)Digestive system (16)
4 Heart Disease (21) Respiratory Disorders (8) Mental Disorders (12) Digestive system (415)Injuries (8) Injuries (12)
5 Respiratory Disorders (17) Digestive system (6) Cancer (7) Respiratory Disorders (411)Ill-defined symptoms (6)

Livermore Community Information Book 2001
Alameda County Public Health Department Page 34
simply because other illnesses seen in other racial/ethnic groups, such as mental disorders, do not.
Heart disease ranked second, after childbirth and complications of pregnancy,
for African Americans, Asian/Pacific Islanders and Whites.

Livermore Community Information Book 2001
Alameda County Public Health Department Page 35
Hospitalization for Asthma Asthma is a serious respiratory condition that affects about 10 million people in the United States. It is more common among children than adults. The level of asthma in the population is thought to be increasing. Environmental factors, including both indoor and outdoor air pollution, may have contributed to this increase. Access to health services is important for proper treatment of asthma.
From 1996 to 1998, asthma
hospitalization rates in 94550 were highest among children 14 and under. There was an average of 63 asthma hospitalizations per year in the Livermore zip code area. Among these, 27 (43%) were children 14 and under.
The age-adjusted rate
of asthma hospitaliza-tions in 94550 was 159 per 100,000 children age 14 and under. This rate is less than half the county-wide rate, and it is well below the national Healthy People 2000 objective of 225 per 100,000 children 14 and under.
Age-Adjusted Rates of Asthma Hospitalization Children Age 14 and Under
(1996-98 Three-Year Average)
159
364
0
100
200
300
400
94550 Alameda County
Rat
e pe
r 100
,000
HP2000 Objective =225
Source: Office of Statewide Health Planning and Development
What is an age-adjusted rate? It is a single, summary number thatreflects the rate of hospitalizationsacross different age groups, but in away that is comparable to otherpopulations (communities, counties orstates) with age groups of differentsizes. (See note in section on overalldeaths).

Livermore Community Information Book 2001
Alameda County Public Health Department Page 36
A map of asthma hospitalization rates for all Alameda County zip codes is shown on the next page. These are age-adjusted rates per 100,000 people and are for the total population. The age-adjusted rate for all asthma hospitalizations in the 94550 zip code
was 84.1 per 100,000 population (based on a 3-year average of 63 hospitalizations per year, all ages).
This rate is only half the Healthy People 2000 national objective of 160
asthma hospitalizations per 100,000 population for all ages (note that this objective is slightly lower than that established for children 14 and under).
For Alameda County the comparable rate was 175.2, not far above the
national objective, but over twice the local rate. Higher rates of hospitalization for asthma may mean that there is more asthma in the population. It may also mean that those who have asthma do not obtain the medical care they need to manage their asthmatic condition. Without proper health care, asthmatics are more likely to have a severe attack that results in admission to the hospital.

Livermore Community Information Book 2001
Alameda County Public Health Department Page 37

North Oakland
San Antonio
West Oakland
Cabrillo/Centerville
Livermore
Contempo/Decoto
East OaklandFruitvale
South Hayward
Ashland/Cherryland
Chinatown
Asthma Rates per 100,000 Population>= 320 (2+ times HP2000 Goal)161 to 319 (Over HP2000 Goal)<= 160 (At or below HP2000 Goal)
Data Source: California Office of Statewide Health Planning and Development
Age-Adjusted Asthma Hospitalization Rates in Alameda County, 1996-1998 (3-Year Average)
Zip Code BoundariesCommunity Health Team Areas
Healty People 2000 Goal=160 per 100,000 population

Livermore Community Information Book 2001
Alameda County Public Health Department Page 39
Hospitalization for Diabetes There are two forms of diabetes, Type I (insulin dependent) and Type II (non-insulin dependent). About 90% of diabetes is Type II. It is estimated that about half of the Type II cases are the result of obesity. Diet, exercise, and weight control, therefore, are thought to be the primary prevention strategy in reducing the burden of Type II diabetes.
Rates of hospitalization for diabetes were highest in the oldest age groups.
There was an average of 53 diabetes hospitalizations per year in Livermore
(94550). Of these, 40 (75%) were among adults age 35 and older. The diabetes hospitalization rate among those 35-54 in Livermore was half
that at the county level, and among those 55 and older it was two-thirds that at the county level.
What is an age-specific rate? It is the rate of a disease in a single age group. It is the count ofhospitalizations in a given age group divided by the population inthat age group and expressed in units of 100,000. Age-specificrates are presented when it is important to show which age groupsare most affected by an illness.
Source: Office of Statewide Health Planning and Development *Note that rate for 35-54 in 94550 is based on small numbers and may be unstable (3yr avg=13.3).
Age-Specific Diabetes Hospitalization Rates (1996-98 Three-Year Average)
58
222
113
323
0
100
200
300
400
35 to 54 55 and over
Rat
e pe
r 100
,000
94550*Alameda County
Livermore Community Information Book 2001
Alameda County Public Health Department Page 40
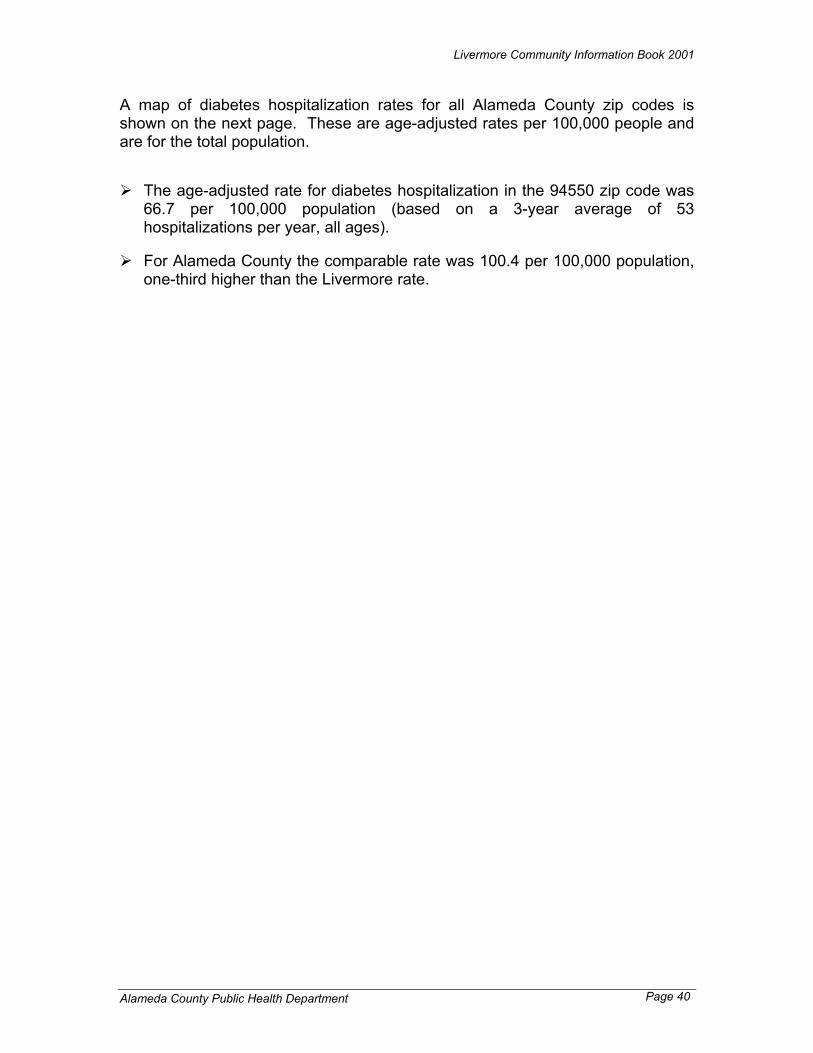
A map of diabetes hospitalization rates for all Alameda County zip codes is shown on the next page. These are age-adjusted rates per 100,000 people and are for the total population. The age-adjusted rate for diabetes hospitalization in the 94550 zip code was
66.7 per 100,000 population (based on a 3-year average of 53 hospitalizations per year, all ages).
For Alameda County the comparable rate was 100.4 per 100,000 population,
one-third higher than the Livermore rate.

Cabrillo/Centerville
Contempo/Decoto
South Hayward
Livermore
North Oakland
San AntonioWest Oakland
Chinatown
FruitvaleEast Oakland
Ashland/Cherryland
Age-Adjusted Diabetes Hospitalization Rates in Alameda County, 1996-1998 (3-Year Average)
Diabetes Rates per 100,000 Population110 - 311 (highest 1/3)54 - 109 (middle 1/3)0 - 53 (lowest 1/3)Zip Code Boundaries
Data Source: California Office of Statewide Health Planning and Development
Community Health Team Areas
Livermore Community Information Book 2001
Alameda County Public Health Department Page 42
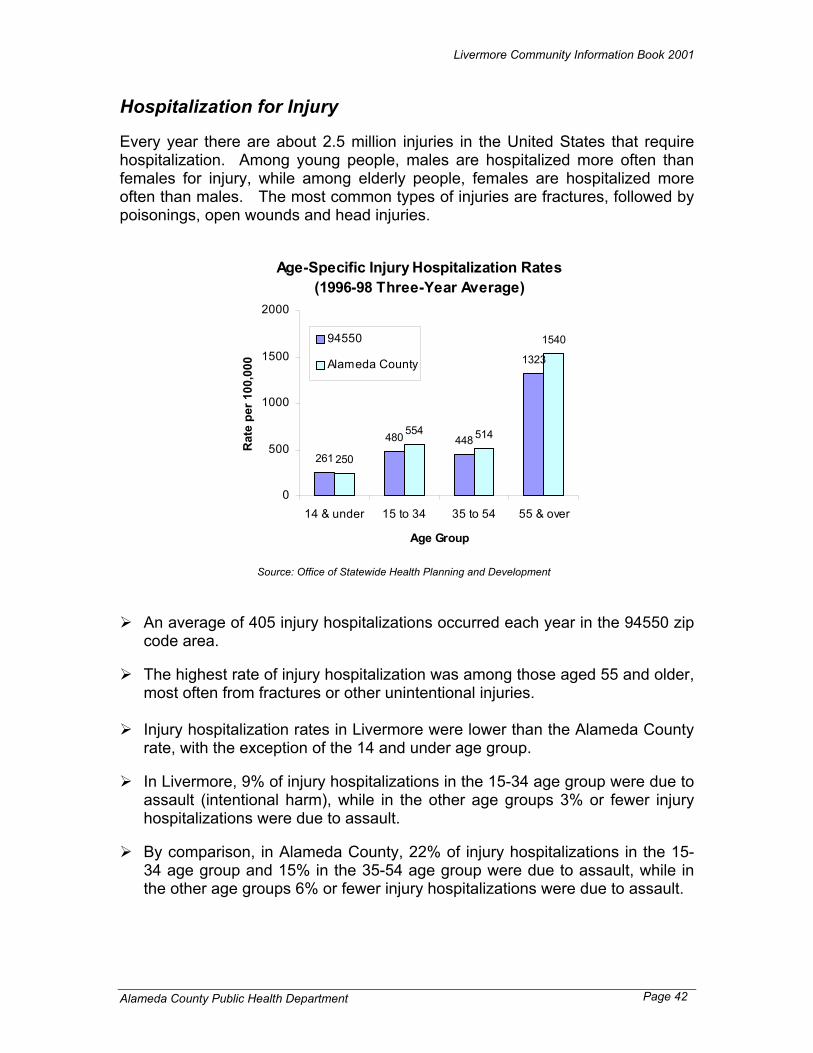
Hospitalization for Injury Every year there are about 2.5 million injuries in the United States that require hospitalization. Among young people, males are hospitalized more often than females for injury, while among elderly people, females are hospitalized more often than males. The most common types of injuries are fractures, followed by poisonings, open wounds and head injuries.
An average of 405 injury hospitalizations occurred each year in the 94550 zip
code area. The highest rate of injury hospitalization was among those aged 55 and older,
most often from fractures or other unintentional injuries. Injury hospitalization rates in Livermore were lower than the Alameda County
rate, with the exception of the 14 and under age group. In Livermore, 9% of injury hospitalizations in the 15-34 age group were due to
assault (intentional harm), while in the other age groups 3% or fewer injury hospitalizations were due to assault.
By comparison, in Alameda County, 22% of injury hospitalizations in the 15-
34 age group and 15% in the 35-54 age group were due to assault, while in the other age groups 6% or fewer injury hospitalizations were due to assault.
Source: Office of Statewide Health Planning and Development
Age-Specific Injury Hospitalization Rates (1996-98 Three-Year Average)
261
480 448
1323
250
554 514
1540
0
500
1000
1500
2000
14 & under 15 to 34 35 to 54 55 & over
Age Group
Rat
e pe
r 100
,000
94550
Alameda County

Livermore Community Information Book 2001
Alameda County Public Health Department Page 43
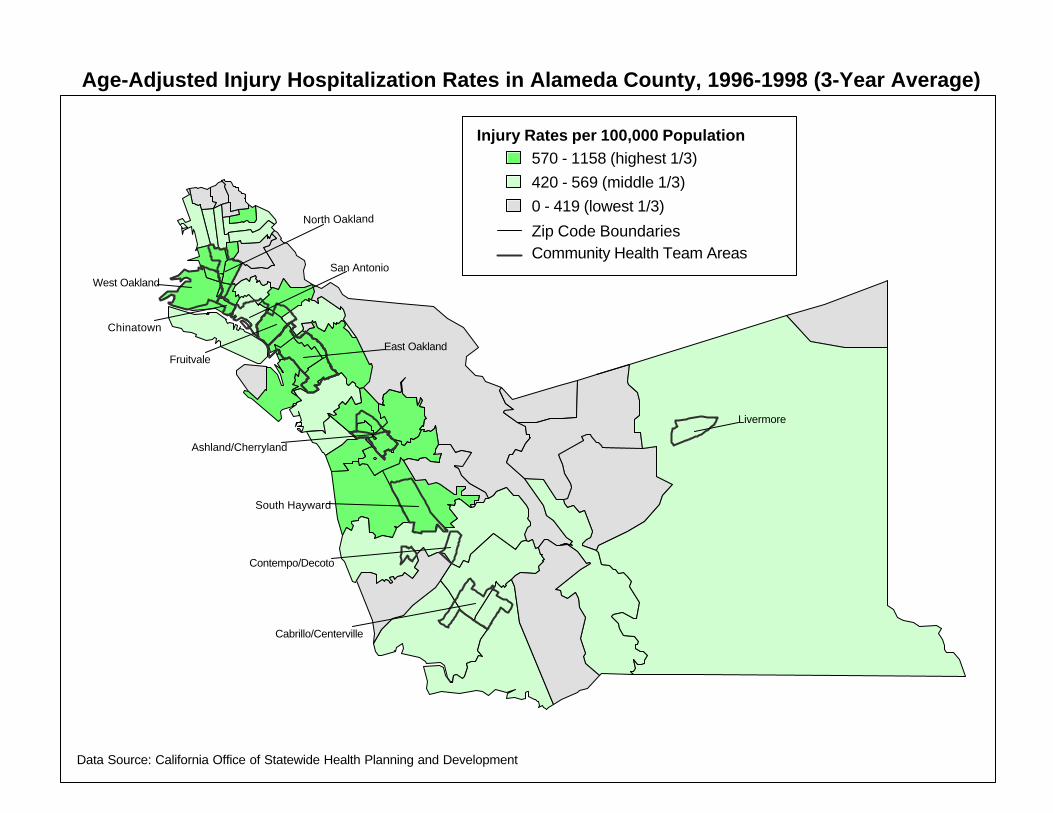
A map of injury hospitalization rates for all Alameda County zip codes is shown on the next page. These are age-adjusted rates per 100,000 people and are for the total population. The age-adjusted rate of injury hospitalization in 94550 was 500.6 per
100,000 (based on a three-year average of 405 injury hospitalizations). For Alameda County the comparable rate was 553.5 per 100,000 population,
slightly higher than the Livermore rate.
Cabrillo/Centerville
Contempo/Decoto
South Hayward
Livermore
North Oakland
San AntonioWest Oakland
Chinatown
FruitvaleEast Oakland
Ashland/Cherryland
Age-Adjusted Injury Hospitalization Rates in Alameda County, 1996-1998 (3-Year Average)
Injury Rates per 100,000 Population570 - 1158 (highest 1/3)420 - 569 (middle 1/3)0 - 419 (lowest 1/3)
Community Health Team Areas
Data Source: California Office of Statewide Health Planning and Development
Zip Code Boundaries

Livermore Community Information Book 2001
Alameda County Public Health Department Page 45
Overall Deaths
Information on deaths plays an important role in assessing the health status of a community. Data collected from death certificates can provide information about the frequency and the seriousness of disease or injury as it occurs in a community and can guide prevention efforts. In this section, we examine how many people are dying, who is dying and of what causes, and present the overall age-adjusted death rate and the leading causes of death.
The overall age-adjusted death rate in Livermore for the years 1996-98 was
373.4 deaths per 100,000 residents per year.♣ This rate was lower than Alameda County’s rate of 431.7 deaths per 100,000.
♣ Adjusted to 1940 US standard population
Age-Adjusted Death Rate: An age-adjusted death rate is a measure of the number of deaths in acommunity that takes into account the age distribution of the population. It isexpressed as the number of deaths per 100,000 people. The main purposefor using age-adjusted death rates is to compare the rates from onepopulation to that of another population. For example, one community mayhave a large population of seniors, while another community may have a lot ofyoung families with children. The community with more seniors is more likelyto have a higher number of deaths than the younger community. Therefore, itis difficult to compare these two communities without taking into account thedifferent age make-up of each community. By using this measure, we adjustfor the differences in the age make-up of the community so that we cancompare across different communities.
Source: Alameda County Public Health Department Vital Statistics
Overall Age-Adjusted Death Rate Livermore and Alameda County
1996-98 (3-year Average)
373.4431.7
0100200300400500
Livermore Alameda County
Dea
ths
per 1
00,0
00
Livermore Community Information Book 2001
Alameda County Public Health Department Page 46
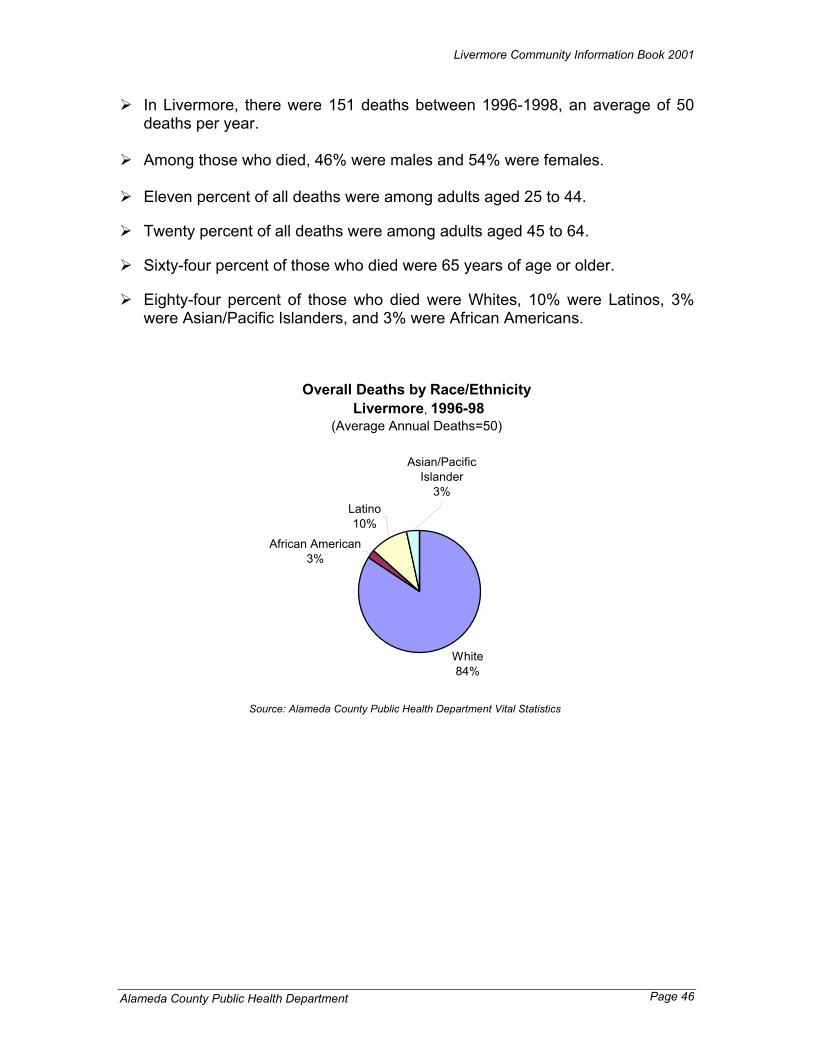
In Livermore, there were 151 deaths between 1996-1998, an average of 50 deaths per year. Among those who died, 46% were males and 54% were females.
Eleven percent of all deaths were among adults aged 25 to 44.
Twenty percent of all deaths were among adults aged 45 to 64.
Sixty-four percent of those who died were 65 years of age or older.
Eighty-four percent of those who died were Whites, 10% were Latinos, 3% were Asian/Pacific Islanders, and 3% were African Americans.
Source: Alameda County Public Health Department Vital Statistics
Overall Deaths by Race/Ethnicity Livermore, 1996-98
(Average Annual Deaths=50)
White84%
African American3%
Latino10%
Asian/Pacific Islander
3%
Livermore Community Information Book 2001
Alameda County Public Health Department Page 47
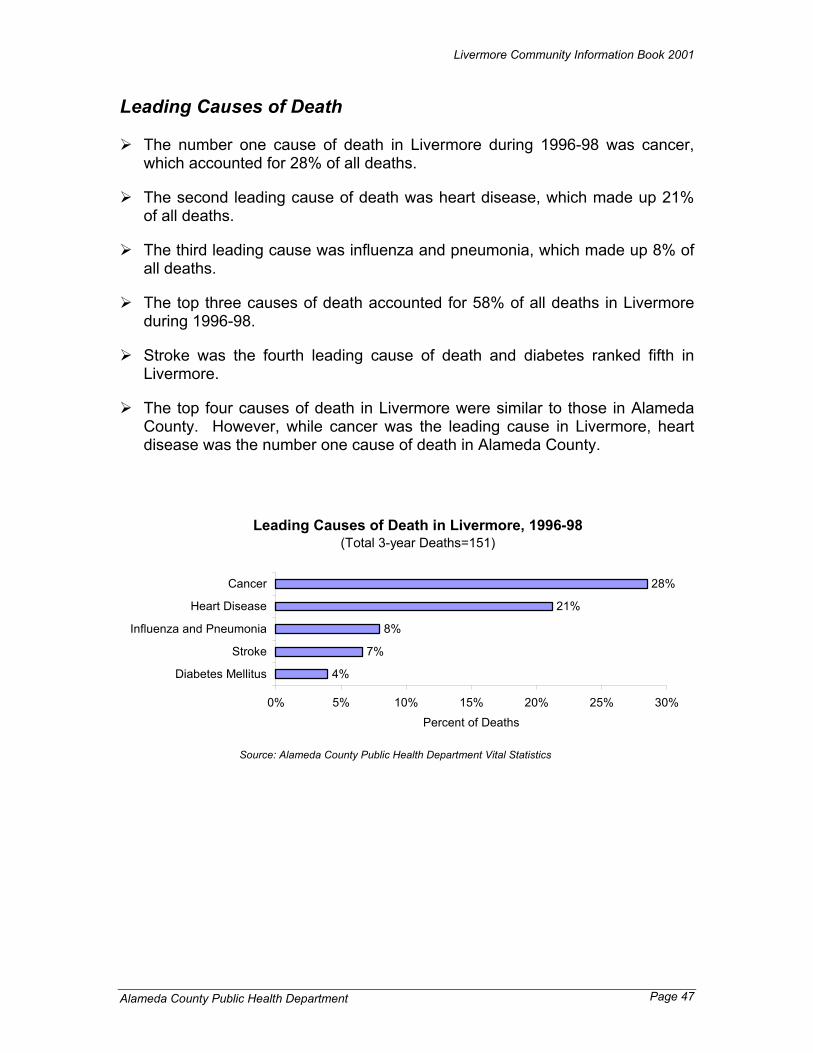
Leading Causes of Death The number one cause of death in Livermore during 1996-98 was cancer,
which accounted for 28% of all deaths.
The second leading cause of death was heart disease, which made up 21% of all deaths.
The third leading cause was influenza and pneumonia, which made up 8% of all deaths.
The top three causes of death accounted for 58% of all deaths in Livermore during 1996-98.
Stroke was the fourth leading cause of death and diabetes ranked fifth in Livermore.
The top four causes of death in Livermore were similar to those in Alameda County. However, while cancer was the leading cause in Livermore, heart disease was the number one cause of death in Alameda County.
Source: Alameda County Public Health Department Vital Statistics
Leading Causes of Death in Livermore, 1996-98 (Total 3-year Deaths=151)
4%
7%
8%
21%
28%
0% 5% 10% 15% 20% 25% 30%
Diabetes Mellitus
Stroke
Influenza and Pneumonia
Heart Disease
Cancer
Percent of Deaths
Livermore Community Information Book 2001
Alameda County Public Health Department Page 48
Leading Causes of Death by Age
Cancer was the leading cause of death for adults aged 25 years and older in Livermore. Cancer accounted for 35% of all deaths in the 25 to 44 age group, 37% in the 45 to 64 age group, and 27% in the 65 and older age group.
For seniors aged 65 and older, heart disease was the second leading cause
of death and accounted for 23% of all deaths in this age group. Leading Causes of Death by Sex
For both sexes, the number one cause of death was cancer, followed by heart disease.
The two leading causes of death accounted for 49% of all deaths among
males, and 51% among females. Leading Causes of Death by Race and Ethnicity
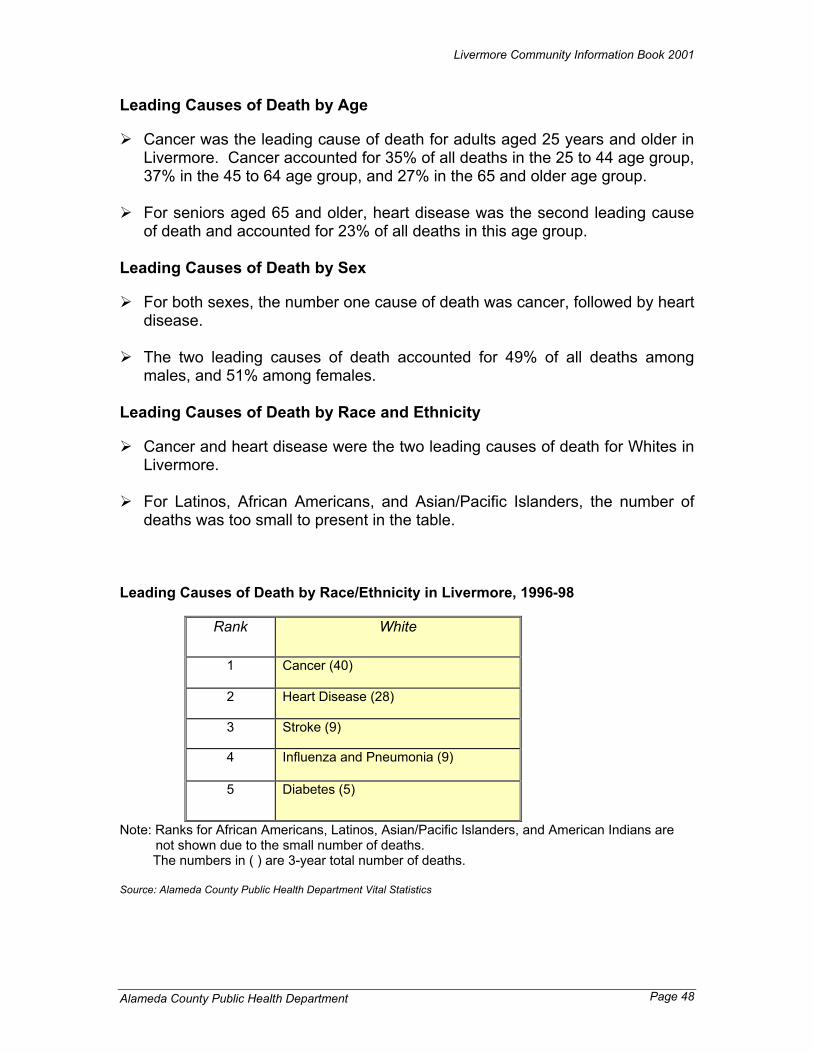
Cancer and heart disease were the two leading causes of death for Whites in Livermore.
For Latinos, African Americans, and Asian/Pacific Islanders, the number of
deaths was too small to present in the table.
Leading Causes of Death by Race/Ethnicity in Livermore, 1996-98
Rank White
1 Cancer (40)
2 Heart Disease (28)
3 Stroke (9)
4 Influenza and Pneumonia (9)
5 Diabetes (5)
Note: Ranks for African Americans, Latinos, Asian/Pacific Islanders, and American Indians are not shown due to the small number of deaths.
The numbers in ( ) are 3-year total number of deaths. Source: Alameda County Public Health Department Vital Statistics

Livermore Community Information Book 2001
Alameda County Public Health Department Page 49
Education
School Profiles
Schools are core institutions in the neighborhood. The table that follows contains information on schools in the Livermore Valley Joint Unified School District. The information is provided by the California Department of Education and is based on enrollment for the 1999-2000 school year. Terms used in the school profile tables are defined in the box below. Each school in the district is listed in alphabetical order by name.
Grade Span is the range of grade levels attending a given school. ‘UG’ thatappears in some cases stands for ‘Ungraded.’ Enrollment is the number of students formally enrolled in the school. English Learners are those students whose primary language is not Englishand who are not proficient in a range of English language skills. Four-Year Drop-out Rate is an estimate of the percent of students whowould drop out in a four year period based on the single year dropout rate of9th through 12th graders. The information is only presented for schools thathave grades 9-12 attending. All other schools have ‘**’ in the column. Pupil/Teacher Ratio is the school enrollment divided by the number of full-time teachers. Average Class Size is the school enrollment divided by the number ofclasses. Free or Reduced Price Meals. This is the number of eligible economicallydisadvantaged students who are signed up for the program. CalWORKs is the number of students participating in the California WorkOpportunity and Responsibility to Kids welfare reform program.

SchoolGrade Span Enrollment English Learners
4-Year Dropout
Rate
Pupil/ Teacher
Ratio
Avg. Class Size
Free or Reduced Price Meals
CalWORKs (formerly AFDC)
ALMOND AVENUE ELEMENTARY K to 5 609 10 (1.6 %) ** 19.9 22.2 21 (3.5%) 0 (0.0%)
ALTAMONT CREEK ELEMENTARY K to 5 0 0 (0.0 %) ** 0.0 0.0 0 (0.0%) 0 (0.0%)
ARROYO MOCHO ELEMENTARY K to 5 503 7 (1.4 %) ** 20.1 20.6 22 (4.4%) 0 (0.0%)
ARROYO SECO ELEMENTARY K to 5 644 59 (9.2 %) ** 19.8 22.2 106 (13.9%) 23 (3.0%)
CHRISTENSEN (ANDREW N.) MIDDLE 3 to 8 884 51 (5.8 %) ** 32.0 26.7 100 (10.1%) 19 (1.9%)
CROCE (LEO R.) ELEMENTARY K to 2 773 50 (6.5 %) ** 16.7 18.6 74 (8.6%) 14 (1.6%)
DEL VALLE CONTINUATION HIGH 7 to 12 116 6 (5.2 %) ** 16.6 17.3 12 (10.1%) 0 (0.0%)
EAST AVENUE MIDDLE 6 to 8 844 89 (10.5 %) ** 27.8 27.2 125 (13.6%) 34 (3.7%)
GRANADA HIGH 9 to 12 1,741 56 (3.2 %) 0.0 % 24.0 25.6 90 (5.2%) 55 (3.2%)
JACKSON AVENUE ELEMENTARY K to 5 533 107 (20.1 %) ** 16.5 20.3 174 (27.8%) 50 (8.0%)
JUNCTION AVENUE MIDDLE 6 to 8 774 80 (10.3 %) ** 24.6 29.3 163 (19.5%) 38 (4.6%)
LIVERMORE HIGH 9 to 12 1,818 97 (5.3 %) 1.3 % 25.6 27.1 133 (7.3%) 46 (2.5%)
MARYLIN AVENUE ELEMENTARY K to 5 529 134 (25.3 %) ** 20.5 21.2 207 (36.9%) 42 (7.5%)
MICHELL (JOE) ELEMENTARY K to 5 423 54 (12.8 %) ** 15.8 20.6 99 (21.3%) 9 (1.9%)
PHOENIX HIGH (CONT.) 9 to 12 71 7 (9.9 %) 0.0 % 71.0 0.0 9 (12.0%) 0 (0.0%)
PORTOLA (DON GASPAR DE) ELEMENTARY K to 5 537 147 (27.4 %) ** 15.0 20.6 217 (35.4%) 31 (5.1%)
RANCHO LAS POSITAS ELEMENTARY K to 5 645 13 (2.0 %) ** 21.4 22.0 43 (6.2%) 18 (2.6%)
SMITH (EMMA C.) ELEMENTARY K to 5 487 17 (3.5 %) ** 18.4 22.5 30 (5.3%) 4 (0.7%)
SUNSET ELEMENTARY K to 5 597 3 (0.5 %) ** 19.1 22.5 10 (1.4%) 13 (1.8%)
VINEYARD ALTERNATIVE 1 to 12 219 5 (2.3 %) 0.0 % 109.5 0.0 3 (1.4%) 0 (0.0%)
WILLIAM MENDENHALL MIDDLE 6 to 8 830 18 (2.2 %) ** 24.6 27.4 54 (6.0%) 13 (1.4%)
District Total: K to 12 13,577 1,010 ( 7.4 %) 2.1 % 21.2 25.7 1,692 (11.6%) 409 (2.8%)
County Total 217,080 44,437 ( 20.5 %) 9.3 % 20.0 26.3 71,328 (32.6%) 28,075 (12.8%)
State Totals: 5,951,612 1,480,527 (24.9%) 11.1 % 20.9 26.7 2,809,186 (47.3%) 850,379 (14.3%)Source: California Department of Education, Educational Demographics Unit (http://www.cde.ca.gov)
LIVERMORE VALLEY JOINT UNIFIED SCHOOL DISTRICT - 1999-2000 School Year
Page 50

Livermore Community Information Book 2001
Alameda County Public Health Department Page 51
Government There are many levels of government, including city, county, state, and national. Below is a partial listing of elected officials that represent Livermore. For additional information about the officials and how to contact them, please see the following pages. Government Districts Elected Official Livermore City Council At large Cathie Brown, Mayor
Lorraine Dietrich, Vice Mayor
Tom Reitter John Stein Thomas E. ‘Tom’ Vargas
Alameda County Board of Supervisors
County Supervisorial District 1
Scott Haggerty
California State Assembly
State Assembly District 15
Lynne C. Leach
California State Senate State Senate District 7 Tom Torlakson
U.S. Congress U.S. Congress District 10 Ellen Tauscher
U.S. Senate Barbara Boxer Dianne Feinstein

Livermore City Council
http://www.ci.livermore.ca.us/council.html Page 52
Government: City Council
City Council: Council
Mayor
Cathie Brown (925) [email protected]
Vice Mayor
Lorraine Dietrich(925)[email protected]
Council Members
Tom Reitter(925) [email protected]
John Stein (925) [email protected]
Thomas E. 'Tom' Vargas(925) 373-5130 [email protected]

Livermore City Council
http://www.ci.livermore.ca.us/council.html Page 53
Council Meetings Second and fourth Mondays of each month7:00 p.m.Council Chambers3575 Pacific Avenue
Agenda packets are available at city library branches on the Friday before the meeting.
Board of Supervisors - Alameda County
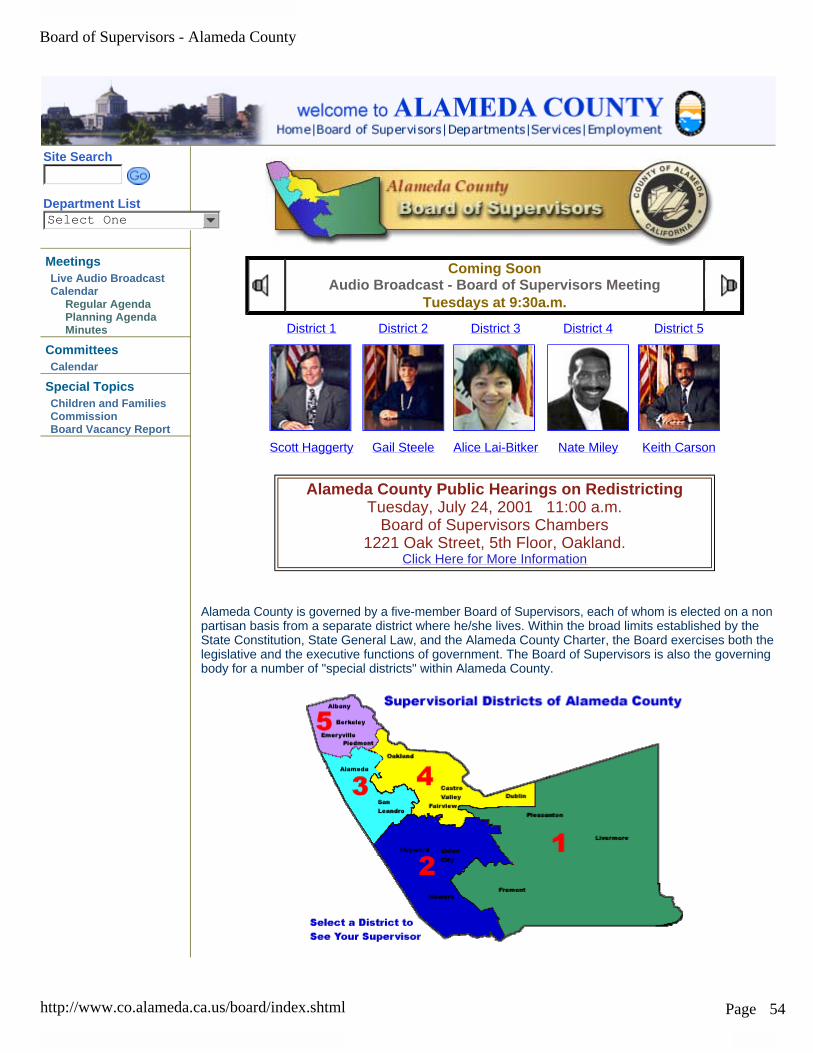
http://www.co.alameda.ca.us/board/index.shtml Page 54
Alameda County is governed by a five-member Board of Supervisors, each of whom is elected on a nonpartisan basis from a separate district where he/she lives. Within the broad limits established by the State Constitution, State General Law, and the Alameda County Charter, the Board exercises both the legislative and the executive functions of government. The Board of Supervisors is also the governing body for a number of "special districts" within Alameda County.
Coming SoonAudio Broadcast - Board of Supervisors Meeting
Tuesdays at 9:30a.m. District 1 District 2 District 3 District 4 District 5
Scott Haggerty Gail Steele Alice Lai-Bitker Nate Miley Keith Carson
Alameda County Public Hearings on Redistricting Tuesday, July 24, 2001 11:00 a.m.
Board of Supervisors Chambers1221 Oak Street, 5th Floor, Oakland.
Click Here for More Information
MeetingsLive Audio BroadcastCalendar
Regular AgendaPlanning AgendaMinutes
CommitteesCalendar
Special TopicsChildren and Families CommissionBoard Vacancy Report
Site Search
Department List
Select One

Board of Supervisors - Alameda County
http://www.co.alameda.ca.us/board/index.shtml Page 55
To make the supervisorial districts equal in population, the boundaries are adjusted every ten years through the process called "redistricting." That process is underway (click here for more information). Terms of office for the Supervisors are four years. Alternate elections are held every two years for threesupervisors and then for two supervisors. The salary of the Board members is fixed by the Board itself.A President of the Board, chosen from the membership of the Board every two years, presides at all meetings of the Board and appoints committees to handle work involving the major programs of the County.
! As defined by the Alameda County Charter, the duties of the Board of Supervisors are as follow! Appoint most County officers and employees, except elected officials! Provide for the compensation of all County officials and employees! Create officers, boards, and commissions as needed, appointing the members and fixing the
terms of office! Award all contracts for public works! Adopt an annual budget! Provide, publish, and enforce a complete code of rules prescribing the duties and the systems o
office and management, accounts, and reports for each County department! Have an annual audit made of all County accounts, books, and records! Supervise the operations of departments and exercise executive and administrative authority
throughout County government! Serve as appellate body for employee grievances, planning and zoning
The Board of Supervisors meets at 8:30 a.m. for closed sessions and at 9:30 a.m. for regular calendar on Tuesday mornings at the County Administration Building, 1221 Oak Street, Oakland, in the 5th FlooBoard Chambers. All meetings are open to the public, and residents are encouraged to attend. Clickhere for specific agenda information, or contact the Clerk, Board of Supervisors, at (510) 272-6347.
Sister Site
Alameda County has a sister county in Taiwan! Learn more about Taoyuan, our Sister County.
Alameda County Home | Board of Supervisors | Departments | Services | Employment
Board of Supervisors - Alameda County
About - Supervisor Scott Haggerty - Alameda County District 1
http://www.co.alameda.ca.us/board/scott.shtml Page 56
Board Home
About Scott Haggerty
Earthquake Info
Contact Us
Site Search
Department List
Select One
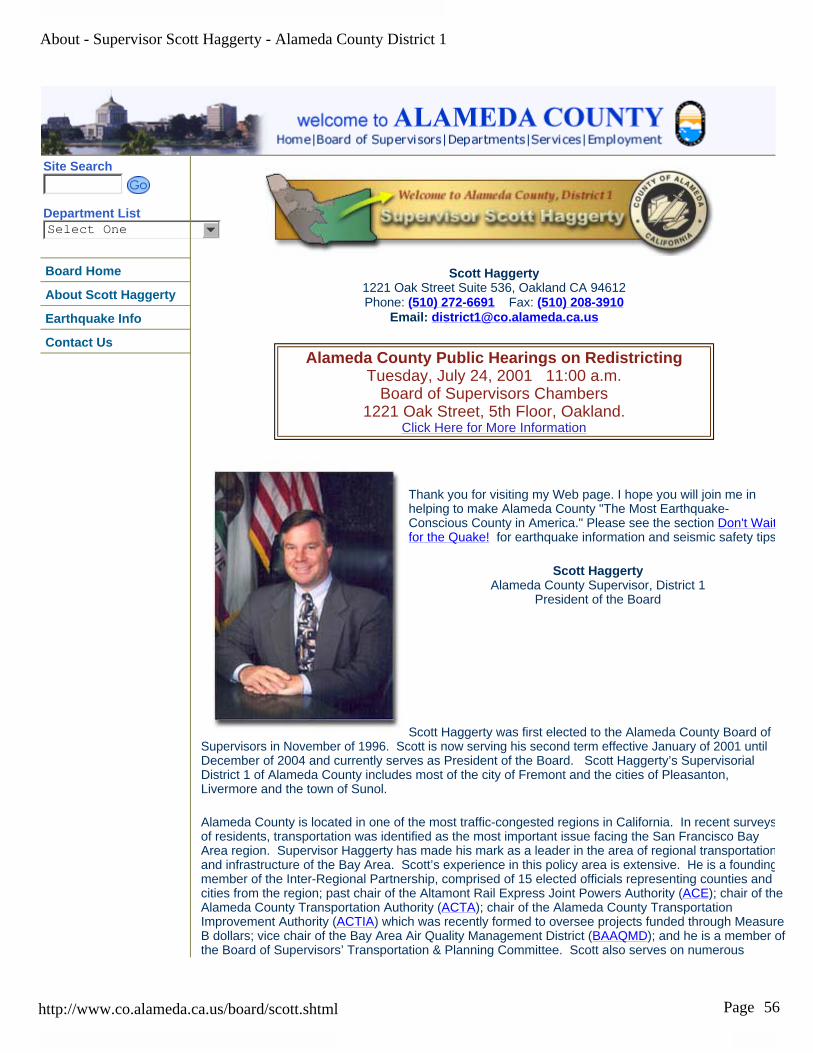
Scott Haggerty1221 Oak Street Suite 536, Oakland CA 94612 Phone: (510) 272-6691 Fax: (510) 208-3910
Email: [email protected]
Thank you for visiting my Web page. I hope you will join me in helping to make Alameda County "The Most Earthquake-Conscious County in America." Please see the section Don't Waitfor the Quake! for earthquake information and seismic safety tips
Scott HaggertyAlameda County Supervisor, District 1
President of the Board
Scott Haggerty was first elected to the Alameda County Board of Supervisors in November of 1996. Scott is now serving his second term effective January of 2001 untilDecember of 2004 and currently serves as President of the Board. Scott Haggerty’s Supervisorial District 1 of Alameda County includes most of the city of Fremont and the cities of Pleasanton, Livermore and the town of Sunol.
Alameda County is located in one of the most traffic-congested regions in California. In recent surveysof residents, transportation was identified as the most important issue facing the San Francisco Bay Area region. Supervisor Haggerty has made his mark as a leader in the area of regional transportationand infrastructure of the Bay Area. Scott’s experience in this policy area is extensive. He is a foundingmember of the Inter-Regional Partnership, comprised of 15 elected officials representing counties and cities from the region; past chair of the Altamont Rail Express Joint Powers Authority (ACE); chair of theAlameda County Transportation Authority (ACTA); chair of the Alameda County Transportation Improvement Authority (ACTIA) which was recently formed to oversee projects funded through MeasureB dollars; vice chair of the Bay Area Air Quality Management District (BAAQMD); and he is a member ofthe Board of Supervisors’ Transportation & Planning Committee. Scott also serves on numerous
Alameda County Public Hearings on Redistricting Tuesday, July 24, 2001 11:00 a.m.
Board of Supervisors Chambers1221 Oak Street, 5th Floor, Oakland.
Click Here for More Information
About - Supervisor Scott Haggerty - Alameda County District 1
http://www.co.alameda.ca.us/board/scott.shtml Page 57
regional transportation boards including; the Livermore-Amador Valley Transit Authority (LAVTA); the Alameda County Congestion Management Authority (CMA) and his most recent appointment to the Metropolitan Transportation Commission (MTC). MTC is responsible for allocating state and federal dollars to regional transportation projects. Scott is currently involved with a coalition of elected officialsin the Tri-Valley region to ensure that BART’s (Bay Area Rapid Transit) extension to Livermore is completed. Scott has also played a key role in discussions with Santa Clara County to extend BART toSan Jose.
In addition to his leadership in the transportation arena, Supervisor Haggerty places strong priorities in the field of public safety. Scott was appointed by then-Governor Pete Wilson to the California State Seismic Safety Commission. He is a member of the Alameda County Collaborating Agencies Responding to Disasters (CARD) Board of Directors. Scott also chairs the Alameda County Board of Supervisors Public Protection Committee and has been very active on paramedic and trauma issues.
Scott’s appointment to other boards and commissions as the representative for Alameda County include: the Association of Bay Area Governments (ABAG); East Bay Regional Park District County Liaison Committee (EBRPD); Local Agency Formation Commission (LAFCO); and the Tri-Valley Transportation Council (TVTC). Scott was also elected President of the Commission of the Oakland-Alameda County Coliseum Authority (also known as the JPA), to which he was recently appointed.
Supervisor Haggerty is active in community activities and serves as a board member of the Joseph Matteucci Foundation, Goodwill Industries of the East Bay, and Alameda County Meals on Wheels. Scott has also served as chair of the Twin Valley District of the Boys Scouts of America.
Supervisor Haggerty was raised in Fremont and now resides in Livermore. Scott is married to Karen Hunter Haggerty and has three young children.
DON'T WAIT FOR THE QUAKE!
Alameda County Home | Board of Supervisors | Departments | Services | Employment
About - Supervisor Scott Haggerty - Alameda County District 1
California Assembly District 15
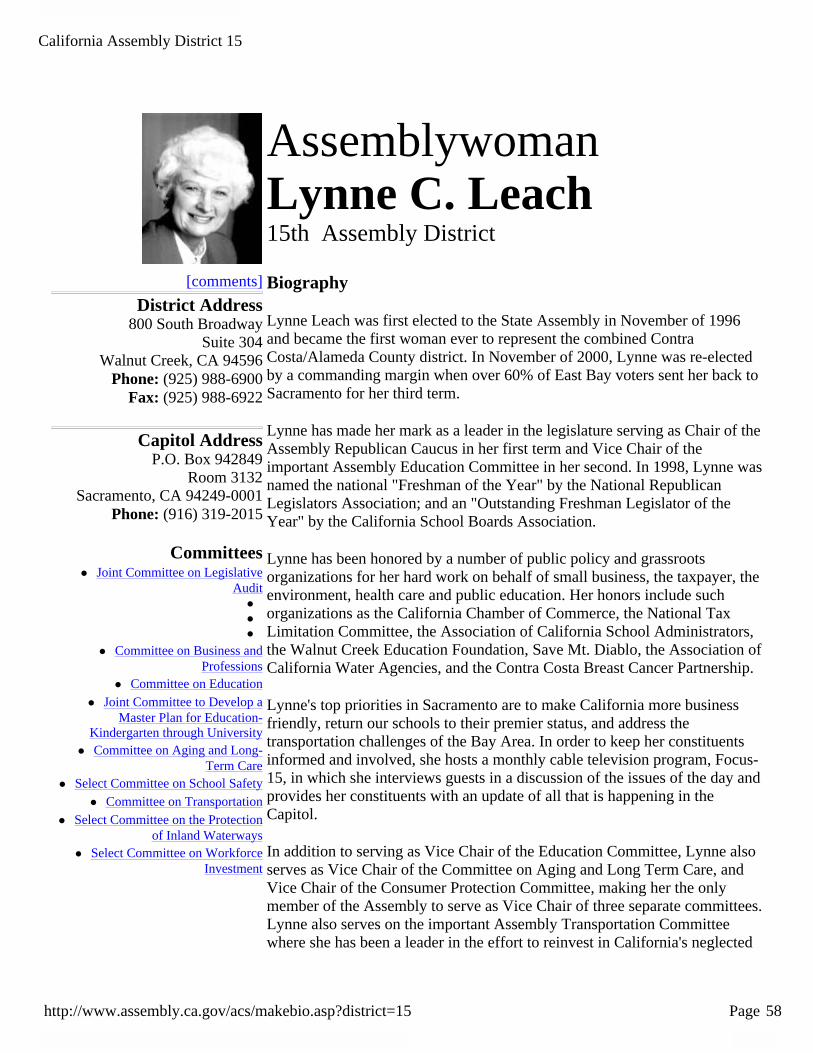
http://www.assembly.ca.gov/acs/makebio.asp?district=15 Page 58
AssemblywomanLynne C. Leach 15th Assembly District
[comments] District Address
800 South Broadway Suite 304
Walnut Creek, CA 94596Phone: (925) 988-6900
Fax: (925) 988-6922
Capitol AddressP.O. Box 942849
Room 3132 Sacramento, CA 94249-0001
Phone: (916) 319-2015
Committees! Joint Committee on Legislative
Audit !
!
!
! Committee on Business andProfessions
! Committee on Education ! Joint Committee to Develop a
Master Plan for Education-Kindergarten through University
! Committee on Aging and Long-Term Care
! Select Committee on School Safety ! Committee on Transportation
! Select Committee on the Protectionof Inland Waterways
! Select Committee on WorkforceInvestment
Biography
Lynne Leach was first elected to the State Assembly in November of 1996 and became the first woman ever to represent the combined Contra Costa/Alameda County district. In November of 2000, Lynne was re-elected by a commanding margin when over 60% of East Bay voters sent her back to Sacramento for her third term.
Lynne has made her mark as a leader in the legislature serving as Chair of the Assembly Republican Caucus in her first term and Vice Chair of the important Assembly Education Committee in her second. In 1998, Lynne was named the national "Freshman of the Year" by the National Republican Legislators Association; and an "Outstanding Freshman Legislator of the Year" by the California School Boards Association.
Lynne has been honored by a number of public policy and grassroots organizations for her hard work on behalf of small business, the taxpayer, the environment, health care and public education. Her honors include such organizations as the California Chamber of Commerce, the National Tax Limitation Committee, the Association of California School Administrators, the Walnut Creek Education Foundation, Save Mt. Diablo, the Association of California Water Agencies, and the Contra Costa Breast Cancer Partnership.
Lynne's top priorities in Sacramento are to make California more business friendly, return our schools to their premier status, and address the transportation challenges of the Bay Area. In order to keep her constituents informed and involved, she hosts a monthly cable television program, Focus-15, in which she interviews guests in a discussion of the issues of the day and provides her constituents with an update of all that is happening in the Capitol.
In addition to serving as Vice Chair of the Education Committee, Lynne also serves as Vice Chair of the Committee on Aging and Long Term Care, and Vice Chair of the Consumer Protection Committee, making her the only member of the Assembly to serve as Vice Chair of three separate committees. Lynne also serves on the important Assembly Transportation Committee where she has been a leader in the effort to reinvest in California's neglected
California Assembly District 15
http://www.assembly.ca.gov/acs/makebio.asp?district=15 Page 59
Return to California Assembly Home Page
infrastructure and highway system. She has also been a leader in the effort to get a fourth bore in the Caldecott Tunnel.
Before running for the State Assembly, Lynne was a businesswoman and has spent the past thirty-plus years in sales. In 1978, she started her own business, Applied Business Communications, Inc., which specializes in sales, customer service and communication training. Her activism in the business community includes serving as President of the Walnut Creek Chamber of Commerce where she has been a member since 1967.
Lynne's other civic activities have included the Contra Costa Sheriff's Posse, the Alameda and Contra Costa 100 Clubs, and serving on advisory boards for the Boy Scouts, YMCA, Diablo Valley College, and the Lamorinda National Bank. Lynne has also been an active volunteer in local elementary schools and has been a member of the Walnut Creek Presbyterian Church since 1972.
In 1988, Lynne was elected to the Contra Costa County Republican Central Committee and served as its Chairman from 1991-1995. During her tenure she introduced the successful BOOT CAMP (an annual candidate training program) and the R.E.V.O.L.T. Committee (Republicans Educating Voters on Lower Taxes).
A Chicago native, Lynne was raised in a blue-collar family. Her father was a sheetmetal worker and active union member and her mother was a full time homemaker. Lynne worked her way through college and in 1963 graduated from Roosevelt University with a degree in Psychology. In 1964, she and her husband Bob moved to Berkeley and then to Walnut Creek in 1967 where they raised their two grown children, Carol and Brian. One of few legislators to commute, Lynne drives to Sacramento each day from her home in Walnut Creek so that she may better serve the district she is honored to represent.
About - Supervisor Scott Haggerty - Alameda County District 1

Senate Majority Caucus Member
http://democrats.sen.ca.../gov.ca.senate.democrats.pub.members.memDisplayHome?district=sd0 Page 60
Tom TorlaksonD-AntiochSenate District 07
Welcome to my web page. This is a great way for you to contact me, learn more about my legislation, read my news releases, and view a map of the 7th Senate District.
It is my privilege to represent the District. Please tour this web page and learn more about my efforts to help our communities become even better places to live, work, go to school, and raise our families. I encourage you to bookmark this site.
The page provides information on my bills including the full text, status, analysis, and votes; my Senate news releases; information about my committee assignments; and links to other resources.
Click on Feedback to send me a message. When you contact me, I will listen and respond promptly. I look forward to hearing from you!
News from Tom TorlaksonEnergy Conservation --Tom's StatementEnergy Issues -- Tom'sVoting RecordFitness Month Tips fromTomJohn Marsh Home
RELEVANT WEB LINKSCalifornia IndependentSystem OperatorConsumer EnergyInformationElectricity -- Save it ThisSummerFood Fit -- NutritionInformationHealth.Com HealthInformationSports and Fitness atactive.comSports and RecreationInformation
State Capitol, Room 2068Sacramento, CA 95814(916) 445-6083Fax (916) 445-2527
2801 Concord BoulevardConcord, CA 94519(925) 602-6593Fax (925) 602-6598
Joint Governmental Center420 West 3rd StreetAntioch, CA 94509(925) 754-1461Fax (925) 778-5174
Dublin Satellite Office100 Civic PlazaDublin, CA 94568(925) 560-6380Fax (925) 829-7318
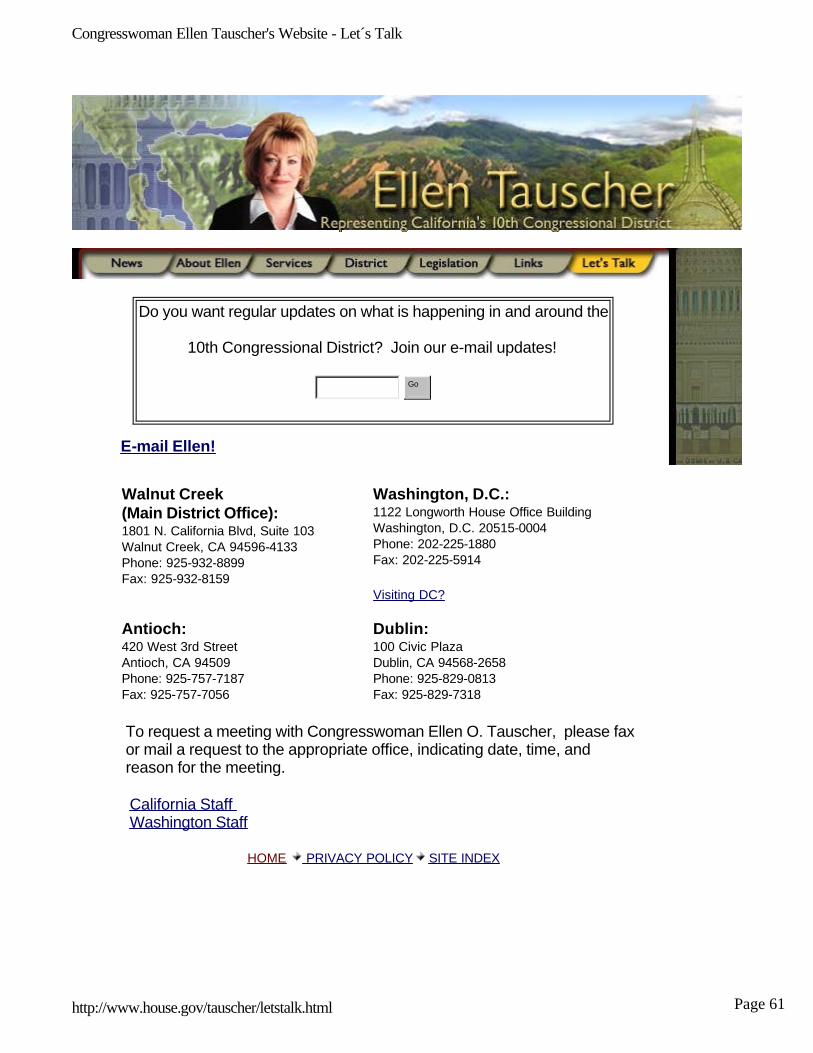
Congresswoman Ellen Tauscher's Website - Let´s Talk
http://www.house.gov/tauscher/letstalk.html Page Page 61
To request a meeting with Congresswoman Ellen O. Tauscher, please fax or mail a request to the appropriate office, indicating date, time, and reason for the meeting.
California Staff Washington Staff
HOME PRIVACY POLICY SITE INDEX
Do you want regular updates on what is happening in and around the
10th Congressional District? Join our e-mail updates!
Go
E-mail Ellen!
Walnut Creek (Main District Office): 1801 N. California Blvd, Suite 103 Walnut Creek, CA 94596-4133 Phone: 925-932-8899 Fax: 925-932-8159
Washington, D.C.:1122 Longworth House Office BuildingWashington, D.C. 20515-0004Phone: 202-225-1880Fax: 202-225-5914
Visiting DC?
Antioch: 420 West 3rd Street Antioch, CA 94509 Phone: 925-757-7187 Fax: 925-757-7056
Dublin:100 Civic PlazaDublin, CA 94568-2658Phone: 925-829-0813Fax: 925-829-7318
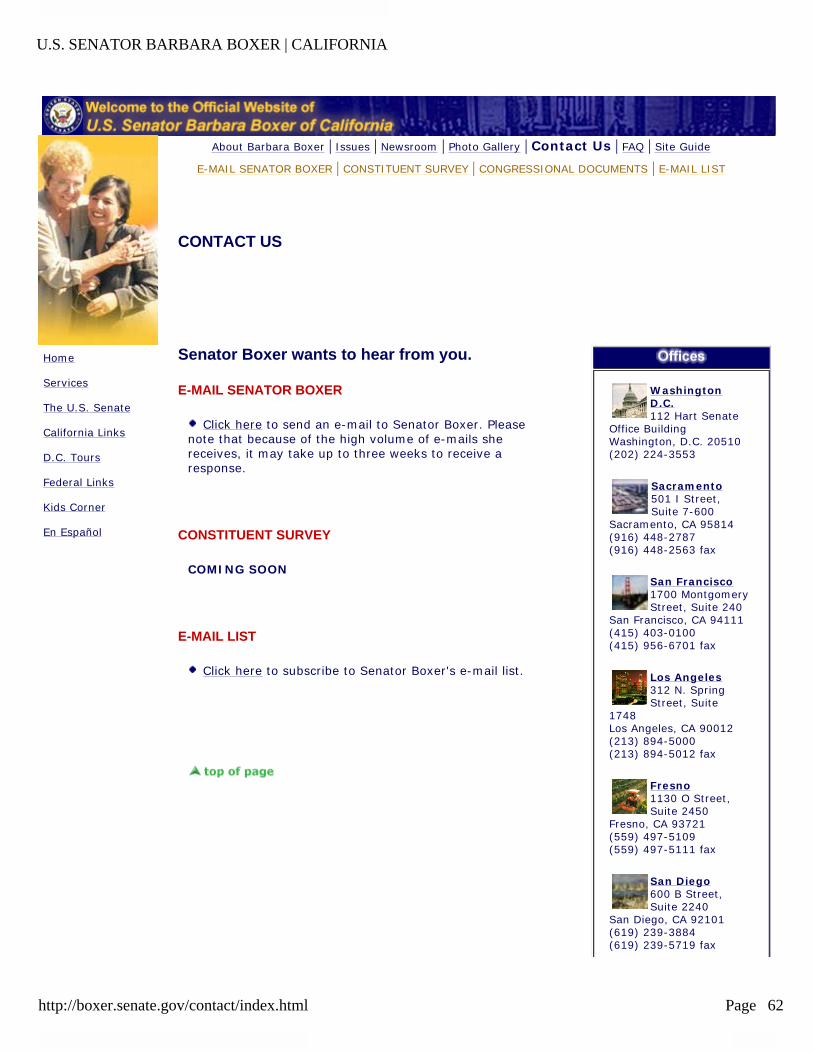
U.S. SENATOR BARBARA BOXER | CALIFORNIA
http://boxer.senate.gov/contact/index.html Page 62
About Barbara Boxer | Issues | Newsroom | Photo Gallery | Contact Us | FAQ | Site Guide
CONTACT US
E-MAIL SENATOR BOXER | CONSTITUENT SURVEY | CONGRESSIONAL DOCUMENTS | E-MAIL LIST
Home
Services
The U.S. Senate
California Links
D.C. Tours
Federal Links
Kids Corner
En Español
Senator Boxer wants to hear from you.
E-MAIL SENATOR BOXER
Click here to send an e-mail to Senator Boxer. Please note that because of the high volume of e-mails she receives, it may take up to three weeks to receive a response.
CONSTITUENT SURVEY
COMING SOON
E-MAIL LIST
Click here to subscribe to Senator Boxer's e-mail list.
WashingtonD.C.112 Hart Senate
Office BuildingWashington, D.C. 20510(202) 224-3553
Sacramento501 I Street, Suite 7-600
Sacramento, CA 95814(916) 448-2787(916) 448-2563 fax
San Francisco1700 Montgomery Street, Suite 240
San Francisco, CA 94111(415) 403-0100(415) 956-6701 fax
Los Angeles312 N. Spring Street, Suite
1748Los Angeles, CA 90012(213) 894-5000(213) 894-5012 fax
Fresno1130 O Street, Suite 2450
Fresno, CA 93721(559) 497-5109(559) 497-5111 fax
San Diego600 B Street, Suite 2240
San Diego, CA 92101(619) 239-3884(619) 239-5719 fax

U.S. SENATOR BARBARA BOXER | CALIFORNIA
http://boxer.senate.gov/contact/index.html Page 63
Inland Empire201 North E Street, Suite 210
San Bernardino, CA 92401(909) 888-8525(909) 888-8613 fax
E-MAIL SENATOR BOXER | CONSTITUENT SURVEY | CONGRESSIONAL DOCUMENTS | E-MAIL LIST
U.S. SENATOR BARBARA BOXER | CALIFORNIA

Senator Dianne Feinstein - Contact Senator Feinstein
http://www.senate.gov/~feinstein/contact.html Page 64
Main Page | What's New | Tours, Flags & Services | Contact Senator Feinstein | En Español
Legislation & Historical Documents | Federal Resources | Biography | Photo Gallery | Press OfficeCalifornia Links | For Young People | Questions (FAQ) | Comments | Privacy Notice | Site Map
Contact Senator Feinstein Phone or Fax - If you wish to phone or fax the Washington, D.C. office:
Phone: (202) 224-3841Fax: (202) 228-3954
TTY/TDD: (202) 224-2501
Write a letter - You can send an email using my New e-mail web form or send postal mail to:
Senator Dianne FeinsteinUnited States Senate
331 Hart Senate Office BuildingWashington, DC 20510
All electronic mail sent is tallied and your opinions are noted and appreciated. If you wish a response to your email, please include your California postal mailing address in the text of your message. Due to the volume of email we receive, we are only able to respond to messages that contain a California postal address. Please ensure that your email is in plain text format and does not include any attachments.
California offices - Contact one of my offices in California.
Requests for Casework assistance - If you are writing because you are having difficulty with a government agency and wish to request help, please send a letter including your name, address, phone number, Social Security number, and information about your problem and a Privacy Release form to:
Senator Dianne FeinsteinUnited States Senate
One Post Street, Suite 2450San Francisco, CA 94104

Senator Dianne Feinstein - Contact Senator Feinstein
http://www.senate.gov/~feinstein/contact.html Page 65
Return to Menu
Or call (415) 393-0707Fax (415) 393-0710
Email issue briefs - Subscribe to one of my issue email briefs.
Tour information and ticket requests - To request Washington tour information or tickets, call (202) 224-3841 or send an email. Please include the dates you will be in Washington and your postal address. Also, please indicate in the subject of your email that you are requesting tour information. Please note that tours should be booked at least six months in advance to guarantee availability.
U.S. Flags - Purchase a flag flown over the U.S. Capitol.
Internships - Information on internships in my Washington, DC or California offices.
Senator Dianne Feinstein - Contact Senator Feinstein

Community Information Books 2001 References Healthy People 2000: National Health Promotion and Disease Prevention Objectives. US Department of Health and Human Services, Public Health Service. DHHS Publication No. (PHS) 91-50212. US Government Printing Office: Washington, DC (1991). School Profiles Source: California Department of Education, Educational Demographics Unit (http://www.cde.ca.gov), March, 2001. Sex and America’s Teenagers. New York: The Alan Guttmacher Institute, 1994. United States Census Bureau, Department of Commerce (http://www.census.gov;http://factfinder.census.gov). Quality of Life Benchmarks Report 2000. Alameda County Social Services Agency, 2001. (http://www.co.alameda.ca.us/assistance/publications_reports.shtml) County Health Status Report 2000. Alameda County Public Health Department Community Assessment, Planning and Education Unit. July, 2000 (http://www.co.alameda.ca.us/publichealth) Page 66