1) Laser scanner - ATLANTIS PRESS - scientific publishing
4
Effect of Target Properties on Terrestrial Laser Scanning Intensity Data Guihua Cang 1,2 , Mingfeng Li 2 , Jianping Yue 1 , Jiangxia Ou 2 , Ling Zhu 3,4 1 School of Earth Sciences and Engineering, Hohai University, Nanjing, China 2 Department of Geomatics Engineering, Nanjing University of Technology, Nanjing, China 3 Beijing University of civil engineering and architecture,Beijing, China 4 Key Laboratory of Precise Engineering and Industry surveying, National Administration of Surveying, Mapping and Geoinformation, Beijing, China Abstract—Terrestrial laser Scanning (TLS) intensity data are influenced by many factors. In this paper, the influence of target surface properties on TLS intensity data is considered. Experiments were carried out with standard reflector, some different color plates and selected building facades of various kind of material. Through the research on the intensity quality, we can conclude that the target reflectance characteristics at the laser wavelength determine its intensity value. Two correlations, that is, intensity value and range accuracy, intensity value and its standard deviation are not the same for different targets. Color has a great impact on the intensity of scanned point data. The white, yellow, cyan and green plates have large intensity with a better reflectivity at green laser, while red and black have small intensity with worse reflectivity. Keywords—Terrestrial Laser Scanning, target surface properties, intensity data, point cloud, effect analysis I. INTRODUCTION Terrestrial laser scanning (TLS) is a well-known surveying technology and has already been used over a decade. In contrast to traditional technology of single point positional surveying, TLS can offer millions of densely spaced points, called “point clouds”. For each point, the 3D coordinates ) , , ( Z Y X and the intensity value ) ( I are recorded. Intensity is defined as the ratio of strength of reflected light to that of emitted light. In the past, laser intensity information was abandoned because of its large noise. But recently, a number of researchers gradually pay more attentions to the usage of intensity information. This is because the progress in laser technology and the subsequent advent of suitable sensors in TLS. Several publications about the usage of laser intensity have been found [1-4]. The intensity data are usually combined with 3D data for object classification and matching purposes. Results show that the intensity value is a functional for classification, but we all know the intensity values used in these papers are the original recorded values. The raw intensity data are influenced by many factors, such as instrument mechanism, environmental conditions, target surface properties and scan geometry. In order to improve the application reliability of laser point intensity information, radiometric aspects should be also investigated together with geometric parameters. Previous publications have less information about the performance of TLS intensity data. Clark et al. (2004) tested the effect of colors on range accuracy with standard color patches, but did not concern its effect on intensity data. Bucksch et al. (2007) investigated the effect of five grey patches on the intensity quality, but the experiment samples were few. Based on the related literatures, this paper will investigate the effect of target properties on TLS intensity data. In order to obtain some reliable results, test samples with planar plates of different materials, including targets of defined reflectivity, common color patches and building materials, were scanned at varying distances and angles to the scanner. In each case the resultant point cloud was analyzed to examine the effect of different materials on intensity data. II. EXPERIMENT DESCRIPTION A. Test configuration 1) Laser scanner For the purpose of this research, the instrument used was a 532nm ScanStation C10 terrestrial laser scanner. The scanner is a pulsed scanner using the time of flight to measure range. The main technical specifications of this scanner are listed in Table 1. TABLE I. MAIN TECHNICAL SPECIFICATIONS OF SCANSTATION C10 SCANNER System Performance Accuracy of single measurement Position 6mm Distance 4mm Angle (horizontal/vertical) 60urad / 60urad (12″ / 12″) Laser Scanning System Range 300 m @ 90%; 134 m @ 18% albedo Scan rate Up to 50,000 points/sec Field-of-view 360°×270° 2) Sample frame In order to obtain the scanned point cloud of different samples easily in each case, a sample frame was made with the size of 30cm×30cm. During the scanning experiment, each sample was placed in the sample frame fixed on a theodolite base. The base had leveling bubble and horizontal circle, which could control scanning state. International Conference on Remote Sensing, Environment and Transportation Engineering (RSETE 2013) © 2013. The authors - Published by Atlantis Press 818
Transcript of 1) Laser scanner - ATLANTIS PRESS - scientific publishing

Effect of Target Properties on Terrestrial Laser
Scanning Intensity Data
Guihua Cang 1,2
, Mingfeng Li 2, Jianping Yue
1 , Jiangxia Ou
2, Ling Zhu
3,4
1 School of Earth Sciences and Engineering, Hohai University, Nanjing, China
2 Department of Geomatics Engineering, Nanjing University of Technology, Nanjing, China
3 Beijing University of civil engineering and architecture,Beijing, China
4 Key Laboratory of Precise Engineering and Industry surveying, National Administration of Surveying, Mapping and
Geoinformation, Beijing, China
Abstract—Terrestrial laser Scanning (TLS) intensity data are
influenced by many factors. In this paper, the influence of target
surface properties on TLS intensity data is considered.
Experiments were carried out with standard reflector, some
different color plates and selected building facades of various
kind of material. Through the research on the intensity quality,
we can conclude that the target reflectance characteristics at the
laser wavelength determine its intensity value. Two correlations,
that is, intensity value and range accuracy, intensity value and its
standard deviation are not the same for different targets. Color
has a great impact on the intensity of scanned point data. The
white, yellow, cyan and green plates have large intensity with a
better reflectivity at green laser, while red and black have small
intensity with worse reflectivity.
Keywords—Terrestrial Laser Scanning, target surface
properties, intensity data, point cloud, effect analysis
I. INTRODUCTION
Terrestrial laser scanning (TLS) is a well-known surveying
technology and has already been used over a decade. In
contrast to traditional technology of single point positional
surveying, TLS can offer millions of densely spaced points,
called “point clouds”. For each point, the 3D
coordinates ),,( ZYX and the intensity value )(I are recorded.
Intensity is defined as the ratio of strength of reflected light to
that of emitted light.
In the past, laser intensity information was abandoned
because of its large noise. But recently, a number of
researchers gradually pay more attentions to the usage of
intensity information. This is because the progress in laser
technology and the subsequent advent of suitable sensors in
TLS. Several publications about the usage of laser intensity
have been found [1-4]. The intensity data are usually combined
with 3D data for object classification and matching purposes.
Results show that the intensity value is a functional for
classification, but we all know the intensity values used in
these papers are the original recorded values. The raw intensity
data are influenced by many factors, such as instrument
mechanism, environmental conditions, target surface properties
and scan geometry. In order to improve the application
reliability of laser point intensity information, radiometric
aspects should be also investigated together with geometric
parameters.
Previous publications have less information about the
performance of TLS intensity data. Clark et al. (2004) tested
the effect of colors on range accuracy with standard color
patches, but did not concern its effect on intensity data.
Bucksch et al. (2007) investigated the effect of five grey
patches on the intensity quality, but the experiment samples
were few. Based on the related literatures, this paper will
investigate the effect of target properties on TLS intensity data.
In order to obtain some reliable results, test samples with
planar plates of different materials, including targets of defined
reflectivity, common color patches and building materials,
were scanned at varying distances and angles to the scanner. In
each case the resultant point cloud was analyzed to examine the
effect of different materials on intensity data.
II. EXPERIMENT DESCRIPTION
A. Test configuration
1) Laser scanner
For the purpose of this research, the instrument used was a
532nm ScanStation C10 terrestrial laser scanner. The scanner
is a pulsed scanner using the time of flight to measure range.
The main technical specifications of this scanner are listed in
Table 1.
TABLE I. MAIN TECHNICAL SPECIFICATIONS OF SCANSTATION C10
SCANNER
System Performance
Accuracy of single measurement
Position 6mm
Distance 4mm
Angle (horizontal/vertical) 60urad / 60urad (12″ / 12″)
Laser Scanning System
Range 300 m @ 90%; 134 m @ 18% albedo
Scan rate Up to 50,000 points/sec
Field-of-view 360°×270°
2) Sample frame
In order to obtain the scanned point cloud of different
samples easily in each case, a sample frame was made with the
size of 30cm×30cm. During the scanning experiment, each
sample was placed in the sample frame fixed on a theodolite
base. The base had leveling bubble and horizontal circle, which
could control scanning state.
International Conference on Remote Sensing, Environment and Transportation Engineering (RSETE 2013)
© 2013. The authors - Published by Atlantis Press 818
B. Test samples
For the completion of this research, three series of samples
were selected. The first test series were the targets of defined
reflectivity (Lambertian reflector, reflectivity: 35%, 55%).
Furthermore, eight common color patches (red, yellow, green,
cyan, blue, white, grey, and black) were selected. In addition,
six building materials (wood, brick, concrete, asphalt, marble
and granite) were chosen. All samples were planar plates with
the size of 30cm ×30cm.
C. Measurement setup
Experiments were carried out outdoor on the relatively flat
ground. The scanner and a Total Station (TL) were placed at a
distance of about 80 meters. Sample frame was placed between
them, facing the scanner. Three devices were adjusted at the
same height. With regard to the distance between sample frame
and scanner, the experiments were designed to three different
setups.
Ex1: The sample frame was placed at about 10 meters from
the TLS. All samples were rotated around vertical axis in step
of 10°( related 0°to 80°).
Ex2: The sample frame was placed at about 30 meters from
the TLS. All samples were rotated around vertical axis in step
of 10°( related 0°to 80°).
Ex3: The sample frame was placed at about 70 meters from
the TLS, facing the scanner which implies that the scanning
angles were never larger than about 3 degree.
As the sample frame device was not very accurate in
practice, the real orientation of the plate with respect to the
scanner at a certain orientation setting was reconstructed from
the point cloud data.
III. DATA PROCESSING
According to the experimental setup above mentioned, each
dataset was obtained in each case. The points were selected
manually from the resulting point cloud of each scanning
ensuring that all spurious points and floating points were
eliminated. The scanned data were exported in an ASCII files
(PTS format), which contain 3D coordinates together with the
intensity value of each point.
As the scanned data were exported to .PTS format, the
intensity value of each point was ranged from -2047 to +2048.
Based on the general requirements of visualization of the
output image, all intensity values were transformed linearly to
0 -255 as an 8 bit grayscale.
Terrestrial laser scanners allow millions of points to be
recorded in a few minutes, but it is difficult for them to obtain
3D coordinates of a certain point. Usually we use sphere or
plane target to solve the problem. In this experiment the
samples we used are all plane, so the 3D coordinates of each
sample at one position can be used for plane fitting in order to
fit planes to the data and determine the plane accuracy, and the
precision index of each scan can be acquired.
After each plane was fitted, three statistical parameters, i.e.
plane fitting accuracyP , average intensity I of all points on
the fitted plane and its standard deviationI could be
calculated. The plane fitting accuracy P is also used to stand
for the range accuracy of the sample at each specific position.
Mean intensity I and its standard deviation I stands for the
sample intensity value and the intensity quality respectively at
that position.
IV. RESULTS
According to the data processing procedure, three statistical
parameters of different targets in each case were calculated and
displayed by graphs and tables. In order to analyze the results
easily, the distance and the incidence angle at each position
were used to stand for the scanning station, not having their
actual meanings.
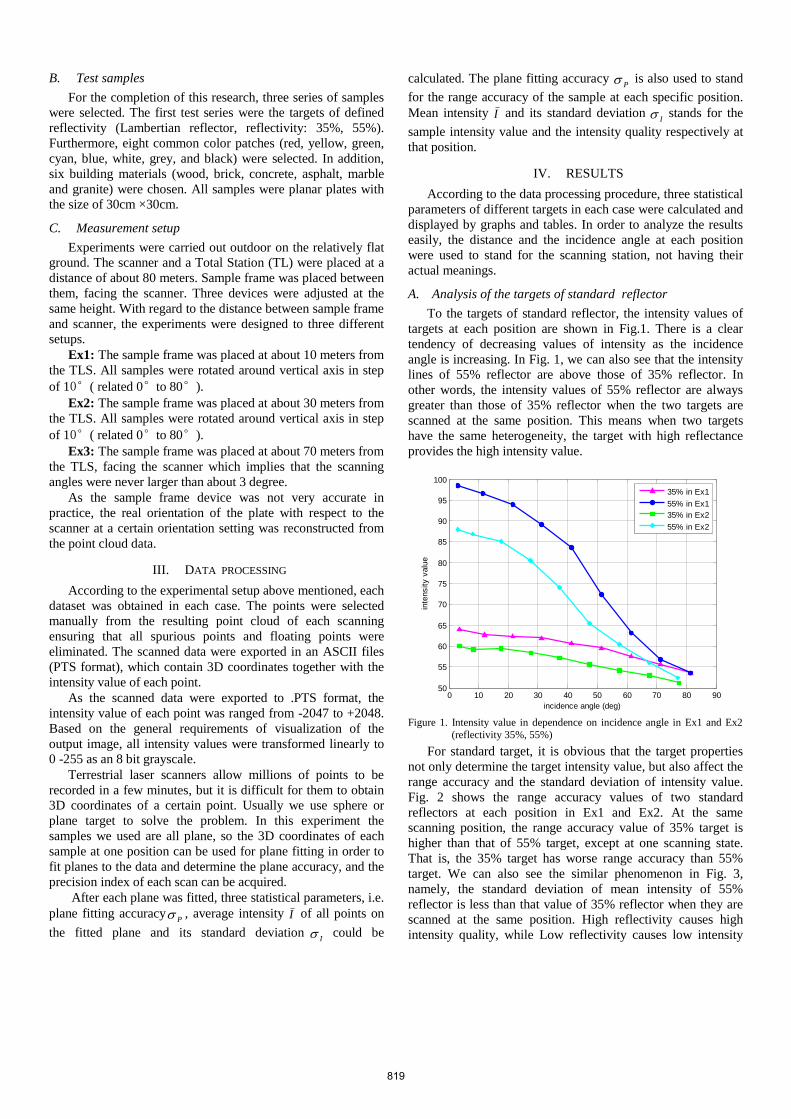
A. Analysis of the targets of standard reflector
To the targets of standard reflector, the intensity values of
targets at each position are shown in Fig.1. There is a clear
tendency of decreasing values of intensity as the incidence
angle is increasing. In Fig. 1, we can also see that the intensity
lines of 55% reflector are above those of 35% reflector. In
other words, the intensity values of 55% reflector are always
greater than those of 35% reflector when the two targets are
scanned at the same position. This means when two targets
have the same heterogeneity, the target with high reflectance
provides the high intensity value.
0 10 20 30 40 50 60 70 80 9050
55
60
65
70
75
80
85
90
95
100
incidence angle (deg)
inte
nsity v
alu
e
35% in Ex1
55% in Ex1
35% in Ex2
55% in Ex2
Figure 1. Intensity value in dependence on incidence angle in Ex1 and Ex2
(reflectivity 35%, 55%)
For standard target, it is obvious that the target properties
not only determine the target intensity value, but also affect the
range accuracy and the standard deviation of intensity value.
Fig. 2 shows the range accuracy values of two standard
reflectors at each position in Ex1 and Ex2. At the same
scanning position, the range accuracy value of 35% target is
higher than that of 55% target, except at one scanning state.
That is, the 35% target has worse range accuracy than 55%
target. We can also see the similar phenomenon in Fig. 3,
namely, the standard deviation of mean intensity of 55%
reflector is less than that value of 35% reflector when they are
scanned at the same position. High reflectivity causes high
intensity quality, while Low reflectivity causes low intensity
819

quality. These experiment results of standard targets match
with our expectations very well.
0 10 20 30 40 50 60 70 80 900
0.5
1
1.5
2
2.5
3
3.5
4
4.5
5
incidence angle(deg)
range a
ccura
cy (
mm
)
35% in Ex1
55% in Ex1
35% in Ex2
55% in Ex2
Figure 2. Range accuracy
P [mm] in dependence on incidence angle in Ex1
and Ex2 (reflectivity 35%, 55%)
0 10 20 30 40 50 60 70 80 900
0.5
1
1.5
2
2.5
3
3.5
incidence angle(deg)
Std
Dev o
f m
ean inte
nsity
35% in Ex1
55% in Ex1
35% in Ex2
55% in Ex2
Figure 3. Standard deviation of mean intensity I in dependence on incidence angle in Ex1 and Ex2 (reflectivity 35%, 55%)
B. Analysis of common color
The effect of target’s color on the point quality is major
depended on the color reflective properties with respected to
the laser wavelength. Fig.4 illustrates the variation of intensity
value with color at each incidence angle. The intensity lines
are plotted sequentially from top to bottom except the state of
small incidence angle. Yellow, cyan, green and white have
high intensity value, while blue, grey, red and black have low
intensity value. These results are consistent with the spectral
reflectance in green band.
Due to the fact that the selected colors are not standard
materials, the results in range accuracy and the standard
deviation of intensity value are not consistent with the general
expectation. Though the order of range accuracy is not strictly
corresponding with that of intensity value one another, the
range accuracy is also related to the color reflectivity. Yellow,
cyan and green color patches have relatively high range
accuracy, while the range accuracy of red and that of blue
color patches are low (Fig. 5). Fig. 6 shows the relationship
between intensity value and its related standard deviationI .
These lines in Fig.6 intersect each other and no law can
describe the relationship.
0 10 20 30 40 50 60 70 80 9020
40
60
80
100
120
140
incidence angle(deg)
inte
nsity v
alu
e
white
grey
black
red
yellow
green
cyan
blue
Fig. 4 Intensity value in dependence on incidence angle in Ex2 (all color
samples are included)
Figure 5.Range accuracy P [mm] in dependence on incidence angle in Ex2
(red, yellow, green, cyan, and blue are included)
0 10 20 30 40 50 60 70 80 900
1
2
3
4
5
6
7
8
9
10
Std
Dev o
f m
ean inte
nsity
incidence angle( deg)
red
yellow
green
cyan
blue
Figure 6. Standard deviation of mean intensity I in dependence on incidence
angle in Ex2 (red, yellow, green, cyan, and blue are included)
C. Analysis of building materials
With the complexity and heterogeneity of the selected
building materials, there will be no point or obvious errors in
some scanning cases. Here only some reliable scanned data are
researched. Table 2 lists the statistical parameters calculated
from reliable scanned data.
820

TABLE II. DESCRIPTIIVE STATISTICS FOR BUILDING MATERIALS AT SOME SCANNING POSITIONS IN EX1, EX2 AND EX3
Position Parameters wood brick concrete asphalt marble granite
10m
0°
Mean intensity 107.05 49.57 87.31 42.53 84.83 62.35
Range accuracy (mm) 3.4 4.5 2.8 3.6 3.8 2. 3
Std Dev of mean intensity 4.22 1.74 3.11 1.49 5.49 1.48
10m 40°
Mean intensity 83.45 48.10 77.86 39.47 62.83 58.6
Range accuracy (mm) 4.7 2.5 5.6 3.1 3.5 1.6
Std Dev of mean intensity 4.42 1.59 3.61 1.49 1.78 1.59
10m
70°
Mean intensity 56.64 45.3 61.46 39.12 54.17 50.73
Range accuracy (mm) 1.4 0.7 0.4 2.3 2.5 0.4
Std Dev of mean intensity 1.42 1.47 0.95 1.44 1.46 1.35
30m 10°
Mean intensity 94.80 46.54 74.13 39.19 67.22 57.57
Range accuracy (mm) 4.3 2.4 4.1 4.0 4.0 3.5
Std Dev of mean intensity 5.48 1.59 4.38 0.87 4.78 1.20
30m
50°
Mean intensity 61.70 44.81 61.95 37.26 56.62 52.90
Range accuracy (mm) 4.2 1.4 3.3 3.5 1.5 2.7
Std Dev of mean intensity 1.48 1.53 1.05 2.18 1.81 1.10
70m 0°
Mean intensity 53.19 36.54 47.70 25.81 47.08 42.63
Range accuracy (mm) 1.5 3.6 4 3.5 2.9 1.9
Std Dev of mean intensity 1.30 1.82 1.04 3.19 1.24 0.97
From Table 2, we can draw some conclusions. For any
scanning position, there is a regular pattern of the intensity
values of six building materials. Wood has the highest
intensity value, followed by concrete, granite, marble and
asphalt. Although the intensity value of wood is the
highest, its intensity fluctuation is also the biggest, from
107.05 to 53.19; on the contrary, the intensity fluctuation
of asphalt with the lowest intensity value is little, from
42.53 to 25.81.
The two correlations, i.e. intensity value and range
accuracy, intensity value and its related standard deviation,
are uncertain. Granite has middle intensity value with the
highest data quality in range accuracy and the standard
deviation of mean intensity; however wood has the highest
intensity value with relatively poor data quality.
V. CONCLUSION AND FUTURE WORKS
This paper investigates TLS intensity data dependence
on target properties from two target aspects of material
and color. From the data obtained it is evident that the
target reflectivity with respect to the laser wavelength
determines its intensity value for all samples. As for the
two kinds of relationship, namely intensity value and
range accuracy, intensity value and its standard deviation,
are different to different feature targets. For the target
with surface homogeneity, the intensity value is inversely
proportional to the range measurement accuracy and its
standard deviation. But for the common materials with
surface heterogeneity, there is no rule can be founded in
the two relationships. Color has a great impact on TLS
intensity data. The colors with high reflectivity at the
laser wavelength have higher intensity values.
The results of this paper provide a basis for the
subsequent applications of intensity data, but these are not
sufficient for understanding the target intensity
characteristic. In further studies, we would analyze the
effect of other factors on TLS intensity data and study the
calibration method of intensity data.
ACKNOWLEDGMENT
This work is supported by National Nature Science
Foundation (41174002),and Key Laboratory of Precise
Engineering and Industry surveying, National
Administration of Surveying, Mapping and
Geoinformation(PF2011-13).
REFERENCES
[1] H. Hasegawa, “Evaluations of LIDAR reflectance
amplitude sensitivity towards land cover conditions,”
Bulletin of the Geographical Survey Institute, Vol. 53, pp.
43-50,2006.
[2] S. Kaasalainen, H. Kaartinen, and A. Kukko, “Snow cover
change detection with laser scanning range and brightness
measurements,” EARSeL eProc, vol. 7, pp. 133-141, 2008.
[3] J. N. Liu, and X. H. Zhang, “Classification of laser
scanning altimetry data using laser intensity,” Geomatics
and Information Science of Wuhan University, vol. 30, pp.
189-193, 2005.
[4] L. Huang, X. S. Lu, and Y. Liang, “Building Facade
Extraction and Classification Using Laser Scanning
Intensity,” Geomatics and Information Science of Wuhan
University, vol. 34, pp. 195-198, 2009.
[5] J. Clark, and S. Robson, “Accuracy of measurements made
with CYRAX 2500 laser scanner against surfaces of known
colour,” IAPRS, XXXV( B5), 2004, pp. 1031-1036.
[6] A. Bucksch, R. Lindenbergh, and J. van Ree, “Error budget
of terrestrial laser scanning: influence of the intensity
remission on the scan quality,” Proc. in the GeoSiberia ,
Novosibirsk, Russia, 2007.
821