1 Lahore Stock Exchange (LSE) “Continuous Professional Development” December 2011 Pakistan’s...
43
1 Lahore Stock Exchange (LSE) “Continuous Professional Development” December 2011 Pakistan’s Capital Markets: Current Challenges Presentation by : Muhammad Farid Alam, FCA Chief Executive Officer AKD Securities Limited
-
date post
19-Dec-2015 -
Category
Documents
-
view
213 -
download
0
Transcript of 1 Lahore Stock Exchange (LSE) “Continuous Professional Development” December 2011 Pakistan’s...
1
Lahore Stock Exchange (LSE)“Continuous Professional Development”
December 2011
Pakistan’s Capital Markets: Current Challenges
Presentation by : Muhammad Farid Alam, FCA
Chief Executive Officer
AKD Securities Limited

2
Contents
AKD Securities Limited
Economy & Capital Markets
Equity Market of Pakistan
Debt Market of Pakistan
Challenges for Capital Markets
The Way Forward

3
AKD Securities Limited
4
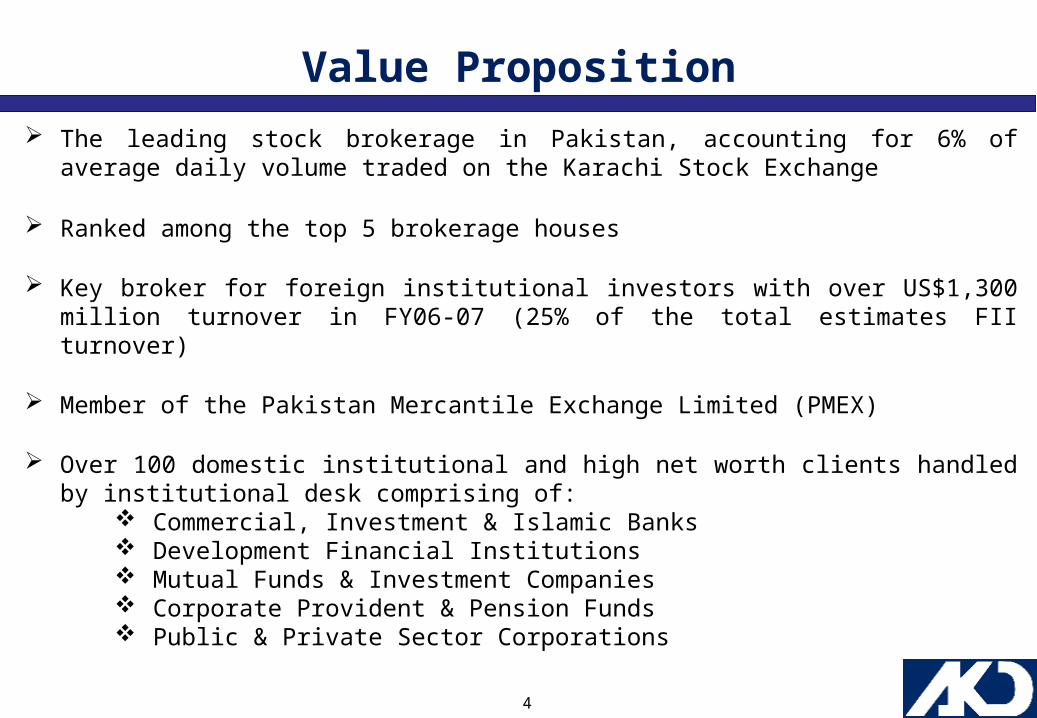
Value Proposition The leading stock brokerage in Pakistan, accounting for 6% of average daily
volume traded on the Karachi Stock Exchange
Ranked among the top 5 brokerage houses
Key broker for foreign institutional investors with over US$1,300 million turnover in FY06-07 (25% of the total estimates FII turnover)
Member of the Pakistan Mercantile Exchange Limited (PMEX)
Over 100 domestic institutional and high net worth clients handled by institutional desk comprising of:
Commercial, Investment & Islamic Banks Development Financial Institutions Mutual Funds & Investment Companies Corporate Provident & Pension Funds Public & Private Sector Corporations

5
Recognition
AKD Securities Limited is a proud recipient of “The Best Equity Brokerage House” Award for the years 2005-06 and 2006–07, awarded by the ‘CFA Association of Pakistan’.
The globally recognized business journal ‘Asia Money’ conducted a survey, focused on the quality of brokerage firms, with renowned international portfolio fund managers and ranked AKD Securities Limited as the 2nd Best Local Brokerage, 2nd Best Overall Country Research, and 3rd Best Overall Sales Services.

6
First brokerage firm to launch Online Stock Trading Service in 2002, and now a leading franchise in this space
Largest customer base with 7,000 registered clients out of a total market size of approximately 19,000 and contribution significantly to overall broking revenues
Marketing joint-venture & co-branding with Standard Chartered Bank for their online Priority Banking Clientele which allows immediate funds transfer facility to AKD’s broking account while enjoying the banking facilities of SCB
Only online trading service provider with fully dedicated customer call-centre support having trained staff
Dedicated research portal enabling online customers to be fully informed about market & corporate developments, with access to reports on par with institutional investors
AKD Trade

7
Investment Banking Successful track record of
completing huge capital market transactions
Extensive understanding and experience of structuring and executing complex debt & equity transactions
Financial strength to commit resources for large underwriting and participation
In-depth knowledge of investor demand & appetite
Widespread distribution capabilities to a diversified client network through experienced distribution team
Close working relationship and credibility with key regulatory agencies
Experienced senior resources to ensure swift completion of transactions
We believe that with our in-depth understanding of Pakistan’s capital markets, qualified management, and prior experience, we are best positioned to provide our clients the level of services required for making every transaction a resounding success.

8
Investment Banking AKDS has assembled a core team of expert professionals with a high level of integrity,
financial acumen and industry experience. Driven by young and skilled professionals, the team has initiated and successfully executed transactions unique in structure and size.
The team has been involved in numerous Initial Public Offerings, Acquisitions, providing risk capital in underwritings, market-making, various TFC issuances & Asset-back Securitization as well as leading Privatization deals in the country.
AKDS was selected as advisor for IPO of UBL by the Government of Pakistan. It was the BUYSIDE advisor for NRL privatization which was acquired by the Attock Oil Group.
AKDS was also mandated as sell-side advisor to Continental Biscuits Limited for the strategic sale of stake to The Danone Group, France.
The consortium of AKDS, Morgan Stanley and Detusche was mandated as the consultants to the GDR of National Bank of Pakistan (on hold)
As Financial Advisors, AKDS has successfully consummated the acquisition of a listed commercial bank by a well known Saudi bank and have acted as Joint Financial Advisors for the 100% Rights Issue of The Bank of Khyber of up to PkR 2,552mn.

9
Economy & Capital Markets

10
Phase EconomyFiscal Policy
Short-Term Rates
Asset Class
Initial Recovery
•Inflation still declining Stimulatory Low / Declining
Cyclical shares, commodities and other riskier assets
Early Upswing
•Healthy economic growth
•Inflation remains low Moving Up
Shares and real estate
Late Upswing
•Inflation gradually rises
Restrictive RisingBonds, interest rate sensitive shares
Slowdown•Inflation continues to
accelerate Peaking
Bonds, interest rate sensitive shares
Recession
•Inventory correction begins
•Inflation peaks•Production declines
DecliningShares (late in cycle), Commodities (late in cycle)
Phases of an Economy

11
Initial Recovery
The Economy of Pakistan

12
Note: FY12B is GoP estimates. FY12AKD is AKD Research Estimates
FY09A FY10A FY11A FY12B FY12AKD
Real GDP growth (%) 1.7 3.8 2.4 4.2 3.50-3.75
Agri growth (%) 4 0.6 1.2 3.4 2.5
Manufacturing growth (%) -3.6 5.5 3.0 3.7 3.0
Services growth (%) 1.7 2.9 4.1 5.1 4.5
Federal budget deficit % of GDP 5.3 6.3 5.7 4.0 5.75
Tax to GDP (%) 9.5 10.1 10 10.3 10.3
Average CPI Inflation Rate (%) 20.8 11.7 14.1 12.0 12.1
Foreign direct investments (US$bn) 3.7 2.2 1.5 2.5 1.5
Exports as % of GDP 11.8 11.1 12.7 12.7 12.5
Imports as % of GDP 19.6 17.6 13.6 17.8 18.0
Current Account as % of GDP -5.7 -1.7 0.5 -0.6 -1.03
Inward Remittances (US$bn) 7.8 8.9 11.2 12.2 12.5
Forex reserves (US$bn) 12.4 16.8 17.5 18.0 16.0
Exchange rate (PkR/US$) 66 84 87 88 91.5
External debt % of GDP 29 28 31 32 30
Actual Budgeted Forecasted
The Economy of Pakistan - Snapshot

13
15
% FY20106.0%
5.4% Emerging Markets
Developed Markets
5.0%
4.0%
3.0%
2.0% 1.7%
1.0%
0.0%Emerging Markets
Developed Markets
Source: EIU; April 2010
Economic Growth Growth is expected to come out of the Emerging Markets because all variables i.e. – consumption, savings etc. are at the lower side.
On the other hand the same variables have reached saturation amongst the Developed Markets.

14
21
Debt % of GDP
90
80
70
60
50
40
29 DEC 2000 – 31 DEC 2009
Developed Markets
Emerging Markets30
20'00
Source: Factset; EIU; April 2010
'01 '02 '03 '04 '05 '06 '07 '08 '09
- Developed Markets : G7. Emerging Markets : 87 non-OECD Countries
- Total domestic, external and IMF government debt, as a % of nominal GDP
- Usually but not exclusively central government
Debt % of GDP

15
Over the past decade total market capitalization’s input in GDP increased phenomenally from 8% in FY01 and kept on growing with its peak during the golden years of 2006 and 2007
GDP Growth
-5.0%
0.0%
5.0%
10.0%
15.0%
20.0%
FY
00
FY
01
FY
02
FY
03
FY
04
FY
05
FY
06
FY
07
FY
08
FY
09
FY
10
FY
11F
FY
12F
Manufacturing Agri Services GDP Growth
Capital Market Performance
KSE 100 Index
1,273 2,701
4,4726,218
9,55710,041
14,076
5,865
9,387
12,022
11,557
-
2,000
4,000
6,000
8,000
10,000
12,000
14,000
Dec
01
Dec
02
Dec
03
Dec
04
Dec
05
Dec
06
Dec
07
Dec
08
Dec
09
Dec
10
01-D
ec-1
1
Index
CAGR CY01-CY11 = 25%
KSE Performance (2001 – 2011)
FY01 FY02 FY03 FY04 FY05 FY06 FY07 FY08 FY09 FY10 FY110%
5%
10%
15%
20%
25%
30%
35%
40%
45%
50%
8% 10%
16%
25%
32%
37%
46%
37%
17%18% 18%
Market Cap. / GDP

16
Role of Capital Markets
Mobilization of long-term resources (capital raising avenue for corporates) & investment avenue of investors including retail
Intermediation Function – Distribution of these resources & investments in various viable projects
Mechanism of entry and exit in a quick and transparent manner

17
Advantages of Capital Markets
Advantages of capital markets to:
Government -
Sponsors –
Society -
Investors -
Regulators -

18
Equity Market of Pakistan

19
KSE-100 Index at a Glance
KSE 100 Index
1,273 2,701
4,4726,218
9,55710,041
14,076
5,865
9,387
12,022
11,557
-
2,000
4,000
6,000
8,000
10,000
12,000
14,000
Dec
01
Dec
02
Dec
03
Dec
04
Dec
05
Dec
06
Dec
07
Dec
08
Dec
09
Dec
10
01-D
ec-1
1
Index
CAGR CY01-CY11 = 25%
During the 90s market movement was sideways ranging between the levels of 1,000 to 2,000
The Decade That Was: The first decade of 21st century was eventful and saw de-regulation opening up the markets, consolidation, privatization, divestments by GoP worth USD 6.7bn that provided for currency stabilization (MCB – GDR) and later by the cursed domestic and international financial crisis

20
KSE Market Dynamics – Volatility is an Opportunity
The KSE-100 Index has posted a 10 year return CAGR of 25% however volatility has remained high historically. We view this as an opportunity to maximize returns. In view of expected spells of volatility following the sell-off in global markets, we believe proactive management can provide for above average market returns.KSE 100 Index CY01 CY02 CY03 CY04 CY05 CY06 CY07 CY08 CY09 CY10 CY11*High 1,550 2,701 4,604 6,218 10,303 12,274 14,815 15,676 9,846 12,031 12,682 Low 1,075 1,273 2,359 4,472 6,218 8,767 10,041 5,865 4,815 9,230 10,842
2001 2002 2003 2004 2005 2006 2007 2008 2009 2010 2011*
CY % -16% 112% 66% 39% 54% 5% 40% -58% 60% 28% -4%*CYTD
Difference between KSE-100 High & Low
44%
112%95%
39%
66%
40%48%
167%
104%
30%17%
2001 2002 2003 2004 2005 2006 2007 2008 2009 2010 2011*
Market melt down 2005 and 2008

21
PER vs. EPS Growth (%) ROE (%) vs. PBVS (x)
2012 Dividend Yield (%)
6.0
7.0
8.0
9.0
10.0
11.0
12.0
13.0
14.0
6 9 12 15 18 21 24
EPS Growth (%) 2012
PER
(x)
201
2
Singapore
Hong Kong
Thailand
Malaysia
China
Philippines IndiaIndonesia
Regional Avg.
Pakistan 1.00
1.20
1.40
1.60
1.80
2.00
2.20
2.40
2.60
10 12 14 16 18 20 22
ROE (%) 2012
P/BV
(x)
201
2
Singapore Hong Kong
Thailand
Malaysia
China
Philippines
India
Indonesia
Regional Avg.
Pakistan
8.59
4.16 4.14 4.03 3.63 3.22 3.122.56 2.30
1.85
-1.0
2.03.0
4.05.06.0
7.08.0
9.010.0
Paki
stan
Thai
land
Hon
gKo
ng
Mal
aysi
a
Sing
apor
e
Reg
iona
lA
vg.
Phili
ppin
es
Indo
nesi
a
Chi
na
Indi
a
Pakistan Market Valuation vs Regional Markets

22
Features of Equity Markets in Pakistan
Exposure to Corporate GrowthProvides opportunity with some of Pakistan’s best corporate stories
Inflation ProtectionSale price will increase according to inflation if company will be able to pass through inflation
LiquidityEase of entry & exit with market mechanism ensuring availability of buyers and sellers
Higher Returns The KSE-100 Index has on averaged returned 25% p.a. since Dec’01
Ease of TradeOnline trading
Companies become SICK but Sponsors get HEALTHIER!!!

23
KSE-100 can reach 13,750 points by Jun’12 based on target price mapping
In absence of any catastrophic event, downside limited by: High dividend yield
(2012F: 8.6%) Corporate earnings
resilience Largely cash based
market
Market likely to focus on: Political situation & US relations World economy & stock markets Foreign funding release Central bank’s monetary policy Macroeconomic Performance
Flags for 2011-12
Key drivers to include: Corporate results & Earnings
outlook Interest rate / liquidity trajectory Release of U.S. / multilateral
funding Actual vs. FY12 Budget targets Equity Market regulations
Check Points
Weather related agriculture sector failure
Commodity price shock
Fiscal indiscipline Major terrorism event Disruptive political change
KEY MACRO RISKS
Valuation expansion if political risk reduces, economic growth accelerates while monetary easing continues
KSE-100 Index can reach 14,250 points by Jun’12 if monetary easing sustains
Is it Bulls or Bears in Pakistan’s Equity Market?

24
Is it Bulls or Bears in Pakistan’s Equity Market?

25
Debt Market of Pakistan

26
Features Largest market size PkR 7trn M2 + NSS (PkR 6.6trn + PkR
1.7trn) compared to PkR 600bln size of equity market free-float which is less than 8% of fixed income
Certain and regular cash flows with lower volatility in comparison to equities
Two classes of investors: growing segment of investors with Islamic segment & normal fixed income seekers
Opportunities in Pakistani Fixed Income Medium to Long term investment:
• National Saving Certificates• Pakistan Investment Bonds• Sukuks• Term Finance Certificates
Short term investment:• T- Bills• Term Deposits in Banks• Investor Portfolio Security Account
Aug-0
8
Oct-0
8
Dec-0
8
Feb-
09
Apr-0
9
Jun-
09
Aug-0
9
Oct-0
9
Dec-0
9
Mar-1
0
May-1
0
Jul-1
0
Sep-
10
Nov-1
0
Jan-
11
Mar-1
1
May-1
1
Jul-1
1
Sep-
11
Nov-1
102468
1012141618
Pakistan Investment Bond Yield
Pakistan In-vestment Bond Yield
Fixed Income Market

27
Source: SBP
0
2
4
6
8
10
12
14
Pakis
tan
USA
UK
EC
B
Japan
Aust
ralia
Chin
a
India
South
Kore
a
Mala
ysi
a
Indonesi
a
Thailand -2.0
0.0
2.0
4.0
6.0
8.0
10.0
12.0
Policy Rate (%) LHS YoY Inflation (%)
Country Policy Rate (%) YoY Inflation (%)
Pakistan 12 10.90
USA 0-0.25 3.50
UK 0.5 5.00
ECB 1.25 3.00
Japan 0-0.10 -0.20
Australia 4.50 3.50
China 6.56 5.50
India 8.50 10.10
South Korea 3.25 3.90
Malaysia 3.00 3.40
Indonesia 6.00 4.40
Thailand 3.50 4.20
Fixed Income Market
The classical theory of positive RIR is now a myth!

28
Outlook of Fixed Income Securities
Declining interest rates provide opportunities for higher returns
With projection of decreasing interest rate, medium term fixed income instruments look attractive
Risks in Fixed Income Securities
Interest Rate Risk Reinvestment Risk Credit Risk Event Risk Inflation Risk
8/20
/200
8
10/1
3/20
08
12/6
/200
8
1/29
/200
9
3/24
/200
9
5/17
/200
9
7/10
/200
9
9/2/
2009
10/2
6/20
09
12/1
9/20
09
2/11
/201
0
4/6/
2010
5/30
/201
0
7/23
/201
0
9/15
/201
0
11/8
/201
0
1/1/
2011
2/24
/201
1
4/19
/201
1
6/12
/201
1
8/5/
2011
9/28
/201
1
11/2
1/20
110
2
4
6
8
10
12
14
16
18
Pakistan Investment Bond Yield
Pakistan Investment Bond Yield
Fixed Income Market

29
Challenges for Capital Markets

30
Challenges for Capital Markets in Pakistan
Capital markets move with overall economy - rather more sensitive
Lack of confidence amongst sponsors and investors – most wiped off
CGT/documentation and high handedness by tax authorities
Poor law & order conditions
Circular debt and energy crisis deteriorating company profitability, cash flow and balance sheets
Inconsistent policy response and reform implementation
Reluctance by sponsors to take viable companies to the stock market with limited response risk and lack of regulatory incentive
A required concerted effort by members to revive markets lowering mistrust and rebuilding relationships with regulators and stakeholders
“People of accomplishment rarely sat back and let things happen to them. They went out and happened to things.”
- Leonardo Da Vinci
31
Challenges for Capital Markets in Pakistan Market participants have been unable to move past the wait and see approach
Higher interest rate – higher return for pensioners and other fixed income investors with no or lower risk
Over/Under-regulation has decoupled the joint mandate of regulation and market development
Yet to start-off with Over-The-Counter (OTC) Market
Lack of support by Government of Pakistan in providing enabling environment
Shortage of financial products in comparison to developed markets
Keeping the foreign investor engaged in prevailing tougher economic conditions
Political and social instability has massively damaged and overall confidence level in the economy
Can Trading and Insider Trading be separated?
Overall E
ffect = L
ow
est Ever V
olu
mes

32
South Asia Others3%Trading
2%
Equities Broking95%
Need for Re-defining Business Model
UK
Treasury25%
Interest Rate
Derivative20%
Fixed Income33%
Others11%
Information Sales
3%
Equities Broking
8%
Comparison of Products ( South Asia vs UK)

33
Sole Proprietorship
Partnership
Private Limited Company
Public Limited Company
LISTED Public Limited Company
Pathway to Glory – Phases Towards Listing
It is vital for local companies to get listed in the equity markets of our country not only for the enhancement and growth of the markets but also to gain access to a more convenient & robust form of capital raising
Year KSE No. of IPOs Amount Raised (USD mn)
2007 14,076 10 85
2008 6,037 9 66
2009 9,387 3 17
2010 12,022 6 62
2011 11,762 4 35
32 USD 265mn
Realization and efforts by all stakeholders to give depth to the market

34
KSE – Value & VolumeM
ar-
07
Ap
r-0
7M
ay
-07
Jun
-07
Jul-
07
Au
g-0
7S
ep
-07
Oct
-07
No
v-0
7D
ec-
07
Jan
-08
Feb
-08
Ma
r-0
8A
pr-
08
Ma
y-0
8Ju
n-0
8Ju
l-0
8A
ug
-08
Se
p-0
8O
ct-0
8N
ov
-08
De
c-0
8Ja
n-0
9Fe
b-0
9M
ar-
09
Ap
r-0
9M
ay
-09
Jun
-09
Jul-
09
Au
g-0
9S
ep
-09
Oct
-09
De
c-0
9Ja
n-1
0Fe
b-1
0M
ar-
10
Ap
r-1
0M
ay
-10
Jun
-10
Jul-
10
Au
g-1
0A
ug
-10
Oct
-10
No
v-1
0D
ec-
10
Jan
-11
Feb
-11
Ma
r-1
1A
pr-
11
Ma
y-1
1Ju
n-1
1Ju
l-1
1A
ug
-11
Se
p-1
1O
ct-1
1N
ov
-11
De
c-1
1
-
100.00
200.00
300.00
400.00
500.00
600.00
-
2,000
4,000
6,000
8,000
10,000
12,000
14,000
16,000
18,000
Volume (mn LHS) KSE-100 Index (RHS)
KSE-100 Index + Volume

35
If Volumes Don’t Improve…

36
Corporate Profitability – Is it intact?
• ACCOUNTING PROFITS REAL PROFITS
Numerous profit generating corporate entities in Pakistan are facing liquidity dry-outs recently, mainly due to the energy crisis and mounting circular debt
Growth in Earnings is essential but Dividends must increase in the same
proportion as well

37
Can Capital Markets Perform Independent of the Economy?
P un ja bG ove rn oras sassin at
ME NA cris ise sca late s
R aym on dD avisi ssuea ffe ctsP a k-UStie s
P M L - Np a r ts wa ysw i th P P Pi n P u n j a b
MTSlau n che d
A d d i t i o n a lr e v e n u em e a s u r e sa n n o u n ce da ft e r I M Ft a l k s
S e c u r i t i e sL e n d i n ga n dB o r r o w i n gP r o d u c tl a u n c h e d
US says Pa kistan no td oi ng en ou gh toco mb at m il itan cy
U S for ces k il lO sa m a BinL a de n inA b bo tta b ad
M o o d y ’sg i v e sa s su r a n ceo nP a k i s ta n ’ sso v e r e i g nd e b t
FY 1 2 B u d g e ta n n o u n ce d
MQ M pa rtsways fro mcoa lit io n
Se llo ff in lin ew ith g lo ba leq ui ti es
D Rr e d u ce db y 5 0 b p s
D e te r i o r a ti n gl a w & o r d e ri n K h i
C P I t u m b l e sd u e t or e b a s i n g
G l o b a lr e c e s s i o nco n c e r n s +U S p r e ss u r eo n P a k i st a n
1 0 ,5 0 0
11 , 00 0
11 , 50 0
1 2 ,0 0 0
1 2 ,5 0 0
1 3 ,0 0 0
J a n -11 F e b -11 A p r-11 M a y -11 J u n -11 A u g -11 S e p -1 1 N o v - 11
U S a n n o u n c e sO p e r a ti o n Tw i s to n g l o b a lr e ce s si o n fe a r s
D R c u t b y1 5 0 b p s to1 2 %
F S V b e n e fi te n h a n ce d
C i r c u l a r d e b te x p o su r eco n v e r t e d t oG o P s e cu r i t i e s
P a k - I M FA r t i c l e IVta l ks
F B R t o e x a m i n es o u r c e o fi n v e s tm e n t i nc a p i ta l m kt s
N A T Oa tt a c k s a n dm e m os c a n d l e

38
Friendly Opposition
Political parties lack financial and economic
expertise
PTI talks about
revolution; Reality or Over-confidence?
Challenging Political Environment
I feel that the failure of Common-Wealth Games and success of China Olympics shows that Democracy may not be the solution to all the ills!

39
Lessons Learned
Imposition of floor was a disastrous decision
Failure of regulator to save the Non-Banking Financial Institutions (NBFIs)
Monopolistic scenario in the banking sectorCapital hoardingBig 5 only protecting their RoEEnjoying highest banking spreads
A few industries were over-leveraged due to which they had to face the music
Success stories like Engro and Nishat need to be respected rather than envied
Over-regulated equity market creates no value
•“Interfering with market mechanism BACKFIRES!!!”
The brokerage community in Pakistan was content with plain-vanilla trading services dealing primarily in the Ready Market which led to overdependence on market volumes and vulnerability in the earnings stream.

40
The Way Forward???

41
It has been a tough period for all financial markets since the economic meltdown began in 2008, but there is always a new beginning
Integration
Demutualization
IPOs to keep the primary markets alive
De-regulation
New products
Tax structure
Investor awareness
The Way Forward!!!
42
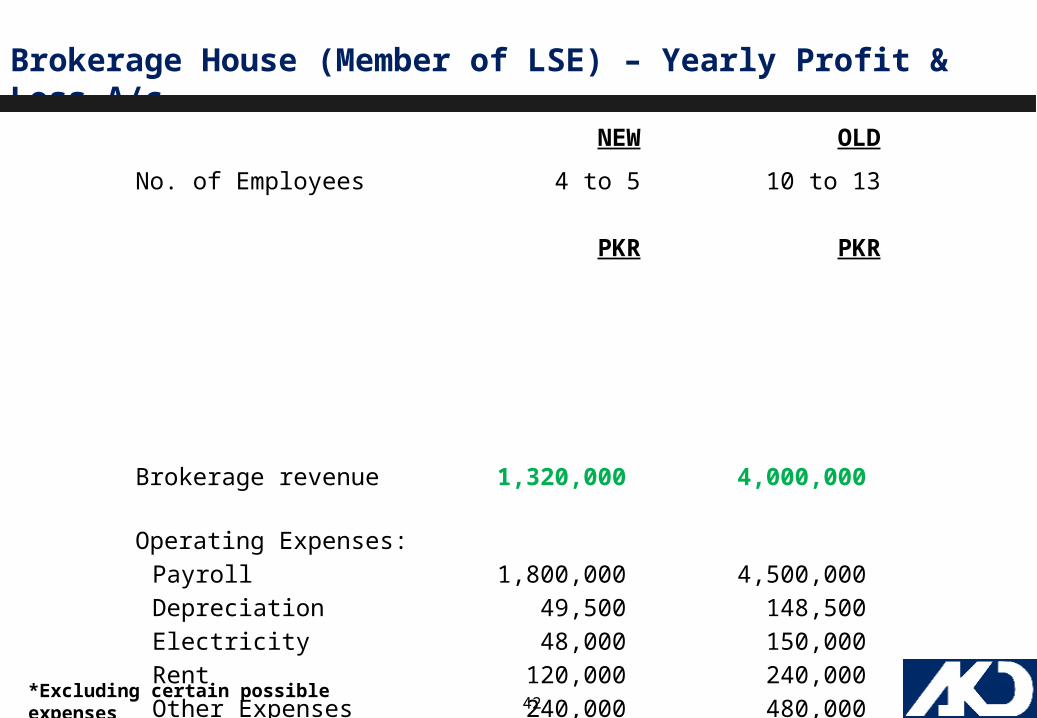
Brokerage House (Member of LSE) – Yearly Profit & Loss A/c
NEW OLD
No. of Employees 4 to 5 10 to 13
PKR PKR
Brokerage revenue 1,320,000 4,000,000
Operating Expenses:Payroll 1,800,000 4,500,000 Depreciation 49,500 148,500 Electricity 48,000 150,000 Rent 120,000 240,000 Other Expenses 240,000 480,000 Audit & Certification Fee 50,000 150,000
2,307,500 5,668,500
Net Loss Per Annum* (987,500) (1,668,500)
*Excluding certain possible expenses

43
Thank You!!!