The Neritic Zone includes: Supratidal Zone Intertidal Zone Subtidal Zone.
Eyasu E. Is soil fertility declining? 1○
○
○
○
○
1Perceptions of soil fertility decline inEthiopiaAgriculture is the mainstay of the Ethiopian economy, but production has been stagnatingfor the last 20 years. Erratic rainfall and drought have affected production in certainyears but their influence on production trends is limited. Emerging constraints onagricultural production in Ethiopia include land degradation, soil erosion and decline insoil fertility. Many studies report soil fertility decline for all regions of Ethiopia, and someeven suggest that a national disaster is looming on the horizon (Barber, 1984; FAO,1986; Hurni, 1988; Campbell, 1991; Bojo and Cassels, 1995). It is now generally acceptedthat there is a decline in the fertility of agricultural soils throughout the country, due toreduction in the length of fallow periods, lower levels of fertiliser application, completeremoval of crop residues from fields, use of dung as a household fuel, and lack ofadequate soil conservation practices (Bojo and Cassels, 1995).
However, all these reports discuss soil fertility decline at a national scale, while analysisof farmers’ soil management practices is mostly lacking. Ethiopia is a large country witha wide diversity of socio-economic and agro-climatic conditions and farming systems.How reliable is this generalised analysis of soil fertility decline? What is the picture atlocal level? This study analysed the local level via a detailed case study of farmers’ soilfertility management practices in the Kindo Koisha district in South West Ethiopia.
Location, climate and soilsA series of Rapid Rural Appraisal surveys carried out in Wolaita have indicated thatagriculture has not progressed over the last 15 years and yields of major crops havedropped significantly. Despite its greenness it is one of the major food deficit and famineprone areas in the country. Since the 1984/85 drought the people have suffered regularfood deficits, entailing costly famine-relief operations. Wolaita has therefore been called‘the land of green famine’ (FARM-Africa, 1992).
Introductionand background
Managing Africa’s Soils: No.22 ○
○
○
○
○
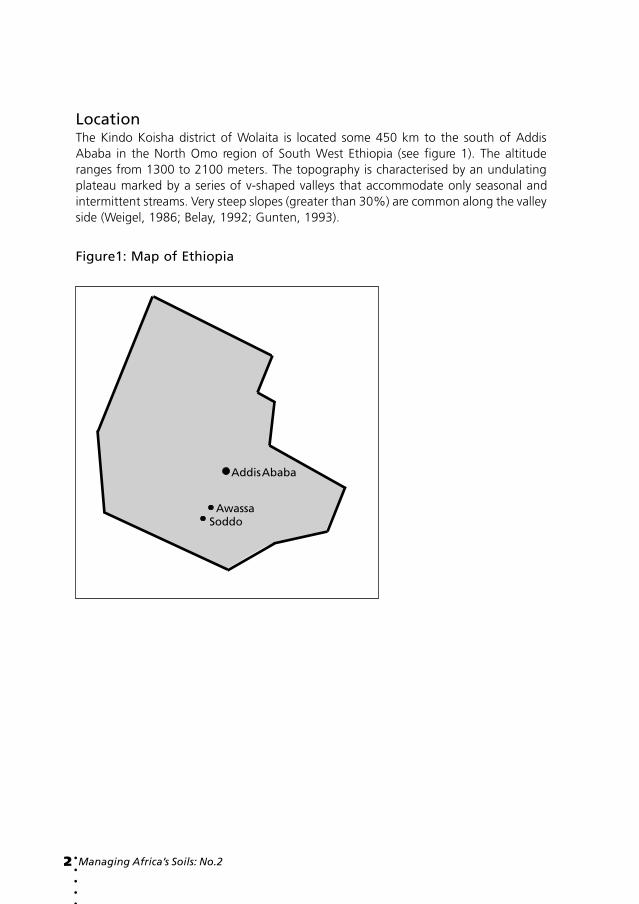
LocationThe Kindo Koisha district of Wolaita is located some 450 km to the south of AddisAbaba in the North Omo region of South West Ethiopia (see figure 1). The altituderanges from 1300 to 2100 meters. The topography is characterised by an undulatingplateau marked by a series of v-shaped valleys that accommodate only seasonal andintermittent streams. Very steep slopes (greater than 30%) are common along the valleyside (Weigel, 1986; Belay, 1992; Gunten, 1993).
Figure1: Map of Ethiopia
Addis Ababa
AwassaSoddo
Eyasu E. Is soil fertility declining? 3○
○
○
○
○
The semi-humid to humid zone, with an altitude ranging from 1800 to 2400 meters, isagriculturally the most important zone in Wolaita. This zone is densely populated andaccounts for more than 85% of the total human and livestock population, and over90% of the total crop production of Wolaita (WADU, 1976). The lowlands have poorersoils and receive less rainfall. Agriculture in these areas started in the 1970s throughgovernment settlement programmes that intended to alleviate the problem of landshortage in the highlands. Lowland farmers are more vulnerable because of lower cropyields and a higher occurrence of human diseases (malaria) and livestock disease(trypanosomiasis).
The overall population densities of the district are 375 and 110 people per km2 in thehighland and lowland zones respectively. Densities as high as 520 persons per km2
have been recorded in some sub-areas in the highlands (Weigel, 1986). Populationgrowth rate in the district is estimated at 4.8 per cent per year. This makes the KindoKoisha District one of the most densely populated parts of Ethiopia1. Dispersedhomesteads is the main settlement pattern.
ClimateThe average annual rainfall for the area is 1272 and 924 mm/year in the highland andlowland zones respectively. The rainfall pattern is bi-modal. The short rains (Belg season)fall from March to May while the big rains (Kremt or Meher season) fall between Juneand October. In recent years the area has experienced great variability in the occurrenceand volume of rainfall, causing crop failure.
SoilsThe dominant soils are Eutric Nitosols, which cover about two-thirds of the area. Thesesoils have a preponderance of kaolinitic minerals and are inherently very low in nutrientand organic colloids, especially in the lowlands. The level of potassium is howevergenerally high. They require inorganic and organic fertilisers to produce attractive yields(WADU, 1976). The soils are also characterised by very deep weathering and intenseleaching. They have good physical properties for rooting, are well-drained with a highwater holding capacity, and have a homogenous and well developed structure. Theyare silty clay in texture (Weigel, 1986).
Soil erosionThe estimated average net soil loss rate in Wolaita is 75 mt/ha/year on cultivated fields(Belay Tegene, 1992). Nutrients in the Eutric Nitosols are concentrated in the top 20 cmwhile the sub-soil is very poor in nutrients. The impact of erosion on soil fertility istherefore severe (Weigel, 1986). Conservation measures, such as soil bunding, tiedridges and terracing, which are common in other parts of Ethiopia, have not beenwidely adopted in Kindo Koisha. Physical structures are unattractive to farmers because
1 The national average population density is 84 persons per square km and population growth is 3.0%.

Managing Africa’s Soils: No.24 ○
○
○
○
○
it makes ploughing with oxen difficult, and the large portion of land taken out ofproduction (FARM Africa, 1992). Also, farmers claim that rodents make their nests inthe bunds, attack field crops and are difficult to control.
The farming systemLand useFarming systems of Kindo Koisha are based on mixed crop and livestock production. Inthe 1980s, 72% of the area was arable land, 15% covered by bush, grassland andwoodlot, and 13% comprised houses and front yards (Weigel, 1986). The houses aresurrounded by enset and coffee gardens, inter-cropped with some banana, ginger, pepper,taro root and sometimes even maize. Most households in the highlands depend heavilyon this intensively manured garden system for their livelihood. Lack of manure, however,is a major constraint for its productivity.
Cropping patternMajor crops of the area are enset (Ensete ventricosa or Musa ensete), maize (Zea mays),sorghum (Sorghum bicolor), sweet potato (Ipomoea batatas), Wolaita potato (Coleusedulis), teff (Eragrostis Tef), taro root (Colocasia esculenta), yam (Dioscorea sp), Irishpotato (Solanum tuberosum), haricot bean (Phaseolus vulgaris), barley (Hordiumvulgarae), and, to a limited extent, wheat (Triticum aestivum). Staples are enset, maizeand root crops. Enset is cultivated mostly in the highlands and provides food for aboutten million people in the southern region of Ethiopia. Enset is a drought resistant, semi-perennial that takes four to seven years to mature. It requires a continuous applicationof manure. The cultivation of enset has given rise to an intensive production systeminvolving year round cultivation of the land, and greater integration between livestockand crop production systems (Jenden, 1994).
Maize is the major cereal. Early maturing maize varieties are planted on the homesteadfields to provide food during the hungry season. Many farmers also grow maize andteff as cash crops. Sorghum is becoming more important in the lowlands because itperforms well in poor soils and is more drought resistant than maize. Haricot bean is theonly legume crop that is cultivated, particularly in the lowlands. Cassava (Manihotesculenta) has recently been introduced and is becoming an important food securitycrop.
Farmers practice double cropping, inter-cropping, relay cropping, rotation etc., takingadvantage of the bi-modal pattern of the rains. Fields are cultivated throughout theyear as crop production continues from one season to the next. Hoes are used to cultivategardens and rocky soils on steep slopes. Other fields are cultivated with a woodenplough, which has an iron point that does not turn over the soil and is drawn by twooxen. Land is ploughed 3-5 times to loosen the soil before planting.
Eyasu E. Is soil fertility declining? 5○
○
○
○
○
There is an overlap of operations during peak seasons. For example, land preparationfor kremt crops such as teff and sweet potato coincides with weeding and harvesting ofbelg crops, often causing labour shortages. However, timely preparation of the seedbed and early planting is critical to establish the crop while sufficient moisture is stillavailable. Farmers therefore use a variety of co-operative and traditional labour exchangeschemes, in addition to the mobilisation of family labour (see Data, 1998).
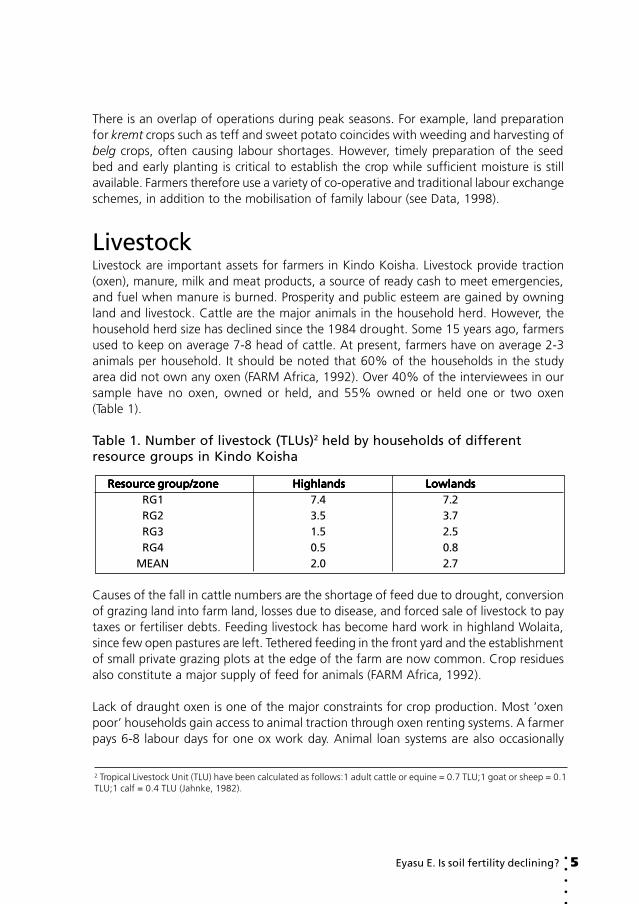
LivestockLivestock are important assets for farmers in Kindo Koisha. Livestock provide traction(oxen), manure, milk and meat products, a source of ready cash to meet emergencies,and fuel when manure is burned. Prosperity and public esteem are gained by owningland and livestock. Cattle are the major animals in the household herd. However, thehousehold herd size has declined since the 1984 drought. Some 15 years ago, farmersused to keep on average 7-8 head of cattle. At present, farmers have on average 2-3animals per household. It should be noted that 60% of the households in the studyarea did not own any oxen (FARM Africa, 1992). Over 40% of the interviewees in oursample have no oxen, owned or held, and 55% owned or held one or two oxen(Table 1).
Table 1. Number of livestock (TLUs)2 held by households of differentresource groups in Kindo Koisha
Resource group/zoneResource group/zoneResource group/zoneResource group/zoneResource group/zone HighlandsHighlandsHighlandsHighlandsHighlands LowlandsLowlandsLowlandsLowlandsLowlandsRG1 7.4 7.2RG2 3.5 3.7RG3 1.5 2.5RG4 0.5 0.8
MEAN 2.0 2.7
Causes of the fall in cattle numbers are the shortage of feed due to drought, conversionof grazing land into farm land, losses due to disease, and forced sale of livestock to paytaxes or fertiliser debts. Feeding livestock has become hard work in highland Wolaita,since few open pastures are left. Tethered feeding in the front yard and the establishmentof small private grazing plots at the edge of the farm are now common. Crop residuesalso constitute a major supply of feed for animals (FARM Africa, 1992).
Lack of draught oxen is one of the major constraints for crop production. Most ‘oxenpoor’ households gain access to animal traction through oxen renting systems. A farmerpays 6-8 labour days for one ox work day. Animal loan systems are also occasionally
2 Tropical Livestock Unit (TLU) have been calculated as follows:1 adult cattle or equine = 0.7 TLU;1 goat or sheep = 0.1TLU;1 calf = 0.4 TLU (Jahnke, 1982).

Managing Africa’s Soils: No.26 ○
○
○
○
○
used. A farmer who has one ox can also team up with another farmer in a similarsituation. There are more farmers with no access to livestock in the lowlands than in thehighlands, because they cannot afford the veterinary medicine. This deters livestockrich farmers from entrusting their animals to them on loan. Those who do not ownoxen can also switch to share cropping arrangements if they own a plot of agriculturalland.

Eyasu E. Is soil fertility declining? 7○
○
○
○
○
2Methods and design of the studyVarious methods have been used for data collection, such as informal group discussions,farm surveys, resource flow diagrams drawn by case study farmers, and monitoring ofnutrient inputs and outputs. The informal interview sessions with farmers took place atvillage level, using several Participatory Rural Appraisal (PRA) techniques. Discussiontopics were the agricultural history of the area and changes in crop yields, soil fertilitymanagement, cropping patterns and livestock husbandry. Special attention was givento the driving forces that brought about changes in these practices. A participatorywealth ranking exercise was employed (Grandin, 1988) to stratify farmers into differentsocio-economic categories. Major local indicators of wealth are draught oxen ownership,herd size and the size of land holdings. The resource groups identified were: ‘richer’farmers (RG1), medium farmers (RG2), poor farmers (RG3) and very poor farmers (RG4).A stratified sample of 100 households was then randomly drawn for the farm survey.The questionnaire focused on current soil fertility management practices, the socio-economic variables affecting soil fertility management, and perceptions of change incrop yields and levels of soil fertility.
Thereafter, eight case study farms were selected. They represented each of the fourresource groups in both the highlands and the lowlands. Resource flow diagrams weredrawn by case study farmers in which they depicted the various field types, sources ofnutrients, and the pattern of nutrient flows within their farms. This was followed by ayear-long monitoring of soil fertility management practices and nutrient input and outputprocesses (with emphasis on N and P) for the enset garden, ‘darkua’3 maize field and‘shoka’4 maize fields. The data generated were then used to calculate partial nutrientbudgets. Composite samples of fresh manure from livestock pens and leaf litter fromwidely used trees were collected and analysed for composition of N and P and moisture
Objectives andmethods of the study
3 Darkua is situated near the homestead and refers to all organically fertilised fields.4 Shoka fields are situated at a greater distance from the homestead. They receive almost no organic fertiliser butmineral fertiliser may be applied. Some fields are cultivated with no fertility input at all.

Managing Africa’s Soils: No.28 ○
○
○
○
○
content (see annex 1). Sub-samples of harvested products and residues of maize, enset,teff and haricot bean were taken for determination of nutrient composition (see annex2).
Characteristics of the farm componentsThe size of the various farm components per resource group is presented in Table 2.
Table 2. Area (ha) per farm component for the case study farms
HighlandsHighlandsHighlandsHighlandsHighlands LowlandsLowlandsLowlandsLowlandsLowlands
ResourceResourceResourceResourceResource Total Enset Darkua Shoka Total Darkua Shoka Shokagroupgroupgroupgroupgroup farm size* garden maize maize farm size* maize maize other**
RG1RG1RG1RG1RG1 1.22 0.20 0.30 0.40 3.0 0.50 1.0 1.4RG2RG2RG2RG2RG2 1.05 0.20 0.20 0.50 2.65 0.50 1.0 0.9RG3RG3RG3RG3RG3 0.7 0.10 0.20 0.20 2.28 0.40 0.75 1.0RG4RG4RG4RG4RG4 0.22 0.04 0.10 0.04 0.53 0.10 0.10 0.2
*Total farm size does not add up because other components such as the taro fields are not included in the Table
**Other crops grown are teff, haricot bean, sweet potato and sorghum
There is considerable variation in total farm size and the size of the components acrosssocio-economic groups. Total farm size varies from 0.2 to 1.2 hectares in the highlandsand from 0.5 to 3.0 ha in the lowlands. Richer farmers have bigger areas under all ofthe components compared to poorer farmers in both zones. They also have a relativelylarge proportion of the total cultivated area under the shoka system, while stillmaintaining a considerable area as enset garden and darkua fields. The shoka proportionis lowest for the poorer farmers.
The chemical characterisation of farm components of the eight farms studied is providedin Table 3.
Table 3. Chemical characterisation of the farm components
Highland Farm Components Highland Farm Components Highland Farm Components Highland Farm Components Highland Farm Components Lowland Farm Components Lowland Farm Components Lowland Farm Components Lowland Farm Components Lowland Farm ComponentsParameterParameterParameterParameterParameter Enset Darkua Shoka Darkua Shoka T T T T Testedestedestedestedested Garden Maize Maize Maize Maize
Total N (%) 0.19-0.37 0.25-0.34 0.17-0.24 0.10-0.14 0.10Av.P (ppm) 22-69 7-67 3-7 6-7 4-5Org. Matt (%) 6.0-7.7 5.4-5.9 4.3-5.8 2.8-3.3 2.5-2.8pH 6.6-7.5 6.0-7.4 5.2-6.4 6.6-7.5 6.2-6.8CEC 29-34 26-32 25-29 17-19 16-20

Eyasu E. Is soil fertility declining? 9○
○
○
○
○
Soil test results reveal that most of the fields receiving applications of manure (i.e. theenset-garden and darkua) had higher levels of nitrogen, phosphorus, organic matterand CEC relative to the shoka (Table 3). The very high levels of available phosphorus inthe enset garden are perhaps due to reduced P-fixation as a result of manuring. Manyshoka fields have received DAP application since the early 1970s. The rather low pH ofthe shoka soil in the highlands suggests the possibility of an acidifying effect of continuedDAP use.
Managing Africa’s Soils: No.210 ○
○
○
○
○
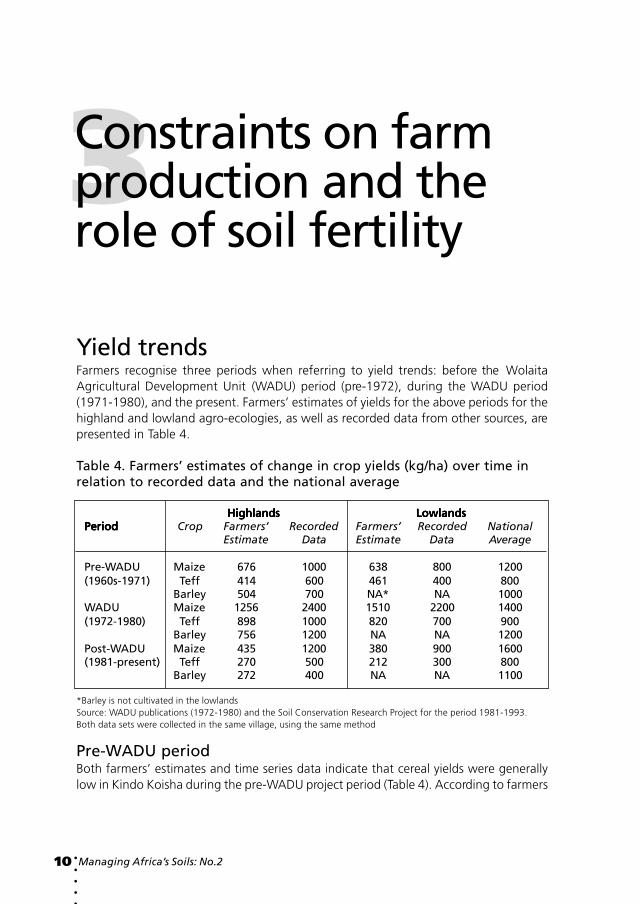
3Yield trendsFarmers recognise three periods when referring to yield trends: before the WolaitaAgricultural Development Unit (WADU) period (pre-1972), during the WADU period(1971-1980), and the present. Farmers’ estimates of yields for the above periods for thehighland and lowland agro-ecologies, as well as recorded data from other sources, arepresented in Table 4.
Table 4. Farmers’ estimates of change in crop yields (kg/ha) over time inrelation to recorded data and the national average
HighlandsHighlandsHighlandsHighlandsHighlands LowlandsLowlandsLowlandsLowlandsLowlandsPeriodPeriodPeriodPeriodPeriod Crop Farmers’ Recorded Farmers’ Recorded National
Estimate Data Estimate Data Average
Pre-WADU Maize 676 1000 638 800 1200(1960s-1971) Teff 414 600 461 400 800
Barley 504 700 NA* NA 1000WADU Maize 1256 2400 1510 2200 1400(1972-1980) Teff 898 1000 820 700 900
Barley 756 1200 NA NA 1200Post-WADU Maize 435 1200 380 900 1600(1981-present) Teff 270 500 212 300 800
Barley 272 400 NA NA 1100
*Barley is not cultivated in the lowlandsSource: WADU publications (1972-1980) and the Soil Conservation Research Project for the period 1981-1993.Both data sets were collected in the same village, using the same method
Pre-WADU periodBoth farmers’ estimates and time series data indicate that cereal yields were generallylow in Kindo Koisha during the pre-WADU project period (Table 4). According to farmers
Constraints on farmproduction and therole of soil fertility

Eyasu E. Is soil fertility declining? 11○
○
○
○
○
this was due to declining soil fertility. Farmers grew crops by applying organic inputs onhomestead fields and used fallow periods on the distant fields. However, land wasbecoming scarcer due to rapid population growth and fallow periods became too shortto restore soil fertility. Moreover, herd sizes decreased as less land remained availablefor grazing, diminishing the availability of animal manure. Fertiliser was not yet knownin the area.
WADU periodWADU launched an extension and credit service for farmers in the early 1970s,demonstrating and popularising the use of fertilisers, pesticides and improved seedswith the aim of boosting productivity through increased input use. WADU regularlysupplied farmers with inputs on a credit basis and also provided transport and marketingfacilities. Extension services were particularly targeted to the settlement areas in thelowlands. According to farmers, maize and teff yields in both agro-ecological zonesdoubled during the WADU period. The recorded data showed higher levels of yieldincrease, particularly in the lowlands where crop production was even above the nationalaverage. Farmers explain the yield improvement during the WADU time as the result ofincreased use of chemical fertiliser and better access to draught oxen. They think thatthe use of improved seeds or changing agronomic practices was less important.
Post-WADU periodThe phasing-out of the WADU in 1980 had a negative effect on agricultural productionand crop yields. Following the phasing out of WADU’s programme in the early 1980s,subsidies on fertilisers ended in Wolaita5 and fertiliser prices have increased by over150%. At present, most farmers do not have the means to buy fertilisers regularly,while lending conditions for institutionalised credit have become stricter. During theWADU period, the area cultivated with improved maize varieties had expanded. However,these varieties suffer without adequate supply of fertility inputs, which partly explainsyield decline during the post-WADU period. Farmers are once again reliant on theintensive use of organic manuring, but there is not enough available to fertilise shoka-outfields. Crop failures have become common, causing serious food shortages andfamine in the area (see Eyasu, 1997).
Farmers estimate that current yields in the shoka fields are falling below even the pre-WADU levels. This is not confirmed by the recorded data, which indicate a decline forboth agro-ecological zones just after the phasing out of WADU. At present, crop yieldsremain stable and are above the pre-WADU level. However, it should be noted thatthese recorded data must be treated with some caution as they were taken from anywherein farmers’ fields without considering variability in soil fertility between darkua andshoka fields (Eyasu, 1997).
5 There is government subsidy on fertilisers for the high potential cereal regions such as the central highlands ofEthiopia but not in Wolaita.
Managing Africa’s Soils: No.212 ○
○
○
○
○
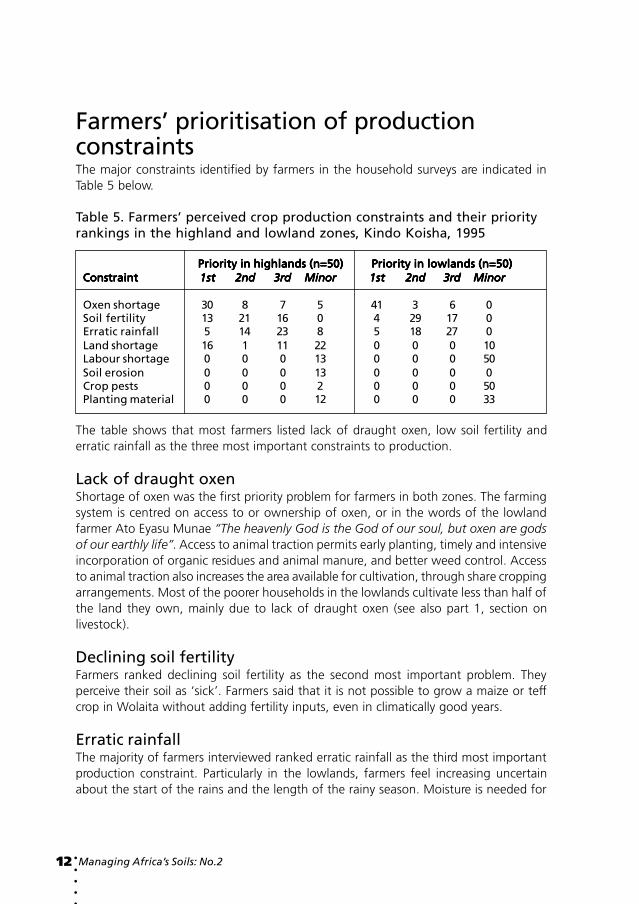
Farmers’ prioritisation of productionconstraintsThe major constraints identified by farmers in the household surveys are indicated inTable 5 below.
Table 5. Farmers’ perceived crop production constraints and their priorityrankings in the highland and lowland zones, Kindo Koisha, 1995
Priority in highlands (n=50) Priority in lowlands (n=50) Priority in highlands (n=50) Priority in lowlands (n=50) Priority in highlands (n=50) Priority in lowlands (n=50) Priority in highlands (n=50) Priority in lowlands (n=50) Priority in highlands (n=50) Priority in lowlands (n=50)ConstraintConstraintConstraintConstraintConstraint 1st1st1st1st1st 2nd2nd2nd2nd2nd 3rd3rd3rd3rd3rd MinorMinorMinorMinorMinor 1st1st1st1st1st 2nd2nd2nd2nd2nd 3rd3rd3rd3rd3rd MinorMinorMinorMinorMinor
Oxen shortage 30 8 7 5 41 3 6 0Soil fertility 13 21 16 0 4 29 17 0Erratic rainfall 5 14 23 8 5 18 27 0Land shortage 16 1 11 22 0 0 0 10Labour shortage 0 0 0 13 0 0 0 50Soil erosion 0 0 0 13 0 0 0 0Crop pests 0 0 0 2 0 0 0 50Planting material 0 0 0 12 0 0 0 33
The table shows that most farmers listed lack of draught oxen, low soil fertility anderratic rainfall as the three most important constraints to production.
Lack of draught oxenShortage of oxen was the first priority problem for farmers in both zones. The farmingsystem is centred on access to or ownership of oxen, or in the words of the lowlandfarmer Ato Eyasu Munae “The heavenly God is the God of our soul, but oxen are godsof our earthly life”. Access to animal traction permits early planting, timely and intensiveincorporation of organic residues and animal manure, and better weed control. Accessto animal traction also increases the area available for cultivation, through share croppingarrangements. Most of the poorer households in the lowlands cultivate less than half ofthe land they own, mainly due to lack of draught oxen (see also part 1, section onlivestock).
Declining soil fertilityFarmers ranked declining soil fertility as the second most important problem. Theyperceive their soil as ‘sick’. Farmers said that it is not possible to grow a maize or teffcrop in Wolaita without adding fertility inputs, even in climatically good years.
Erratic rainfallThe majority of farmers interviewed ranked erratic rainfall as the third most importantproduction constraint. Particularly in the lowlands, farmers feel increasing uncertainabout the start of the rains and the length of the rainy season. Moisture is needed for
Eyasu E. Is soil fertility declining? 13○
○
○
○
○
decomposition of organic manure and residues, and for efficient use of mineral fertiliser.One farmer stated: “Fertiliser without moisture from the rain is no better than putting astone or sand in the field. Non-manured or non-fertilised crops are only good as fodderregardless of the rainfall” (Beyene Anebo, from Dogeshakisho PA).However, the effect of rainfall on yields should not be overestimated. Kindo Koishanormally receives adequate rainfall, particularly the highlands, where nutrient supplyseems more limiting than moisture. In the lowlands, however, both nutrients and moisturesupply are limiting factors (Eyasu, 1997).
Farmers’ perceptions of changes in soilfertilityThe two key words describing soil fertility in the local language are arada (fertile) andlada (infertile). Farmers characterise arada soil as dark, rich, thick and ‘powerful’, andlada soil as red, poor, thin and ‘powerless’. Farmers repeatedly stated that soil fertilitydeclined over the last 15 years, particularly in the shoka fields. In their opinion, soilshave become ‘lada’ and addicted to fertiliser, needing more of it than in the past. Thismay suggest that the soil quality is declining. Soil acidification may have become aproblem due to the continuous use of DAP over the last 25 years. Acidified soils absorblarge quantities of phosphate-fertiliser, reducing yield response. Larger doses of fertiliserare then required to satisfy plant requirements, thus creating the perception of soilsbecoming addicted to fertiliser.
Farmers’ indicators of soil fertility changeFarmers’ notions of change in soil fertility are based on observing changes in the physicalstate of the soil, in weed vegetation, stunted growth and colour change of crops, andlow crop yields in climatically good years.
Change in soil colour and weightSoil colour is an important criterion. Black soils are considered fertile and productive,while red or light soils are viewed as infertile. Farmers complain that their soil has become‘bleached’, dust-like and hard to work. Water enters the soil with difficulty as the levelof fertility declines. In the past the surface soil was dark and water entered easily butnow the surface soil has become red. This may suggest changes in the organic mattercontent, and the deterioration of physical structure such as the water holding capacity.
Change in weed population and speciesFarmers observed a fundamental change in weed flora over the last 15 years. In the1970s, when the soil was fertile, dominant weed species in the fields were maga matta
Managing Africa’s Soils: No.214 ○
○
○
○
○
(Urochloa panicoides) and dalasha (Commelina benghalensis). These weeds are indicatorsof high levels of soil fertility and also enrich the soil as they supply easily decomposablebiomass once pulled out. They are still found in some enriched niches, including ensetgardens and darkua maize areas which are highly fertile. When soil fertility declined,these species disappeared from the shoka fields and other farm areas. These fields arenow invaded with girolea (Phalaris eragrostis spp), notably in the lowlands, and bisdia(Galinsoga parviflora), petta (unidentified species), lichea (Digitaria spp) and woche(unidentified species).
Reduced growth and colour change of cropsCrops grown on good soil will grow fast and are dark green. Those cultivated on a poorsoil grow slowly and do not mature on time, show stunted growth and become palegreen, yellow or purple-red. Some of these indicators are similar to nutrient deficiencysymptoms used in scientific literature. These deficiency symptoms have strongmanagement implications for farmers. Responses are careful timing and targetedapplication of fertiliser and manure.
Low crop yields in climatically good yearsLow yields in a year with a good seasonal distribution and adequate annual volume ofrainfall is another important indicator for farmers. However, low crop yields are notperfect indicators of soil fertility decline since these can also be caused by a range ofother socio-economic factors, such as a scarcity of draught oxen. Moreover, soil fertilitydecline (or nutrient depletion) is a slow process that can take place even withoutnoticeable reduction in yields in the shorter term (Smaling, 1993). For example, it hasbeen found that land degradation due to erosion and loss of organic matter has beenextensive throughout Ethiopia, but yields have remained more or less uniform, albeitlow (FAO, 1986).
Factors causing soil fertility declineFarmers identified various factors that are causing a decline in soil fertility in their farms(especially on the shoka fields).
Decline in manure applicationMost Kindo Koisha farmers rely on organic inputs (animal dung, house refuse andsweepings of organic materials) for their soil fertility maintenance. However, the level ofmanure produced at present is very low compared to the past. Fifteen years ago, anaverage household in the highlands used to transport 10-15 tonnes of manure per yearto the field. The present amount is only 3-5 tonnes per year. The same trend is observedin the lowlands. Reasons given are a decline in herd size (see also section on livestock,part 1). Richer farmers still hold relatively large numbers of livestock and hence have

Eyasu E. Is soil fertility declining? 15○
○
○
○
○
larger amounts of manure to fertilise the soil than resource-poor farmers in both zones.Soil fertility maintenance is thus affected by the wealth status of the household.
The beneficiary crops in the highlands are enset and coffee, the darkua maize field, androot and crop fields (sweet potato, taro root and Wolaita potato). The pattern is almostthe same in the lowlands, except that they do not grow enset. There, manure is mainlydirected to the taro root, and darkua maize fields, with some application on infertilepatches in more distant fields.
All farmers use bedding materials (straw and crop residue) in the livestock pen andcollect the manure. Some farmers also collect dried dung from grazing areas to be usedas fuel in the dry season. There is no manure exchange system among households.Farm manure is highly appreciated and a scarce resource which no one is willing to giveto his neighbour. When asked if she had ever received manure from relatives, a womanfrom Doge Shakisho PA responded, “Would you give someone your life?”. The majorityof richer farmers indicated that they would rather give out a calf on a loan basis than abasket of dung to a relative. No farmer reported storage of manure. Currently, manureamounts are so small that it is removed from livestock pens once or twice a week andapplied right away to the field.
Manure is transported to different fields largely by women and children using bamboo-made baskets smeared with dung. Men identify the infertile patches for spot application.Even though the task is arduous, poorer farmers rarely weigh the labour costs ofmanuring. However, a few richer farmers complained about lack of transport equipmentto transfer manure to distant fields.
Decline in fertiliser applicationThe practice of mineral fertilisation was first introduced by WADU in the 1970s andmaize became the priority crop. Fertiliser application rates are declining. The averagerates applied by households at present and 15 years ago are 43 and 133 kg/ha,respectively (Eyasu, 1997).
The richer farmers in the highlands used the largest quantities per hectare becauselowland soils are more sensitive to erratic rainfall. Resource-poor farmers find fertiliserexpensive but they still purchase small quantities from local traders and apply it carefullyto individual plants. The application of fertiliser right at planting indicates a poorsynchronisation with the crop requirements which may result in soil acidification. Fertilisersupply comes under the auspices of the Ministry of Agriculture (MOA) and is distributedvia the local Service Co-operatives (SC). However, supply is inadequate and not timely,giving rise to black market retail trading of fertilisers. Many farmers stated that latearrival was a reason for their withdrawal from fertiliser use.
Managing Africa’s Soils: No.216 ○
○
○
○
○
The official price of fertiliser has soared over the last 20 years in Wolaita from 36 birr/qin 1974 to 180 birr/q in 1994, and ‘black market’ fertiliser is often sold at even higherprices. In the 1970s credit from WADU enabled poor farmers to purchase fertiliser. Atpresent over 30% of the farmers mentioned limited access to credit. A sizeable numberof farmers stated that they are not eligible for MOA credit due to lack of oxen ownershipand their land holdings being too small. The SC enforce debt payments stringently andthere are various forms of penalties for farmers who fail to pay their debts. They alsobecome ineligible for future credit unless they clear previous debt. Farmers who haveaccumulated debts over several years may be put in jail or their cattle may be sequestered.In the 1994 season, 52% of farmers who received fertiliser from MOA on credit defaultedon their repayments. Some sold part of the iron sheet roofing of their house in order toescape the penalties.
Excessive drying of the soilAccording to 55% of the farmers interviewed, severe drying of the soil contributes to adecline in soil fertility. They complain that well-cultivated land is exposed to wind erosionin the dry season, which selectively removes fine and fertile particles of the soil.Furthermore, beetles form tunnels inside the dung applied to bare ground in the dryseason, and transport the dung below the rooting zone of crops, thus reducing thenutrient contribution of manure.
Continuous croppingIn the highlands land shortage is a serious problem and farmers almost invariably practicecontinuous cultivation of the land. Double cropping of teff or sweet potato after maizein the meher season is widely practised, even though farmers realise that it exhausts thesoil. Intensive cultivation has also meant a continuous succession of cereals and rootcrops leading to nutrient depletion and decline in organic matter.
ErosionSome 20% of farmers from the highlands reported erosion as a factor in the decline insoil fertility. In the lowlands the problem is rarely mentioned.
Villagisation‘Villagisation’ or resettlement was mentioned only by lowland farmers. They were forcedto settle elsewhere between 1986 and 1991, leaving behind their enriched home gardens.They had to reduce the manure inputs because of the distance between the fields andthe settlement areas. When farmers were allowed to return to their former locationthey say that the fertility of the soil, especially the garden plot, had declined during theirabsence.

Eyasu E. Is soil fertility declining? 17○
○
○
○
○
The model usedThis section discusses the nutrient balances for eight case study farms in 1995,representing the four resource groups in both the highlands and lowlands. These balancesare calculated for identifying areas in the farm where nutrients are lost, accumulate, orin equilibrium, and thereby identify room for improvement. Nitrogen (N) and Phosphorous(P) balances were calculated for four major farm components: enset, taro darkua andshoka. Four input and five output functions are monitored. The input flows are mineralfertiliser (IN1); organic manure (IN2), comprising animal manure and household refuse(IN2a), and leaf litter (IN2b), atmospheric deposition (IN3), and biological N-fixation(IN4)6. The major output flows quantified were removals in harvested products (OUT1),crop residue removals (OUT2), leaching (OUT3), denitrification (OUT4), and water erosion(OUT5) (Stoorvogel and Smaling, 1990). Farm level nutrient balances were calculated byaggregating the inputs and outputs in all the fields within a farm area, and thenextrapolated on an area basis (kg/ha).
Major sources of nutrient inputs andoutputsFigure 2 summarises the input and output flows of nitrogen and phosphorus in fourfarm components in the highland and lowland zones. The major source of N and P forthe enset, darkua and taro fields was animal manure along with household refuse,leftover feed and organic sweepings from around the house (IN2) (see also annexes 3 to6). Household refuse and organic sweepings around the house were used on homesteadfields more to improve physical structure and nutrient retention than for their nutrientcontent. Poor farmers also collect leaf litter from selected broad leafed trees such asErythrina, Croton and Cordia species grown on farm boundaries and grazing areas, andapplied it to augment soil fertility.6 Sedimentation, identified as IN5 in the original model (Stoorvogel and Smaling, 1990), is not relevant in Kindo Koishasince there are no irrigation schemes or flood plains.
4Nutrient input andoutput balance offields and farms

Managing Africa’s Soils: No.218 ○
○
○
○
○
The mineral fertiliser used is mainly DAP, which is the main source of nutrient additionto the shoka system (IN1). Poor farmers in the highlands also applied judicious amountsof manure as a supplement to the limited input of mineral fertiliser (S4 in annexes 3 and4). Inputs from atmospheric deposition (IN3) are generally estimated to be small. Inputfrom biological fixation (IN4) was assumed to be zero in the highlands because of theabsence of legumes in the rotation, but exists in the lowlands where the haricot bean iscommonly planted. However, the quantity of N added through fixation was relativelylow (4 to 8 kg/plot in the shoka). This is probably because of the low N-fixing potentialof the crop, low P availability in the soil and a low pH. All these factors limit N-fixationby legumes.
In most fields, bringing in of the harvest was the major cause of nutrient export fromfields (OUT1 and OUT2), followed by leaching (OUT3) and gaseous (OUT4) losses. Cropresidue removal was the strongest negative contributor to the N balance in most landuse types, particularly in the shoka fields (see below). Leaching and denitrification losseswere greatest in the manured enset and darkua fields due to a relatively larger input ofN (IN2). It should be noted that nitrogen release from the manure in subsequent seasonsis not taken into account. Leaching and denitrification losses are thus probablyoverestimated.
Erosion (OUT5) did not occur in the enset, darkua and taro fields, probably because ofthe relatively high organic matter content and stable soil structure, the presence ofmulch material and the care provided by the farmers. This is in agreement with thefindings of the runoff experiments conducted in the area (Belay, 1992). Erosion is,however, causing considerable loss of N in the shoka fields in the highlands, particularlyfor the richer farmers (S1 and S2 in annexes 3 and 4). The shoka field is mostly plantedwith small cereals such as teff and barley that require an intensively ploughed seedbed,but which increases the risks of erosion. These cereals also provide limited protectionagainst the erosive force of the rain on the soil. The shoka field receives less attentionand management care relative to the darkua and enset fields where farmers concentratetheir labour and manure inputs to produce high value or food security crops. Anotherfactor is the location of the shoka field at the bottom end of the farm-slope, where thevelocity and eroding capacity of runoff is highest.

Eyasu E. Is soil fertility declining? 19○
○
○
○
○
Fig
ure
2.
Nit
rog
en b
alan
ces
(kg
/ha)
an
d P
ho
sph
oru
s b
alan
ces
of
fou
r fa
rm c
om
po
nen
ts a
nd
fo
ur
soci
o-e
con
om
ic g
rou
ps
in t
he
hig
hla
nd
s (a
) an
d t
he
low
lan
ds
(b)
Key
K
ey
Key
K
ey
Key
E=
Ense
t;D
= d
arku
a;T=
Taro
;S=
Sho
ka;
1= r
ich
est
and
4 =
po
ore
stTh
e o
pti
mis
tic
valu
e is
at
the
top
of
each
bar
an
d t
he
pes
sim
isti
cva
lue
at t
he
bo
tto
m. T
he
mo
st p
rob
able
esti
mat
e is
ind
icat
ed w
ith
a sm
all l
ine

Managing Africa’s Soils: No.220 ○
○
○
○
○
Figure 3. Nitrogen balances (kg/ha) and Phosphorus balances at farm levelfor four socio-economic groups in the highlands (left bar) and thelowlands (right bar)
Key Key Key Key Key The optimistic value is at the top of each bar and the pessimistic value at thebottom. The most probable estimate is indicated with a small line

Eyasu E. Is soil fertility declining? 21○
○
○
○
○
Field and farm nutrient balances acrossagro-ecological zonesThe N and P balances (kg/ha) for different farm components in the highlands and lowlandsare summarised in Figure 2, while the whole farm balances (kg/ha) are presented inFigure 3. The assessment of the N and P balance is based on a classification given bySmaling (1993) for arable fields in sub-Saharan Africa. Nutrient depletion is great whenlosses are higher than 40 Kg N or 7 kg P per hectare per year and moderate when Nlosses are between 10 and 20 kg and P losses between 2 and 4 kg. Nutrient depletionis slight when losses are less than 10 kg N or 2 kg P.
Nitrogen balancesOur data showed that the N balances in the enset, darkua and taro fields of most of thehighland farms studied were either slightly positive or at equilibrium (Figure 2). Thelevel of inputs and outputs are thus sufficiently balanced and neither high accumulationor soil mining of N was found in these fields. This was also the case for some of thedarkua and taro fields in the lowland farms (Figure 2). However, negative N balanceswere found in the shoka fields of all farmers in both agro-ecological zones, and weremost pronounced in the highland farms. The shoka area is important, both in terms ofcultivated area and total output, and a decline in soil fertility can affect the sustainabilityof the entire farming system. The N balance for the farm taken as a whole was highlydeficient for both highland and lowland farms (Figure 3). This mirrors the substantialnegative N balance observed in the shoka field, which occupies the most significantarea (Table 2). The aggregated farm-level balances thus disguise the marked differencesin nutrient balances between field components.
The limited N input from fertiliser (IN1) and absence of manure input (IN2) combinedwith insignificant inputs from fixation (IN4) largely explains the N deficit in the shokafield. The N balance remained deficient even when leaching, denitrification and erosionlosses were assumed to be zero, suggesting that inputs were inadequate to replenisheven production related outputs alone (OUT1 and OUT2). Nutrient drain in the form ofcrop residues is the strongest contributor to the N imbalances in the shoka fields (Annexes3 and 5). All crop residues were removed from shoka fields and used as fodder forlivestock. However, the manure is not returned to the shoka but used to fertilise otherfields (enset and darkua). Finally, crops such as teff and barley have a high N content inthe harvested product leading to further nutrient losses.
Nutrient balances also differ across agro-ecological zones. N depletion is higher in thehighland than in the lowland zones. Yields in the highlands are double those in thelowlands due to more favourable climatic conditions and better soils. The removal of Nvia crops (OUT1 and OUT2) is thus higher. In addition, erosion is another source of Nlosses in the highlands, which is not a significant problem in the lowlands.

Managing Africa’s Soils: No.222 ○
○
○
○
○
Phosphorus balancesPhosphorus balances were close to the equilibrium in all highland and lowland fields.We observed a slight accumulation in enset, taro and shoka fields of resource-rich farmers(Figure 2) and a slight deficit in the taro (T4) and shoka (S4) fields of very poor farmersin the lowlands. The positive balance for P in the enset, taro and shoka fields of resource-rich farmers is caused by the application of relatively large volumes of manure in thehomestead fields and of DAP in the shoka fields.
The overall farm balances for P are also slightly positive (Figure 3). The P balance isbetter than the N balance because less P is removed in crop produce and residue. P isalso less susceptible to leaching and denitrification losses; and losses of P because oferosion are only slight to moderate. The P balance is better in the lowland farms whichmay be caused by the limited availability of N, so that applied P cannot be efficientlyused for plant growth. However, fertiliser trials in the area have shown a significantresponse to the application of P-fertiliser (WADU, 1977). This is probably caused by thehigh P-fixation capacity of the Nitosols, thus rendering P unavailable for plant uptake.More research is needed to improve the role and efficiency of P-fertiliser.
Nutrient balances by socio-economicgroupsThe average nutrient balances for enset, taro and darkua plots were all in equilibrium.However, they varied amongst the four socio-economic groups and across agro-ecologicalzones. The N balance was more positive in the enset-garden of the richer farmer in thehighlands (E1 in Figure 2) primarily due to more continuous application of manure andless rapid harvesting of enset than in the case of poorer farmers.
Little difference was observed in the N balances of darkua and taro plots between thesocio-economic groups in the highlands. There were however differences between theseplots in the lowlands as a result of different levels of manure application. The poorer thelowland farmer, the greater the trend towards a negative N balance when going fromdarkua to shoka fields (Figure 2).
The shoka fields of all four socio-economic groups in both the highlands and lowlandswere very deficient in N. P balances of shoka fields are generally positive, especially forthe richer farmers who use larger amounts of fertiliser than poorer farmers. However,significant differences were observed in the rate of N depletion for shoka fields acrosssocio-economic groups. The N balance was most markedly negative in the shoka fieldsof rich and middle economic group farmers in the highlands, and for the poor and verypoor farmers in the lowlands (annex 6).

Eyasu E. Is soil fertility declining? 23○
○
○
○
○
In the highlands, differences between N depletion rates are explained by variations inthe farm size, amounts of inputs applied and intensification of soil management practices(soil conservation, residue return, etc.) used by different groups of farmers. Richerhighland farmers cultivate larger areas and although they purchase larger amounts offertiliser, the rate of fertiliser application per unit area is low. Moreover, richer farmersdo not invest so much labour in intensive soil conservation and fertility enrichmentpractices because they are more involved in off-farm activities. Differences in losses of Nfrom erosion (OUT5) may partly explain the greater N deficiency in the shoka fields ofricher farmers (S1 and S2 in Figure 2).
Overall, the poorer farmers in the highlands had lower N depletion rates. Their holdingsare too small for their subsistence needs, but they have limited access to more profitableoff-farm activities due to a lack of capital. Therefore, poorer farmers have to rely onagriculture which forces them to invest a large amount of labour in soil fertilitymanagement. They use a wide range of fertility inputs and conservation practices toimprove yields, such as the careful use of all available manure, systematic managementand recycling of crop residues, collection of leaf litter and intensive soil conservation.Since the fields of poorer farms are small and intensively managed, the effects of soilerosion on soil fertility is kept low. Moreover, their cropping patterns are largely dominatedby subsistence crops so that loss of nutrients through crop sales are considerably lowerthan for richer farmers (annex 3). However, they still have a negative N balance due totheir limited ownership of livestock, which affects access to manure and access to creditfor obtaining fertiliser.
In the lowlands, however, the position is reversed as N balances are lower for poorerthan for richer farmers. Poorer farmers in the lowlands are severely constrained by limitedaccess to livestock. This is a major problem because lowland soils are hard to workwhile the labour force is weakened by malaria and malnutrition. Hiring oxen is onlypossible in exchange for labour as there exists no system of cash payment. Poorer farmersthus hire themselves out as labourers to the richer farmers, to gain access to draughtoxen. Consequently, they have less time to invest in intensive soil fertility enrichmentpractices on their own farms. By contrast, richer farmers reap the benefits of poorerfarmers’ labour, which also creates more scope for spending time earning cash throughoff-farm activities. Moreover, they have more livestock and can apply larger volumes ofmanure as well as having access to credit for obtaining mineral fertiliser.

Managing Africa’s Soils: No.224 ○
○
○
○
○
This study has shown the complexity of soil fertility issues in Kindo Koisha farms. Farmers’soil management practices are radically different across land use types with differentniches receiving different levels of attention and management care, and generatingdiverse patterns of fertility. Soil fertility is being maintained, and even increased, in farmcomponents such as the enset-garden, darkua and taro fields. Farmers are creating andenriching soil fertility in these sites to sustain subsistence production and food security.Soil nutrient loss is currently present in only one farm component, the shoka field;however, this component also occupies the largest area. Levels of nutrient depletionfrom the shoka field vary between socio-economic group, and it is particularly seriousfor richer farmers in the highlands and for poorer farmers in the lowlands7. Livestockownership is the main factor determining soil fertility management in the lowlands, as itdetermines access to manure, draught power and credit for fertiliser. The resource-poorfarmers in the densely populated highlands demonstrated a capacity to intensify soilfertility management which resembles cases reported in other parts of Africa such asthe Machakos district of Kenya (Tiffen and Mortimore, 1992) and Sukumaland in Tanzania(Meertens et al, 1996; Budelman, 1996), where agricultural intensification andregeneration of soil fertility have occurred under conditions of high population pressure.
The results for N and P balances found in this study show the same tendencies as thosecalculated for other regions in sub-Saharan African. The pattern of nutrient balancesobserved for the highlands is comparable to the balances calculated by Smaling et al(1993) for Kisii District of Kenya. Both Kindo Koisha and Kisii are part of the denselypopulated, erosion-prone east African highlands, that are characterised by stronglynegative N balances. On the other hand, the nutrient balances found in the farms oflowland Kindo Koisha are comparable to those for sub-humid zones in southern Mali(Van der Pol, 1992).
This study applied a nutrient input and output balance model for the first time in Ethiopia.It was found to be a useful tool for monitoring nutrient depletion in agricultural landuse. When calculating nutrient balances, a high level of accuracy is not possible. It ismore important to understand variability in the size of flows which constitute the balancethan to measure these with great accuracy. Nutrient balances can be discussed easily7 Similar patterns have been observed in other parts of SSA such the Mossi farming system in Burkina Faso (Prudencio,1993).
5Concluding remarks

Eyasu E. Is soil fertility declining? 25○
○
○
○
○
with farmers by focusing on the more visible, managed flows such as application offertiliser (IN1) and manure (IN2), removal of nutrients in crops (OUT1), and residues(OUT2) and losses from erosion (OUT5). These are flows that farmers can easily observeand interpret. Visualisation of these flows on farm maps helps to identify opportunitiesto improve nutrient management.
The extent of the soil fertility problem in Kindo Koisha differs between highland andlowland areas, between farms and between fields within a farm. Care should thus betaken when aggregating nutrient balances at higher scales (farm, district, nation). Theycan be misleading when they fail to capture spatial scale issues and the exposition ofdiversity that are vital in farmers’ soil fertility management strategies.
The results of this study also underline the importance of a targeted intervention approachto improve soil fertility. Policies should specify where (which agro-ecological zone orfarm component), and for whom (resource-poor farmers or resource-rich farmers) theintervention is planned.

Managing Africa’s Soils: No.226 ○
○
○
○
○
ReferencesBelay TBelay TBelay TBelay TBelay Tegene.egene.egene.egene.egene. 1992. Erosion: Its effects on properties and productivity of Eutric Nitosols in
Gununo area, southern Ethiopia, and some techniques of its control.BarberBarberBarberBarberBarber, R., R., R., R., R. 1984. An Assessment of the Dominant Soil Degradation Processes in the
Ethiopian Highlands: Their Impacts and Hazards. Ethiopian Highlands Reclamation Study.Working Paper No. 23. FAO, Rome.
Bojo, J. and Cassels, D. Bojo, J. and Cassels, D. Bojo, J. and Cassels, D. Bojo, J. and Cassels, D. Bojo, J. and Cassels, D. 1995. Land Degradation and Rehabilitation in Ethiopia: Areassessment. AFTES Working paper No. 17. World Bank, Washington DC.
Budelman, A.Budelman, A.Budelman, A.Budelman, A.Budelman, A. 1996. In Search of Sustainability. Nutrients, Trees and FarmerExperimentation in North Sukumaland Agriculture. Working paper 16. Royal TropicalInstitute, Amsterdam.
Campbell, J.Campbell, J.Campbell, J.Campbell, J.Campbell, J. 1991. ‘Land or peasants?: The Dilemma Confronting Ethiopian ResourceConservation’ African Affairs, 90: 5-21
Data, Dea. Data, Dea. Data, Dea. Data, Dea. Data, Dea. 1998. Soil fertility management in its social context: A study of local percep-tions and practices in Wolaita, Southern Ethiopia. Managing Africa’s soils, Workingpaper no. 1. London
Dessalegn Rahamato.Dessalegn Rahamato.Dessalegn Rahamato.Dessalegn Rahamato.Dessalegn Rahamato. 1992. The dynamics of rural poverty: Case study from a district insouthern Ethiopia.
Eyasu, E. Eyasu, E. Eyasu, E. Eyasu, E. Eyasu, E. 1997. Soil Fertility Decline and Coping Strategies: The Case of Kindo Koisha,Southern Ethiopia. PhD Thesis, School of development Studies, University of EastAnglia, Norwich.
FFFFFARM Africa. ARM Africa. ARM Africa. ARM Africa. ARM Africa. 1992. Reports of diagnostic survey in Hanze and Fagena Matta PeasantAssociations in Kindo Koisha Awraja. SOS Sahel, Farm Africa, and MOA. Environmentalprotection and development programme.
FFFFFAO. AO. AO. AO. AO. 1986. Ethiopia. Highlands Reclamation Study. Final Report, Volume 1. FAO,Rome.
FFFFFAO.AO.AO.AO.AO. 1994. Plant nutrients exported by crops at the optimal productivity level. FAO,Rome.
Grandin, B.E.Grandin, B.E.Grandin, B.E.Grandin, B.E.Grandin, B.E. 1988. Wealth ranking in smallholder communities: A field manual.Intermediate Technology Publications Ltd.
Gunten, A.B.Gunten, A.B.Gunten, A.B.Gunten, A.B.Gunten, A.B. 1993. Soil erosion processes in a twin catchment set-up in Gununo area,Ethiopia. Soil conservation research project report 23. Soil conservation research project,University of Berne, Berne.
Hurni, H.Hurni, H.Hurni, H.Hurni, H.Hurni, H. 1988. Degradation and Conservation of the Resources in the EthiopianHighlands. Mountain Research and Development, 8 (No. 2/3): 123-130
Jahnke, H.Jahnke, H.Jahnke, H.Jahnke, H.Jahnke, H. 1982. Livestock production systems and livestock development in tropicalAfrica.
Jenden, PJenden, PJenden, PJenden, PJenden, P. . . . . 1994. Cash for work and food insecurity, Koisha Woreda-Wollaita. Report onSOS Sahel’s Food Security Project, 1992-1994. SOS Addis Ababa.
Meertens, H.C.C., Fresco, L.O. and Stoop, WMeertens, H.C.C., Fresco, L.O. and Stoop, WMeertens, H.C.C., Fresco, L.O. and Stoop, WMeertens, H.C.C., Fresco, L.O. and Stoop, WMeertens, H.C.C., Fresco, L.O. and Stoop, W.A..A..A..A..A. 1996. ‘Farming systems dynamics: Impact ofincreasing population density and the availability of land resources on changes inagricultural systems. The case of Sukumaland, Tanzania.’ Agriculture, Ecosystems andEnvironment, 56: 203-215.
Prudencio, C.YPrudencio, C.YPrudencio, C.YPrudencio, C.YPrudencio, C.Y..... 1993. ‘Ring management of Soils and Crops in the West African Semi-aridTropics: The Case of the Mossi Farming Systems in Burkina Faso’. Agriculture,Ecosystems and Environment, 47: 237-264.
Smaling, E.M.A.Smaling, E.M.A.Smaling, E.M.A.Smaling, E.M.A.Smaling, E.M.A. 1993. Soil nutrient depletion in sub-Saharan Africa. In: Van Reuler, H. andPrins, W. H., (editors). The Role of Plant Nutrients for Sustainable Food Crop Productionin Sub-Saharan Africa. Dutch Association of Fertiliser Producers (VKP), Leidschendam,53-67.

Eyasu E. Is soil fertility declining? 27○
○
○
○
○
Smaling, E.M.A, Stoorvogel, J.J. and WindmeijerSmaling, E.M.A, Stoorvogel, J.J. and WindmeijerSmaling, E.M.A, Stoorvogel, J.J. and WindmeijerSmaling, E.M.A, Stoorvogel, J.J. and WindmeijerSmaling, E.M.A, Stoorvogel, J.J. and Windmeijer, P, P, P, P, P.N..N..N..N..N. 1993. Calculating soil nutrientbalances in Africa at different scales II. District scale. Fertiliser Research, 35: 237-250.
Stoorvogel, J.J., and Smaling, E.M.A.Stoorvogel, J.J., and Smaling, E.M.A.Stoorvogel, J.J., and Smaling, E.M.A.Stoorvogel, J.J., and Smaling, E.M.A.Stoorvogel, J.J., and Smaling, E.M.A. 1990. Assessment of soil nutrient depletion in sub-Saharan Africa 1983-2000. Report 28. The Winand Staring Centre for integrated land,soil and water research (SC-DLO), Wageningen.
TTTTTifififififfin, M. and Mortimore, M.fin, M. and Mortimore, M.fin, M. and Mortimore, M.fin, M. and Mortimore, M.fin, M. and Mortimore, M. 1992. ‘Environment, population and productivity in Kenya: ACase study of Machakos District.’ Development Policy Review, 10: 359-387.
VVVVVan der Pol, Fan der Pol, Fan der Pol, Fan der Pol, Fan der Pol, F..... 1992. Soil mining: An Unseen Contributor to Farm Income in Southern Mali.Bulletin 325. Royal Tropical Institute, Amsterdam.
WWWWWADU.ADU.ADU.ADU.ADU. 1976. General agricultural survey in Wollaita. Wollaita Soddo.WWWWWADU.ADU.ADU.ADU.ADU. 1977. Summary of crop trial results 1971-1977. Planning, Evaluation and Budget
control section. Publication No 56. Wollaita Soddo.WWWWWeigel, G.eigel, G.eigel, G.eigel, G.eigel, G. 1986. The soils of Gununo area (Kindo Koisha). Soil conservation Research Project
(SCRP). Research Report 8, University of Berne, Berne.
Managing Africa’s Soils: No.228 ○
○
○
○
○
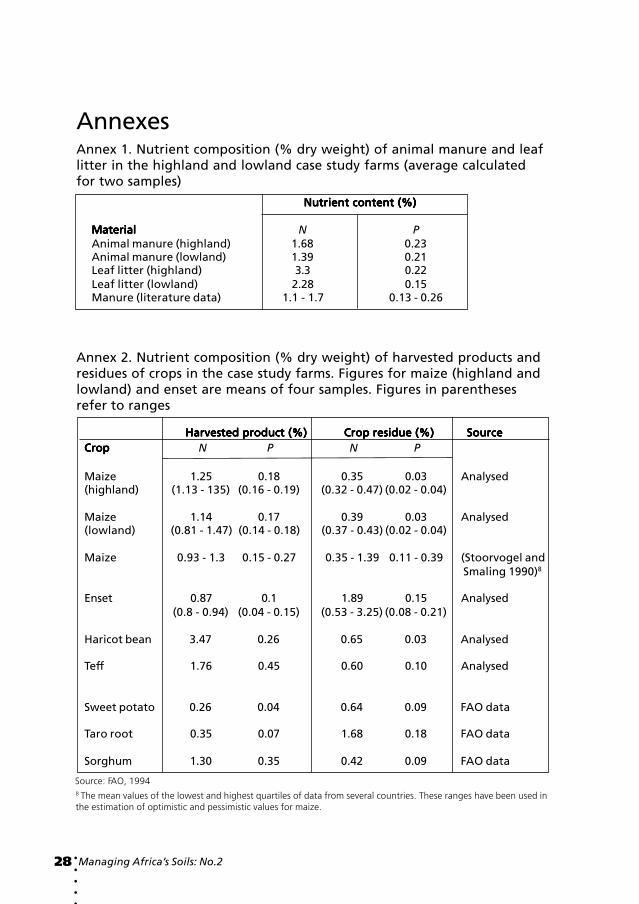
AnnexesAnnex 1. Nutrient composition (% dry weight) of animal manure and leaflitter in the highland and lowland case study farms (average calculatedfor two samples)
Nutrient content (%) Nutrient content (%) Nutrient content (%) Nutrient content (%) Nutrient content (%)
MaterialMaterialMaterialMaterialMaterial N PAnimal manure (highland) 1.68 0.23Animal manure (lowland) 1.39 0.21Leaf litter (highland) 3.3 0.22Leaf litter (lowland) 2.28 0.15Manure (literature data) 1.1 - 1.7 0.13 - 0.26
Annex 2. Nutrient composition (% dry weight) of harvested products andresidues of crops in the case study farms. Figures for maize (highland andlowland) and enset are means of four samples. Figures in parenthesesrefer to ranges
Harvested product (%) Harvested product (%) Harvested product (%) Harvested product (%) Harvested product (%) Crop residue (%) Crop residue (%) Crop residue (%) Crop residue (%) Crop residue (%) Source Source Source Source SourceCropCropCropCropCrop N P N P
Maize 1.25 0.18 0.35 0.03 Analysed(highland) (1.13 - 135) (0.16 - 0.19) (0.32 - 0.47) (0.02 - 0.04)
Maize 1.14 0.17 0.39 0.03 Analysed(lowland) (0.81 - 1.47) (0.14 - 0.18) (0.37 - 0.43) (0.02 - 0.04)
Maize 0.93 - 1.3 0.15 - 0.27 0.35 - 1.39 0.11 - 0.39 (Stoorvogel and Smaling 1990)8
Enset 0.87 0.1 1.89 0.15 Analysed(0.8 - 0.94) (0.04 - 0.15) (0.53 - 3.25) (0.08 - 0.21)
Haricot bean 3.47 0.26 0.65 0.03 Analysed
Teff 1.76 0.45 0.60 0.10 Analysed
Sweet potato 0.26 0.04 0.64 0.09 FAO data
Taro root 0.35 0.07 1.68 0.18 FAO data
Sorghum 1.30 0.35 0.42 0.09 FAO data
8 The mean values of the lowest and highest quartiles of data from several countries. These ranges have been used inthe estimation of optimistic and pessimistic values for maize.
Source: FAO, 1994
Eyasu E. Is soil fertility declining? 29○
○
○
○
○
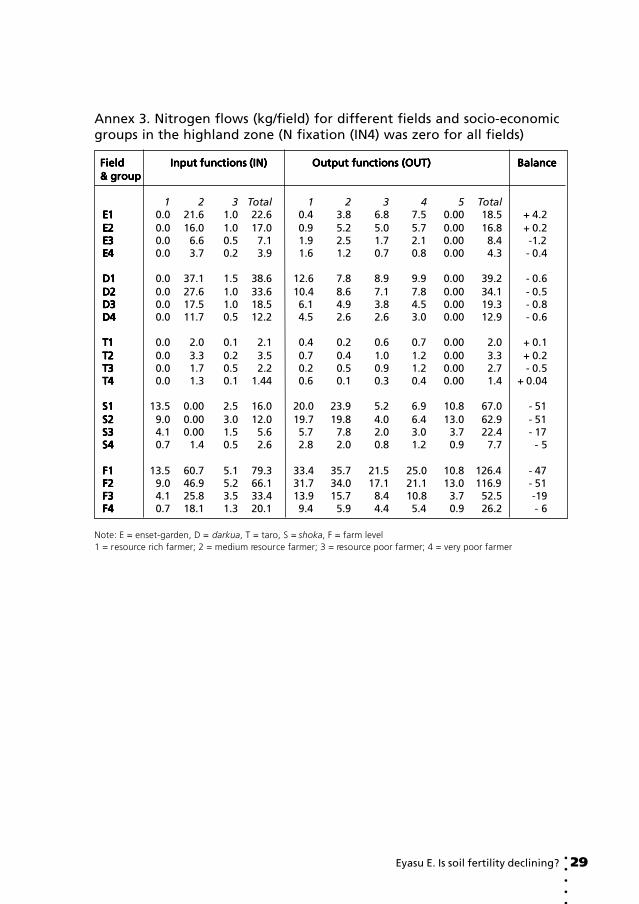
Annex 3. Nitrogen flows (kg/field) for different fields and socio-economicgroups in the highland zone (N fixation (IN4) was zero for all fields)
Field Field Field Field Field Input functions (IN)Input functions (IN)Input functions (IN)Input functions (IN)Input functions (IN) Output functions (OUT) Output functions (OUT) Output functions (OUT) Output functions (OUT) Output functions (OUT) Balance Balance Balance Balance Balance & group & group & group & group & group
1 2 3 Total 1 2 3 4 5 TotalE1E1E1E1E1 0.0 21.6 1.0 22.6 0.4 3.8 6.8 7.5 0.00 18.5 + 4.2E2E2E2E2E2 0.0 16.0 1.0 17.0 0.9 5.2 5.0 5.7 0.00 16.8 + 0.2E3E3E3E3E3 0.0 6.6 0.5 7.1 1.9 2.5 1.7 2.1 0.00 8.4 -1.2E4E4E4E4E4 0.0 3.7 0.2 3.9 1.6 1.2 0.7 0.8 0.00 4.3 - 0.4
D1D1D1D1D1 0.0 37.1 1.5 38.6 12.6 7.8 8.9 9.9 0.00 39.2 - 0.6D2D2D2D2D2 0.0 27.6 1.0 33.6 10.4 8.6 7.1 7.8 0.00 34.1 - 0.5D3D3D3D3D3 0.0 17.5 1.0 18.5 6.1 4.9 3.8 4.5 0.00 19.3 - 0.8D4D4D4D4D4 0.0 11.7 0.5 12.2 4.5 2.6 2.6 3.0 0.00 12.9 - 0.6
T1T1T1T1T1 0.0 2.0 0.1 2.1 0.4 0.2 0.6 0.7 0.00 2.0 + 0.1T2T2T2T2T2 0.0 3.3 0.2 3.5 0.7 0.4 1.0 1.2 0.00 3.3 + 0.2T3T3T3T3T3 0.0 1.7 0.5 2.2 0.2 0.5 0.9 1.2 0.00 2.7 - 0.5T4T4T4T4T4 0.0 1.3 0.1 1.44 0.6 0.1 0.3 0.4 0.00 1.4 + 0.04
S1S1S1S1S1 13.5 0.00 2.5 16.0 20.0 23.9 5.2 6.9 10.8 67.0 - 51S2S2S2S2S2 9.0 0.00 3.0 12.0 19.7 19.8 4.0 6.4 13.0 62.9 - 51S3S3S3S3S3 4.1 0.00 1.5 5.6 5.7 7.8 2.0 3.0 3.7 22.4 - 17S4S4S4S4S4 0.7 1.4 0.5 2.6 2.8 2.0 0.8 1.2 0.9 7.7 - 5
F1F1F1F1F1 13.5 60.7 5.1 79.3 33.4 35.7 21.5 25.0 10.8 126.4 - 47F2F2F2F2F2 9.0 46.9 5.2 66.1 31.7 34.0 17.1 21.1 13.0 116.9 - 51F3F3F3F3F3 4.1 25.8 3.5 33.4 13.9 15.7 8.4 10.8 3.7 52.5 -19F4F4F4F4F4 0.7 18.1 1.3 20.1 9.4 5.9 4.4 5.4 0.9 26.2 - 6
Note: E = enset-garden, D = darkua, T = taro, S = shoka, F = farm level1 = resource rich farmer; 2 = medium resource farmer; 3 = resource poor farmer; 4 = very poor farmer

Managing Africa’s Soils: No.230 ○
○
○
○
○
Annex 4. Phosphorus flows (kg/field) for fields and socio-economic groupsin the highland zone (IN4, OUT3 and OUT4 were zero for P)
Field Field Field Field Field Input functions (IN) Input functions (IN) Input functions (IN) Input functions (IN) Input functions (IN) Output functions (OUT) Output functions (OUT) Output functions (OUT) Output functions (OUT) Output functions (OUT) BalanceBalanceBalanceBalanceBalance & group & group & group & group & group
1 2 3 Total 1 2 5 Total
E1E1E1E1E1 0.00 2.9 0.2 3.1 0.00 0.3 0.00 0.3 + 2.8E2E2E2E2E2 0.00 2.2 0.2 2.4 0.1 0.4 0.00 0.5 + 1.9E3E3E3E3E3 0.00 0.9 0.1 1.0 0.2 0.2 0.00 0.4 + 0.6E4E4E4E4E4 0.00 0.5 0.00 0.5 0.2 0.1 0.00 0.3 + 0.2
D1D1D1D1D1 0.00 5.0 0.3 5.3 1.8 0.8 0.00 2.6 + 2.7D2D2D2D2D2 0.00 3.7 0.2 3.9 1.5 0.8 0.00 2.3 + 1.6D3D3D3D3D3 0.00 2.0 0.2 2.2 0.9 0.4 0.00 1.3 + 0.8D4D4D4D4D4 0.00 1.4 0.1 1.5 0.6 0.2 0.00 0.8 + 0.7
T1T1T1T1T1 0.00 0.3 0.00 0.3 0.07 0.00 0.00 0.1 + 0.1T2T2T2T2T2 0.00 0.5 0.00 0.5 0.1 0.00 0.1 0.2 + 0.3T3T3T3T3T3 0.00 0.2 0.1 0.3 0.00 0.1 0.00 0.1 + 0.2T4T4T4T4T4 0.00 0.18 0.00 0.18 0.12 0.00 0.00 0.12 + 0.06
S1S1S1S1S1 15.0 0.00 0.5 15.5 3.1 3.0 3.4 9.4 + 6.0S2S2S2S2S2 10.0 0.00 0.5 10.5 3.2 2.4 4.1 9.8 + 0.7S3S3S3S3S3 4.6 0.00 0.3 4.9 1.0 0.8 1.2 3.0 + 2S4S4S4S4S4 0.8 0.2 0.00 1.0 0.4 0.2 0.3 0.9 + 0.1
F1F1F1F1F1 15.0 8.2 1.0 24.2 5.0 4.1 3.4 12.5 + 11.7F2F2F2F2F2 10.0 6.4 1.0 17.4 4.9 3.6 4.1 12.6 + 4.8F3F3F3F3F3 4.6 3.1 0.7 8.4 2.1 1.5 1.2 4.8 + 3.6F4F4F4F4F4 0.8 2.1 0.1 3.2 1.3 0.5 0.3 2.1 + 1.1

Eyasu E. Is soil fertility declining? 31○
○
○
○
○
Annex 5. Nitrogen flows (kg/field) for fields and socio-economic groups inthe lowland zone (erosion (OUT5) was zero in the lowlands).
FieldFieldFieldFieldField Input functions (IN)Input functions (IN)Input functions (IN)Input functions (IN)Input functions (IN) Output functions (OUT)Output functions (OUT)Output functions (OUT)Output functions (OUT)Output functions (OUT) Balance Balance Balance Balance Balance & group & group & group & group & group
1 2 3 4 Total 1 2 3 4 Total
D1D1D1D1D1 1.9 42.4 2.0 8.0 54.4 17.9 8.8 13.6 14.9 55.2 - 1.0D2D2D2D2D2 0.00 38.4 2.0 0.00 40.4 9.8 8.8 11.9 13.2 43.7 - 3.0D3D3D3D3D3 0.00 15 1.6 0.00 16.6 5.8 13.4 3.3 4.4 27.2 - 10.6D4D4D4D4D4 0.00 7.9 0.4 0.00 8.3 3.8 1.8 2.1 2.4 10.1 - 2
T1T1T1T1T1 0.00 9.4 0.4 0.00 9.8 1.5 3.5 2.8 3.0 10.7 - 1.0T2T2T2T2T2 0.00 19 1.0 0.00 20.0 2.9 5.4 5.8 6.5 20.6 - 1T3T3T3T3T3 0.00 4.8 0.5 0.00 5.3 1.6 2.8 1.6 1.9 8.1 - 2.8T4T4T4T4T4 0.00 2.5 0.5 0.00 3.0 1.7 1.6 0.7 1.0 5.0 - 2
S1S1S1S1S1 27 0.00 9.6 8.0 44.6 28.0 37.2 10.2 16.5 92.0 - 47S2S2S2S2S2 15.6 0.00 7.6 4.0 27 20.6 26.1 6.5 11.4 64.8 - 37S3S3S3S3S3 8.4 0.00 7.0 4.0 19.4 17.2 31.9 3.9 8.5 61.5 - 42S4S4S4S4S4 0.5 0.00 1.2 4.0 5.7 12.7 7.5 0.4 1.2 21.8 - 16
F1F1F1F1F1 28.9 61.4 12 16.0 108.8 47.4 49.5 26.5 34.4 158 - 49F2F2F2F2F2 15.6 57.4 10.6 4.0 87.4 33.3 40.3 24.2 31.1 129 - 41F3F3F3F3F3 8.4 19.8 9.1 4.0 41.3 24.6 48.1 8.8 14.8 96.8 - 55F4F4F4F4F4 0.5 10.4 2.1 4.0 17.0 18.2 11.0 3.2 4.6 37.0 - 20
Managing Africa’s Soils: No.232 ○
○
○
○
○
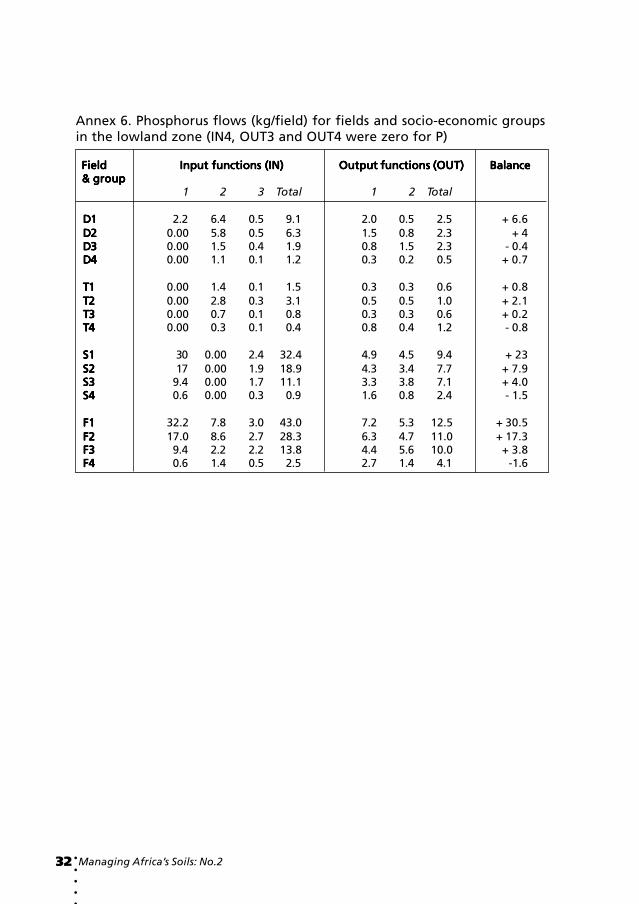
Annex 6. Phosphorus flows (kg/field) for fields and socio-economic groupsin the lowland zone (IN4, OUT3 and OUT4 were zero for P)
FieldFieldFieldFieldField Input functions (IN) Input functions (IN) Input functions (IN) Input functions (IN) Input functions (IN) Output functions (OUT)Output functions (OUT)Output functions (OUT)Output functions (OUT)Output functions (OUT) BalanceBalanceBalanceBalanceBalance & group & group & group & group & group
1 2 3 Total 1 2 Total
D1D1D1D1D1 2.2 6.4 0.5 9.1 2.0 0.5 2.5 + 6.6D2D2D2D2D2 0.00 5.8 0.5 6.3 1.5 0.8 2.3 + 4D3D3D3D3D3 0.00 1.5 0.4 1.9 0.8 1.5 2.3 - 0.4D4D4D4D4D4 0.00 1.1 0.1 1.2 0.3 0.2 0.5 + 0.7
T1T1T1T1T1 0.00 1.4 0.1 1.5 0.3 0.3 0.6 + 0.8T2T2T2T2T2 0.00 2.8 0.3 3.1 0.5 0.5 1.0 + 2.1T3T3T3T3T3 0.00 0.7 0.1 0.8 0.3 0.3 0.6 + 0.2T4T4T4T4T4 0.00 0.3 0.1 0.4 0.8 0.4 1.2 - 0.8
S1S1S1S1S1 30 0.00 2.4 32.4 4.9 4.5 9.4 + 23S2S2S2S2S2 17 0.00 1.9 18.9 4.3 3.4 7.7 + 7.9S3S3S3S3S3 9.4 0.00 1.7 11.1 3.3 3.8 7.1 + 4.0S4S4S4S4S4 0.6 0.00 0.3 0.9 1.6 0.8 2.4 - 1.5
F1F1F1F1F1 32.2 7.8 3.0 43.0 7.2 5.3 12.5 + 30.5F2F2F2F2F2 17.0 8.6 2.7 28.3 6.3 4.7 11.0 + 17.3F3F3F3F3F3 9.4 2.2 2.2 13.8 4.4 5.6 10.0 + 3.8F4F4F4F4F4 0.6 1.4 0.5 2.5 2.7 1.4 4.1 -1.6

Eyasu E. Is soil fertility declining? 33○
○
○
○
○
Working papers published in the series Managing Africa’Managing Africa’Managing Africa’Managing Africa’Managing Africa’s Soilss Soilss Soilss Soilss Soils:
1 Soil Fertility Management in its Social Context: A Study of Local Perceptions andPractices in Wolaita, Southern Ethiopia. D. DATA. September, 1998.
2 Is Soil Fertility Declining? Perspectives on Environmental Change in Southern Ethiopia.E. Eyasu. September, 1998.
3 Experiences in Participatory Diagnosis of Soil Nutrient Management in Kenya.D. Onduru, G. N. Gachini and S. M. Nandwa. September, 1998.
Managing Africa’s soils papers can be obtained from:
Drylands Programme, IIED3 Endsleigh streetLondon WC1H ODDUnited KingdomTel: +44 171 388 2117Fax: +44 171 388 2826E-mail: [email protected]
These working papers can also be downloaded from internet: http://www.iied.org/or from http://www.ab.dlo.nl/