
1. Introduction 3. PDOP simulations with 12 fixed bases
1
1. Introduction 2. PDOP simulations with 4 and 5 fixed bases Geolocal is a navigation system developed by researchers from Universidade Mackenzie, in Brazil. It is based on an “inverted-GNSS” geometry, as shown in Figure 1, that has at least 4 base stations on the ground, A, B, C and D, at known geodesic position coordinates, synchronized among themselves, a repeater R in space, that can be a spacecraft, a balloon or a satellite, and a target P on the ground (KALFMANN et al, 2014). . . 3. PDOP simulations with 12 fixed bases Figure 1- The four ground based geodetic reference bases, A,B,C and D, the repeater in space R, and a remote target P. Time signals are emitted by one reference base (A), retransmitted by R and received by all ground bases and the target where time diferences are measured (KALFMANN et al, 2014). Eduardo Perez Macho * ; Sergio Vicente Denser Pamboukian* * Universidade Presbiteriana Mackenzie – São Paulo, Brazil These equations depend on the repeater’s delay δ R and on the propagation delays Δ pdAR , Δ pdBR , Δ pdCR , Δ pdDR and Δ pdPR . The values Δ tA , Δ tB , Δ tC , Δ tD and Δ tP are the time differences measured at each base and target, when comparing their clock with the signal received. The value δ At is the known time variation due to the signal transit through circuits and cables in the transmitting base; δ Ar , δ Br , δ Cr , δ Dr e δ Pr are the know time variation due to the signal transit through circuits and cables in the receiving bases and the target. To establish the position of the repeater, a base chosen as reference base, in this case, base A, sends a radio signal that is received by the repeater, and retransmitted to all bases, producing at least 4 ranging measurements that allow us to calculate the distances AR, BR, CR and DR using the equations bellow. With these distances, it is possible to find the position of the repeater by triangulation. PDOP (Position Dilution of Precision) is a factor that indicates how diluted is the precision of the position, in other words, based on the geometry of the system, how the position error of the repeater increases from the error of the distances AR, BR, CR and DR. The ideal PDOP value for most applications is 1, but 4 is considered acceptable. To calculate PDOP in the ECEF (Earth Centered – Earth Fixed) system, it is used the A Matrix and the equations below (DANNA, 1996). As an example, it was done some simulations with 5 bases A, B, C, D and E and a repeater R in 5 cities of Sao Paulo state, Brazil, in the coordinates show in Table 1 and illustrated in the Figure 2. PDOP results, elevation at each base, and average elevation for 5 combinations of 4 bases and 1 combination of 5 bases are shown in Table 2. City Element Latitude Longitude Altitude Rio Claro Base A - 22º 24’ 48’’ - 47º 34’ 11’’ 592 m Piracicaba Base B - 22º 43’ 30’’ - 47º 38’ 51’’ 524 m Botucatu Base C - 22º 53’ 25’’ - 48º 27’ 19’’ 828 m Campinas Base D - 22º 54’ 23’’ - 47º 03’ 42’’ 677 m Itu Base E - 23º 15’ 57’’ - 47º 17’ 57’’ 577 m Piracicaba Repeater R - 22º 43’ 30’’ - 47º 38’ 51’’ variable Table 1 - Latitude, longitude and altitude of 5 bases and repeater Figure 2 – position of the 5 bases, A, B, C and D, and repeater R (adapted from Google Maps) Altitude (m) 10000 20000 30000 40000 50000 60000 Combination ABCD PDOP 1,86 2,16 2,57 3,09 3,72 4,45 Elevation at A 14,86º 28,68º 39,63º 47,95º 54,25º 59,07º Elevation at B 90,00º 90,00º 90,00º 90,00º 90,00º 90,00º Elevation at C 6,16º 12,70º 18,91º 24,69º 29,97º 34,74º Elevation at D 8,36º 16,92º 24,77º 31,72º 37,77º 42,96º Average elevation 9,79º 19,43º 27,77º 34,79º 40,66º 45,59º Combination ABCE PDOP 1,85 2,19 2,67 3,28 4,02 4,90 Elevation at A 14,86º 28,68º 39,63º 47,95º 54,25º 59,07º Elevation at B 90,00º 90,00º 90,00º 90,00º 90,00º 90,00º Elevation at C 6,16º 12,70º 18,91º 24,69º 29,97º 34,74º Elevation at E 7,69º 15,54º 22,83º 29,40º 35,22º 40,30º Average elevation 9,57º 18,97º 27,12º 34,01º 39,81º 44,70º Combination ABDE PDOP 3,47 4,04 4,84 5,89 7,19 8,76 Elevation at A 14,86º 28,68º 39,63º 47,95º 54,25º 59,07º Elevation at B 90,00º 90,00º 90,00º 90,00º 90,00º 90,00º Elevation at D 8,36º 16,92º 24,77º 31,72º 37,77º 42,96º Elevation at E 7,69º 15,54º 22,83º 29,40º 35,22º 40,30º Average elevation 10,30º 20,38º 29,08º 36,36º 42,41º 47,44º Altitude (m) 10000 20000 30000 40000 50000 60000 Combination ACDE PDOP 29,71 16,93 13,86 13,25 13,70 14,78 Elevation at A 14,86º 28,68º 39,63º 47,95º 54,25º 59,07º Elevation at C 6,16º 12,70º 18,91º 24,69º 29,97º 34,74º Elevation at D 8,36º 16,92º 24,77º 31,72º 37,77º 42,96º Elevation at E 7,69º 15,54º 22,83º 29,40º 35,22º 40,30º Average elevation 9,27º 18,46º 26,54º 33,44º 39,30º 44,27º Combination BCDE PDOP 3.02 3,28 3,65 4,12 4,70 5,40 Elevation at B 90,00º 90,00º 90,00º 90,00º 90,00º 90,00º Elevation at C 6,16º 12,70º 18,91º 24,69º 29,97º 34,74º Elevation at D 8,36º 16,92º 24,77º 31,72º 37,77º 42,96º Elevation at E 7,69º 15,54º 22,83º 29,40º 35,22º 40,30º Average elevation 7,40º 15,05º 22,17º 28,60º 34,32º 39,33º Combination ABCDE PDOP 1,72 2,07 2,46 2,93 3,45 3,99 Elevation at A 14,86º 28,68º 39,63º 47,95º 54,25º 59,07º Elevation at B 90,00º 90,00º 90,00º 90,00º 90,00º 90,00º Elevation at C 6,16º 12,70º 18,91º 24,69º 29,97º 34,74º Elevation at D 8,36º 16,92º 24,77º 31,72º 37,77º 42,96º Elevation at E 7,69º 15,54º 22,83º 29,40º 35,22º 40,30º Average elevation 9,27º 18,46º 26,54º 33,44º 39,30º 44,27º Table 2 - PDOP and elevations simulating 5 combination of 4 fixed bases and 1 combination of 5 fixed bases for each repeater Other simulations were done with 12 fixed bases are show in Table 3 and illustrated in the Figure 3. The results are shown in Table 4. City Element Latitude Longitude Altitude Rio Claro Base A - 22º 24’ 48’’ - 47º 34’ 11’’ 592 m Piracicaba Base B - 22º 43’ 30’’ - 47º 38’ 51’’ 524 m Botucatu Base C - 22º 53’ 25’’ - 48º 27’ 19’’ 828 m Campinas Base D - 22º 54’ 23’’ - 47º 03’ 42’’ 677 m Itu Base E - 23º 15’ 57’’ - 47º 17’ 57’’ 577 m Jaú Base F -22º 17’ 47’’ -48º 33’ 28’’ 522 m Brotas Base G -22º 17’ 03’’ 48º 07’ 36’’ 647 m Santa Maria da Serra Base H -22º 34’ 02’’ -48º 09’ 38’’ 495 m Conchas Base I -23º 00’ 55’’ -48º 00’ 38’’ 503 m Boituva Base J -23º 17’ 00’’ -47º 40’ 20’’ 637 m Mogi Mirim Base K -22º 25’ 55’’ -46º 57’ 30’’ 617 m Bofete Base L -23º 06’ 08’’ -48º 15’ 28’’ 576 m Piracicaba Repeater R1 - 22º 43’ 30’’ - 47º 38’ 51’’ variable Limeira Repeater R2 -22º 33’ 52’’ -47º 24’ 01’’ variable Charqueada Repeater R3 -22º 30’ 39’’ -47º 46’ 40’’ variable Anhembi Repeater R4 -22º 47’ 22’’ -48º 07’ 38’’ variable Table 3 - Latitude, longitude and altitude of 12 bases and 4 repeaters Figure 3 – position of the 12 bases and the 4 repeaters (adapted from Google Maps) Altitude (m) 10000 20000 30000 40000 50000 60000 Repeater R1 PDOP 1,38 1,56 1,75 1,96 2,20 2,48 Elevation at A 14,86º 28,68º 39,63º 47,95º 54,25º 59,07º Elevation at B 90,00º 90,00º 90,00º 90,00º 90,00º 90,00º Elevation at C 6,16º 12,70º 18,91º 24,69º 29,97º 34,74º Elevation at D 8,36º 16,92º 24,77º 31,72º 37,77º 42,96º Elevation at E 7,69º 15,54º 22,83º 29,40º 35,22º 40,30º Elevation at F 5,15º 10,49º 15,65º 20,55º 25,14º 29,41º Elevation at G 7,67º 15,56º 22,88º 29,48º 35,32º 40,41º Elevation at H 9,70º 19,32º 27,92º 35,33º 41,59º 46,83º Elevation at I 10,91º 21,58º 30,88º 38,66º 45,05º 50,27º Elevation at J 8,60º 17,35º 25,33º 32,38º 38,47º 43,67º Elevation at K 6,86º 13,94º 20,61º 26,73º 32,25º 37,17º Elevation at L 7,13º 14,45º 21,31º 27,57º 33,19º 38,16º Ave. elevation 8,46º 16,95º 24,61º 31,32º 37,11º 42,09º Repeater R2 PDOP 3,87 2,44 2,23 2,30 2,51 2,78 Elevation at A 21,25º 38,72º 50,52º 58,40º 63,85º 67,77º Elevation at B 16,98º 32,09º 43,48º 51,76º 57,82º 62,35º Elevation at C 4,59º 9,51º 14,29º 18,87º 23,21º 27,27º Elevation at D 10,27º 20,57º 29,64º 37,32º 43,70º 48,95º Elevation at E 6,85º 13,90º 20,53º 26,63º 32,14º 37,04º Elevation at F 4,41º 9,00º 13,47º 17,77º 21,87º 25,74º Elevation at G 6,58º 13,42º 19,88º 25,85º 31,26º 36,11º Elevation at H 6,93º 13,98º 20,63º 26,73º 32,24º 37,14º Elevation at I 6,75º 13,66º 20,17º 26,17º 31,61º 36,47º Elevation at J 6,33º 12,91º 19,15º 24,94º 30,24º 35,01º Elevation at K 11,10º 22,05º 31,53º 39,41º 45,83º 51,05º Elevation at L 5,06º 10,34º 15,44º 20,29º 24,85º 29,10º Ave. elevation 8,93º 17,51º 24,89º 31,18º 36,55º 41,17º Altitude (m) 10000 20000 30000 40000 50000 60000 Repeater R3 PDOP 3,66 2,30 2,07 2,12 2,28 2,51 Elevation at A 21,40º 38,94º 50,74º 58,60º 64,02º 67,92º Elevation at B 19,17º 35,52º 47,19º 55,31º 61,07º 65,29º Elevation at C 6,43º 13,25º 19,69º 25,65º 31,06º 35,92º Elevation at D 6,21º 12,70º 18,86º 24,60º 29,85º 34,59º Elevation at E 5,55º 11,31º 16,84º 22,06º 26,92º 31,38º Elevation at F 6,45º 13,07º 19,35º 25,17º 30,47º 35,25º Elevation at G 12,04º 23,79º 33,75º 41,83º 48,28º 53,43º Elevation at H 13,40º 26,03º 36,44º 44,65º 51,04º 56,05º Elevation at I 8,88º 17,76º 25,84º 32,94º 39,06º 44,26º Elevation at J 6,19º 12,64º 18,76º 24,47º 29,69º 34,42º Elevation at K 6,31º 12,86º 19,07º 24,85º 30,12º 34,88º Elevation at L 6,55º 13,31º 19,70º 25,62º 30,99º 35,81º Ave. elevation 9,88º 19,27º 27,19º 33,81º 39,38º 44,10º Repeater R4 PDOP 3,95 2,51 2,29 2,35 2,53 2,78 Elevation at A 7,56º 15,29º 22,49º 29,00º 34,78º 39,84º Elevation at B 10,77º 21,33º 30,57º 38,32º 44,71º 49,94º Elevation at C 14,48º 28,35º 39,36º 47,74º 54,08º 58,94º Elevation at D 4,83º 9,94º 14,88º 19,59º 24,04º 28,20º Elevation at E 5,38º 10,98º 16,37º 21,47º 26,22º 30,62º Elevation at F 7,67º 15,46º 22,70º 29,24º 35,03º 40,10º Elevation at G 9,48º 19,05º 27,62º 35,03º 41,30º 46,55º Elevation at H 20,92º 38,09º 49,83º 57,75º 63,26º 67,24º Elevation at I 18,89º 35,07º 46,70º 54,85º 60,65º 64,91º Elevation at J 7,42º 15,05º 22,17º 28,63º 34,37º 39,42º Elevation at K 4,24º 8,70º 13,04º 17,24º 21,24º 25,04º Elevation at L 14,23º 27,57º 38,32º 46,62º 52,97º 57,87º Ave. elevation 10,49º 20,41º 28,67º 35,46º 41,05º 45,72º Table 4 - PDOP and elevations of 12 bases and 4 repeaters References : DANA P. Global Positioning System Overview: GDOP computation example, 1996. Available at < https:// www.colorado.edu/geography/gcraft/notes/gps/gif/gdop.gif>. Access in 26 jun. 2018. KAUFMANN, P. et al. A New Independent GPS-Free System for Geo-Referencing from Space. Scientific Research Publishing. 2014. Acknowledgements : We would like to thank COSPAR and Caltech for the opportunity to present our poster, and to Fundo Mackenzie de Pesquisa (MACKPESQUISA) for the travel funds and for supporting this work. 4. PDOP analysis In the simulations using 4 bases, shown in Figure 2, the combination ACDE, that is not considering base B, resulted in higher values of PDOP, and from these values, the lowest happened at 35º elevation. For 4 bases, the best distribution happens when the repeater is over one of the base, and the other bases are evenly distributed around, and that happened in the combination ABCD and ABCE. When a fifth base is added to the system, the PDOP factor decreases. Considering a cutoff angle of 15º, the best elevation for this geometry is 30000 meters. The simulation with 12 bases, shown in Figure 3, brought PDOP factors within acceptable values, especially for repeater R1, where these values are near the ideal. In R1, the PDOP value increases with altitude, however the altitudes of 10000 and 20000 meters are not recommended because there are several occurrences of elevations bellow 15º, so the altitude of 30000 meters are the best for this configuration. It is possible to use repeaters of lower altitude, but the bases would need to be closer from each other. Regarding the repeaters R2, R3, and R4, the PDOP value decreases until 30000 meters of altitude and then increases again. The repeater R2 has PDOP 2.23 at 30000 meters, but there are 2 values bellow 15º (bases C and F) that could be disconsidered in the PDOP calculation. Doing this, the PDOP drops to 2.51 and the repeater at 40000 meters of altitude would have a PDOP lower than 30000 meters. The repeater R3 doesn’t have elevation lower than 15º at 30000 meters and R4 has 2 (base D and K). Disconsidering these bases, the PDOP drops to 2.46, that is greater than 2.35 at 40000 meters. 4. Conclusion PDOP is a factor that indicates how the distribution of the bases affects the accuracy of the measurements, and it could be used as a geometry parameter of the Geolocal system. For 4 bases, the lowest PDOP happens when the repeater is located over one of the bases, and, as the number of bases increases, the PDOP value decreases. The best altitude of repeater depends on the distance from the bases, and in order to use a repeater in lower altitude, it is necessary to use bases closer to each other.
Transcript of 1. Introduction 3. PDOP simulations with 12 fixed bases
1. Introduction
2. PDOP simulations with 4 and 5 fixed bases
Geolocal is a navigation system developed by researchers from Universidade Mackenzie, in Brazil. It is
based on an “inverted-GNSS” geometry, as shown in Figure 1, that has at least 4 base stations on the ground, A,
B, C and D, at known geodesic position coordinates, synchronized among themselves, a repeater R in space,
that can be a spacecraft, a balloon or a satellite, and a target P on the ground (KALFMANN et al, 2014).
. .
3. PDOP simulations with 12 fixed bases
Figure 1- The four ground based geodetic reference bases,
A,B,C and D, the repeater in space R, and a remote target P.
Time signals are emitted by one reference base (A), retransmitted
by R and received by all ground bases and the target where time
diferences are measured (KALFMANN et al, 2014).
Eduardo Perez Macho*; Sergio Vicente Denser Pamboukian**Universidade Presbiteriana Mackenzie – São Paulo, Brazil
These equations depend on the repeater’s delay δR and on the propagation delays ΔpdAR, ΔpdBR, ΔpdCR,
ΔpdDR and ΔpdPR. The values ΔtA, ΔtB, ΔtC, ΔtD and ΔtP are the time differences measured at each base and target,
when comparing their clock with the signal received. The value δAt is the known time variation due to the signal
transit through circuits and cables in the transmitting base; δAr, δBr, δCr, δDr e δPr are the know time variation due
to the signal transit through circuits and cables in the receiving bases and the target.
To establish the position of the repeater, a base chosen as reference base, in this case, base A, sends a
radio signal that is received by the repeater, and retransmitted to all bases, producing at least 4 ranging
measurements that allow us to calculate the distances AR, BR, CR and DR using the equations bellow. With
these distances, it is possible to find the position of the repeater by triangulation.
PDOP (Position Dilution of Precision) is a factor that indicates how diluted is the precision of the position,
in other words, based on the geometry of the system, how the position error of the repeater increases from the
error of the distances AR, BR, CR and DR. The ideal PDOP value for most applications is 1, but 4 is considered
acceptable.
To calculate PDOP in the ECEF (Earth Centered – Earth Fixed) system, it is used the A Matrix and the
equations below (DANNA, 1996).
As an example, it was done some simulations with 5 bases A, B, C, D and E and a repeater R in 5 cities
of Sao Paulo state, Brazil, in the coordinates show in Table 1 and illustrated in the Figure 2. PDOP results,
elevation at each base, and average elevation for 5 combinations of 4 bases and 1 combination of 5 bases are
shown in Table 2.
City Element Latitude Longitude Altitude
Rio Claro Base A - 22º 24’ 48’’ - 47º 34’ 11’’ 592 m
Piracicaba Base B - 22º 43’ 30’’ - 47º 38’ 51’’ 524 m
Botucatu Base C - 22º 53’ 25’’ - 48º 27’ 19’’ 828 m
Campinas Base D - 22º 54’ 23’’ - 47º 03’ 42’’ 677 m
Itu Base E - 23º 15’ 57’’ - 47º 17’ 57’’ 577 m
Piracicaba Repeater R - 22º 43’ 30’’ - 47º 38’ 51’’ variable
Table 1 - Latitude, longitude and altitude of 5 bases and repeater Figure 2 – position of the 5 bases, A, B, C and D, and
repeater R (adapted from Google Maps)
Altitude (m) 10000 20000 30000 40000 50000 60000
Combination ABCD
PDOP 1,86 2,16 2,57 3,09 3,72 4,45
Elevation at A 14,86º 28,68º 39,63º 47,95º 54,25º 59,07º
Elevation at B 90,00º 90,00º 90,00º 90,00º 90,00º 90,00º
Elevation at C 6,16º 12,70º 18,91º 24,69º 29,97º 34,74º
Elevation at D 8,36º 16,92º 24,77º 31,72º 37,77º 42,96º
Average elevation 9,79º 19,43º 27,77º 34,79º 40,66º 45,59º
Combination ABCE
PDOP 1,85 2,19 2,67 3,28 4,02 4,90
Elevation at A 14,86º 28,68º 39,63º 47,95º 54,25º 59,07º
Elevation at B 90,00º 90,00º 90,00º 90,00º 90,00º 90,00º
Elevation at C 6,16º 12,70º 18,91º 24,69º 29,97º 34,74º
Elevation at E 7,69º 15,54º 22,83º 29,40º 35,22º 40,30º
Average elevation 9,57º 18,97º 27,12º 34,01º 39,81º 44,70º
Combination ABDE
PDOP 3,47 4,04 4,84 5,89 7,19 8,76
Elevation at A 14,86º 28,68º 39,63º 47,95º 54,25º 59,07º
Elevation at B 90,00º 90,00º 90,00º 90,00º 90,00º 90,00º
Elevation at D 8,36º 16,92º 24,77º 31,72º 37,77º 42,96º
Elevation at E 7,69º 15,54º 22,83º 29,40º 35,22º 40,30º
Average elevation 10,30º 20,38º 29,08º 36,36º 42,41º 47,44º
Altitude (m) 10000 20000 30000 40000 50000 60000
Combination ACDE
PDOP 29,71 16,93 13,86 13,25 13,70 14,78
Elevation at A 14,86º 28,68º 39,63º 47,95º 54,25º 59,07º
Elevation at C 6,16º 12,70º 18,91º 24,69º 29,97º 34,74º
Elevation at D 8,36º 16,92º 24,77º 31,72º 37,77º 42,96º
Elevation at E 7,69º 15,54º 22,83º 29,40º 35,22º 40,30º
Average elevation 9,27º 18,46º 26,54º 33,44º 39,30º 44,27º
Combination BCDE
PDOP 3.02 3,28 3,65 4,12 4,70 5,40
Elevation at B 90,00º 90,00º 90,00º 90,00º 90,00º 90,00º
Elevation at C 6,16º 12,70º 18,91º 24,69º 29,97º 34,74º
Elevation at D 8,36º 16,92º 24,77º 31,72º 37,77º 42,96º
Elevation at E 7,69º 15,54º 22,83º 29,40º 35,22º 40,30º
Average elevation 7,40º 15,05º 22,17º 28,60º 34,32º 39,33º
Combination ABCDE
PDOP 1,72 2,07 2,46 2,93 3,45 3,99
Elevation at A 14,86º 28,68º 39,63º 47,95º 54,25º 59,07º
Elevation at B 90,00º 90,00º 90,00º 90,00º 90,00º 90,00º
Elevation at C 6,16º 12,70º 18,91º 24,69º 29,97º 34,74º
Elevation at D 8,36º 16,92º 24,77º 31,72º 37,77º 42,96º
Elevation at E 7,69º 15,54º 22,83º 29,40º 35,22º 40,30º
Average elevation 9,27º 18,46º 26,54º 33,44º 39,30º 44,27º
Table 2 - PDOP and elevations simulating 5 combination of 4 fixed bases and 1 combination of 5 fixed bases for each repeater
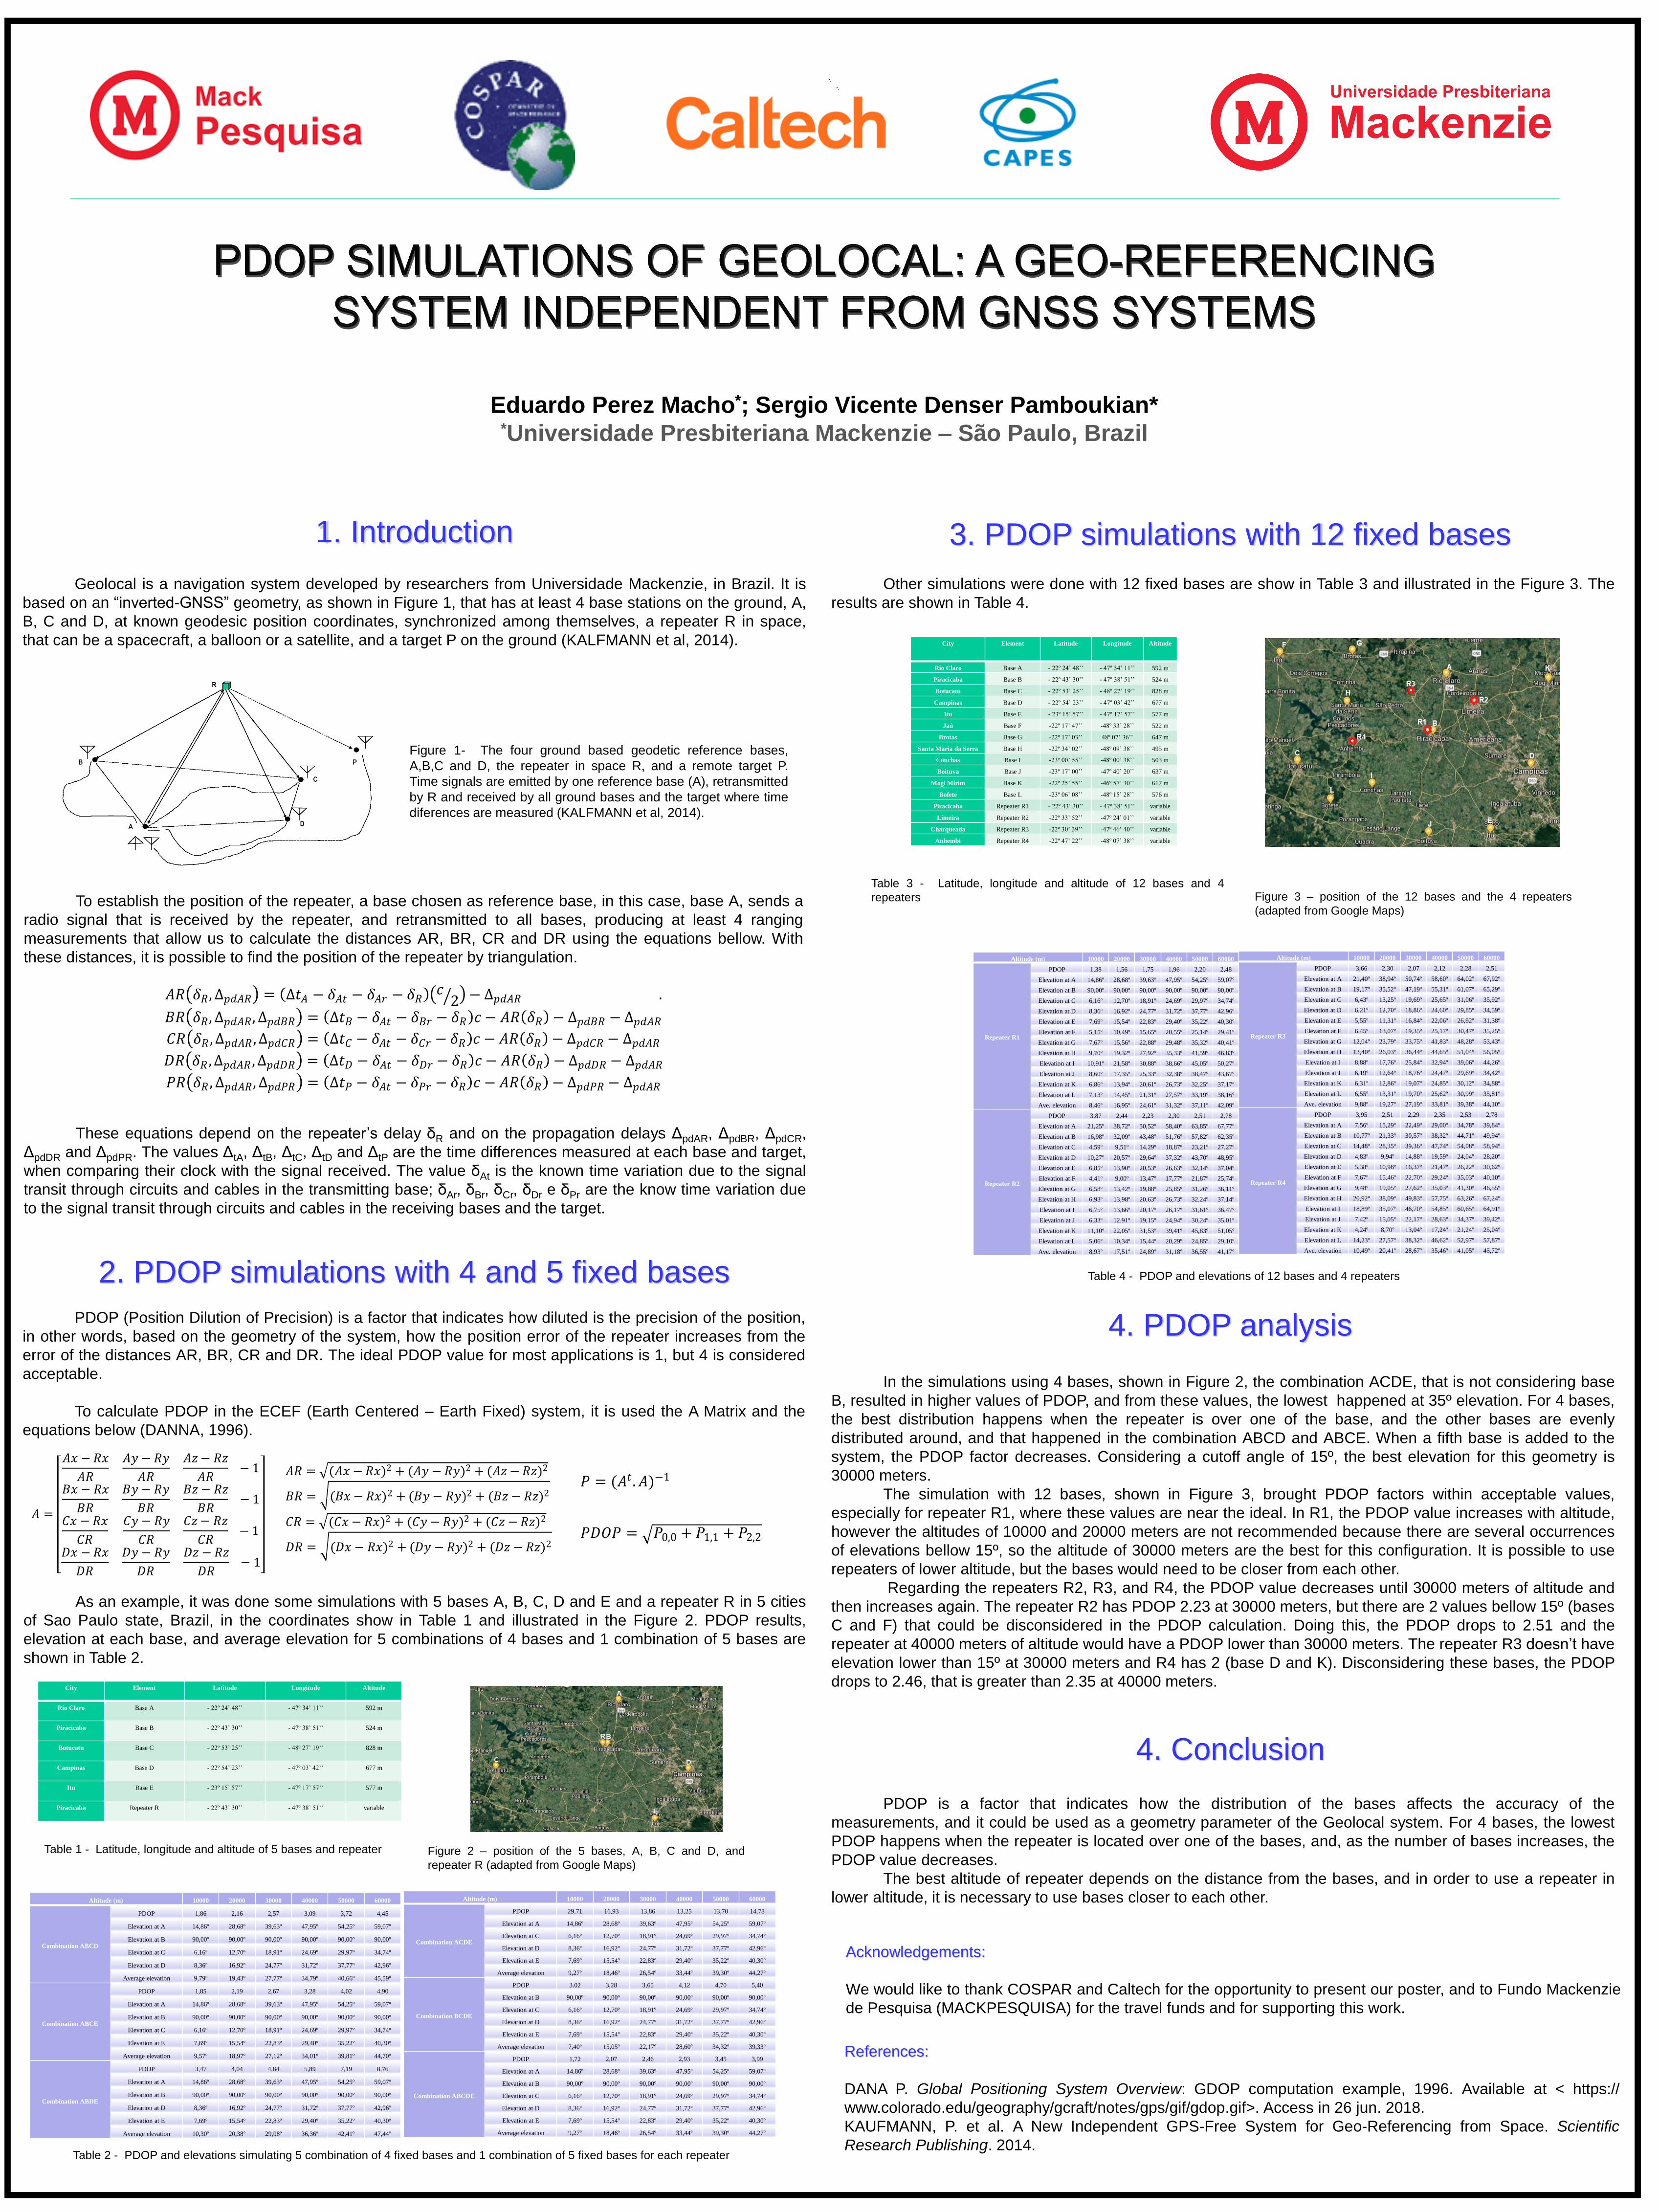
Other simulations were done with 12 fixed bases are show in Table 3 and illustrated in the Figure 3. The
results are shown in Table 4.
City Element Latitude Longitude Altitude
Rio Claro Base A - 22º 24’ 48’’ - 47º 34’ 11’’ 592 m
Piracicaba Base B - 22º 43’ 30’’ - 47º 38’ 51’’ 524 m
Botucatu Base C - 22º 53’ 25’’ - 48º 27’ 19’’ 828 m
Campinas Base D - 22º 54’ 23’’ - 47º 03’ 42’’ 677 m
Itu Base E - 23º 15’ 57’’ - 47º 17’ 57’’ 577 m
Jaú Base F -22º 17’ 47’’ -48º 33’ 28’’ 522 m
Brotas Base G -22º 17’ 03’’ 48º 07’ 36’’ 647 m
Santa Maria da Serra Base H -22º 34’ 02’’ -48º 09’ 38’’ 495 m
Conchas Base I -23º 00’ 55’’ -48º 00’ 38’’ 503 m
Boituva Base J -23º 17’ 00’’ -47º 40’ 20’’ 637 m
Mogi Mirim Base K -22º 25’ 55’’ -46º 57’ 30’’ 617 m
Bofete Base L -23º 06’ 08’’ -48º 15’ 28’’ 576 m
Piracicaba Repeater R1 - 22º 43’ 30’’ - 47º 38’ 51’’ variable
Limeira Repeater R2 -22º 33’ 52’’ -47º 24’ 01’’ variable
Charqueada Repeater R3 -22º 30’ 39’’ -47º 46’ 40’’ variable
Anhembi Repeater R4 -22º 47’ 22’’ -48º 07’ 38’’ variable
Table 3 - Latitude, longitude and altitude of 12 bases and 4
repeaters Figure 3 – position of the 12 bases and the 4 repeaters
(adapted from Google Maps)
Altitude (m) 10000 20000 30000 40000 50000 60000
Repeater R1
PDOP 1,38 1,56 1,75 1,96 2,20 2,48
Elevation at A 14,86º 28,68º 39,63º 47,95º 54,25º 59,07º
Elevation at B 90,00º 90,00º 90,00º 90,00º 90,00º 90,00º
Elevation at C 6,16º 12,70º 18,91º 24,69º 29,97º 34,74º
Elevation at D 8,36º 16,92º 24,77º 31,72º 37,77º 42,96º
Elevation at E 7,69º 15,54º 22,83º 29,40º 35,22º 40,30º
Elevation at F 5,15º 10,49º 15,65º 20,55º 25,14º 29,41º
Elevation at G 7,67º 15,56º 22,88º 29,48º 35,32º 40,41º
Elevation at H 9,70º 19,32º 27,92º 35,33º 41,59º 46,83º
Elevation at I 10,91º 21,58º 30,88º 38,66º 45,05º 50,27º
Elevation at J 8,60º 17,35º 25,33º 32,38º 38,47º 43,67º
Elevation at K 6,86º 13,94º 20,61º 26,73º 32,25º 37,17º
Elevation at L 7,13º 14,45º 21,31º 27,57º 33,19º 38,16º
Ave. elevation 8,46º 16,95º 24,61º 31,32º 37,11º 42,09º
Repeater R2
PDOP 3,87 2,44 2,23 2,30 2,51 2,78
Elevation at A 21,25º 38,72º 50,52º 58,40º 63,85º 67,77º
Elevation at B 16,98º 32,09º 43,48º 51,76º 57,82º 62,35º
Elevation at C 4,59º 9,51º 14,29º 18,87º 23,21º 27,27º
Elevation at D 10,27º 20,57º 29,64º 37,32º 43,70º 48,95º
Elevation at E 6,85º 13,90º 20,53º 26,63º 32,14º 37,04º
Elevation at F 4,41º 9,00º 13,47º 17,77º 21,87º 25,74º
Elevation at G 6,58º 13,42º 19,88º 25,85º 31,26º 36,11º
Elevation at H 6,93º 13,98º 20,63º 26,73º 32,24º 37,14º
Elevation at I 6,75º 13,66º 20,17º 26,17º 31,61º 36,47º
Elevation at J 6,33º 12,91º 19,15º 24,94º 30,24º 35,01º
Elevation at K 11,10º 22,05º 31,53º 39,41º 45,83º 51,05º
Elevation at L 5,06º 10,34º 15,44º 20,29º 24,85º 29,10º
Ave. elevation 8,93º 17,51º 24,89º 31,18º 36,55º 41,17º
Altitude (m) 10000 20000 30000 40000 50000 60000
Repeater R3
PDOP 3,66 2,30 2,07 2,12 2,28 2,51
Elevation at A 21,40º 38,94º 50,74º 58,60º 64,02º 67,92º
Elevation at B 19,17º 35,52º 47,19º 55,31º 61,07º 65,29º
Elevation at C 6,43º 13,25º 19,69º 25,65º 31,06º 35,92º
Elevation at D 6,21º 12,70º 18,86º 24,60º 29,85º 34,59º
Elevation at E 5,55º 11,31º 16,84º 22,06º 26,92º 31,38º
Elevation at F 6,45º 13,07º 19,35º 25,17º 30,47º 35,25º
Elevation at G 12,04º 23,79º 33,75º 41,83º 48,28º 53,43º
Elevation at H 13,40º 26,03º 36,44º 44,65º 51,04º 56,05º
Elevation at I 8,88º 17,76º 25,84º 32,94º 39,06º 44,26º
Elevation at J 6,19º 12,64º 18,76º 24,47º 29,69º 34,42º
Elevation at K 6,31º 12,86º 19,07º 24,85º 30,12º 34,88º
Elevation at L 6,55º 13,31º 19,70º 25,62º 30,99º 35,81º
Ave. elevation 9,88º 19,27º 27,19º 33,81º 39,38º 44,10º
Repeater R4
PDOP 3,95 2,51 2,29 2,35 2,53 2,78
Elevation at A 7,56º 15,29º 22,49º 29,00º 34,78º 39,84º
Elevation at B 10,77º 21,33º 30,57º 38,32º 44,71º 49,94º
Elevation at C 14,48º 28,35º 39,36º 47,74º 54,08º 58,94º
Elevation at D 4,83º 9,94º 14,88º 19,59º 24,04º 28,20º
Elevation at E 5,38º 10,98º 16,37º 21,47º 26,22º 30,62º
Elevation at F 7,67º 15,46º 22,70º 29,24º 35,03º 40,10º
Elevation at G 9,48º 19,05º 27,62º 35,03º 41,30º 46,55º
Elevation at H 20,92º 38,09º 49,83º 57,75º 63,26º 67,24º
Elevation at I 18,89º 35,07º 46,70º 54,85º 60,65º 64,91º
Elevation at J 7,42º 15,05º 22,17º 28,63º 34,37º 39,42º
Elevation at K 4,24º 8,70º 13,04º 17,24º 21,24º 25,04º
Elevation at L 14,23º 27,57º 38,32º 46,62º 52,97º 57,87º
Ave. elevation 10,49º 20,41º 28,67º 35,46º 41,05º 45,72º
Table 4 - PDOP and elevations of 12 bases and 4 repeaters
References:
DANA P. Global Positioning System Overview: GDOP computation example, 1996. Available at < https://
www.colorado.edu/geography/gcraft/notes/gps/gif/gdop.gif>. Access in 26 jun. 2018.
KAUFMANN, P. et al. A New Independent GPS-Free System for Geo-Referencing from Space. Scientific
Research Publishing. 2014.
Acknowledgements:
We would like to thank COSPAR and Caltech for the opportunity to present our poster, and to Fundo Mackenzie
de Pesquisa (MACKPESQUISA) for the travel funds and for supporting this work.
4. PDOP analysis
In the simulations using 4 bases, shown in Figure 2, the combination ACDE, that is not considering base
B, resulted in higher values of PDOP, and from these values, the lowest happened at 35º elevation. For 4 bases,
the best distribution happens when the repeater is over one of the base, and the other bases are evenly
distributed around, and that happened in the combination ABCD and ABCE. When a fifth base is added to the
system, the PDOP factor decreases. Considering a cutoff angle of 15º, the best elevation for this geometry is
30000 meters.
The simulation with 12 bases, shown in Figure 3, brought PDOP factors within acceptable values,
especially for repeater R1, where these values are near the ideal. In R1, the PDOP value increases with altitude,
however the altitudes of 10000 and 20000 meters are not recommended because there are several occurrences
of elevations bellow 15º, so the altitude of 30000 meters are the best for this configuration. It is possible to use
repeaters of lower altitude, but the bases would need to be closer from each other.
Regarding the repeaters R2, R3, and R4, the PDOP value decreases until 30000 meters of altitude and
then increases again. The repeater R2 has PDOP 2.23 at 30000 meters, but there are 2 values bellow 15º (bases
C and F) that could be disconsidered in the PDOP calculation. Doing this, the PDOP drops to 2.51 and the
repeater at 40000 meters of altitude would have a PDOP lower than 30000 meters. The repeater R3 doesn’t have
elevation lower than 15º at 30000 meters and R4 has 2 (base D and K). Disconsidering these bases, the PDOP
drops to 2.46, that is greater than 2.35 at 40000 meters.
4. Conclusion
PDOP is a factor that indicates how the distribution of the bases affects the accuracy of the
measurements, and it could be used as a geometry parameter of the Geolocal system. For 4 bases, the lowest
PDOP happens when the repeater is located over one of the bases, and, as the number of bases increases, the
PDOP value decreases.
The best altitude of repeater depends on the distance from the bases, and in order to use a repeater in
lower altitude, it is necessary to use bases closer to each other.
![Equipe Bases de Données [Bases de Données / Databases]](https://static.fdocuments.us/doc/165x107/61ec2bcb6c24f366634bb8c5/equipe-bases-de-donnes-bases-de-donnes-databases.jpg)

![Bases Bases Bases Bases Bases Bases Bases Bases Bases ......Hair loss or alopecia is a problem in modern society, which is usually related to hair loss on the scalp [1]. The most common](https://static.fdocuments.us/doc/165x107/5f692ed64ffcd531a566bfdf/bases-bases-bases-bases-bases-bases-bases-bases-bases-hair-loss-or-alopecia.jpg)


