
1 Integrated Planning and Decision Support Systems For Sustainable Watershed Development
35
1 Integrated Planning and Decision Support Systems For Sustainable Watershed Development Resource Paper Presented at Study Meeting on Watershed Development Organized by Asian Productivity Organization & The Iranian Ministry of Agriculture 12-17 October 2002, Tehran, Islamic Republic of Iran by M. A. Sharifi Department of Urban-Regional Planning and Geo-Information Infrastructure International Institute for Geo-information and Earth Observation ITC, The Netherlands E-Mail: [email protected]
Transcript of 1 Integrated Planning and Decision Support Systems For Sustainable Watershed Development

1
Integrated Planning and Decision Support Systems For Sustainable Watershed
Development
Resource Paper
Presented at Study Meeting on Watershed Development
Organized by Asian Productivity Organization & The Iranian Ministry of Agriculture
12-17 October 2002, Tehran, Islamic Republic of Iran
by M. A. Sharifi
Department of Urban-Regional Planning and Geo-Information Infrastructure International Institute for Geo-information and Earth Observation
ITC, The Netherlands E-Mail: [email protected]

2
Integrated Planning and Decision Support Systems For Sustainable Watershed
Development Resource Paper
by M. A. Sharifi
Department of Urban-Regional Planning and Geo-Information Infrastructure International Institute for Geo-information and Earth Observation
ITC, The Netherlands E-Mail: [email protected]
Study meeting on Watershed Development
Organized by Asian Productivity Organization & The Iranian Ministry of Agriculture
12-17 October 2002, Tehran, Islamic Republic of Iran Abstract The growing concern about land resource management and the associated decline in land qualities have led to generation of considerable amounts of disciplinary knowledge, collection and management of large disciplinary data-sets from the earth resource processes. This is specially enhanced by the advances in geoinformtaion technology, which has created very efficient possibility of collecting, and managing large amounts of data from earth resource processes in various form and scales. In many cases now the problem is not lack of data/information, but the selection and process of data to generate meaningful and timely information that can support better management of resources. In this line, this paper introduces the resource planning and management process, the trend and the role if information technology, and contributes to development and operationalization of a framework for planning and decision-making to support better management of resources. Here, variety of disciplinary models are integrated in an Integrated Planning and Decision Support System, allowing integration of agro-ecological and agro-economic information derived from variety of sources, to formulate and evaluate various policy options. The methodology is evaluated in a case study, which tries to find the most effective policy instrument that supporting the ground water rehabilitation in La Mancha Region in Spain. Keywords: decision support systems, multicriteria evaluation, Planning Support Systems, Integrated Planning and decision Support Systems, policy formulation, model-based planning support, water resource rehabilitation, Integrated water resource management. 1. Introduction The watershed approach is a coordinating framework for environmental management that focuses public and private sector efforts to address the highest priority problems within hydrologically-defined geographic areas, taking into consideration both ground and surface water flow. Increasingly, water resource professionals are turning to watershed management as a means for achieving greater results from their programs. This is because managing water resource programs on a watershed basis makes good sense -- environmentally, financially, and socially. Watersheds are defined by natural hydrology, therefore, they represent the most logical basis for managing water resources. The resource becomes the focal point, and managers are able to gain a more complete understanding of overall conditions in an area and the stressors, which affect those conditions, and therefore lead to better environmental results. Watershed management
3
can offer a stronger foundation for uncovering the many stressors that affect a watershed. The result is management witch is better equipped to determine what actions are needed to protect or restore the resources. Besides the environmental pay-off, watershed approaches can have the added benefit of saving time and money. Whether the task is monitoring, modeling, issuing permits, or reporting, a watershed framework offers many opportunities to simplify and streamline the workload. For example, synchronizing monitoring schedules so that all monitoring within a given area (i.e., a watershed) occurs within the same time frame can eliminate duplicative trips and greatly reduce travel costs. Efficiency is also increased once all agencies with natural resource responsibilities begin to work together to improve conditions in a watershed. In its truest sense, watershed protection engages all partners within a watershed, including federal, state, tribal and local agencies. By coordinating their efforts, these agencies can complement and reinforce each other’s activities, avoid duplication, and leverage resources to achieve greater results. The can form basin-monitoring consortiums to pool resources and provide the state with greater consistency in collecting and reporting data. Watershed protection can also lead to greater awareness and support from the public. Once individuals become aware of and interested in their watershed, they often become more involved in decision-making as well as hands-on protection and restoration (EPA, 1996). In the course of the Symposium on Soil Erosion Research for the 21st Century (Hawaii; 2001) the progress that were made in soil erosion and conservations was reviewed. It was realized that in spite of extensive advances in remote sensing, information technology and disciplinary sciences, there are still a number of pressing issues, which are hampering the sustainable development. Some of the issues are: - Not having adequate tools to assess the environmental impact of land management
decisions, which make it difficult to convince the community, policy makers, and land managers that changes are necessary and worth pursuing.
- Methods of monitoring and assessing the spatial and temporal variation in wind erosion are inadequate.
- Weak integration of research efforts and results in the wider context. This leads to poor integration across spatial scales, poor integration with the efforts of social scientists and economists, and even with physical scientists with different approaches to the problem, and poor integration of erosion and sediment transport by water with other land degradation processes e.g., changes in soil structure, deforestation, salinization, tillage erosion, which yields to poor adoption rates.
- Lack of understanding of the large-scale implications of the phenomena studied on the small scale. This leads to an inadequate understanding of the impacts of erosion and sediment transport on global climate change, such as impacts on carbon sequestration.
- Lack of a comprehensive database to allow us to efficiently use data collected by others.
- Poor understanding of how spatial and temporal variability in soil properties, surface conditions, and climate impact soil erosion
Some of the recommendations to improve the situation are: - Developing regional models by integrating existing wind erosion models and

4
decision-support tools - Development of proper tools so that it can support better understanding and learning
of both professionals and stakeholders, and create a common ground for better collaboration, more effective planning and decision making at various levels.
- Developing techniques to more effectively transfer the technology to the end users - Developing more interdisciplinary research efforts and share data openly, and
standardize its collection and storage.
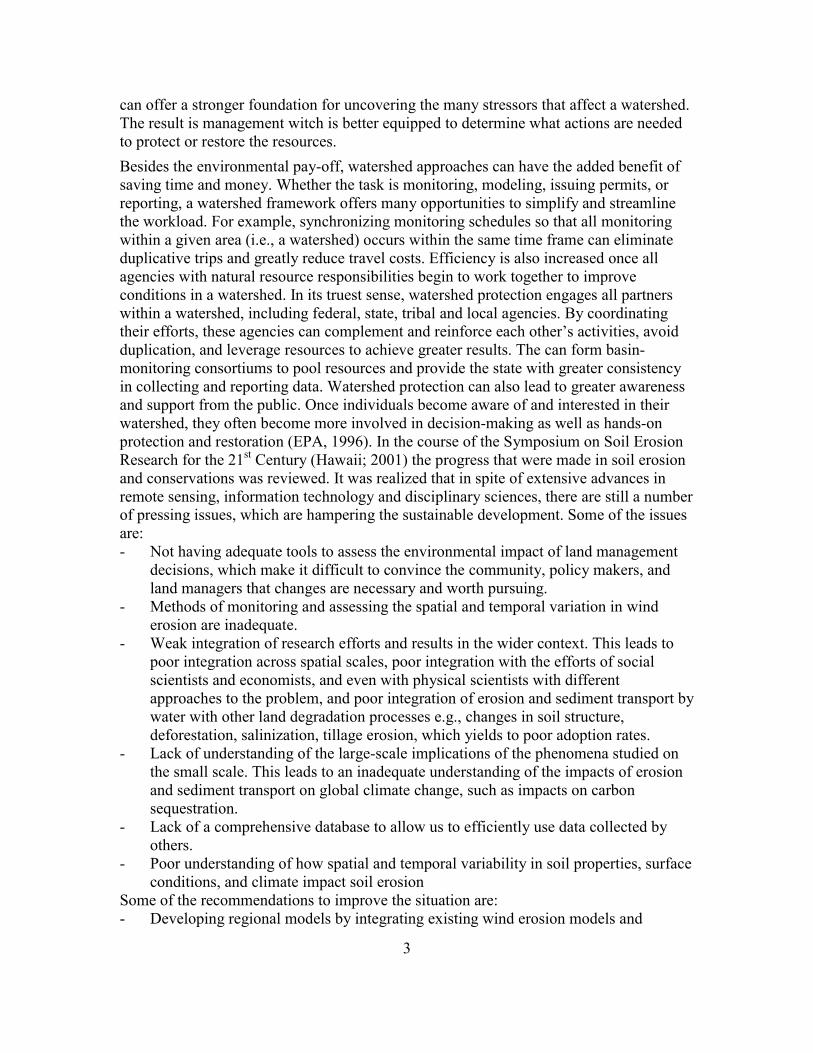
Advances in information technology and remote sensing have provided extensive information from the processes that are taking place in earth surface, many of which are organized in computer systems, some are freely available and others are accessible in affordable price. Research in disciplinary sciences has also produced insight in to many physical and socio-economic processes. Yet many of the existing information and knowledge are not used to support better management of our resources. Geo-information technology has offered appropriate technology for data collection from Earth-surface, information extraction, data management, routine manipulation and visualization, but they lack well-developed, analytical capabilities to support decision-making processes. However, for improved decision-making, all these techniques, models and decision-making procedure have to become integrated in an information processing system called “Integrated Planning and Decision Support System”. Development of such a system requires understanding of the system, its constituent processes and their impact on system behavior, and understanding of the system requires synthesis of important ecological, environmental, social, managerial and economic processes in the system. In this context, this paper briefly describes planning and management process for sustainable development, the way that they are developed and applied. Further the supporting role of remote sensing, GIS and, information technology are briefly elaborated. Next to make the existing knowledge and information useful and supportive to the sustainable development, a framework for planning and decision-making is introduced, and finally, the implementation of the framework in supporting policy formulation for water resource rehabilitation in Spain is presented. 2. Planning Process And Environmental Sustainability Development planning as defined by Conyers and Hill (1989), is a planning with a goal of attaining developed society, through control or influencing the process of development. Here the effect of economic policies on patterns of and changes in land use are studied. In this approach, changes in land use are considered as the result of the interaction between policy variables (like infrastructure, investments, prices, credit facilities) and exogenous parameters (resource endowments) that lead to realization of a number of defined goals (welfare, equity) and possible (undesired) side effects (environmental pollution). For better understanding of planning process, planning environment is depicted in a systems perspective (figure 1). This perspective consists of four major systems: the
5
ecological system (the natural resources and environmental quality); the economic system (the production and consumption of services, investment and technological development); the socio-cultural system (norms and values); and the government. These systems are interrelated, and many economic activities are taking place as a result of interactions between them. In this system, land use decisions involve choices of at least two levels, e.g., regional and house-hold/local levels (agents).
Figure 1. Planning in a system perspective At the regional level, a policy maker through planning system is trying to decide how best to allocate resources or lead the agricultural development process to the desired direction, in the face of uncertainty about the impact of allocation process on the other systems. This uncertainty is related to the way that different agents in the economic system will respond to the new policy. At the house-hold/local level, agents have their own decision problem: how best to respond to the new policy, given their own resources and objectives which is influenced by socio-cultural values and impacts of the other systems. In order to reduce the uncertainty about agent’s reaction and support an effective decision, related to a proper policy measure at macro-level, its impacts at local level have to be evaluated. In the process of producing goods and services, many times extensive use of resources, or pollution of the ecosystem has led to negative impact on environment. To avoid that information about the adverse effect on the health of people and environment should be incorporated in the related decision making processes. Unfortunately the problem of adverse effect is often not incorporated in the decision process and this leads to imbalances between the economic and environmental systems. To protect environmental and public health as well as to stimulate sounder environmental behavior, balancing the economic, environmental and soci-cultural systems in particular when considering development possibilities for future generations, relates to the concept of “sustainable development” (Brundtland , 1987). To tackle the imbalances, government can intervene in the economic system (e.g., through regulations or levies), the ecological system (e.g.,
Management
P l a n n i n g
Management Effect
Ecological system Economic system
Government
Social cultural system
Values
6
through rehabilitation of ground water) or address the economic system in more direct ways via the soci-cultural system (by stimulating more environmental consciousness in the economic decision making process). These interventions may take place at different spatial scales e.g., local, regional, national, and international, (figure 1). The Unite Nation Conference on Environment and Development (UNCED, 1992) and the resulting Agenda 21 have bestowed worldwide respectability on the concept of sustainable development. There are over 70 different definition of sustainable development, offering a number of possible modifications of the development process and a number of different reasons for doing so (Steer and Wade-Gery, 1993). Differences may be found in the definition of sustainable development. Some definitions of sustainability are mainly focused on sustaining economic development. However other authors think that ecological consideration shall be involved in the total developments, not its just economic development. Barbier (1987) argue that sustainable development depends upon interaction among three systems, the biological system, the economic system, and the social system. The goals of sustainable development for the three systems are: − For the biological system, maintenance of genetic diversity, resilience, and biological
productivity − For the economic system, the satisfaction of the basic needs (reduction of poverty),
equity enhancement, increasing useful goods and services − For the social system, ensuring cultural diversity, institutional sustainability, social
justice, and participation While sustainability has become a widely acknowledged concept, in the recent development thinking, there are considerable arguments on how to implement the concept. Pearce and Turner (1990) propose a working definition, which involves maximization of the net benefits of economic development, subject to maintenance of the services and quality of natural resources over time. In this definition the maintenance of services and quality of the stock of resources over time implies, as far as practicable, the adherence to the following two rules: − Utilize renewable resources at the rate less than or equal to the natural rate in which
they regenerate. Keep waste flows to the environment at or below the assimilating capacity of environment.
− Optimize the efficiency with which non-renewable resources are used, subject to sustainability between resources and technical progress
3. Trend In Water Resource Planning and Management Water resource planning and management are becoming increasingly difficult due to the complex issues that water resource professional and resource management agencies must address. Clearly, there have been significant changes in the water utility industry over the past 20 years (AWWA, 1997). One major change is that there is now intense competition between water used for drinking, versus other uses such as recreation, agriculture, industry and hydroelectricity generation. In addition, intensive land uses in watershed and aquifer

7
areas have caused degradation of water quality and contamination of sources of supply. The combination of these competing uses and threats to water quality can result in significant depletion of flows in surface and ground water supplies if they are not considered in the comprehensive planning process. Another major change is that new environmental laws have placed constraint on the use of surface and ground water supply. Developing an approach to facilitate successful responses to the above challenges is essential. There are three major water resource planning approaches utilized today in water industry. They are: traditional supply-side planning, least cost planning, and integrated resource planning. Traditional supply-side planning assumes that the problems associated with the provision of a safe and adequate supply of potable water can be solved by developing additional capacity as it is needed. It narrowly focuses on the supply side, excludes nonutility interests, and does not allow the utility to be flexible in meeting competing demands and satisfying regulatory policy goals. It also does not take into account conservation, industrial water reuse, or reasonable assumptions about future trends in customer consumptions and demands. Least-cost planning includes a comprehensive evaluation of all supply and demand alternatives, where the end result is an attempt to minimize the cost, while creating a flexible plan allowing for uncertainty and changing economic environment. It includes externalities as cost and inclusion of nonutility participants goal’s to ensure the success of planning process. Integrated resource planning “IRP” is a relatively new concept based on participation. It considers customers and other resource users as a stakeholder, and it provides for formal integration and coordination among the several government institutions that have regulatory responsibilities for water resource matters. AWWA (1997) defines IRP as a continues process that results in the development of a comprehensive water resource management plan. It defines and gives balanced considerations to supply and demand management planning alternatives. It includes analysis of engineering economic, societal and environmental costs and considerations while balancing the needs of competing users and multiple objectives of the use of resources. It is an open and participatory process involving all stakeholders and striving for consensus while encompassing list-cost analysis of short-term planning options and satisfying utility and regulatory policy goals. Finally IRP explicitly seeks to identify and mange risk and uncertainty and provides for coordination of planning between water utilities in a specific region. The following key issues are frequently discussed in IRP: - Resources are the broad areas to which or form which planning concepts are applied
and includes human, natural and financial. - Water conservation measures that are practices, techniques and technologies that
reduce the consumptions of water, reduces the loss or waste of water, improve the efficiency in the use of water, or increase the reuse of water so that the water resource is available for future or alternative users
- Supply-side management practices that are steps taken to impact consumer behavior, especially demand for water in order to achieve water savings

8
- Least-cost planning that is a process that identifies the optimal mix of supply-side and demand-side management practices while balancing system reliability and affordability, thereby producing planning alternatives with lower costs
- Externalities that are the involuntary imposed economic costs and benefits to the others as a result of providing goods or services (production, consumption, and transportation). Traditionally, this element has not been considered. Example is the costs of adverse environmental impacts, costs and benefits of health and safety and benefits associated with preserving natural resources. Externalities arise when someone’s decision to produce or consume something has impacts on an unrelated party, e.g., air pollution and water consumptions in the up-streams. How to valuate such type of impacts? Methods are well developed to make these estimates. The price, which represents the “value of externalities”, may represent what it would cost to replace the services through man-made means, or it may represent the damage that would be inflicted if we were to lose that service (Ruitenbeek & Cartier 1998).
- Stakeholders that are the working group of people who are directly or indirectly affected by the outcome or play an influential role in the water resource planning and management, and decision making
Traditionally, planning has resulted in plan, which one then follows and monitoring progress against. This is also a common model for many watershed management and planning exercises. But sustainability demands something more. The future is a moving target. The main idea of planning in an integrated sense is that we must think continuously about what might happen to this target. Through engaging in a planning process, we consider the consequence of our actions, we think of objectives we might have, and we think of what might go wrong or right as we go on with our plan. The plan may be of less consequence than the process that generated it. This describes a scenario of adaptive planning which involves a continuous and active planning process before and during execution. Klusterman (2000), sees the current state of planning as a “collective design and reasoning together”. Supporting such adaptive and collaborative concepts require substantial institutional reforms. Many institutions still geared to mono-disciplinary and top down approaches. The current emerging strategy is one of collective management by users. Users are less bothered by the government in the management of their resources. It is believed that they are best equipped to adapt to system changes. This has led to the emergence of so called Adaptive Collaborative Management or Adaptive Co-management “ACM” approach (Ruitenbeek & Cartier 2001). This is a long-term management structure that permits stakeholders to share management responsibility within a specific system of natural resources and to learn from their actions. This strategy is based on social learning, collaboration; clear responsibility, accepting risk and surprises, delegation of rights and responsibilities to local institutions “devolution” and integration of multiple sector with idea that if we look at the larger system we are more likely to do something right (Ruitenbeek & Cartier 1998). IRP and the emerging adaptive co-management approaches are useful concepts that can open-up the horizon of planners to face and consider a range of issues such as replacing aging or obsolete capacity, constructing new capacities, upgrading the distribution system,
9
implementing conservation programs, in different economic and environmental situations. However, the main problem is how to implement these concepts, identify, develop and operationalize the required types of support s. Adaptive co-management requires proper tools which can bring/connect people, prepare a forum for discussion, help them to understand each others, support them to continuously monitor the process, understand its impacts, and help them to adapt and adjust. 4. Satellite Remote Sensing and Water Resource Development Satellite remote sensing provides opportunities to observe routinely the Earth’s land and sea surfaces in a variety of wavebands and at a number of spatial scales. Various sensors, with different spatial, spectral, and temporal resolutions, are used to collect vast amount of data that are routinely generated, and provide unique opportunity to: - Monitor the earth’s environment at local, regional to global scales; - Mange and monitor the renewable and non-renewable of the Earth’s resources; - Provision of an operational meteorological and global positioning systems; - Improving the scientific knowledge of the structure and dynamics of the earth
processes. They provide objective databases, which are potentially neutral and can be interpreted. They measure the reflectance of the earth surface features and the observable landscape patterns representing the socio-economic development, prevailing jurisdiction, agricultural, practices, hydrological processes, and irrigation management ( Bastiaanssen & Prathapar 2000). Because of being direct measurement, they are often more reliable in what they represent. The public character of satellite data entitles different categories of users. Several space agencies are now opening international and freely accessible databases with raw or first order processed satellite images. Data from an International fleet of sensors can be found in the Earth Observation System data and Information System “EOSDIS”. A number of data archive centres (DAAC’s) representing a wide range of earth science disciplines are operational under NASA to process, archive and distribute EOSDIS data. The Earth Resources Observation System (EROS) Data Centre of USGS in addition provides access to land processes data from both satellite and aircraft platforms. Some examples of internationally opened satellite databases can be found at Http://www.saa.noaa.gov, Http://daac.gsfc.nasa.gov. Another example is the USGS digital elevation of the world with one kilometres spatial resolution. There are no restrictions on the use, reprocessing or redistribution of satellite data that are made available through USGS and NASA ( Bastiaanssen & Prathapar 2000). The availability of the remote sensing data is rapidly increasing, and their prices are coming down. While Landsat TM scene covering 180*180 Km, few years ago had 4500 US $ price tag, it is now sold for 500 US$. In the same way the price of French Spot has come down from 4000 $ to 750-1500 US$ depending on the acquisition date. Moreover, many satellite data is available for free on the Internet (NOAA, Aster, MIDOS). All these, opens complete new opportunity to study the hydrological processes, water

10
resource depletion, food security and environmental development in different watershed and basins. Satellite hydrology is becoming a promising field of science and is establishing itself as a promising methodology. Today NOAA-AVHRR satellite images with 1 km resolution are used to monitor the major water use in any part of the world. The Water-Watch Company in Wageningen (http:/www.waterwach.nl) provides routine services related to the actual and potential evapotranspiration, evapotranspiration deficit, biomass productions and relative soil moisture in the root zone of the required region (larger than 1000 Km2 ). The same types of information are used to estimate the irrigation efficiency and water productivity supporting the water accounting (Bastiaansen et al, 2002). NASA provides online tools for seasonal climate forecast tailored to fit resource manger’s need. This shall provide "Consumer Reports" type evaluations of seasonal forecasts for water, land and agricultural managers http://eospso.gsfc.nasa.gov/eos _homepage/ eharchive/02 /may/online_tool.html). NASA has also recently provided the global land cover based on MODIS sensor (http://eospso.gsfc.nasa.gov/eos_homepage /eharchive/02/aug/lcc.html), http://asterweb.jpl.nasa.gov/.
In water resource management Geo-information science and earth observation techniques have clear contributions to make in ensuring sustainable food security and equitable, integrated water resource management. They can be used in developing early warning, food security and risk assessment, irrigation performance, and systems to support effective and efficient methods of planning, monitoring and evaluation and integrated natural resource management. Several examples of the remote sensing applications can be fond in literature e.g. Bastiaanssen & Prathapar (2000), Basstiansen and Ali (2001), Basstianssen and Mobin (2002). As an example, one application of remote sensing on irrigation performance assessment is briefly presents in appendix-1. 5. Integrated Planning and Decision Support Systems for Watershed development 5.1 How Sustainable Development Can be Supported? Given the development in management and planning, sustainability concepts, the growing number of disciplinary qualitative and quantitative models, and the advances in information technology, which has led to the large amounts of datasets, the main question is how to integrate and make use of all these opportunities. How to achieve sustainable ways of making use of resources and in particular, sharing a limited water resources, and how to implement adaptive co-management concept. The first step is to establish some sorts of co-operation between different users, use and use of waste? Good co-operation means building of water awareness and hydro- solidarity, development of water sensitive policies that value water as a scarce resource and propagation of knowledge that saving on water commonly is the best options to increase available water. But the institutional structures that currently rule the way individuals or groups use water are often insufficient in preventing and solving conflicts. Sometimes the intuitions are in itself reason for conflicts. According to Hallding (2001) sustainable solutions can build on: - Through understanding of the sources of conflicts, including its natural, technical,
institutional, social and its cultural aspects.

11
- Participation of all the related stakeholders in the process is curtail, first to arrive at common understanding of the problem and to share as far as possible vision about future and ideas about the path to sustainable solutions.
- Examining the social, environmental and economic contests of the conflict, in order to assess different policy options to make the best use of limited water resources. This may include regulation, financial sanctions and economic incentives and increase public awareness and participation, information dissemination and support for possible institutional change.
- Finally an organization to pursue the co-operation, a means of monitoring achievement, and implementation plans
Implementation of these activities require proper decision and analytical tools to help stakeholders to gain a greater understanding of the way planning decisions affect our environment over time. Tools to help identifying the most relevant issues for a given region, which may be a trade-off between achieving food production target at some point in time and its environmental costs (nitrate leaching), or the trade-off between farmer income and production target. A tool that can help appraisal of alternative plan of actions, to identify their effects in terms of magnitude, location in space and times, the losers and winners, and the effectivity and efficiency of the deployed resources. A tool that can help involving all stakeholders, promote co-operation and collaboration and building sense of community, help reduce conflicts, increase commitment to actions which are necessary to meet environmental goals, and ultimately, improve the likelihood of success for sustainable development programs. In order to develop such a decision support tool, the biophysical processes and human interactions such as adaptive changes of agricultural practice have to be understood and modeled. The model should help resolving the existing conflict between the required increase in productivity, farmer’s income, and the environmental issues, such as soil, water, bio-diversity, and other natural resources, and identify proper land utilization systems and its related technologies that make optimum use of external inputs, natural resources and avoids degradation of natural resources; and policy measures supporting their adoption (Sharifi & Rodrigus 2002). Finally, it should have enough capability to assess the positives and negatives impacts of plans at different time and space, and create opportunities to learn and adjust/adapt based on feed back/forwards, and support implementation of adaptive co-management process. 5.2 GIS and Decision Support Systems GIS are gaining importance and widespread acceptance as a tools for decision support in land, infrastructure, resources, environmental management and spatial analysis, and in urban and regional development planning. With the development of GIS, environmental and natural resource managers increasingly have at their disposal information systems in which data are more readily accessible, more easily combined and more flexibly modified to meet the needs of environmental and natural resource decision making. It is thus reasonable to expect a better informed, more explicitly reasoned, decision-making

12
process. But despite the proliferation of GIS software systems and the surge of public interest in the application of the system to resolve the real world problems, the technology has commonly seen as complex, inaccessible, and alienating to the decision makers (Fedra, 1993, Geertman 2002). The reasons for this estrangement are varied. In part the early development and commercial success of GIS were fuelled more by the need for efficient spatial inventory rather than decision support systems. As a result, few systems yet provide any explicit decision analysis tools. In addition the technology is built upon a very broad base of scientific disciplines, ranging from cartography, to remote sensing, to computer science, to statistics and the like. This implies that to become broadly involved in GIS use, an extensive background in the digital data management, mapping sciences and information technology are required. Further, the technology has strong elements of modernity and scientific rigor that is strongly cultivated by vendors, consultants, and other advocates. As a result, GIS has become a field requiring a host of intermediaries between the end user and the data provider: technicians, system managers, analysts, user interfaces, query languages and so on. Added to this are the institutional and organisational issues of the technology transfer. Although, recent development in GIS software’s and Web Technology has made GIS more user-friendly, therefore useable and accessible to more users (Geertman 2002). Information technology may either democratize information by making it more equitably accessible, or it may have the opposite effects of disproportionately empowering a selected sector of society. The lack of analytical tools to efficiently aid decision evaluation and policy formulation and the continuing mystification of the field have unfortunately often led to the latter in GIS (Fox 1991, Geertman 2002). In many cases GIS has become a rifting technology, tending to divert the process of decision making away from decision makers and into the hands of GIS analyst and host of other highly trained technological intercessors (Eastman, et al. 1993). To alleviate the above problems GIS should be upgraded by DSS functionality in a user friendly and easy to use environment. However, there is a trade-off between the efficiency and ease of use, and the flexibility of the system. The more options are predetermined and available from the menu of choices, the more defaults are provided, the easier it becomes to use a system for an increasingly small sets of tasks. There is also trade-off between the ease of understanding and the precision of the results. Providing a visual or symbolic presentation changes the quality of the information in the course of transformation from quantitative to qualitative data sets. Finally, the easier the system the harder is to make and maintain. 5.3 Decision Support Systems Decision Support Systems "DSS" are a sub-class of management information systems which support analysts, planners, and managers in the decision making process. They can reflect different concept of decision making and different decision situations. DSS are

13
especially useful for semi-structured or unstructured problems where problem solving is enhanced by an interactive dialogue between the system and the user. Their primary feature is harnessing computer power to aid the DM to explore the problem, and increase the level of understanding about decision environment through access to data and models appropriate to the decision. They are aimed at generating and evaluating alternative solutions in order to gain insight into the problems, trade-offs between various objectives and support decision making process. The primary intention of DSS is to assist specific DMs, individually or in groups, rather than the entire organization. This allow custom design of the system, in which DMs can use the system interactively to build and more importantly, to change analytic models of the decision problem. Interactive use allows immediate changes in assumed parameters with rapid feedback, encouraging the learning process that is impossible when the DM has to wait extended period of time for output. Therefore, interaction and support for transferring the results of analysis to the DMs in a communicable, manageable, easy understandable and quick way is a central feature of any effective man-machine-system. A real time dialogue allows the user to define and explore a problem incrementally in response to immediate answers from the system. Fast and powerful systems with modern processor technology can offer the possibility to simulate the dynamic processes with animated output and provide high degree of responsiveness that is essential to maintain a successful dialogue and direct control over the software. DSS functions ranges from information retrieval and display, filtering and pattern recognition, extrapolation, multiattriibute utility theory, optimization techniques, inference and logical comparison to complex modeling. Decision support paradigms may include predictive models, which gives unique answers but with limited accuracy and validity. Scenario analysis relaxes the initial assumptions by making them more conditional, but at the same time more dubious. Prescriptive analysis of decisions emphasizes the development, evaluation and application of techniques to facilitate decision-making. These studies rely upon logic of mathematics and statistics and utilize the concepts of utility and probability to analyze decision problems. The concept of utility relates to the expression of preferences among alternative options, while probability serves to evaluate the likelihood of these preferences being utilized. The techniques adopted in these approaches incorporate explicit statements of preferences of DMs. Such preferences are represented by weighting scheme, constraints, goal, utilities, and other parameters. They analyze and support decision through formal analysis of alternative options, their attributes vis-à-vis evaluation criteria, goals or objectives, and constraints. Group decision support systems focus on expediting the exchange of ideas among participants (brainstorming), stimulating quieter members to participate, and organizing collective thought into a workable consensus. In this context a set of participatory multiple criteria and multiple objective evaluation techniques are needed that aim to place the GIS analyst as a mediator between the computer technology package and the DM. GIS here can be seen as a possible vehicle for problem solving and decision making

14
while accommodating the multiplicity of stakeholders in the decision making process. Research and development in this line has led to the development of Collaborative Spatial Decision Support Systems (CSDSS). Such types of system enables group to work together and participate in decision making concerning spatial issues by providing a set of generic tools, e.g., exchange of numerical, textual, graphical information, generation of solutions, group evaluation, consensus building and voting. This types of systems enable the stake-holders to collaborate in decision making process with no limitation of space and time, they can contribute to the group decision at any time and from any location. Examples of possible application may be environmental restorations, conservation planning, multiple resource use, and land use planning. 5.4 Framework for planning and decision-making: Planning and decision-making are closely related. They are different phase of decision making process which according to Simon (1960) includes the following main phases . - Intelligence: examining the environment to identify problem or opportunity situations. - Design: initiating, developing, and analyzing the possible courses of action. This involves
application of decision models that, generate solutions, test their feasibility, and analyze different alternatives.
- Choice: evaluating alternative options and selection of specific course of action Based on these principles and considering the work of Steinitz (1993), Sharifi & Rodrigues (2002) have developed a framework for planning and decision-making process which, is summarised as follows (Figure 2) : Figure 1. Framework for planning and decision making process
8
Planning & Decision-Making
Process Evi
denc
e
Intelligence(Process model)
Design (Planning model)
Decision/choice(Evaluation model)
Describe system
Understand system behavior
Formulate objectives
Formulate model
Generate alternatives
Assess impacts of alternatives 7
6
5
4
2
1
Assess current situation 3
Explain Visualize & communicate
9
Evaluate and decide

15
1. Define and describe the system in terms of content, environment, boundaries, space and time: “description and representation”
2. Understand how the system operates, which requires establishing the functional and structural relationships among its elements: “Process/behavioral model of the system”
3. Assess the current state of system, and see if is desirable (system is currently working well?), which requires ability to appraise and judge the current state of the system: “evaluation of current situation/problem formulation”
4. Formulate objectives, clarify the goals, objectives of the decision, and identify what should be achieved, and how the achievement should be measured?
5. Study the ways that the current state of the system can be altered or improved, in terms of actions, time and space which requires development of a model to generate the required type of changes or alternative options “ planning model”
6. Use the planning model and generate alternative options, plans, scenarios that can bring the desire changes into the system. This can be observed through simulation of sates of the system under desired changes.
7. Appraise each alternative options through assessment of the various impacts of each options, scenarios or introduced changes, “impacts assessment/effects”
8. Selection of an option, and decide on the type of changes which should be introduced to the system. This “decision” which requires the comparative evaluation of impacts of alternatives changes, and decision on the change or conservation of the system as exist: “evaluation and decision/choice”
9. Explain the choice and communicate the result to the decision makers through appropriate method (visualization)
Here, “Evidence” is defined as the total set of data/information that the Decision Maker/planner has at his disposal, including the skills, which are necessary to use them. It is therefore the key resource at all stages of planning and decision-making. Evidence may be available in different types, such as facts, values, knowledge and experiences. They may be in different forms and format, such as numerical, alphabetical, graphical, map, in sound (spoken form), aerial photographs, satellite images, etc. The quality of evidence is a very important aspect. Ideally, a planner/decision-maker hopes to have good quality evidence in abundant supply. The evidences may be exact “deterministic”, or inexact with known errors “probabilistic” or inexact with unknown-errors “fuzzy”. Frequently, the evidence will be lacking, and the DM has to enhance its quality before it is used in the analysis, but in all cases one should try to make use of all the available information. In this context, Decision and Planning Support Systems “DSS, PSS” are defined as a class of geo-information systems composed of data/information, models, and visualization tools, which are primary developed to support different phases of the planning and decision making processes. PSS will emphasize more on the “design phase” which leads to the development of options and plans, whereas DSS will try to focus more on the “choice phase” and rationalize the selection of options. Together they form Integrated Planning and Decision Support Systems “IPDSS” which tries to rationalize both planning and related decision-making processes by providing necessary support to

16
structure and formulate the problem systematically, develop alternative plans or policy scenarios, assess and evaluate their impacts (considering objectives of the relevant stakeholders), and select a proper policy or plan. Underlying the development of DSS, PSS and IPDSS is the assumption that planning and decision making are dynamic processes, and therefore requires the relevant support for continuous updating of data, and the generation and evaluation of plans and policies based on the updated data and assumptions. Naturally, a greater degree of access to relevant knowledge and information will lead to the development and evaluation of a more effective number of alternative scenarios, which will result in a better informed planning and public debate. Main components of the system: IPDSS, includes the following main components (Figure 3): a. A database management system: Which includes data bases designed to
accommodate and organize the basic spatial and thematic data, provide facilities for selection and manipulation of data as well as interrelating data from various sources.
b. A model base management system: Which includes quantitative and qualitative models that support resource analysis, assessment of potential and capacities of resources at different levels of management. This is the most important component of the system, which forms the foundation of model-based planning support (Sharifi, 2000). It includes three classes of models (Figure 2), which make use of the existing data, information and knowledge for identification of problem, formulation, evaluation and selection of proper solution. These models are:
Figure 3. Main components of DSS/PSS − A process/behavioral model describing the existing functional and structural
relationships among elements of the planning environment to help analyze the actual state of the system and identify the existing problems or opportunities. This will also support “resource analysis”, which clarifies the fundamental characteristics of land/resources and helps in understanding the process through which they are allocated and utilized (Sharifi, and van Keulen, 1994).
− A planning model, which integrates potential and capacity of the resources (biophysical), socio-economic information, goals, objectives, and concerns of the different stakeholders to simulate the behavior of the system. Conducting
NRM data
Socio-eco
Other data
Planner/decision maker
Dialogue management
Knowledge base management
Model base management Data base management
Other computer-based systemsExternal & internal databases

17
experiments with such a model helps to understand the behavior of the system and allows generation of alternative feasible scenarios to address the existing problems.
− An evaluation model, which allows the evaluation of impacts of various strategies/scenarios and supports selection of the most acceptable solution that improves the management and operation of the system, and is acceptable to all stakeholders.
c. A knowledge base: which provides information on data and existing processing
capacity and models which can be used to identify the problem, to generate solutions, test their feasibilities, evaluate and appraise their performances, and finally to communicate the results to the decision makers.
d. A user-friendly interface, which allows smooth and easy communication with the system, visualization and communication of the results of the analysis to the decision makers in a manageable and understandable form.
6. Application of the Framework for Planning and Decision Making to Support
Water Resource Rehabilitation in Western Mancha, Spain 6.1 Introduction To The Problem And Study Area
The Western Mancha is a sparsely populated region characterized by a high degree of aridity. The economy is mainly agrarian. Water resources are limited to the more than the groundwater in Aquifer 23 (see Fig 4). The aquifer has a surface outlet in a wetland area called “Natural Park, Las Tablas de Daimiel”. Many years ago, the low return from rainfed crops like cereals and vineyards influenced farmers to switch to irrigated crop, and to construct wells and "norias" to extract groundwater from the aquifer. Pumping has dramatically increased since 1970, and in some years the volume of extractions (discharge) was greater than the recharge of the aquifer system. The progressive lowering of the water table in the aquifer has reduced the wetland by more than 60% of its original area, and has jeopardized the supply of drinking and irrigation water. To improve the situation, a plan to reduce the rate of extraction was carried out, and limits on the use of groundwater for irrigation were imposed on the farmers. The European Community and the Spanish government have initiated a program for the rehabilitation of the natural environment in the Western Mancha region. To support this effort, an integrated Planning and Decision Support System “IPDSS” was developed to help in formulating and evaluating the impacts of different policy-instruments. This was a typical policy decision problem, which involved choices at least at two levels. At one level the policy makers were trying to decide on the policy, which could have the largest impact on the rehabilitation of the region. This was difficult due to the uncertainty about the impact of each policy, which was mainly due to the farmers’ responses to the contemplated policy. At another level, farmers had their own decision problem: how best to respond to the new policy environment, given their own objectives and constraints. In order to solve these problems, the uncertainty about the farmers’ reactions needed to be

18
reduced. This was achieved by modeling the farmers’ reactions towards various policy decisions and their impacts on the environment. Using this system, the existing policy problem was substantiated, then attractive policies were generated, appraised and evaluated for their performances. The system was presented to the Fundación Municipal para el Desarrollo Económico y el Empleo, in Alcázar de San Juan. It was well received at local level and used as a promising tool for formulation and evaluation of the policies that intend to make a sustainable use of the groundwater resources in Aquifer 23. Nowadays, a Committee of independent experts, established by Regional and State governments is proposing new studies of the system. The objective of this Committee is to develop a Plan for the Management of Water Resources and for Sustainable Development of the Upper Guadiana River. At this stage of analysis, this IPDSS may again be used as a tool for the development of new policy instruments, not only for managing water consumption but also for the identification of a sustainable strategy for water resources management.
Figure 4. Location of the study area 6.2 IPDSS Concept
Based on the framework presented in section 5 (Figures 2 & 3) for planning and decision making processes, and in order to study and assess the possible impacts of different government policies that are formulated for a gradual recuperation of the aquifer and sustainable use of its resources in La Mancha Province, an integrated planning and decision
Study Area System Aquifer 23
N
Guadiana

19
support system for policy formulation and evaluation was developed. The system includes the following main models: i. A water balance model of the groundwater basin to analyze the current situation and
understand the problem of the aquifer system. This model simulates the average yearly recharge of the aquifer system, in relation to the land use changes and considering average meteorological conditions. In developing this model, the annual average recharge of the aquifer system, spatial distribution of rainfall, evapotranspiration, land use and soil properties, and water-soil moisture budget were considered. The role of this model was to relate the use and supply of the water, in order to understand the state of the aquifer, quantification of its deterioration trend, and establishing the cause/effect relationship between the determining factors. In these processes remote sensing and GIS played a crucial role.
ii. A planning model composed of a mixed integer-programming (MIP) model. This model simulates the reaction of the farmers towards changes in the present subsidy schemes. Naturally, the reaction results in a change in land use, which in turn will have an impact on the ground water level. It assumes a rational farmer who considering his resources follows the objective that maximizes his profit. This would lead to an optimal cropping pattern in the region. This model is also used to formulate and assess the impacts of various policy instruments.
iii. A multiple criteria evaluation model to support appraisal and evaluation of different subsidy schemes (policy instruments) based on their impacts related to the identified criteria and preferences/opinion of the various stakeholders.
In the following sections each model is briefly explained, and application results are reported. 6.3 Water Balance Model
The purpose of this model is to understand the state of the aquifer and to study different components of the water balance at the model element scale under different conditions of climate, soil and vegetation, in order to estimate the aquifer’s average direct recharge. Unfortunately, estimation of direct recharge using methods like Darcian approaches, tracer techniques or direct measurement was not possible because of the lack of data and time limitations. Therefore, a simple water and soil moisture budgeting method for the direct recharge estimation was selected and applied. The water balance model is founded on the method proposed by Thornthwaite and Mather (1957). It is based on long term average monthly precipitation, potential evapotranspiration and combined soil and vegetation characteristics. Donker (1987) has reported the successfully application of this method in a semi-arid climate very close to the study area (Málaga, Spain). The Thornthwaite and Mather method models the different water balance components for one point. Using Geographic Information Systems (GIS), it has been possible to model the water balance in two dimensions, taking into account the spatial distribution of rainfall, evapotranspiration, soils and landuse. Instead of calculating the water balance for one point, it has been calculated for every element (pixel) of the entire groundwater basin.

20
Landsat Thematic-Mapper “TM” data for the year 1993 was utilized to derive land use classes, which were used to estimate the agricultural water consumption. The landuse map was made by the "Fundación Municipal Para el Empleo y el Desarrollo Económico de Alcázar de San Juan (FMPEE)", using supervised classification of Landsat satellite images of spring and summer 1993 (Figure. 5). The classification was further verified during the fieldwork. The water consumption estimate was based on the established average use for different crops. GIS was used to carry out the water balance for every element (30*30 km) in the entire basin, and to estimate the impact of land use changes on water use. The input to the model was series of meteorological measurements, consisting of monthly data of rainfall and temperature for the period 1950-1991, obtained from 10 stations within the aquifer’s area plus the existing soil maps. for rainfall, temperature, and soil data, the latter to estimate the soil water holding capacity. Potential evapotranspiration was calculated using the Thornthwaite method. The crops potential evapotranspiration was estimated as the potential evapotranspiration times the consumptive coefficient of the crops identified in the landuse map(Figure 6). For detailed information see Sharifi & Rodrigues (2002). Figure 5. Schematic presentation of the water balance model
Water use estimate
Water balance estimate
Remote sensing Climate data crop data Soil data
Water demand
Water balance results

21
Figure 6. Land use map derived from Land sat TM (1993) Results: For each month, maps of direct recharge were produced for the entire aquifer. Using the annual recharge as criteria, results were grouped in five categories from low to high. GIS visualization functions were used to identify the location of the main direct recharge spots. Results of the model showed an average annual direct recharge of around 43 *106 m3/year or 8.0 mm/year. Getachew (1994) estimated the indirect recharge of the aquifer at 40*106 m3. According to this, the total annual average recharge of the system should be around 83* 106 m3. In comparison with the total estimated discharge (around 135*106 m3/year), this quantifies the trend of decreasing ground water level and triggers a decision. 6.4 Mixed Integer Programming (MIP) Model
One approach to manage the declining groundwater level in the aquifer system was to assign a fixed amount of water to the farmers. The Confederación del Guadiana has limited farmers to extract an average of 225 mm of water per year (well above the average recharge), depending on their farm size. In fact, with efficient irrigation systems efficiency and appropriate management water was not a constraining factor for some crops. However for some other crops water was a limiting factor. In spite of the government policies the aquifer continued its decline. It meant that less water had to be allocated in future years to sustain the aquifer. Crop selection should be based on water requirements and water availability. The selection must maintain economic income while less water is used. In order to make the best use of rainfall and limited supply of irrigation water, a more efficient water management is required. From 1993, the European Community (EC) and the Spanish government were implementing four kinds of subsidies in the study area. These are: Subsidies for type of crops: One annual subsidy was given to stimulate the cultivation of specific crops either in irrigated or rainfed conditions. These subsidies were established each year and were based on the EC Common Agricultural Policy. They were given on an area basis (per ha). Farmers receiving these subsidies had to maintain fallow at least 15% of the total area of the farm. Subsidies for reduction in the use of water for irrigation: Both the Confederación del Guadiana (CHG) and the Irrigators Association established the maximum yearly amount of groundwater available for irrigation (in m3/ha). This endowment was calculated based on crop water requirements and farm size. The total water use for each farm was derived through multiplication of the area by its corresponding water requirement, as established by the CHG. An average value of consumption of water per hectare was obtained by dividing the total water used over the total number of hectares. The result was compared with pre-established figures for use of water. Subsidies were given when they were applicable.

22
Depending on the amount of water used, three types of subsidies were granted. Subsidies were given for programs of reduction in water use of 50%, 70% and 100%. Set-aside subsidy: Farmers in irrigated lands opting for set-aside subsidies received compensation. These subsidies are aimed at stimulating farmers to leave part of their land fallow. In rainfed lands this subsidy was lower. Farmers could receive simultaneously payments for water reduction and the set-aside subsidy. Subsidy for reforestation: The subsidy for reforestation included the costs of reforestation, plus a premium for maintenance. For five years farmers received an average annual payment and a compensatory premium for twenty years. Farmers could take simultaneously the subsidy for reforestation and the set-aside subsidy. It was not possible for them to take the subsidies for reforestation and a reduction in water at the same time. For non-irrigated lands subsidies for reduction in water use were not applicable. MIP model formulation: To simulate the behavior of each class of farmer (big, medium and small) holding different type of land (irrigated and non-irrigated), and seeking for the cropping pattern that maximizes their profits considering various subsidies schemes, an optimization model was developed. The optimization was based on irrigation water availability, land availability, crop rotation, production policies and existing subsidies schemes. Subsidies are offered for crop type, reduction in water use (50%,70%,100%), set-aside and reforestation. The optimum cropping pattern for each type of farm and land was the basis for the calculation of the total cropping pattern in Alcázar de San Juan district. The planning period has been assumed to be one year. However the results can be considered as an average over a span of time of five years (program of subsidies for reduction in water consumption duration). For model development, information related to the most common crops cultivated in Alcázar de San Juan district such as, yield, variable costs, fixed costs, gross margin, sale price and net income were estimated. Crop water requirements were obtained from estimations made by the CHG. Crop calendars were identified during fieldwork. For irrigated lands seventeen crop rotations were selected. In non-irrigated lands six crop rotations were considered. Selection was made according to the more common rotations in the area listed by the Ministry of Agriculture. Three farm sizes were considered as indicated in Table 1.The annual income, annual water requirements and monthly labor requirements for each rotation were calculated based on the assumption that where the rotation enters the "optimum" plan, the crops considered in that rotation would be cultivated each year in equal proportions. For example, a farm following a rotation of four years of fallow and six years of crop would have 4/10 of its area in fallow and 6/10 in crop, rather than having the whole area under fallow for four years followed by six years under crop. Table 1. Farm size distribution in irrigated “Irr” and non-irrigated “non-Irr”land in the Alcázar de San Juan (source: Ministry of Agriculture)
Num of farms Area (ha) Area % Ave. farm size (ha) Range (Ha) Irr Non-Irr Irr Non-Irr Irr Non-Irr Irr Non-Irr 0-20 590 1416 5,114 7,590 22.86 25.96 8.67 5.36 20-50 161 318 5,118 6,586 22.88 22.53 31.79 20.71 >50 85 99 12,137 15,059 54.26 51.51 142.79 152.11 total 836 1,833 22,369 29,235 100 100 26.76 15.95

23
The matrix structure of the model is shown in Table 2. When crop rotation is considered as activity (approach 1), the model results in 246 variables and 133 constraints. The number of non-zero elements in the matrix equals 1182. The matrix density is 2.97%. When crops are considered as separate activities (approach 2), the number of variables becomes 198 and the number of constraints 136. The number of non-zero elements in the matrix equals 1390; the matrix density is 4.21%. The optimization package for linear and mixed integer programming OMP (Beyers and Partners, 1993) was used for the problem solution. For solving the optimization problem, it uses the branch and bound method (Williams, 1985). Before experimentation, the model has to be calibrated and validated internally and externally. Internal validity refers to the existence of the casual relationship between variables, or absence of relationship, which implies the absence of cause. If internal validity is lacking no statement about the cause and effect can be made. The external validity refers to the possibility of applying/extrapolating the result of the experiment to the real world cases. Validation of the simulation model is the investigation of the correspondence of the model with the real life situation, in other words, if the model presents a realistic representation of reality. The correspondence test was carried out by study of the trends in various runs of the model, as well as comparison of the model results with an estimate of the actual land use map. The land use map, which was obtained from a supervised classification of the 1993 Landsat image (corresponding to the first year of the subsidies scheme), was used for the calibration and validation of the MIP model (Table 3). Table 2 Matrix structure of the MIP model. W= Water Subsidies. A= Set-aside subsidies. R = Subsidies for reforestation. MAX= maximize
Decision variables
Crops in irrigated lands
crops in rainfed lands
farm size big - medium - small
farm size big -medium - small
subsidized crops
no subsidized crops
subsidized crops
no subsidized crops
Resource constraints
Constraints W R A W R A R A R A
Water availability
Land availability
Policy constraints
Water subsidies
Crop subsidies
Subsidies for abandon
Subsidies for reforestation

24
Decision variables
Crops in irrigated lands
crops in rainfed lands
farm size big - medium - small
farm size big -medium - small
subsidized crops
no subsidized crops
subsidized crops
no subsidized crops
Resource constraints
Objective Function Net Income MAX
Table3. Comparison between results of the landuse classification (1993) and results of the two considered
approaches, for the Alcázar de San Juan district
Land cover Land use clasif. (ha)
Approach 1 (ha)
Approach 2 (ha)
Rainfed vineyard 9,729 9,729 9,729
Irrigated vineyard 2,037 2,037 2,037
Fallow 5,667 3,354 4,012
Rainfed (no vineyard) 14,098 - 15,764
Irrigated (no vineyard) 20,674 11,671 10,635
Others (Reforestation and abandon of lands)
390 19,506 9,437
TOTAL 52,595 51,595 51,595
Results: The MIP model, predicted the decline in cultivation of crops with high water needs (alfalfa, sugar beet and maize) and their replacement by crops with lower water demand. It also showed that some existing landuse patterns (vineyards) would continue to exist, because they represent a long tradition. The model also predicted a reduction in the area of irrigated land, because the farmers would set aside a part, and showed that the applied subsidy policies would stimulate the reduction in use of groundwater for irrigation. However, if the average annual recharge of the aquifer (83*106 m3) is compared to the annual discharge (135*106 m3), it can be clearly seen that, although subsidies are effective, the water table in the aquifer would continue decreasing. Logically, the water table depletion would be reduced, but sooner or later, the groundwater reserves would finish if mining of groundwater continues. However, it is still possible, for a number of more dry years , to allow the same level of agricultural production as in wetter years, through further mining of ground water. 6.5 Multicriteria Evaluation Model
Results of the previous section showed that the MIP model is rather well simulating the behavior of the farmer with respect to different subsidy schemes. The next step in simulation is experimentation with the model in order to formulate different policies and study of their impacts from different perspectives. Using the MIP model 10 scenarios that

25
were deemed to be attractive and include extreme variations of the present subsidy scheme were generated as follows: - Currently subsidies scheme implemented in the area (Scenario-1) - Policy without subsidy for crop type (Scenario -2) - Policy without subsidy for reduction in water use for irrigation (Scenario-3) - Policies without subsidy for abandon of lands (Scenario-4) - Policies without subsidy for reforestation (Scenario-5) - Policy without any kind of subsidies (Scenario-6) - 25% reduction in subsidy for sunflower and peas (Scenario-7) - 50% increase in subsidy for cereals (Scenario-8) - Scenario-7 + Scenario-8 (Scenario-9) - Water pricing policy (groundwater cost = 10 pesetas/m3), without considering subsidy
for reduction in water use for irrigation and without constraint about maximum water use (Scenario-10)
The next step in the planning process is the assessment and evaluation of different scenarios from different perspectives, considering different criteria. This is carried out through application of multicriteria evaluation model. In this process, the overall utility of alternatives was evaluated on the basis of their impacts in terms of the decision criteria and the associated values that decision makers assign to them. The latter is generally referred as weight. In this experiment, the following four criteria were considered for multicriteria evaluation: - Income generation (estimated in Pesetas) - Total employment (estimated in average man/month) - Irrigation water use (estimated in m3/year) - Government expenditures (estimated in Pesetas) A project impact matrix represents performances of each alternative scenario on each criterion. Using MIP, impacts were estimated and presented in Table 4. As it can be seen in table, values of total income were very low in case of scenarios 6 and 7. For the remaining scenarios income values were very similar and around 4,300 millions pesetas. With respect to employment all the alternatives, with exception of scenario 10, gave similar results. These values compared well to the figures obtained from the Agrarian Census 1991: 1,450 people working in the agricultural sector. Scenario 10 gave a very high level of employment because of the vast area cultivated under melon. In relation to consumption of water for irrigation, almost all the alternatives showed figures around 43 million m3/year (direct recharge of the aquifer). However scenario 10 presented a very high water consumption, which is again explained because of the big area cultivated under melon. Government expenditures varied between the scenarios. Table 4. Impact matrix of all the analysed scenarios for the Alcázar de San Juan district

26
As it can be seen from the Table 4, each criterion is measured/assessed with different units. The first step in the Multicriteria evaluation is to convert all measurements to one unit, which is the utility of different criteria as perceived by the analyst or decision maker’s “value judgment”. The result is, “Partial evaluation/ attractiveness” of the scenarios based on each criterion. As a result of this process, the performances of all scenarios on each criterion are represented in utility values (between 0 and 1), which are comparable. To achieve the overall attractiveness of each scenario, all the partial attractiveness should be somehow aggregated using an aggregation rule. In decision models based on utility theory, weights are used for aggregating partial attractiveness.In this study the linear utility function was assumed for all criteria. Since different stakeholder/decision-makers assigns different value to different criteria, this priority has to be identified and considered in the aggregation process. In this study, three classes of stakeholders mainly, farmers, environmentalists and government were considered. Considering the problems of weight determination as described by Lahdelma et al. (2000), the weights or level of importance related to each criterion were estimated through inquiries carried-out with the main interest groups. In total 13 inquiries were conducted: 8 to farmers, 1 to environmentalist and 4 to government politicians. The inquiry were made using two methods: − Direct rating, in which the decision maker is asked to divide 100 points between all
considered criteria based on their importance, − Qualitative pairwise comparisons of criteria using Satty scale “Equally important (1);
Moderately more important (3); Strongly more important(5); Very strongly more important(7); absolutely more important (9); and (2,4,6,8) can be used for intermediate values” (Satty, 1980).
From the analysis of inquiries three weight sets were generated and used. For the aggregation of the partial attractiveness into the overall attractiveness two different aggregation rules: the weighted summation and an out-ranking methods “ELECTRE-2” (Roy, 1973) were chosen and applied. They were selected based on the type of available information, as well as their transparencies and applicability in this type of analysis. The
Criteria
SCEN 1
SCEN 2
SCEN 3
SCEN 4
SCEN 5
SCEN 6
SCEN 7
SCEN 8
SCEN 9
SCEN 10
TOTAL INCOME ALCAZAR (millions pesetas)
4,658
4,394
4,135
4,607
4,642
2,900
2,576
4,748
4,696
4,807
EMPLOYMENT (avg. men/month)
1,318
1,271
1,465
1,063
1,320
1,463
1,348
1,201
1,493
3,029
TOTAL WATER FOR IRRIGATION (m3*1000/year)
43,282
40,218
42,279
43,282
43,282
42,279
43,282
38,505
49,061
105,580
GOVERNMENT EXPENDITURES (millions pesetas)
2,444
2,521
1,739
2,731
2,403
0
569
2,737
2,436
700

27
software used for this application was the DEFINITE program (Janssen and van Herwijnen, 1992, 2000). Results of the multicriteria analysis for the two methods are shown in Figures 7-a and 7-b. Results were quite sensitive to the set of weights. When set W1 was selected, the weighted summation results indicated the scenario 10 as the best alternative. This could be expected, as this scenario removes limitation on use of water and therefore produces high income and employment at very little cost to the government. However, using the ELECTRE-2 method, the same conclusions were not derived; given the thresholds for concordances and discordances no distinction could be made between scenario 10 and the others. When other sets of weights were used the scenario 10 was poorly ranked, this is due to the very high use of water, which is considered as the source of existing problems in the region (highest weight). Results of the weighted summation method using weight sets W2 and W3, indicated scenario 8 as the best. Scenarios 5, 1, 2, 3, 4, and 9, were ranked almost the same at the next level, and scenarios 6, 7 and 10 as the worst, and therefore could be discarded from further analysis. For the ELECTRE-2 method again scenario 8 ranked as the best. From the evaluation results it was not directly clear which scenario could be classified as the next best (considering the selected thresholds). However, it was evident that scenarios 4 and 7 were always outranked by other alternatives. Although scenario 10 could not be ranked it was dominated by almost all other alternatives.
00.10.20.30.40.50.60.70.80.9
1
1 2 3 4 5 6 7 8 9 10
Scenario Number
Scor
es
Set of Weights W1 Set of Weights W2 Set of Weights W3
Figure 7-a. Results of weighted summation

28
0
2
4
6
81 2 3 4 5 6 7 8 9 10
Scenario number
Ran
k or
der
Weight-set1 Weight-set2 Weight-set3
Figure 7-b. Results of ELECTRE-2 Method Looking at the Figures 7-a, 7- b, and Table 4, it can be concluded that, based on the selected criteria, Scenario- 8, which is a policy to increase the cereals subsidies, appears to be the best, as it uses the least amount of water and produces high income, good employment, at the high cost of government expenditure. Although scenario-9, produces high employment and income with less government expenditures, since its water use is the second highest, it is not recommended as the next option. Scenorio-6 create the second highest employment at no government costs; however, since its income is low and its water use is relatively high it is also not selected as the next policy option. Results: The multicriteria analysis indicated that a policy considering increases of 50% in subsidies for cereals would be better than the subsidy scheme implemented in the area in 1993, any other subsidy schemes. However this strategy would not lead to a recovery in the aquifer's water table. Reduction in water use for irrigation is most effective through a policy of maximum groundwater endowment established by the government, and not through subsidies set to discourage the use of groundwater. In order to re-establish the natural equilibrium discharge-recharge in the aquifer system, strong restrictions on the use of groundwater for irrigation have to be implemented. The cropping pattern in the area would change dramatically as a consequence of policies diminishing subsidies for sunflower, peas or set-aside. An adequate and planned policy for subsidies for crops has to be implemented and continued. 7. Summary and Conclusions
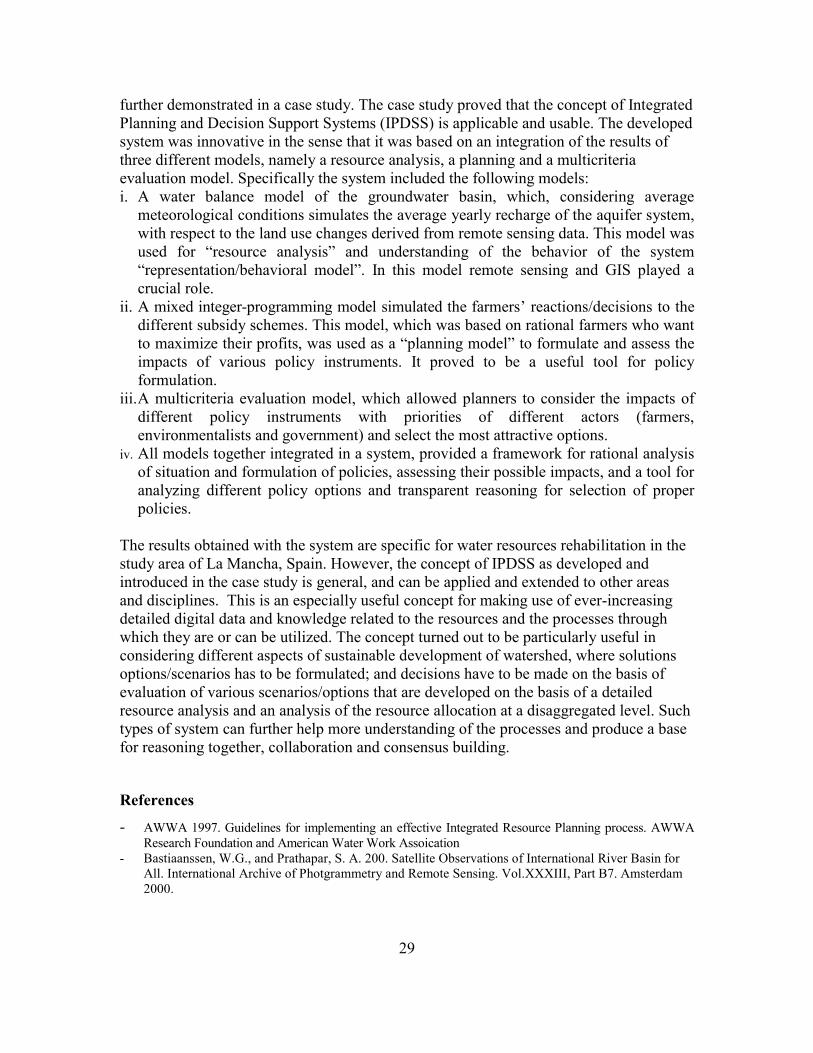
The importance of watershed as a management unit, and current state of major factors affecting the watershed development was briefly discussed. Despite the rapid development in remote sensing GIS and information/communication, there still a missing link between all these development and proper management of resources. It was further discussed that the link could be established through integration of all the relevant knowledge, experiences, technologies and information in to a so-called “Integrated Planning and Decision Support System”. The framework for development of such a system was further introduced. The framework is particularly useful to support logical, rational and transparent decision-making process. Application of the framework was
29
further demonstrated in a case study. The case study proved that the concept of Integrated Planning and Decision Support Systems (IPDSS) is applicable and usable. The developed system was innovative in the sense that it was based on an integration of the results of three different models, namely a resource analysis, a planning and a multicriteria evaluation model. Specifically the system included the following models: i. A water balance model of the groundwater basin, which, considering average
meteorological conditions simulates the average yearly recharge of the aquifer system, with respect to the land use changes derived from remote sensing data. This model was used for “resource analysis” and understanding of the behavior of the system “representation/behavioral model”. In this model remote sensing and GIS played a crucial role.
ii. A mixed integer-programming model simulated the farmers’ reactions/decisions to the different subsidy schemes. This model, which was based on rational farmers who want to maximize their profits, was used as a “planning model” to formulate and assess the impacts of various policy instruments. It proved to be a useful tool for policy formulation.
iii. A multicriteria evaluation model, which allowed planners to consider the impacts of different policy instruments with priorities of different actors (farmers, environmentalists and government) and select the most attractive options.
iv. All models together integrated in a system, provided a framework for rational analysis of situation and formulation of policies, assessing their possible impacts, and a tool for analyzing different policy options and transparent reasoning for selection of proper policies.
The results obtained with the system are specific for water resources rehabilitation in the study area of La Mancha, Spain. However, the concept of IPDSS as developed and introduced in the case study is general, and can be applied and extended to other areas and disciplines. This is an especially useful concept for making use of ever-increasing detailed digital data and knowledge related to the resources and the processes through which they are or can be utilized. The concept turned out to be particularly useful in considering different aspects of sustainable development of watershed, where solutions options/scenarios has to be formulated; and decisions have to be made on the basis of evaluation of various scenarios/options that are developed on the basis of a detailed resource analysis and an analysis of the resource allocation at a disaggregated level. Such types of system can further help more understanding of the processes and produce a base for reasoning together, collaboration and consensus building.
References
- AWWA 1997. Guidelines for implementing an effective Integrated Resource Planning process. AWWA Research Foundation and American Water Work Assoication
- Bastiaanssen, W.G., and Prathapar, S. A. 200. Satellite Observations of International River Basin for All. International Archive of Photgrammetry and Remote Sensing. Vol.XXXIII, Part B7. Amsterdam 2000.

30
- Bastiaanssen, W.G.M. and S. Ali, 2001. A new crop yield forecasting model based on satellite measurements applied across the Indus Basin, Pakistan, J. of Agriculture, Ecosystems and Environment (accepted)
- Bastiaanssen, W. G., Mobin-ud-Din, A. and Zubair, T. 2002. Upscaling water productivity in irrigated agriculture using remote sensing and GIS technologies
- Barbier, E.B. 1987. The concept of economic development. Environmental Conservation, 14(2):101-110. - Brundtland, G.H., 1987. Our common future. The World Commission on
Environment and Development. Oxford University Press, Oxford, 383 pp. - Beyers and Partners NV 1993 OMP Manual, 2930 Brasschaat, Belgium
- Conyers, D., Hill, P. 1989 An Introduction to Development Planning in the Third World. John Willey & Sons, New York
- Donker N. 1987 WTRBLN a Computer Program to Calculate Water Balance. Computer and Geosciences. 13(2), 95-122.
- EPA 1996. Watershed approach framework, EPA800-F-96-001. - Geertman S. 2002. Participatory planning and GIS: A PSS to bridge the gap. Environmental and Planning
Vol 29, Pages 21-35 - Eastman R, Kyem, A. Toledano and Jin Weigen 1993. GIS and Decision Making, Exploration in
Geographic Information Technology. Volume 4, United Nations Institute for Training and Research - Fedra, K. (1993). ‘GIS and environmental modelling’, in: Goodchild, M.F., Park B.O. and Steyaert,
L.T. (eds), Environmental modelling with GIS, Oxford University Press, New York. - Fox, Jefferson Metz 1991. ‘Spatial information for resources management in Asia: a
review of institutional issues’, Int. Journal of Geographical Information Systems, 5, 59-72.
- Getachew, H. 1994 Hydrogeological study of an over exploited aquifer system using mathematical ground water flow simulation model. A case study in the La Mancha Occidental ground water basin. La Mancha, Spain. Msc Thesis, ITC, Enschede, The Netherlands
- Hallding K. 2001. Sustaining Beijing’s Water Supply: A scenario approach to Integrated water Basin Management, SEI, Water program.
- Hawaii 2001. Proceedings of the Soil Erosion Research for the 21st Century, Honolulu, Hawaii; 3-5 January, 2001.
- http://asterweb.jpl.nasa.gov/products/data_products.htm - http://eospso.gsfc.nasa.gov/eos_homepage/rparchive/index.html - http://eospso.gsfc.nasa.gov/eos_homepage/eharchive/02/aug/lcc.html - http://eospso.gsfc.nasa.gov/eos_homepage/eharchive/02/may/online_tool.html - http:/www.waterwach.nl - http://daac.gsfc.nasa.gov/CAMPAIGN_DOCS/hydrology/hd_main.shtml - Janssen, R., van Herwijnen, M. 1992 DEFINITE A system to support decisions on a finite set of
alternatives. Kluwer Academic Publishers, Dordrecht - Janssen, R., van Herwijnen, M., & Binat, E. 2000 Decision support system for a finite set of alternatives
(DEFINITE), Manual Institute for Environmental Studies, Free University of Amsterdam - Lahdelma, R., Salminen, P., & Hokkanen, J. 2000 Using Multicriteria Methods in Environmental
Planning and Management. Environmental Management, Vol. 26, No. 6, pp.595-605. - Pearce, D.W. and R.K. Turner 1990. Economics of Natural Resources and Environment, Harvester
Wheatsheaf, New York - Roy, B. 1973 How outranking relation helps multiple criteria decision-making. In: Cochrane, Zeleny J,
Zeleny M (eds). Multiple criteria decision-making. University South Carolina Press, Columbia - Satty, T. 1980 The Analytical Hierarchy Process, New York N.Y. McGraw Hill - Sharifi, MA.., & van Keulen, H. 1994 A decision support system for land use planning at farm level.
Agricultural Systems 45: 239-257 - Sharifi, MA. 1999 Remote Sensing and Decision Support Systems. Chapter-14 in “Spatial statistics for
Remote Sensing” edited by Stien A, van der Meer F, Kluwer Academic Publisher

31
- Sharifi, MA. 2000 Planning Support Systems to Enhance Sustainable Land Utilization. Resource Paper presented at the Seminar on Impact of Land Utilization Systems on Agricultural Productivity, Asian Productivity Organization & The Iranian Ministry of Agriculture, 4-10 November 2000, Tehran, Islamic Republic of Iran
- Sharifi, M.A. & Rodriges E., 2002. Design and Development of a Planning Support System for Policy Formulation in Water Resources Rehabilitation:The Case of Alcázar De San Juan District in the Aquifer 23, La Mancha, Spain, Internationa Journal of Hydroinformatics
- Ruitenbeek, J., and Cartier, C. 1998. Rational Exploitation: Economic Criteria & Indicators for Sustainable Management of Tropical Forests. CIFOR Occasional Paper No 17.
- Ruitenbeek, J., and Cartier, C. 2001. The invisible Wand: Adaptive Co-Management as an Emergent Strategy in Complex Bio-economic Systems. CIFOR Occasional Paper No 34.
- Simon, HA. 1960 The New Science of Management Decision. Harper and Brothers, New York - Steinitz, C. 1993 Geographical information systems: a personal historical perspective, the framework
for recent project, and some questions for the future, Genoa, Italy - Steer, A. and W. Wade-Gery, 1993. Sustainable development: Theory and practice for a sustainable
future. In Sustainable development, 1(3 , 23-35 - Thornthwaite, C., & Mather, J. 1957 Instructions and tables for computing potential evaporation and the
water balance. Publ. Climatology Lab., Centeron, New Jersey, v. 10 No. 3. 244 p - Thorbecke, E. & L. Hall, 1982. Nature and scope of agricultural sector analysis: An overview. In: Ed.
E. Thorbecke, Agricultural sector analysis and models in developing countries. FAO Economic and Social Development Paper No. 5, FAO, Rome
- Turban, E. 1995 Decision Support and Expert Systems: Management Support Systems. Macmillan Publishing Company, New York
- UNCED, 1992. Agenda 21.1. Adoption of agreement on environment and development. UNCED, Rio, de Janeiro
- Williams, H. 1985 Model building in mathematical programming. John Wiley & Sons .

32
Appendix-1 Assessment of irrigation performance using NOAA satellite imagery
P. Droogers, W.G.M. Bastiaanssen, A. Gieske, N. Toomanian, M. Akbari IMI 2001,
Summary
Increasing pressure on water resources requires a sound knowledge of where, when and how much water is used. Agriculture, and especially irrigated agriculture, is the main global water consumer and, consequently, a more productive use in this sector will have a large impact. Moreover, it is estimated that by 2025 cereal production will have to increase by 38% to meet world food demands (Seckler et al., 1999), putting even more stress on the scarce water resources. Traditionally, performance of irrigated agriculture has been expressed in terms of efficiencies based on observed flows in different points in the water distribution system, such as reservoir releases, main, secondary and tertiary canal, field, and plant. The ratio of the flow at a lower level to the flow at a higher level defines the efficiency of that particular part of the system. For example, the ratio of total water received at the field by farmers over the releases of a reservoir is defined as the system efficiency. Similar, the ratio of total evapotranspiration on a particular field over water delivered to that field is defined as the application efficiency. The main objective of irrigation engineering has always been to increase these efficiencies. A serious drawback of this approach is that water considered as a loss, indicated by a low efficiency, is not a real loss but is often used somewhere else. This “lost” water is likely to be used by downstream users, or percolating to the groundwater, or used for “illegal” irrigation activities. In other words, increasing efficiencies requires additional water deliveries to the previous users of this “lost” water. To overcome these problems with efficiencies, Molden and Sakthivadivel (1999) described a conceptual framework for water accounting, based on inflows and outflows. The framework includes the assessment of system performance in terms of the Productivity of Water (PW), defined as the amount of water used to produce 1 kg of crop. Different PWs were identified, based on different definitions of water used. Here we apply only PWprocess
depletion, which refers to the amount of water evaporated to produce 1 kg of crop. A practical example of the use of other PWs can be found elsewhere (Droogers and Kite, 1999). Recently, new technologies based on RS have been introduced to monitor several components of the water balance. Main advantage of this approach is that large areas are covered, and that data is easily obtainable without extensive monitoring networks in the field. The SEBAL algorithm (Bastiaanssen, 1998) estimates the energy balance based on RS images resulting in actual evapotranspiration. The algorithm includes additional features to estimate crop production and soil moisture contents. For the four main irrigation systems in the Zayandeh Rud basin, Iran, the SEBAL algorithm was applied, using NOAA images, and results were used to assess the performance of these systems. Performance of four irrigation systems in the Zayandeh Rud, Iran, was assessed for the
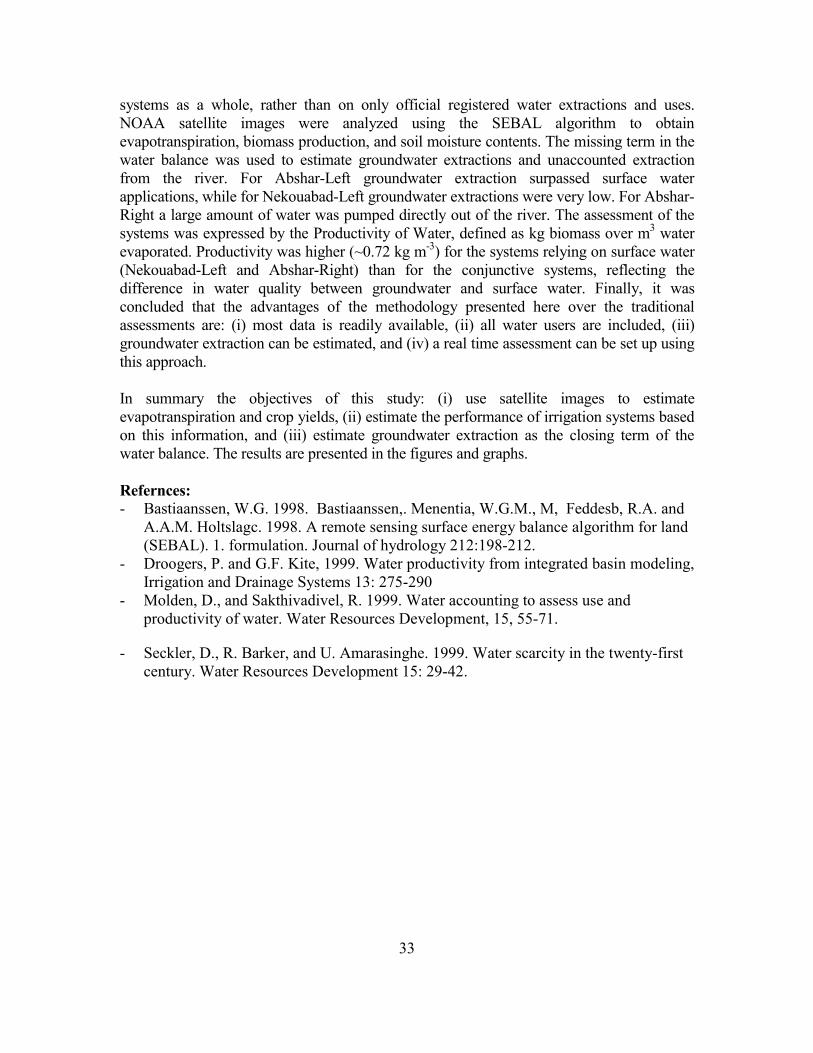
33
systems as a whole, rather than on only official registered water extractions and uses. NOAA satellite images were analyzed using the SEBAL algorithm to obtain evapotranspiration, biomass production, and soil moisture contents. The missing term in the water balance was used to estimate groundwater extractions and unaccounted extraction from the river. For Abshar-Left groundwater extraction surpassed surface water applications, while for Nekouabad-Left groundwater extractions were very low. For Abshar-Right a large amount of water was pumped directly out of the river. The assessment of the systems was expressed by the Productivity of Water, defined as kg biomass over m3 water evaporated. Productivity was higher (~0.72 kg m-3) for the systems relying on surface water (Nekouabad-Left and Abshar-Right) than for the conjunctive systems, reflecting the difference in water quality between groundwater and surface water. Finally, it was concluded that the advantages of the methodology presented here over the traditional assessments are: (i) most data is readily available, (ii) all water users are included, (iii) groundwater extraction can be estimated, and (iv) a real time assessment can be set up using this approach. In summary the objectives of this study: (i) use satellite images to estimate evapotranspiration and crop yields, (ii) estimate the performance of irrigation systems based on this information, and (iii) estimate groundwater extraction as the closing term of the water balance. The results are presented in the figures and graphs. Refernces: - Bastiaanssen, W.G. 1998. Bastiaanssen,. Menentia, W.G.M., M, Feddesb, R.A. and
A.A.M. Holtslagc. 1998. A remote sensing surface energy balance algorithm for land (SEBAL). 1. formulation. Journal of hydrology 212:198-212.
- Droogers, P. and G.F. Kite, 1999. Water productivity from integrated basin modeling, Irrigation and Drainage Systems 13: 275-290
- Molden, D., and Sakthivadivel, R. 1999. Water accounting to assess use and productivity of water. Water Resources Development, 15, 55-71.
- Seckler, D., R. Barker, and U. Amarasinghe. 1999. Water scarcity in the twenty-first century. Water Resources Development 15: 29-42.
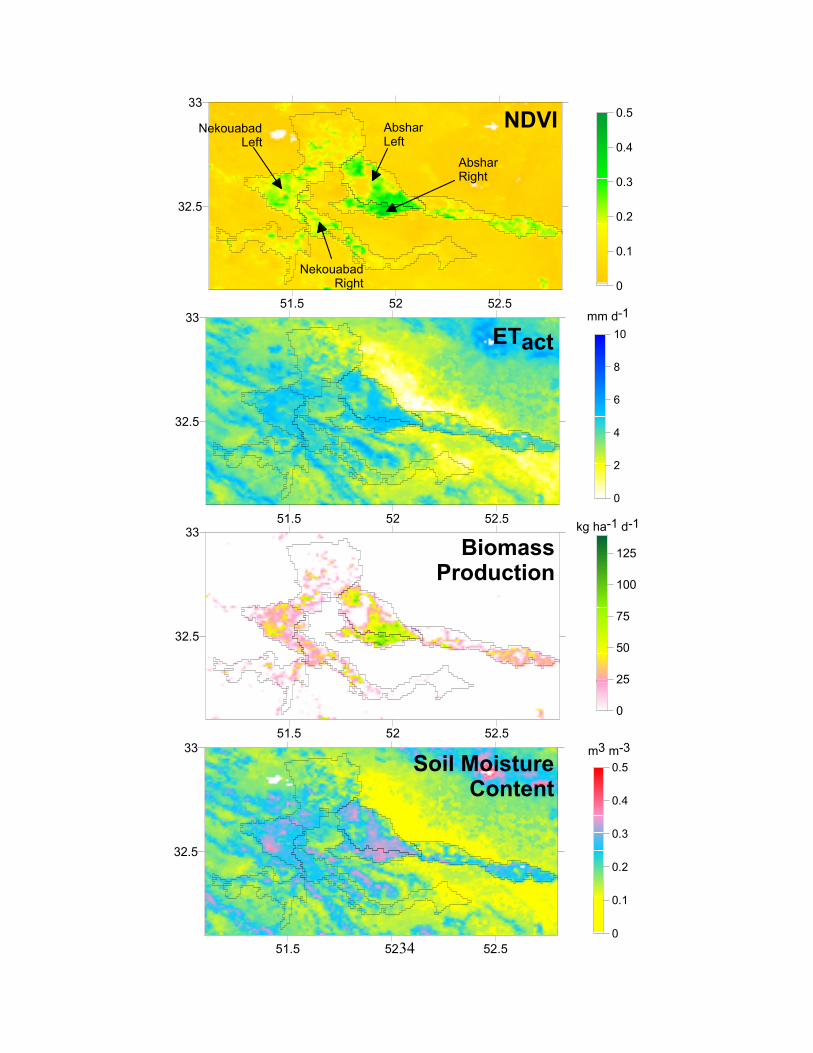
34
51.5 52 52.5
32.5
33
51.5 52 52.5
32.5
33
51.5 52 52.5
32.5
33
0
0.1
0.2
0.3
0.4
0.5
0
25
50
75
100
125
NekouabadLeft
NekouabadRight
AbsharLeft
AbsharRight
NDVI
ETact
BiomassProduction
mm d-1
kg ha-1 d-1
0
2
4
6
8
10
51.5 52 52.5
32.5
33
0
0.1
0.2
0.3
0.4
0.5m3 m-3
Soil MoistureContent
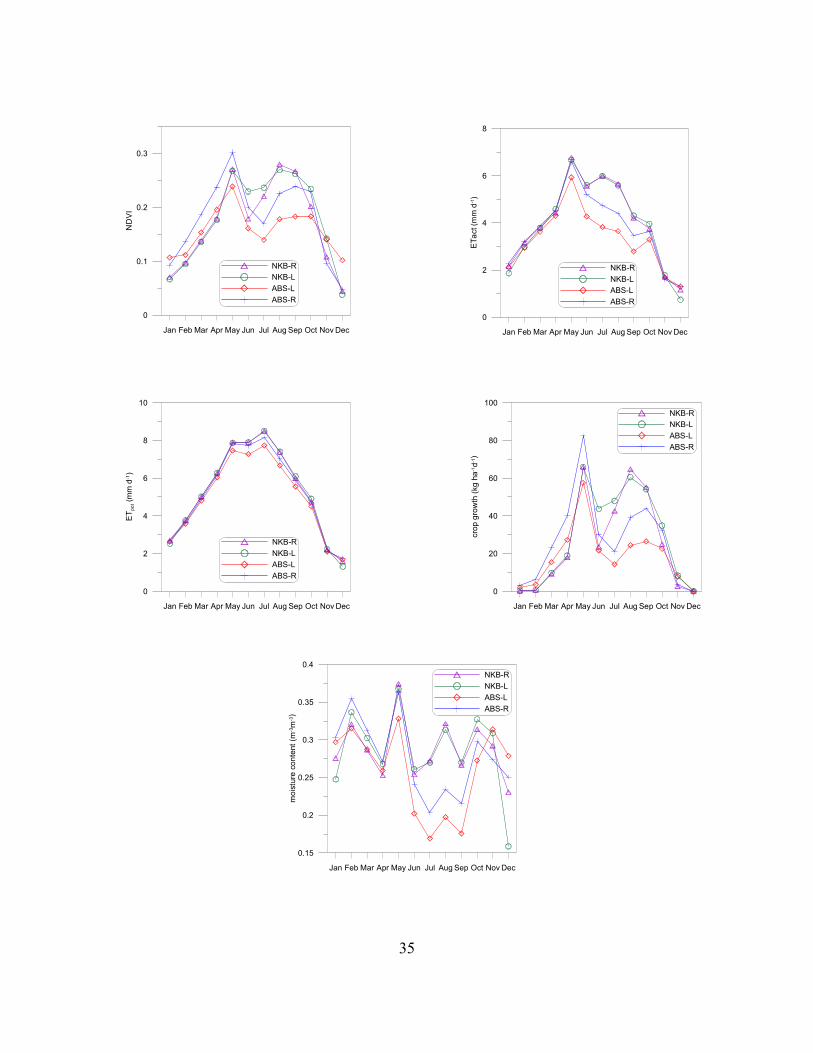
35
Jan Feb Mar Apr May Jun Jul Aug Sep Oct Nov Dec
0.15
0.2
0.25
0.3
0.35
0.4
moi
stur
e co
nten
t (m
-3m
-3)
NKB-RNKB-LABS-LABS-R
Jan Feb Mar Apr May Jun Jul Aug Sep Oct Nov Dec
0
2
4
6
8
10
ETpo
t (m
m d
-1)
NKB-RNKB-LABS-LABS-R
Jan Feb Mar Apr May Jun Jul Aug Sep Oct Nov Dec
0
0.1
0.2
0.3
ND
VI
NKB-RNKB-LABS-LABS-R
Jan Feb Mar Apr May Jun Jul Aug Sep Oct Nov Dec
0
2
4
6
8
ETac
t (m
m d
-1)
NKB-RNKB-LABS-LABS-R
Jan Feb Mar Apr May Jun Jul Aug Sep Oct Nov Dec
0
20
40
60
80
100
crop
gro
wth
(kg
ha-1d-1
)
NKB-RNKB-LABS-LABS-R


