1 I Godrej Agrovet TREND AND CHALLENGES IN INDIAN POULTRY INDUSTRY 19 th June, 2015.
24
1 I Godrej Agrovet TREND AND CHALLENGES IN INDIAN POULTRY INDUSTRY 19 th June, 2015
-
Upload
silas-spencer -
Category
Documents
-
view
220 -
download
2
Transcript of 1 I Godrej Agrovet TREND AND CHALLENGES IN INDIAN POULTRY INDUSTRY 19 th June, 2015.

1 I Godrej Agrovet
TREND AND CHALLENGES ININDIAN POULTRY INDUSTRY
19th June, 2015

ANIMAL AGRICULTURE AT A GLANCE

3 I Godrej Agrovet
ANIMAL AGRICULTURE HOLDS TREMENDOUS PROMISE FOR THE FUTURE…
2004-05 2012-13 2019-20 -
200,000
400,000
600,000
800,000
1,000,000
1,200,000
638,530
870,896
1,142,625
180,034 261,771
363,218
Agriculture: Value Output Animal Agriculture: Value Output
Agriculture vs Animal Agriculture Value Output (INR ‘000 Crores)
Animal Agriculture Value Output as a % of Agriculture Value
Output
28% 30% 32%
Historically, Animal Agriculture has grown at a faster rate than Overall Agriculture. This trend is expected to continue resulting in faster
growth of Animal Agriculture
CAGR: 4.0%
CAGR: 4.8%
If Animal Agriculture
continues to grow at historical rates,
its size in 2020 would be
~363,000 crores (USD 60 bn)
Source: National Account StatisticsFigures at 2004-05 constant pricesUSD/INR assumed at 61

4 I Godrej Agrovet
Source: Ministry of Agriculture, CSO, GAVL analysisFigures at 2004-05 constant prices
AND …LIVESTOCK WILL ACCOUNT FOR 50% OF THE TOTAL AGRICULTURE OUTPUT BY 2030
72%
28%
FY 2007
71%
29%
FY 2011
Crops Livestock
50%
50%
FY 2030
GVO at constant prices in Rs. ‘ 000 crore

5 I Godrej Agrovet
ANIMAL AGRICULTURE COULD BE A GAME CHANGER FOR INDIAN FARMERS
Particulars (per Ha) Rice Wheat Sugarcane
Total Profit / Ha / Year (INR) 60 to 70 K 70 – 80 K 1.0 – 1.2 Lakh
Profit per Ha per year through Agricultural Crops
Profit per Ha / Year In INR Requirement for a profit of 1 Lakh / Year
Cattle Farming (10) 1.5 – 2.0 Lakh 6 cows
Broiler Farming (10,000) 2.5 – 3.0 Lakh 3,650 broilers
Layer Farming (10,000) 3.0 – 3.5 Lakh 3,100 layers
Shrimps Farming (acre) 5.0 – 6.0 Lakh 0.2 acres of land
Profit per year through Animal Farming
Note: In animal farming, there are other source of income like cow dung, broiler/layer litter etc.
Income of farmers varies depending upon milk, broiler, egg and shrimp prices in the market
Indian farmer can make significantly more money in animal agriculture compared to agriculture. Moreover, even non-agricultural land can be used for animal farming
making full utilization of land resources
6 I Godrej Agrovet
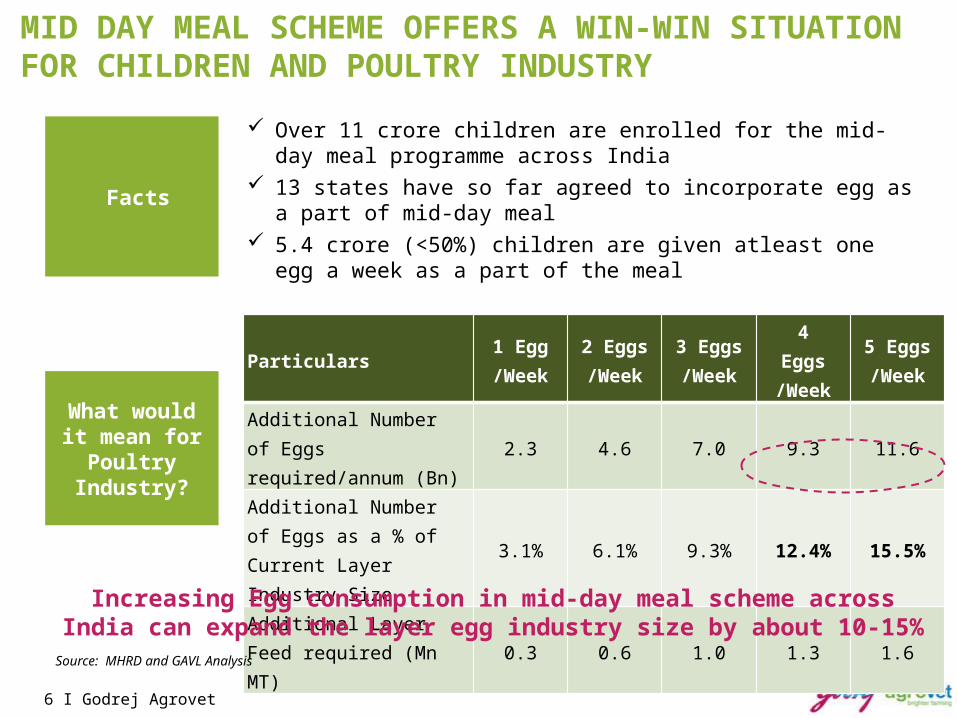
MID DAY MEAL SCHEME OFFERS A WIN-WIN SITUATION FOR CHILDREN AND POULTRY INDUSTRY
Facts
Over 11 crore children are enrolled for the mid-day meal programme across India
13 states have so far agreed to incorporate egg as a part of mid-day meal
5.4 crore (<50%) children are given atleast one egg a week as a part of the meal
What would it mean for Poultry
Industry?
Particulars1 Egg/Week
2 Eggs/Week
3 Eggs/Week
4 Eggs /Week
5 Eggs/Week
Additional Number of Eggs required/annum (Bn)
2.3 4.6 7.0 9.3 11.6
Additional Number of Eggs as a % of Current Layer Industry Size
3.1% 6.1% 9.3% 12.4% 15.5%
Additional Layer Feed required (Mn MT)
0.3 0.6 1.0 1.3 1.6
Increasing Egg consumption in mid-day meal scheme across India can expand the layer egg industry size by about 10-15%
Source: MHRD and GAVL Analysis
7 I Godrej Agrovet
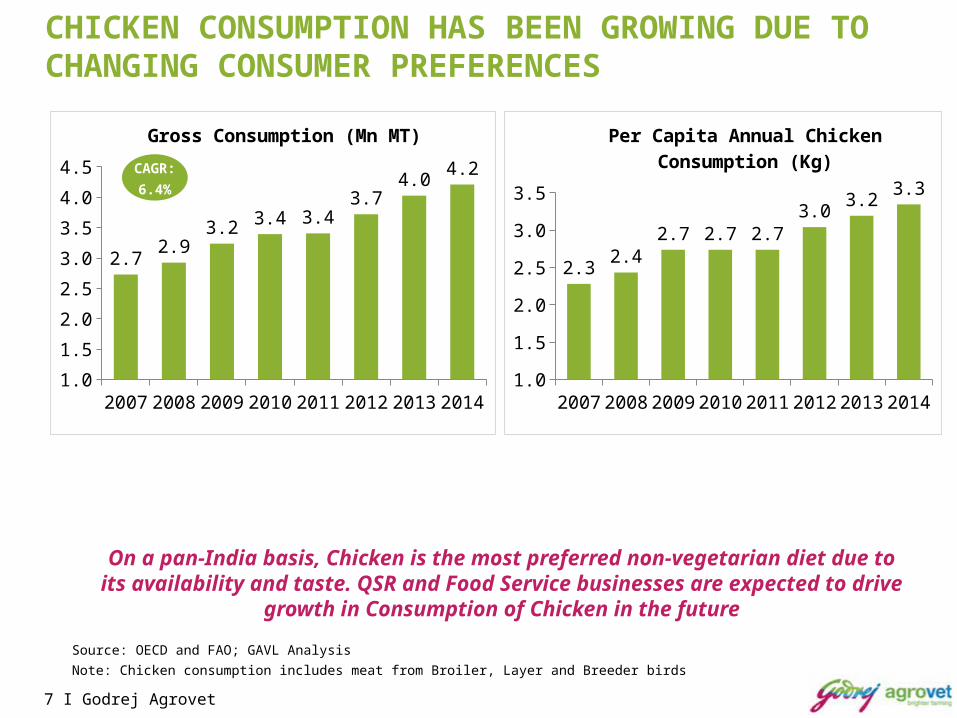
CHICKEN CONSUMPTION HAS BEEN GROWING DUE TO CHANGING CONSUMER PREFERENCES
2007 2008 2009 2010 2011 2012 2013 20141.0
1.5
2.0
2.5
3.0
3.5
4.0
4.5
2.72.9
3.2 3.4 3.43.7
4.04.2
Gross Consumption (Mn MT)
2007 2008 2009 2010 2011 2012 2013 20141.0
1.5
2.0
2.5
3.0
3.5
2.32.4
2.7 2.7 2.73.0
3.23.3
Per Capita Annual Chicken Consumption (Kg)
On a pan-India basis, Chicken is the most preferred non-vegetarian diet due to its availability and taste. QSR and Food Service businesses are expected to
drive growth in Consumption of Chicken in the future
CAGR:
6.4%
Source: OECD and FAO; GAVL Analysis
Note: Chicken consumption includes meat from Broiler, Layer and Breeder birds

8 I Godrej Agrovet
GROWTH IN POULTRY INDUSTRY WILL BE DRIVEN BY INCREASE IN PERCAPITA CONSUMPTION
Source: MEPDA,, News Articles, GAVL AnalysisNote: For Broiler and Layer, grown in India’s population will also drive the growth in aggregate consumption
Layer Egg Industry
75 Billion Eggs in 2014
Poultry Meat Industry
4.2 Mn MT in 2014
2013-14 2019-20
55
76
Layer: Percapita Annual Consumption of Eggs
CAGR: 5.5%
2013-14 2019-20
2.9
4.5
Broiler: Percapita Annual Consumption (Kg)
CAGR: 8.0%

9 I Godrej Agrovet
FUTURE OF POULTRY INDUSTRY LOOKS SECURE ASGROWTH WILL BE DRIVEN BY RISE IN PERCAPITA INCOMES
Per Capita Poultry Meat Consumption one of the Lowest
Brazil USA Japan Thailand China Vietnam India1
11
21
31
41
51 47.044.0
13.5 13.010.0 7.5
3.0
KG/Annum
Per Capita Poultry Meat Consumption vs.
Per Capita GDP
Low per capita in India is holding back poultry meat consumption
Significantly high consumption in developed countries
Source: Rabo Bank; figures as of 2012

KEY CHALLENGES

11 I Godrej Agrovet
VOLATILITY IN BROILER PRICES IS HERE TO STAY
Oct
-11
Dec-1
1
Feb-1
2
Apr-1
2
Jun-
12
Aug-1
2
Oct
-12
Dec-1
2
Feb-1
3
Apr-1
3
Jun-
13
Aug-1
3
Oct
-13
Dec-1
3
Feb-1
4
Apr-1
4
Jun-
14
Aug-1
4
Oct
-14
Dec-1
4
Feb-1
5
Apr-1
50
10
20
30
40
50
60
70
80
90
5757
Live Prices (INR) for West Region
Live Price
Live Prices have been highly volatile and remained almost flat on yearly basisVolatility in prices results in Yo-Yo profits for integrators
Source: poultrybazaar.net
1

12 I Godrej Agrovet
INCREASING FEED COSTS PUTTING PRESSURE ON FARMERS
20%
Oct
-11
Dec-1
1
Feb-1
2
Apr-1
2
Jun-
12
Aug-1
2
Oct
-12
Dec-1
2
Feb-1
3
Apr-1
3
Jun-
13
Aug-1
3
Oct
-13
Dec-1
3
Feb-1
4
Apr-1
4
Jun-
14
Aug-1
4
Oct
-14
Dec-1
4
Feb-1
5
Apr-1
50
5
10
15
20
25
30
35
40
45
50
11
14
17
38
Trend in Raw Material Prices (INR) for West Region
Maize Price/MT Soya Price / MT
Trend 124%
Source: agriwatch.com, poultrybazaar.net
2
13 I Godrej Agrovet
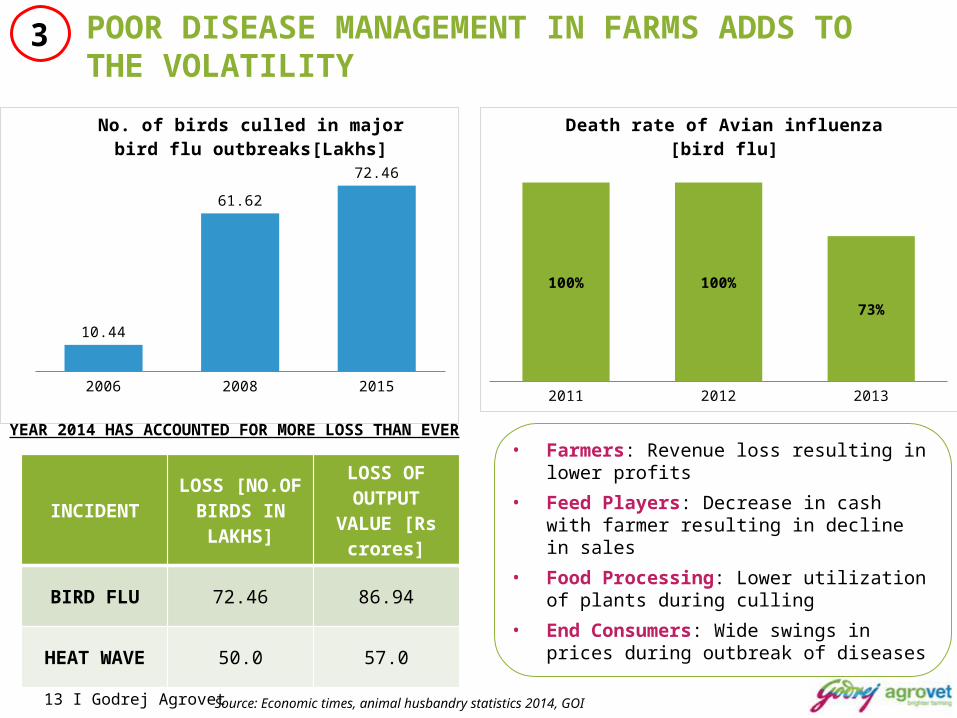
POOR DISEASE MANAGEMENT IN FARMS ADDS TO THE VOLATILITY
• Farmers: Revenue loss resulting in lower profits
• Feed Players: Decrease in cash with farmer resulting in decline in sales
• Food Processing: Lower utilization of plants during culling
• End Consumers: Wide swings in prices during outbreak of diseases
2006 2008 2015
10.44
61.62
72.46
No. of birds culled in major bird flu outbreaks[Lakhs]
2011 2012 2013
100% 100%
73%
Death rate of Avian influenza [bird flu]
INCIDENTLOSS [NO.OF
BIRDS IN LAKHS]
LOSS OF OUTPUT VALUE
[Rs crores]
BIRD FLU 72.46 86.94
HEAT WAVE 50.0 57.0
YEAR 2014 HAS ACCOUNTED FOR MORE LOSS THAN EVER
Source: Economic times, animal husbandry statistics 2014, GOI
3

14 I Godrej Agrovet
OUR ABILITY TO LOBBY AS A GROUP LIMITED
Chicken leg price (Rs/kg)
0 20 40 60 80 100 120 140 160 180
45
170
Chicken Legs Avg Price comparison (Rs/kg)
India USA
• WTO has ruled in favour of USA forcing India to allow imports of chicken legs from USA
• Currently, fresh chicken in retail was selling for Rs 180 a kg and chicken legs for Rs 240 a kg.
• On the other hand, chicken drumsticks from US come in at around Rs 50-60 a kg.
COUNTRY REASON FOR BAN
China Avian Flu
European UnionChlorine treatment of chicken
South Africa Chicken fed with GM feed
OTHER COUNTRIES THAT RESTRICT USA CHICKEN IMPORTS
Source: Economic times, various news articles
4
India has challenged the verdict, Are we doing enough as a
group

15 I Godrej Agrovet
WE ARE NOT THE PREFERRED EMPLOYERS FOR THE TALENT OF THE COUNTRY
Best Companies to Work For, India 2013
Hardly any Organization features in the “ Best Employer” Surveys
Godrej Agrovet Godrej Agrovet No poultry business companies
Critical to manage talent in the business
Attracting Talent Retaining Talent Nurturing Talent
5

FUTURE TRENDS

17 I Godrej Agrovet
INCREASE IN INTEGRATION AUGURS WELL FOR THE FUTURE OF POULTRY INDUSTRY ONLY IF BACKED BY VALUE ADDITION
60%
40%
FY 2011
68%
32%
FY 2013
75%
25%
FY 2015
Integration
Open Market
Source: Extent of integration in Poultry Industry; GAVL Analysis

18 I Godrej Agrovet
PICK UP IN GROWTH OF QSR AND FOOD SERVICES INDUSTRIES WOULD IMPROVE PROCESSING LEVELS
Dairy Meat Marine Chicken Fruits & Vegetables0%5%
10%15%20%25%30%35%40% 35.0%
21.0%
8.0% 7.8%2.2%
Processing Levels of Key Categories (2014)
Growth in GDP
Impact on QSR and
Food Services Industry
Impact on Poultry
Processing Industry
Ballooning effect of Improving Economy on Poultry Processing Industry

19 I Godrej Agrovet
PROCESSING INDUSTRY HAS SHOWN IMPRESSIVE GROWTH AND WILL CONTINUE TO DO SO
FY11 FY12 FY13 FY14 FY15P FY16E FY17E0.0
0.5
1.0
1.5
2.0
2.5
0%
2%
4%
6%
8%
1.2 1.3 1.5 1.72.0 2.2 2.3
6.6%
4.7% 5.0%5.6%
6.4% 6.8% 7.3%
India is Expected to Show Strong Recovery in the EconomyUSD Tn
2011-12 2012-13 2013-1470%75%80%85%90%95%
100%
94.3% 93.4% 92.3%
5.7% 6.6% 7.8%
Chicken: Processed market is growing at a very high rate and has increased its share in the overall market
Processed Market
Wet Market
CAGR
24.0%
5.2%
Processing Industry grew at > 4x the GDP growth rate during the last 3 years. With improving macro economy, outperformance of processing industry will continue
Source: IMF and HSBC
GDP figures are calculated with the base year as 2004-05

20 I Godrej Agrovet
THOUGH RAW MATERIAL REQUIREMENT FOR FEED PRODUCTION IS EXPECTED TO SIGNIFICANTLY GO UP…
Cattle Feed(9.8 Mn MT)
DORBMaize
1.0 Mn MT
3.9 Mn MT
(33.8 Mn MT)
Maize
Soymeal
16.9 Mn MT
6.8 Mn MT
Fish Feed(2.1 Mn MT)
1.0 Mn MT
Poultry Feed
DORBSource: GAVL Analysis (2014)
Requirement by 2020

21 I Godrej Agrovet
Feed Raw Material
Actual Raw Material
Requirement of Actual Raw
Material for 2014Production for 2013
Requirement of Actual Raw
Material by 2020
Production for 2019 (CAGR of 3%)
Maize Maize 10.8 Mn MT 23 Mn MT 17.9 Mn MT 27.5 Mn MT
Soymeal (73.8% of
Soya Bean)
Soya Bean (1.36x of Soymeal)
5.6 Mn MT 12.5 Mn MT 9.2 Mn MT 14.9 Mn MT
DORB (5.3% of Paddy)
Paddy (19x of DORB)
47.6 Mn MT 155 Mn MT 94.2 Mn MT 185.1 Mn MT
All the raw material requirements for Animal Feed can be satisfactorily met by 2020
INDIA WILL BE ABLE TO MEET ALL RAW MATERIAL REQUIREMENT BY LOCAL SOURCING ITSELF
Source: Directorate of Economics and Statistics, Department of Agriculture and Cooperation, Ministry of Agriculture GAVL AnalysisNote: Soya Bean to Soymeal Conversion Formula: 10% goes towards seed & human consumption and from the rest 18% oil is extracted
22 I Godrej Agrovet
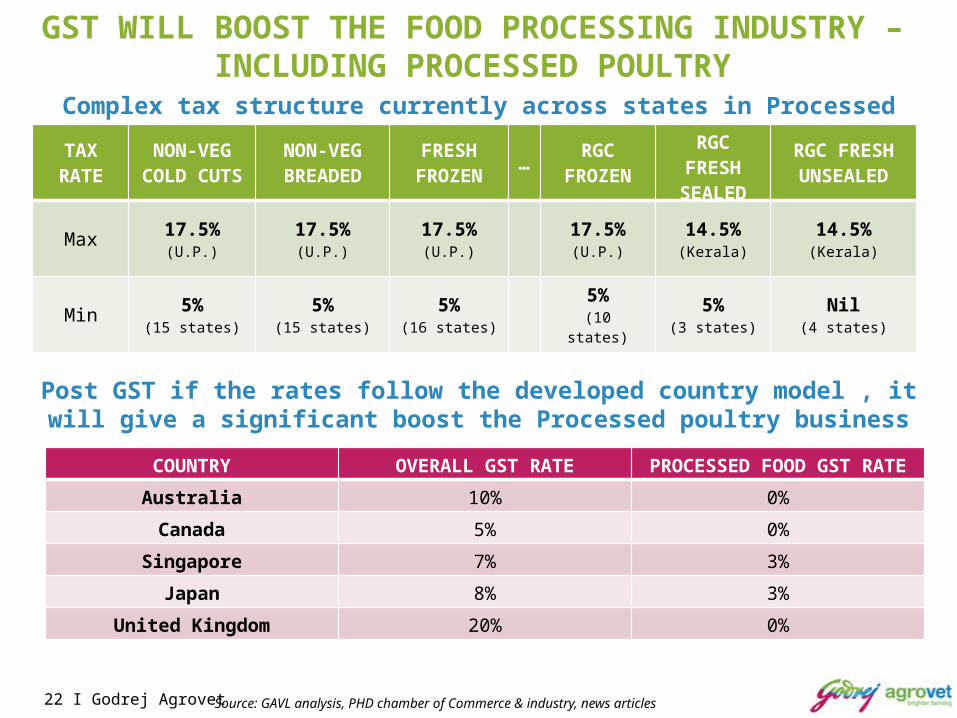
GST WILL BOOST THE FOOD PROCESSING INDUSTRY – INCLUDING PROCESSED POULTRY
Complex tax structure currently across states in Processed Poultry
Post GST if the rates follow the developed country model , it will give a significant boost the Processed poultry business
COUNTRY OVERALL GST RATEPROCESSED FOOD GST
RATE
Australia 10% 0%
Canada 5% 0%
Singapore 7% 3%
Japan 8% 3%
United Kingdom 20% 0%
TAX RATE
NON-VEG COLD CUTS
NON-VEG BREADED
FRESH FROZEN
…RGC
FROZEN
RGC FRESH
SEALED
RGC FRESH UNSEALED
Max 17.5%(U.P.)
17.5%(U.P.)
17.5%(U.P.)
17.5%(U.P.)
14.5%(Kerala)
14.5%(Kerala)
Min 5%(15 states)
5%(15 states)
5%(16 states)
5%(10 states)
5%(3 states)
Nil(4 states)
Source: GAVL analysis, PHD chamber of Commerce & industry, news articles

23 I Godrej Agrovet
IN SUMMARY – FUTURE FOR THE VALUE CHAIN
HATCHERIES FEED PHARMA INTEGRATORSFOOD
PROCESSING
Neutral + VE
• Integrators who will leverage the valued addition in the product will be the major beneficiaries of the growth in poultry industry.
• Value Addition and Branding by the Food Processing industry will help counter cyclicality and minimize the inherent risk of the poultry industry
??
- VE
Neutral
+ VE+ VE + VE

24 I Godrej Agrovet
THANK YOU FOR YOUR TIME AND CONSIDERATION