1-HOUR SO2 AIR DISPERSION MODELING REPORT FOR HAYDEN ... · Xcel is aware that a new version of...
29
Environmental solutions delivered uncommonly well 1-HOUR SO 2 AIR DISPERSION MODELING REPORT FOR HAYDEN GENERATING STATION Prepared for Xcel Energy (Public Service Company of Colorado) Submitted to US EPA Region 8 Prepared by TRINITY CONSULTANTS 1391 North Speer Boulevard, Suite 350 Denver, CO 80204 January 2017 Project 160601.0055
Transcript of 1-HOUR SO2 AIR DISPERSION MODELING REPORT FOR HAYDEN ... · Xcel is aware that a new version of...

Environmental solutions delivered uncommonly well
1-HOUR SO2 AIR DISPERSION MODELING REPORT FOR
HAYDEN GENERATING STATION
Prepared for
Xcel Energy (Public Service Company of Colorado)
Submitted to
US EPA Region 8
Prepared by
TRINITY CONSULTANTS 1391 North Speer Boulevard, Suite 350
Denver, CO 80204
January 2017
Project 160601.0055

Xcel Hayden Generating Station 1-Hour SO2 Modeling Analysis Trinity Consultants 1
TABLE OF CONTENTS
1. EXECUTIVE SUMMARY 4
2. INTRODUCTION 5
3. DESCRIPTION OF UTILITY SOURCES 6
4. AIR QUALITY MODELING METHODOLOGY 8
4.1. Model Selection 8
4.2. Meteorological Data 8
4.2.1. Surface Data 8 4.2.2. Upper Air Data 11 4.2.3. Land Use Analysis 11 4.2.4. AERMET Data Processing 12
4.3. Coordinate System 13
4.4. Receptor Locations 13
4.5. Terrain Elevations 16
4.6. Emission Sources 16
4.7. Other Sources 17
4.8. Building Influences 17
4.9. Background Concentration 18
4.10. Characterization of Modeled Area 23
5. RESULTS OF 1-HOUR SO2 MODELING 25
6. ELECTRONIC FILES 27

Xcel Hayden Generating Station 1-Hour SO2 Modeling Analysis Trinity Consultants 2
LIST OF FIGURES
Figure 3-1. Location of Hayden Generating Station .............................................................................................................................. 7
Figure 4-1. Wind Rose Plot for Yampa Valley Airport Meteorological Data ............................................................................... 9
Figure 4-2. Yampa Valley Airport Meteorological Tower Location ............................................................................................. 10
Figure 4-3. Hayden Generating Station Analysis Receptor Grid and Modeled Sources ..................................................... 14
Figure 4-4. Hayden Generating Station Receptor Grid and Modeled Sources: Fine Grid and Facility View .............. 15
Figure 4-5. Hayden Downwash Structure Locations ......................................................................................................................... 18
Figure 4-6. Map of Holcim Air Monitoring Station and SO2 Sources within 10 km of Monitor ...................................... 19
Figure 4-7. Map of Hayden Generating Station and SO2 Sources within 10km of Hayden Generating Station ....... 22
Figure 4-8. Aerial Image – Hayden Facility Area ................................................................................................................................. 24
Figure 5-1. SO2 1-Hour Concentration Plot (Design Value) ........................................................................................................... 26

Xcel Hayden Generating Station 1-Hour SO2 Modeling Analysis Trinity Consultants 3
LIST OF TABLES
Table 3-1. Utility Units included in Modeling Study ............................................................................................................................. 6
Table 3-2. Utility Unit Stack Parameters .................................................................................................................................................... 6
Table 4-1. AERSURFACE Input Parameters ........................................................................................................................................... 12
Table 4-2. Hourly CEMS Data Collected for Each Unit ...................................................................................................................... 16
Table 4-3. Hayden Downwash Structure Heights ............................................................................................................................... 17
Table 4-4. Annual SO2 Emissions from Sources Within 10 km of Holcim SO2 Monitor ..................................................... 20
Table 4-5. Season by Hour SO2 Profile for Holcim Monitor ............................................................................................................ 23
Table 6-1. Summary of Electronic Files ................................................................................................................................................... 27
Table 6-2. AERMOD File Descriptions...................................................................................................................................................... 27
Table 6-3. Met Data File Descriptions ...................................................................................................................................................... 28

Xcel Hayden Generating Station 1-Hour SO2 Modeling Analysis Trinity Consultants 4
1. EXECUTIVE SUMMARY
The Colorado Department of Public Health and Environment, Air Pollution Control Division (CDPHE) requested the assistance of Xcel Energy (Xcel) in determining compliance with the one-hour sulfur dioxide (SO2) National Ambient Air Quality Standard (NAAQS) in proximity to the Hayden Generating Station located east of Hayden, Colorado. As the Hayden Generating Station is the only major SO2 source in the Hayden area, no additional sources were included. The air quality analysis was conducted with the AERMOD Version 15181 modeling system.1 The analysis included the calendar years 2013, 2014 and 2015. Meteorological data for the period was supplied by meteorological tower at the Yampa Valley Airport. Hourly SO2 emissions and stack flow parameters were utilized for the three year period from each of the utility unit 40 CFR Part 75 Continuous Emission Monitoring Systems (CEMS). For modeling purposes the SO2 background concentration was provided by the CDPHE. The air quality modeling analysis showed no exceedances of the 1-hour SO2 NAAQS for the period 2013 through 2015. The highest receptor concentration including background was 137.63 µg/m³ compared to the 196 µg/m³ NAAQS. Thus, the modeling has demonstrated compliance with the 1-hour SO2 NAAQS.
1 Xcel is aware that a new version of AERMOD (version 16216) is expected to be released soon. Per communication with the CDPHE on November 21, 2016, since version 15181 was current at the time the modeling protocol was submitted, version 15181 was used in the analysis.
Xcel Hayden Generating Station 1-Hour SO2 Modeling Analysis Trinity Consultants 5
2. INTRODUCTION
The Colorado Department of Public Health and Environment, Air Pollution Control Division (CDPHE) has requested that Xcel Energy evaluate Sulfur Dioxide (SO2) concentrations in proximity to the Hayden Generating Station located east of Hayden, Colorado. The purpose of this request is to determine if modeling can be used to demonstrate compliance with the one-hour SO2 National Ambient Air Quality Standard (NAAQS). Xcel requested assistance from Trinity Consultants in conducting the modeling study. The modeling followed applicable U.S. Environmental Protection Agency (EPA) and CDPHE guidance and used the EPA AERMOD model. The modeling was conducted per the recommended guidance in the EPA draft August 2016 document, SO2 NAAQS Designations Modeling Technical Assistance Document (TAD) (referred to herein as the 2016 SO2 NAAQS Modeling TAD). In June 2010, EPA promulgated the new one-hour Sulfur Dioxide (SO2) National Ambient Air Quality Standard (NAAQS) at a level of 75 parts per billion (196 µg/m3) based on the three year average of the annual 99th percentile of 1-hour daily maximum concentrations. In 2013, EPA initially designated 29 areas in 16 states as nonattainment (referred to as “Round 1”). As a result of litigation, EPA is conducting three other rounds of designations for July 2016 (Round 2), December 2017 (Round 3) and December 2020 (Round 4). EPA also finalized the SO2 Data Requirements Rule (DRR) in August 2015 that requires states to gather and submit information to EPA regarding analysis of areas with larger sources of SO2 emissions specifically related to Rounds 3 and 4. The State of Colorado is required to characterize sources of SO2 greater than 2,000 tons/year (based on the most recent year of data). If modeling does not demonstrate compliance with the one-hour SO2 NAAQS, then ambient SO2 monitoring, located based on modeling results, would need to be implemented by January 1, 2017 to collect the necessary three years of data. Therefore, in line with the EPA’s May 2014 proposed Data Requirements Rule, an SO2 designation for the area surrounding the Hayden Generating Station will be based on the predictions of an air dispersion model. The TAD indicates that actual hourly emission rates should be included in the model. For sources with SO2 Continuous Emission Monitoring Systems (CEMS), the CEMS data should be used to characterize emissions. The following sections of this report will discuss the utility sources, air modeling methodology, modeling results, and electronic files included on CD.
Xcel Hayden Generating Station 1-Hour SO2 Modeling Analysis Trinity Consultants 6
3. DESCRIPTION OF UTILITY SOURCES
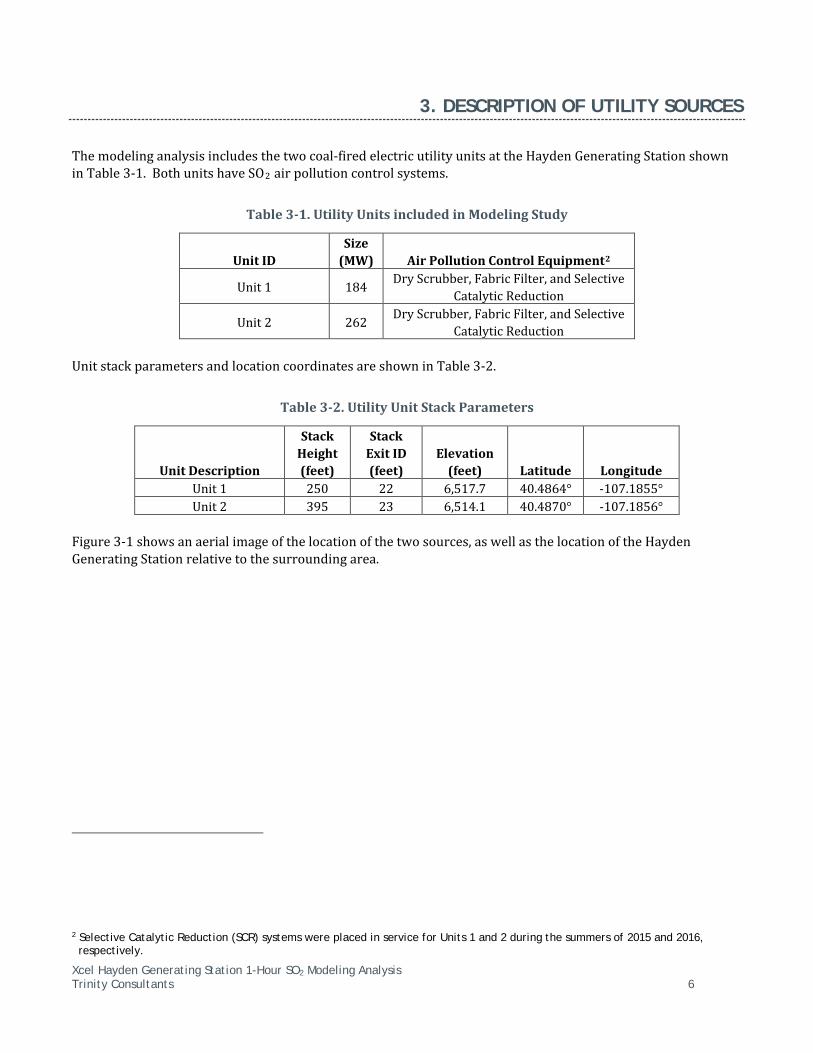
The modeling analysis includes the two coal-fired electric utility units at the Hayden Generating Station shown in Table 3-1. Both units have SO2 air pollution control systems.
Table 3-1. Utility Units included in Modeling Study
Unit ID Size
(MW) Air Pollution Control Equipment2
Unit 1 184 Dry Scrubber, Fabric Filter, and Selective Catalytic Reduction
Unit 2 262 Dry Scrubber, Fabric Filter, and Selective Catalytic Reduction
Unit stack parameters and location coordinates are shown in Table 3-2.
Table 3-2. Utility Unit Stack Parameters
Unit Description
Stack Height (feet)
Stack Exit ID (feet)
Elevation (feet) Latitude Longitude
Unit 1 250 22 6,517.7 40.4864° -107.1855° Unit 2 395 23 6,514.1 40.4870° -107.1856°
Figure 3-1 shows an aerial image of the location of the two sources, as well as the location of the Hayden Generating Station relative to the surrounding area.
2 Selective Catalytic Reduction (SCR) systems were placed in service for Units 1 and 2 during the summers of 2015 and 2016, respectively.

Xcel Hayden Generating Station 1-Hour SO2 Modeling Analysis Trinity Consultants 7
Figure 3-1. Location of Hayden Generating Station

Xcel Hayden Generating Station 1-Hour SO2 Modeling Analysis Trinity Consultants 8
4. AIR QUALITY MODELING METHODOLOGY
4.1. MODEL SELECTION The EPA AERMOD model is recommended for predicting impacts from industrial point sources as well as area and volume sources. Trinity performed 1-hour SO2 modeling using the latest AERMOD version along with Trinity’s BREEZE™ AERMOD software. The BREEZE™ AERMOD graphical user interface (GUI) was used to set up the AERMOD input file. The final model runs were performed using Version 15181 of the EPA AERMOD executable. The AERMOD model combines simple and complex terrain algorithms, and includes the Plume Rise Model Enhancement (PRIME) algorithms to account for building downwash and cavity zone impacts. All regulatory default options were used in the modeling. The pollutant ID was set to SO2 and the output options were configured such that the model predicted an SO2 design value based on the 3-year average of the 99th percentile of the annual distribution of the daily maximum 1-hour concentrations for comparison with the 1-hour SO2 NAAQS of 196 μg/m³. The complete AERMOD modeling system is comprised of three parts: the AERMET preprocessor, the AERMAP pre-processor, and the AERMOD model. The AERMET preprocessor compiles the surface and upper-air meteorological data and formats the data for AERMOD input. The AERMAP preprocessor is used to obtain elevation and controlling hill heights for AERMOD input.
4.2. METEOROLOGICAL DATA
4.2.1. Surface Data
Trinity used surface meteorological data collected at the Yampa Valley Airport meteorological tower as input to the AERMOD model. A determination of whether the meteorological data from the Yampa Valley Airport is appropriate for use in this modeling analysis is considered by determining whether the data were representative of the location of the modeled sources. Per the 2016 SO2 Modeling TAD, the representativeness of the data is based on: 1) the proximity of the meteorological monitoring site to the area under consideration, 2) the complexity of terrain, 3) the exposure of the meteorological site, and 4) the period of time during which data are collected. Each of these criteria are addressed below. Both the Yampa Valley Airport meteorological tower and the Hayden Generating Station are located in the Yampa River Valley, near Hayden, Colorado. The relative locations of the Yampa Valley Airport meteorological tower and the Hayden Generating Station are shown in Figure 4-2, below. As shown in the figure, the meteorological tower is approximately 3.75 km from the Hayden Generating Station, and there are no significant terrain features separating the Hayden Generating Station from the meteorological tower. The close proximity of the airport with respect to the sources (less than 4 km distance), in addition to the similarity in the climatology and topography, support that the meteorological conditions at the airport are representative of the meteorological conditions at the sources.3
3 The airport elevation is approximately 6,000 feet and source elevations are approximately 6,515 feet.

Xcel Hayden Generating Station 1-Hour SO2 Modeling Analysis Trinity Consultants 9
The exposure and siting of the meteorological tower at the Yampa Valley Airport is appropriate for the area. The meteorological tower is not located near terrain features or structures that would have the potential to impact data collected at the monitor. A wind rose is included below in Figure 4-1.
Figure 4-1. Wind Rose Plot for Yampa Valley Airport Meteorological Data

Xcel Hayden Generating Station 1-Hour SO2 Modeling Analysis Trinity Consultants 10
Figure 4-2. Yampa Valley Airport Meteorological Tower Location
Xcel Hayden Generating Station 1-Hour SO2 Modeling Analysis Trinity Consultants 11
AERMOD-ready meteorological data was prepared using version 15181 of the U.S. EPA’s AERMET meteorological processing utility. Standard U.S. EPA meteorological data processing guidance was used. This station does not have TD-6405 (i.e., 1-minute) wind data or TD-6401 (i.e., 5-minute) wind data. An evaluation of the data from the Yampa Valley Airport tower indicated that data for the 2015 does not meet the data requirement of at least 90% complete on a quarterly basis. Data from 2012 also does not meet the completeness requirement. As such, Trinity processed hourly data from the tower for the years 2011, 2013 and 2014. Per the SO2 Modeling TAD, dates of the 2011 dataset were adjusted to match the dates of the 2015 actual hourly emissions data.
4.2.2. Upper Air Data
In addition to surface meteorological data, AERMET requires the use of data from a sunrise-time upper air sounding to estimate daytime mixing heights. Upper air data from the nearest U.S. National Weather Service (NWS) upper-air balloon station, located in Denver, Colorado (KDNR), was obtained from the National Oceanic and Atmospheric Administration (NOAA) in Forecast Systems Laboratory (FSL) format. The period of the upper air data is concurrent with the period of the surface data.
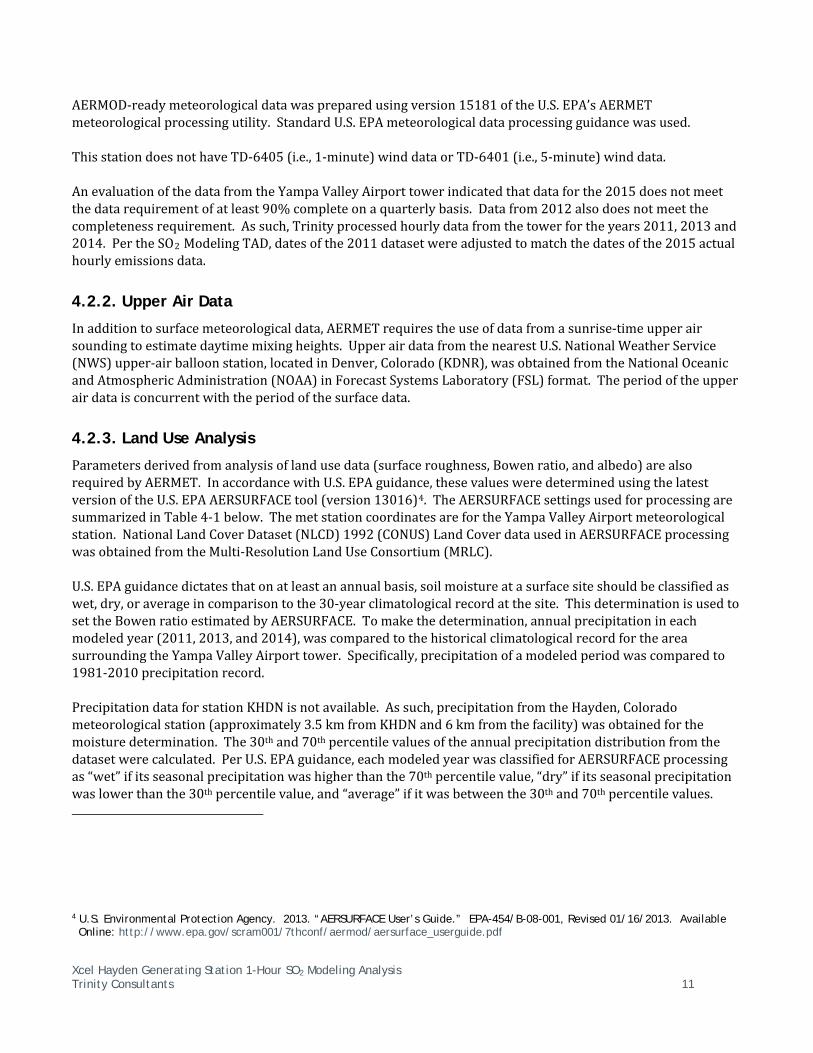
4.2.3. Land Use Analysis
Parameters derived from analysis of land use data (surface roughness, Bowen ratio, and albedo) are also required by AERMET. In accordance with U.S. EPA guidance, these values were determined using the latest version of the U.S. EPA AERSURFACE tool (version 13016)4. The AERSURFACE settings used for processing are summarized in Table 4-1 below. The met station coordinates are for the Yampa Valley Airport meteorological station. National Land Cover Dataset (NLCD) 1992 (CONUS) Land Cover data used in AERSURFACE processing was obtained from the Multi-Resolution Land Use Consortium (MRLC). U.S. EPA guidance dictates that on at least an annual basis, soil moisture at a surface site should be classified as wet, dry, or average in comparison to the 30-year climatological record at the site. This determination is used to set the Bowen ratio estimated by AERSURFACE. To make the determination, annual precipitation in each modeled year (2011, 2013, and 2014), was compared to the historical climatological record for the area surrounding the Yampa Valley Airport tower. Specifically, precipitation of a modeled period was compared to 1981-2010 precipitation record. Precipitation data for station KHDN is not available. As such, precipitation from the Hayden, Colorado meteorological station (approximately 3.5 km from KHDN and 6 km from the facility) was obtained for the moisture determination. The 30th and 70th percentile values of the annual precipitation distribution from the dataset were calculated. Per U.S. EPA guidance, each modeled year was classified for AERSURFACE processing as “wet” if its seasonal precipitation was higher than the 70th percentile value, “dry” if its seasonal precipitation was lower than the 30th percentile value, and “average” if it was between the 30th and 70th percentile values. 4 U.S. Environmental Protection Agency. 2013. “AERSURFACE User’s Guide.” EPA-454/B-08-001, Revised 01/16/2013. Available Online: http://www.epa.gov/scram001/7thconf/aermod/aersurface_userguide.pdf

Xcel Hayden Generating Station 1-Hour SO2 Modeling Analysis Trinity Consultants 12
Climate Normal snow records for 1981-2010 were reviewed to determine whether the area had continuous winter snow cover. Continuous winter snow cover was assumed for months in which at least 10 days had a snow depth of at least 1 inch. Based on temperature data, the period of November to March was determined to be winter. Snow depth was equal to or greater than 1 inch for each of these months for the 2011 – 2015. As such, continuous winter snow cover was assumed in the AERSURFACE runs. The values used for the AERSURFACE analysis are summarized in Table 4-1.
Table 4-1. AERSURFACE Input Parameters
AERSURFACE Parameter Value Met Station Latitude 40.484198
Met Station Longitude -107.229687 Datum NAD 1983
Radius for surface roughness (km) 1.0 Vary by Sector? Yes
Number of Sectors 12 Temporal Resolution Monthly
Continuous Winter Snow Cover? Yes Station Located at Airport? Yes
Arid Region? No
Surface Moisture Classification Vary by year; determined based on 30th and 70th percentile of climate normals
4.2.4. AERMET Data Processing
The surface and upper air data were processed with AERMET along with the output from the AERSURFACE processing. Standard AERMET processing options were used. 5,6 The preparation of the meteorological data files using AERMET involved a three stage process. The first stage included the extraction of raw hourly surface observations and upper air soundings. The extracted files were checked by the AERMET module for consistency and any missing or calm hours were identified. The second stage merges the surface and upper air data. The third stage estimates the boundary layer parameters required by AERMOD using the AERSURFACE output.
5 Fox, Tyler, U.S. Environmental Protection Agency. 2013. “Use of ASOS Meteorological Data in AERMOD Dispersion Modeling.” Available Online: http://www.epa.gov/ttn/scram/guidance/clarification/20130308_Met_Data_Clarification.pdf
6 U.S. Environmental Protection Agency. 2014. “User’s Guide for the AERMOD Meteorological Preprocessor (AERMET)”. EPA-454/B-03-002, November 2004).

Xcel Hayden Generating Station 1-Hour SO2 Modeling Analysis Trinity Consultants 13
Options elected include: MODIFY: Keyword for upper air data; AUDIT: Keyword to provide additional QA/QC and diagnostic information; NWS_HGT WIND 10: Keyword to designate the anemometer height as 10 meters; METHOD WIND_DIR RANDOM: Keyword to correct for any wind direction rounding in the raw
Integrated Surface Hourly Data (ISHD) data; METHOD REFLEVEL SUBNWS: Keyword to allow use of airport surface station data; Default substitution options for cloud cover and temperature data were not overridden; Default ASOS_ADJ option for correction of truncated wind speeds were not overridden; and ADJ_U* beta option was not used.
4.3. COORDINATE SYSTEM In all modeling input and output files, the locations of emission sources, structures, and receptors are represented in Zone 13 of the Universal Transverse Mercator (UTM) coordinate system using datum World Geodetic System (WGS) 1984, which is comparable to the North American Datum 1983 (NAD83). The locations for the two units included in the modeling are shown in Table 3-2 and in Figure 3-1. The base elevation of the facility is approximately 6,515 feet above mean sea level.
4.4. RECEPTOR LOCATIONS The dispersion modeling uses a combination of a Cartesian grid system centered on the facility and discrete receptor points along the facility fence line. Receptors were placed at 25 meter intervals along the fence line for the facility, 100 meter intervals out to a distance of at least 1 kilometer (km) from the facility, 250 meter intervals out to a distance of at least 3 km from the facility, and at 500 meter intervals out to at least 10 km from the facility. Since, as indicated in Section 5, there were no elevated levels of SO2 (at least 90% of the standard) encountered near the edge of the receptor grid, there was no need to expand or adjust the receptor grid to conform to the 2016 SO2 NAAQS Modeling TAD and the 2015 SO2 Area Designation Guidance. On-site receptors (i.e., those located within the Hayden facility fence line) were removed. In accordance with Section 4.2 the 2016 SO2 NAAQS Modeling TAD, receptors located on other facilities’ property were included in the analysis.7 The receptor locations, as well as modeled sources discussed in Section 4.6) are depicted in Figures 4-3 and 4-4, below.
7 SO2 NAAQS Designations Modeling Technical Assistance Document, U.S. EPA, August 2016.

Xcel Hayden Generating Station 1-Hour SO2 Modeling Analysis Trinity Consultants 14
Figure 4-3. Hayden Generating Station Analysis Receptor Grid and Modeled Sources

Xcel Hayden Generating Station 1-Hour SO2 Modeling Analysis Trinity Consultants 15
Figure 4-4. Hayden Generating Station Receptor Grid and Modeled Sources: Fine Grid and Facility View

Xcel Hayden Generating Station 1-Hour SO2 Modeling Analysis Trinity Consultants 16
4.5. TERRAIN ELEVATIONS The terrain elevation for each receptor, building, and emission source was determined using USGS 1/3 arc-second National Elevation Data (NED). The NED, obtained from the USGS, has terrain elevations at 10-meter intervals. Using the AERMOD terrain processor, AERMAP (version 11103), the terrain height for each receptor, building, and emission source included in the model was determined by assigning the interpolated height from the digital terrain elevations surrounding each source. In addition, AERMAP was used to compute the hill height scales for each receptor. AERMAP searches all NED points for the terrain height and location that has the greatest influence on each receptor to determine the hill height scale for that receptor. AERMOD then uses the hill height scale in order to select the correct critical dividing streamline and concentration algorithm for each receptor. Per the AERMAP User’s Guide, care was taken to ensure that the domain of the NED file was sufficiently large enough to cover all significant terrain nodes (i.e., all terrain that is at or above a 10% slope from each and every receptor) to allow AERMAP to correctly calculate the hill height scale for each receptor.8
4.6. EMISSION SOURCES The analysis included the two coal-fired electric utility units shown in Table 3-1. Hourly 40 CFR Part 75 CEMS data from the EPA Air Market Program have been prepared for the years 2013, 2014, and 2015 for each of the units. This three year period is representative of normal operations for the two units. The raw CEMS parameters collected for each unit are shown in Table 4-2. Furthermore, in accordance with Section 6.4 of the SO2 Modeling TAD, actual (not GEP) stack heights for the utility units were used in the modeling analysis. 9
Table 4-2. Hourly CEMS Data Collected for Each Unit
Parameter Units Date Hour
Operating Time Minutes SO2 Mass Flow lb/hr
Stack Flow 1 SCFH Stack Velocity 1 fps
Stack Temperature 1 °F 1 Stack velocity data and temperature data were
collected for Unit 2 for January 2013 – April 2014. Stack flow data was collected for Unit 1 (all operating hours) and for Unit 2 for May 2014 – December 2015.
8 U.S. EPA User’s Guide for the AERMOD Terrain Preprocessor (AERMAP), October 2004. 9 SO2 NAAQS Designations Modeling Technical Assistance Document, U.S. EPA, August 2016.

Xcel Hayden Generating Station 1-Hour SO2 Modeling Analysis Trinity Consultants 17
The flow parameters are then corrected to actual conditions (based on stack temperature and barometric pressure from a nearby weather station). The modeling was conducted based on the actual hourly SO2 emissions, stack temperatures and stack flowrates. Please note that flow monitors at the Hayden Generating Station were changed from a pitot tube type monitor to an ultrasonic type monitor within the last several years. The replacement ultrasonic type monitors do not have a temperature reading and measure flow in standard cubic feet per hour (scfh), while the old pitot tube type monitors recorded stack velocity in feet per second (fps) and did record stack temperatures. The monitor for Unit 1 was switched in 2012. As such, the stack temperature used in the analysis were set to 165 °F, based on a review of historical data. The monitor on Unit 2 was switched out in April of 2014. Actual hourly temperature data was used for the hours between January of 2013 and April of 2014. Based on a review of the January 2013 – April 2014 temperature data, a stack temperature of 162.7 °F was modeled for the remaining hours (i.e. May 2014 – December 2015). Additionally, since the ultrasonic type monitors record flow rates in scfh, flow parameters from the ultrasonic monitors were corrected to actual conditions (based on stack temperature, barometric pressure from a nearby weather station, and an assumed standard temperature of 68 °F).
4.7. OTHER SOURCES There are no other point sources of SO2 within 10 km of the Hayden Generating Station. Therefore the modeling analysis includes only the SO2 emissions from the two utility coal units.
4.8. BUILDING INFLUENCES The U.S. EPA’s Building Profile Input Program (BPIP) with Plume Rise Model Enhancement (PRIME) (version 04274) was used to account for building/structure downwash influences at the Hayden Generating Station. The purpose of a building downwash analysis is to determine if the plume discharged from a stack will become caught in the turbulent wake of a building or other structure, resulting in downwash of the plume. The downwash of a plume can result in elevated ground-level concentrations. The location and dimensions of the modeled downwash structures are provided below in Table 4-3 and Figure 4-5. No non-default configuration options were used in the building downwash analysis.
Table 4-3. Hayden Downwash Structure Heights
Building ID Description
Building Height
(m) 2BH2 2 - Existing Baghouse - Unit 2 30.79 1BH1 1 - Existing Baghouse - Unit 1 30.79
8BLR2 8 - Boiler - Unit 2 62.79 5_6TURB 5 & 6 - Turbines - Units 1 & 2 27.43
7BLR1 7 - Boiler - Unit 1 52.43 12CT1 12 - Cooling Tower - Unit 1 14.02 13CT2 13 - Cooling Tower - Unit 2 16.46 3SCR1 3 - SCR - Unit 1 48.46 4SCR2 4 - SCR - Unit 2 56.69

Xcel Hayden Generating Station 1-Hour SO2 Modeling Analysis Trinity Consultants 18
Figure 4-5. Hayden Downwash Structure Locations
4.9. BACKGROUND CONCENTRATION NAAQS compliance demonstrations require background ambient concentrations to be added to the cumulative impact from onsite and off-property sources. After discussions with CDPHE, Xcel Energy agreed that the Golden Energy – Holcim, Florence (Holcim) monitor, with one year of data (September 2005 through September 2006), is conservative for use in this analysis and that the seasonal adjusted hourly data provided by CDPHE should be used in the modeling. The figure below provided by CDPHE shows the Holcim Florence Plant with the nearby off-site SO2 monitoring station previously maintained by Holcim as well as additional SO2 sources within 10 km of the monitor. As shown in the map, the air monitoring station is located in a rural area on the outskirts of Florence and Penrose. SO2 sources are shown as green circles on the map.

Xcel Hayden Generating Station 1-Hour SO2 Modeling Analysis Trinity Consultants 19
Figure 4-6. Map of Holcim Air Monitoring Station and SO2 Sources within 10 km of Monitor

Xcel Hayden Generating Station 1-Hour SO2 Modeling Analysis Trinity Consultants 20
Other than Holcim, which is the most significant source of SO2 in Fremont county, the nearby SO2 sources are very small (less than 1 tpy). Annual emissions from the six facilities located within 10 km of the Holcim monitor are presented in Table 4-4. Data from the years the monitor operated (2005-2006) are compared to current data (2013-2015).
Table 4-4. Annual SO2 Emissions from Sources Within 10 km of Holcim SO2 Monitor
2005 2006 2013 2014 2015 Holcim (US) Inc. Portland Plant 372.0 tpy 367.2 tpy 264.9 tpy 330.1 tpy 353.9 tpy Rocky Mountain Materials – Penrose Ranch 0.8 tpy* 0.8 tpy* 0.8 tpy 0.8 tpy* 0.8 tpy
Florence Fed. Correctional Institution/UNICOR 0.1 tpy* 0.1 tpy* <0.1 tpy* <0.1 tpy <0.1 tpy
Persolite Products Inc. Persolite Plant 043-0008 <0.1 tpy* <0.1 tpy* <0.1 tpy* <0.1 tpy* <0.1 tpy*
Charles Anthony Funeral Home Royal Gorge 0128 0.1 tpy* 0.1 tpy* <0.1 tpy* <0.1 tpy* <0.1 tpy*
Langston Concrete – Sand and Gravel pit 0062 <0.1 tpy* <0.1 tpy* <0.1 tpy* <0.1 tpy* <0.1 tpy*
Totals 373 tpy 368 tpy 266 tpy 331 tpy 355 tpy *These sources did not submit revised Air Pollution Emission Notices to the CDPHE in the indicated years, indicating that their
emissions did not change significantly. Thus the values reflected above represent the most recent data year reported. As shown in the table above, emissions from the nearby SO2 sources have decreased from the 2005/2006 levels. This indicates that the monitoring data from 2005/2006 is conservative regarding background SO2 levels around Holcim. The State of Colorado has very limited ambient SO2 data available because compared to the past National Ambient Air Quality Standards, the state has had very low ambient concentrations. Therefore, ambient monitoring of SO2 was rarely required and a “regional site” (one that is located away from the area of interest but is impacted by similar natural and distant man-made sources) were used to determine an appropriate background concentration (USEPA’s Guideline on Air Quality Models, Section 8.2.2.c). CDPHE has 1-hr SO2 monitoring data from sites in Denver, Colorado Springs, Pueblo, a remote western slope site (Williams Energy Willow Creek), the Holcim Cement facility near Florence, a Tri-State monitoring location outside of Holly, Southwest Generation south of Colorado Springs, and the Rocky Mountain Steel Reservoir site. CDPHE used best professional judgment to determine that data from large urban areas would not be representative of the area outside of Hayden since Hayden is a small community. Similarly, the Southwest Generation data has a value of 0.045 ppm, which is an extremely high value that is non-representative. The Holly data are from a location on the plains of eastern Colorado, and are not representative of conditions in northwestern Colorado. The Rocky Mountain Steel Reservoir site represents a rural area that has some nearby major sources, which CDPHE determined inappropriate, as the Hayden Generating Station is outside of a small community, and thus not purely “rural”. The Williams Willow Creek data, although from the western slope, were collected in a remote area that is less representative. Therefore, CDPHE determined that the Holcim monitor data are the most appropriate and most representative for use in this case based on the criteria listed below.

Xcel Hayden Generating Station 1-Hour SO2 Modeling Analysis Trinity Consultants 21
CDPHE believes that the Holcim monitor is the most representative monitor for characterizing background concentrations of SO2 at Hayden Generating Station due the following factors:
1. Both the Hayden Generating Station and the Holcim monitor are located near small communities in rural areas of the state. The Holcim monitor is within 10 km of Florence and Penrose, while Hayden Generating Station is within 10 km of Hayden. The combined population of Florence and Penrose is approximately 7,500; the population of Hayden is approximately 1,800.
2. Both Hayden Generating Station and the Holcim monitor are located in western Colorado in areas of similar topography, with complex terrain.
Furthermore, CDPHE believes that the Holcim monitor provides a conservative estimate of background SO2 concentrations at Hayden Generating Station because of the nearby industrial sources of SO2 emissions. There are seven industrial sources of SO2 emissions at six facilities within 10 km of Holcim totaling approximately 355 tpy (as shown in the table above), including Holcim. By contrast, there are no sources of SO2 emissions within 10 km of Hayden Generating Station (excluding SO2 emissions from Hayden Generating Station itself for background concentration comparison purposes). The location of Hayden Generating Station is show in Figure 4-7 below. Because of the significantly higher source emissions around the Holcim monitor (355 tpy vs 0 tpy), the Holcim monitoring data provides a conservative estimate of the background SO2 emissions that could be found near the Hayden Generating Station. In the absence of local data, CDPHE used best professional judgment to determine that this data is the best estimate of background concentrations at the Hayden Generating Station. The Holcim monitor could be overly conservative based on the above information and the fact that the Holcim cement plant, a large SO2 source, is located predominantly up-wind of the monitor. Therefore, in consideration of the fact that the Holcim data includes impacts from its large cement plant, a source that is not present outside of Hayden Colorado, CDPHE provided more refined, seasonal estimates of background SO2 values. CDPHE provided Xcel Energy with the temporally varying background 1-hr SO2 concentrations based on the 99th percentile monitored concentrations by hour of day and season. These values were input into the model using the source pathway BACKGRND SEASHR. The temporally varying background concentrations were processed internally in the model and combined in the model with the impacts from the Hayden Generating Station sources to provide the overall 99th percentile impact of Hayden Generating Station plus background. Values provided by the CDPHE are provided below in Table 4-5.

Xcel Hayden Generating Station 1-Hour SO2 Modeling Analysis Trinity Consultants 22
Figure 4-7. Map of Hayden Generating Station and SO2 Sources within 10km of Hayden Generating Station

Xcel Hayden Generating Station 1-Hour SO2 Modeling Analysis Trinity Consultants 23
Table 4-5. Season by Hour SO2 Profile for Holcim Monitor
4.10. CHARACTERIZATION OF MODELED AREA The Hayden Generating Station is located approximately 6.5 km east of the city of Hayden, Colorado, and approximately 30 km west of Steamboat Springs, Colorado. The facility is approximately 2 km south of the Yampa River and is located in the Yampa River Valley. The valley is between the Elkhead Mountains to the north and the Flat Tops mountains to the south. The area receives a significant amount of snow (approximately 110 inches annually) during the winter. The area is classified as attainment or unclassified for all criteria pollutants.
Hr
Holcim 1-hr SO2 (ppb) Spring Summer Fall Winter
Mar-May 2006 Jun-Aug 2006 Sep – Nov 2005 Dec 2005 Jan-Feb 2006
2nd High 1 1 0 0 1 2 1 0 0 1 3 1 1 1 2 4 1 1 0 1 5 2 1 0 0 6 2 1 0 1 7 2 1 0 1 8 1 3 0 2 9 2 3 0 2
10 2 2 0 2 11 5 2 0 5 12 4 5 0 4 13 4 2 0 2 14 6 2 1 3 15 5 3 0 5 16 3 4 0 3 17 2 2 0 4 18 2 2 1 3 19 1 2 1 1 20 0 1 0 0 21 0 1 0 0 22 1 0 0 1 23 1 0 0 1 24 1 1 0 1

Xcel Hayden Generating Station 1-Hour SO2 Modeling Analysis Trinity Consultants 24
In order to categorize the area as rural or urban for modeling purposes, National Land Cover Dataset (NLCD) 1992 (CONUS) Land Cover data was obtained from the Multi-Resolution Land Use Consortium (MRLC). Data within a 3 km radius of each source was analyzed using the EPA AERSURFACE tool (version 13016).10 Per Section 6.3 of the 2016 SO2 NAAQS Modeling TAD, a source is considered urban if the land use types I1 (heavy industrial), I2 (light-moderate industrial), C1 (commercial), R2 (common residential), and R3 (compact residential) are 50 percent or more of the area within the 3 km radius circle. Otherwise, the source is considered a rural source.11 Based on the analysis using NLCD 1992 Land Cover data, only approximately 1% of the land within 3 km of the facility falls into the land use type categories listed above. Although some land development has occurred in the area since the 1992 data was published, it is clear from the aerial images provided in Figure 4-8 that significantly less than 50% of the land within 3 km of the sources can be considered urban. As such, the sources were considered rural for the modeling analysis.
Figure 4-8. Aerial Image – Hayden Facility Area
10 U.S. Environmental Protection Agency. 2013. “AERSURFACE User’s Guide.” EPA-454/B-08-001, Revised 01/16/2013. Available Online: http://www.epa.gov/scram001/7thconf/aermod/aersurface_userguide.pdf
11 SO2 NAAQS Designations Modeling Technical Assistance Document, U.S. EPA, August 2016.

Xcel Hayden Generating Station 1-Hour SO2 Modeling Analysis Trinity Consultants 25
5. RESULTS OF 1-HOUR SO2 MODELING
The maximum modeled ground-level concentrations obtained using the approach described in Section 4 and comparison to the 1-hour SO2 standard are presented in this section. There are no exceedances of the 1-hour SO2 NAAQS for the period 2013 through 2015. Per the form of the 1-hour SO2 NAAQS, results are reported as the 3-year average of the 99th percentile of the annual distribution of daily maximum 1-hour concentrations (i.e. 4th high value). The highest 4th highest daily maximum 1-hour concentration was 137.63 µg/m³ compared to the 196 µg/m³ NAAQS. This value includes the seasonally varying background concentration provided by CDPHE. Figure 5-1 shows a graphical representation of the SO2 concentration levels in the modeling domain. The Hayden Generating Station is also displayed on the figure as a reference. Based on the 2013 – 2015 modeling results, further analysis related to potential ambient monitor locations was not conducted since compliance with the 1-hour SO2 NAAQS is demonstrated via modeling.

Xcel Hayden Generating Station 1-Hour SO2 Modeling Analysis Trinity Consultants 26
Figure 5-1. SO2 1-Hour Concentration Plot (Design Value)

Xcel Hayden Generating Station 1-Hour SO2 Modeling Analysis Trinity Consultants 27
6. ELECTRONIC FILES
All of the air quality dispersion modeling analysis electronic data files used to generate the results presented in this report are provided in the attached CDs. These electronic data files include the following:
> All AERMOD input, output, and plot data files > All downwash input and output files > AERMET input and output files > AERSURFACE files > The boundary file specifying coordinates of the modeled fence lines > CEMS hourly data files for the utility units > Electronic copy of the Air Quality Analysis
The following tables summarize the electronic files included in the attached CDs.
Table 6-1. Summary of Electronic Files
Folder/File Name Folder/File Description AERMOD AERMOD Input and Output Files (see Table 6-2) Met Data Files associated with met data processing (see Table 6-3) Hayden.bln Fenceline boundary file BPIP BPIP (Downwash) input, output, and summary files Terrain Data NED Data used for AERMAP elevations
Holcim season by hour SO2 Profile 2nd high.pdf Background concentration data varying by season/hour, as provided by CDPHE
Xcel Hayden Generating Station SO2 Modeling Report 12-2016.pdf Electronic copy of the air quality analysis
Hayden CEMS Data 2013-2015.xlsx Emissions and stack parameter data
Table 6-2. AERMOD File Descriptions
File Name Associated Files
HAYSO21315H05.ami Input File
HayHourly_2016-0531.hrl Hourly Emission Rate File
HAYSO21315H05.aml Output File
*.plt Plot files

Xcel Hayden Generating Station 1-Hour SO2 Modeling Analysis Trinity Consultants 28
Table 6-3. Met Data File Descriptions
Folder Name Description
AERSURFACE
> Precipitation data for Hayden Station used in moisture determination (“Monthly Climatological Summary 1981 – 2015.pdf”)
> Raw Snow Cover Data for Hayden Station (“USC00053867_normals.txt”)
> Land use data downloaded from http://www.mrlc.gov/viewerjs/ (“LC9212219667.tif”)
> AERSURFACE output files for Yampa Valley NWS Station (KHDN_*.out) • * A/D/W = Average/Dry/Wet Surface Moisture
FSL Formatted UA Data
> Twice daily upper air data downloaded from http://www.esrl.noaa.gov/raobs/
ISHD Data > Integrated Surface Hourly Data (ISHD) data downloaded from ftp://ftp.ncdc.noaa.gov/pub/data/noaa/
AERMET > AERMET input and output files for 2011, 2013, 2014