1. EXISTING WATER SYSTEM GIS MAPPING AND MODELING 1.1 ...
17
1-1 1. EXISTING WATER SYSTEM GIS MAPPING AND MODELING 1.1. General Background The Town of Milton’s water distribution system is supplied by the Massachusetts Wat er Resources Authority (MWRA) via the MWRA Southern Extra High (SEH) and Southern High (SH) water networks, see Fig. 1.1. The SEH service supplies water to the high pressure zone located in the southern portion of Town through one connection at MWRA Meter #55. According to the MWRA 2011-2013 water meter record information, the hydraulic grade line (HGL) at Meter #55 fluctuates between 375 and 396 feet, with an average of 385-feet (all elevations refer to USGS datum). There are three water storage tanks located within this zone; each with an overflow elevation of 375-feet. The high pressure zone also services a small number of Town of Canton residents through water mains in Hillside Street and Blue Hill Avenue. The SH service supplies water to the low pressure zone located in the northern portion of Town through two connections at MWRA Meters #27 and #107. According to the MWRA 2011-2013 water meter record information, the hydraulic grade line at Meter #27 fluctuates between 256-feet and 272-feet, with the average of 264-feet and Meter #107 fluctuates between 244-feet and 272-feet, with the average of 258-feet. There are no water storage tanks or pump stations located within the low pressure zone. 1.2. Collection, Review and Modification of Available Information The Town’s Geodatabase was reviewed and updated by BETA and Town personnel. The following adjustments were made in order to complete and streamline the data for use with the hydraulic model and the asset management program. Removed any unused or unnecessary fields, Added additional fields as required, Populated information required for hydraulic modeling including water main size, pipe material and year of pipe installation, Incorporated information from recent replacement/rehabilitation projects, Coded mains as either cement lined or unlined, Incorporated institutional knowledge relating to water main breakages and problem areas. Created a Town-wide water system network and Master Geodatabase for use on the project Upon completion of the above Geodatabase information, system connectivity issues were identified and resolved prior to creation of the hydraulic model. These issues included the following: Hydrants that did not have an accompanying hydrant lateral or hydrant gate valve were provided a hydrant lateral and where appropriate a gate valve. While the hydrant laterals are not necessary for water modeling purposes, it is helpful to display them as a background layer to indicate which water main a specific hydrant is connected to. Also, hydrants located at corners of intersections and on roads with multiple water mains can contribute to inaccuracies within the model. Hydrant valves that were shown in back of the hydrants or on the opposite side of the water main were reinserted in the correct location. Water main pipe segments were broken at junctions with other pipes and not at gate valves. Breaking the water main pipe segments at gate valves will increase the accuracy and usability of the water model. This will also increase the number of nodes/locations to check pressures
Transcript of 1. EXISTING WATER SYSTEM GIS MAPPING AND MODELING 1.1 ...
1-1
1. EXISTING WATER SYSTEM GIS MAPPING AND MODELING
1.1. General Background
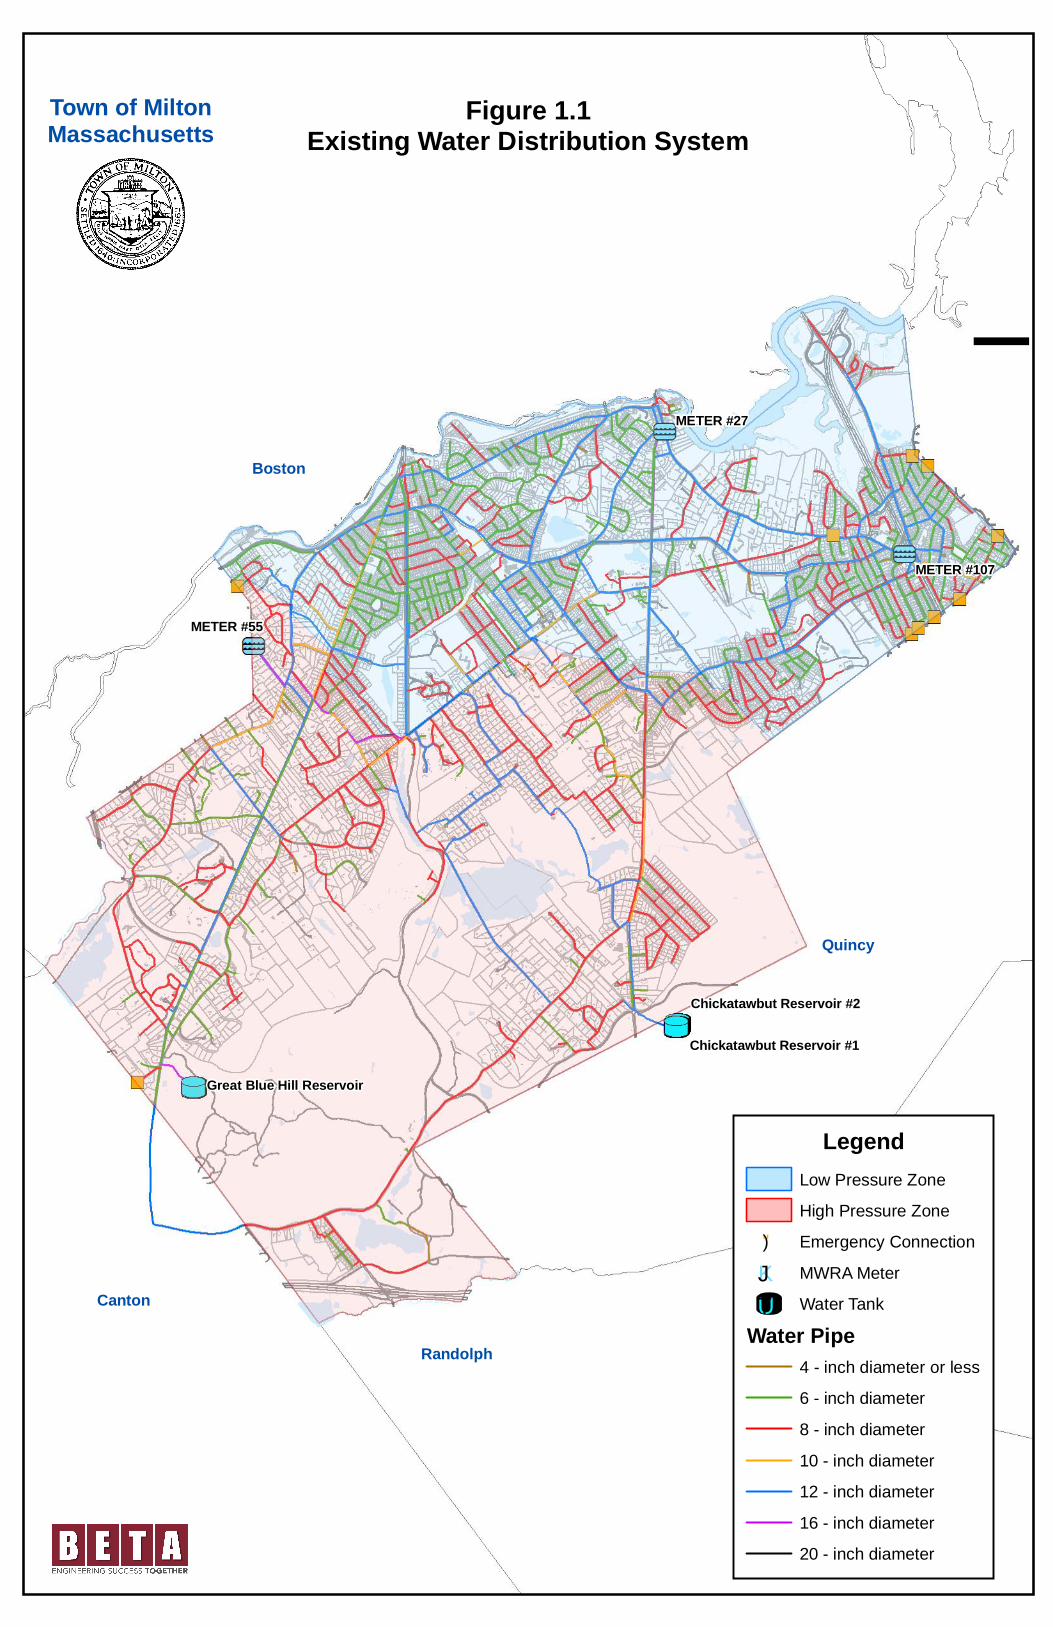
The Town of Milton’s water distribution system is supplied by the Massachusetts Water Resources
Authority (MWRA) via the MWRA Southern Extra High (SEH) and Southern High (SH) water
networks, see Fig. 1.1. The SEH service supplies water to the high pressure zone located in the
southern portion of Town through one connection at MWRA Meter #55. According to the MWRA
2011-2013 water meter record information, the hydraulic grade line (HGL) at Meter #55 fluctuates
between 375 and 396 feet, with an average of 385-feet (all elevations refer to USGS datum). There
are three water storage tanks located within this zone; each with an overflow elevation of 375-feet.
The high pressure zone also services a small number of Town of Canton residents through water
mains in Hillside Street and Blue Hill Avenue. The SH service supplies water to the low pressure
zone located in the northern portion of Town through two connections at MWRA Meters #27 and
#107. According to the MWRA 2011-2013 water meter record information, the hydraulic grade line
at Meter #27 fluctuates between 256-feet and 272-feet, with the average of 264-feet and Meter #107
fluctuates between 244-feet and 272-feet, with the average of 258-feet. There are no water storage
tanks or pump stations located within the low pressure zone.
1.2. Collection, Review and Modification of Available Information
The Town’s Geodatabase was reviewed and updated by BETA and Town personnel. The following
adjustments were made in order to complete and streamline the data for use with the hydraulic model
and the asset management program.
Removed any unused or unnecessary fields,
Added additional fields as required,
Populated information required for hydraulic modeling including water main size, pipe
material and year of pipe installation,
Incorporated information from recent replacement/rehabilitation projects,
Coded mains as either cement lined or unlined,
Incorporated institutional knowledge relating to water main breakages and problem areas.
Created a Town-wide water system network and Master Geodatabase for use on the project
Upon completion of the above Geodatabase information, system connectivity issues were identified
and resolved prior to creation of the hydraulic model. These issues included the following:
Hydrants that did not have an accompanying hydrant lateral or hydrant gate valve were
provided a hydrant lateral and where appropriate a gate valve. While the hydrant laterals are
not necessary for water modeling purposes, it is helpful to display them as a background layer
to indicate which water main a specific hydrant is connected to. Also, hydrants located at
corners of intersections and on roads with multiple water mains can contribute to inaccuracies
within the model.
Hydrant valves that were shown in back of the hydrants or on the opposite side of the water
main were reinserted in the correct location.
Water main pipe segments were broken at junctions with other pipes and not at gate valves.
Breaking the water main pipe segments at gate valves will increase the accuracy and usability
of the water model. This will also increase the number of nodes/locations to check pressures
METER #27
METER #55
METER #107
Chickatawbut Reservoir #1
Great Blue Hill Reservoir
Chickatawbut Reservoir #2
¯
Canton
Quincy
Boston
Randolph
LegendLow Pressure Zone
High Pressure Zone
") Emergency Connection
KJ MWRA Meter
UT Water Tank
Water Pipe4 - inch diameter or less
6 - inch diameter
8 - inch diameter
10 - inch diameter
12 - inch diameter
16 - inch diameter
20 - inch diameter
Town of MiltonMassachusetts
Figure 1.1Existing Water Distribution System
1-2
and fire flows as well as be beneficial for flushing and leak detection programs in determining
the effects on the water system of closing certain gate valves. BETA used an automated
process within the WaterGems software to break and snap water pipe segments to the
appropriate gate valve.
Missing fittings or pipe junctions were created as part of the network development process.
Hydraulic modeling requires a point to exist at the end of each pipe segment. These points
were created, reviewed and then were incorporated back into the existing Water System
Geodatabase.
Pipe segments that were not snapped correctly (i.e. some pipes were not broken at junctions,
pipe segments were disconnected where they should be snapped together, etc.), were snapped
or broken properly to improve the accuracy of the hydraulic modeling output.
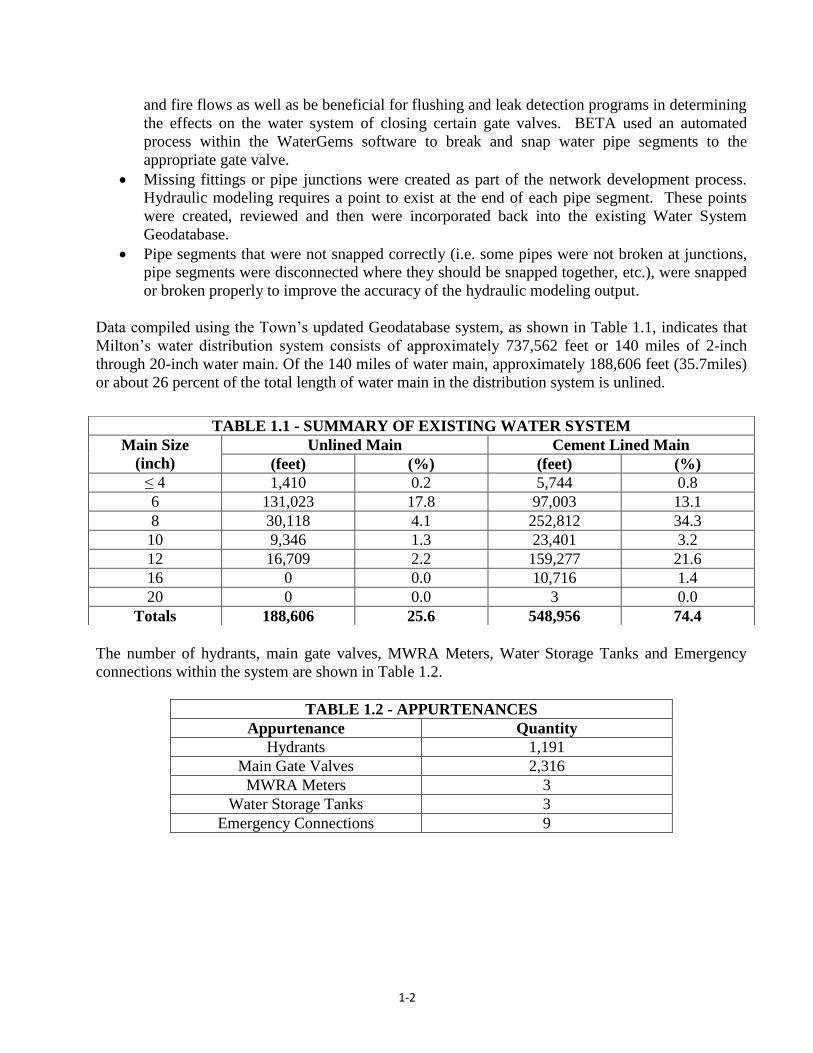
Data compiled using the Town’s updated Geodatabase system, as shown in Table 1.1, indicates that
Milton’s water distribution system consists of approximately 737,562 feet or 140 miles of 2-inch
through 20-inch water main. Of the 140 miles of water main, approximately 188,606 feet (35.7miles)
or about 26 percent of the total length of water main in the distribution system is unlined.
The number of hydrants, main gate valves, MWRA Meters, Water Storage Tanks and Emergency
connections within the system are shown in Table 1.2.
TABLE 1.2 - APPURTENANCES
Appurtenance Quantity
Hydrants 1,191
Main Gate Valves 2,316
MWRA Meters 3
Water Storage Tanks 3
Emergency Connections 9
TABLE 1.1 - SUMMARY OF EXISTING WATER SYSTEM
Main Size
(inch)
Unlined Main Cement Lined Main
(feet) (%) (feet) (%)
≤ 4 1,410 0.2 5,744 0.8
6 131,023 17.8 97,003 13.1
8 30,118 4.1 252,812 34.3
10 9,346 1.3 23,401 3.2
12 16,709 2.2 159,277 21.6
16 0 0.0 10,716 1.4
20 0 0.0 3 0.0
Totals 188,606 25.6 548,956 74.4
1-3
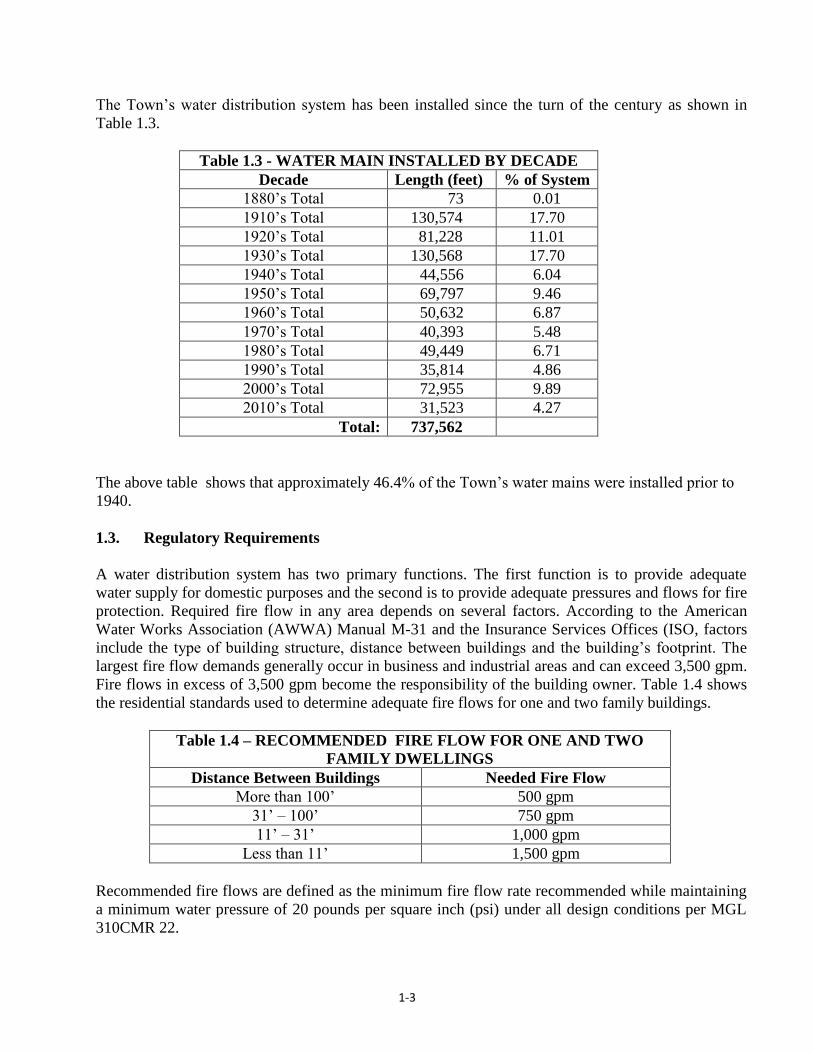
The Town’s water distribution system has been installed since the turn of the century as shown in
Table 1.3.
Table 1.3 - WATER MAIN INSTALLED BY DECADE
Decade Length (feet) % of System
1880’s Total 73 0.01
1910’s Total 130,574 17.70
1920’s Total 81,228 11.01
1930’s Total 130,568 17.70
1940’s Total 44,556 6.04
1950’s Total 69,797 9.46
1960’s Total 50,632 6.87
1970’s Total 40,393 5.48
1980’s Total 49,449 6.71
1990’s Total 35,814 4.86
2000’s Total 72,955 9.89
2010’s Total 31,523 4.27
Total: 737,562
The above table shows that approximately 46.4% of the Town’s water mains were installed prior to
1940.
1.3. Regulatory Requirements
A water distribution system has two primary functions. The first function is to provide adequate
water supply for domestic purposes and the second is to provide adequate pressures and flows for fire
protection. Required fire flow in any area depends on several factors. According to the American
Water Works Association (AWWA) Manual M-31 and the Insurance Services Offices (ISO, factors
include the type of building structure, distance between buildings and the building’s footprint. The
largest fire flow demands generally occur in business and industrial areas and can exceed 3,500 gpm.
Fire flows in excess of 3,500 gpm become the responsibility of the building owner. Table 1.4 shows
the residential standards used to determine adequate fire flows for one and two family buildings.
Table 1.4 – RECOMMENDED FIRE FLOW FOR ONE AND TWO
FAMILY DWELLINGS
Distance Between Buildings Needed Fire Flow
More than 100’ 500 gpm
31’ – 100’ 750 gpm
11’ – 31’ 1,000 gpm
Less than 11’ 1,500 gpm
Recommended fire flows are defined as the minimum fire flow rate recommended while maintaining
a minimum water pressure of 20 pounds per square inch (psi) under all design conditions per MGL
310CMR 22.
1-4
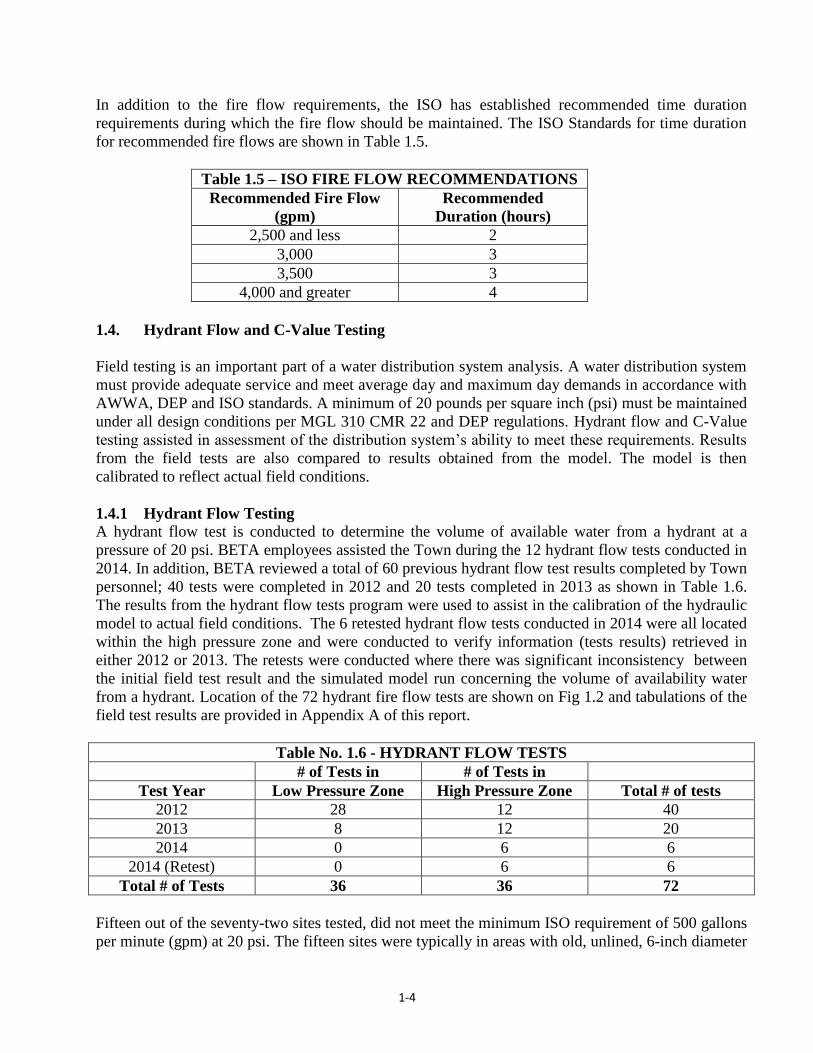
In addition to the fire flow requirements, the ISO has established recommended time duration
requirements during which the fire flow should be maintained. The ISO Standards for time duration
for recommended fire flows are shown in Table 1.5.
Table 1.5 – ISO FIRE FLOW RECOMMENDATIONS
Recommended Fire Flow
(gpm)
Recommended
Duration (hours)
2,500 and less 2
3,000 3
3,500 3
4,000 and greater 4
1.4. Hydrant Flow and C-Value Testing
Field testing is an important part of a water distribution system analysis. A water distribution system
must provide adequate service and meet average day and maximum day demands in accordance with
AWWA, DEP and ISO standards. A minimum of 20 pounds per square inch (psi) must be maintained
under all design conditions per MGL 310 CMR 22 and DEP regulations. Hydrant flow and C-Value
testing assisted in assessment of the distribution system’s ability to meet these requirements. Results
from the field tests are also compared to results obtained from the model. The model is then
calibrated to reflect actual field conditions.
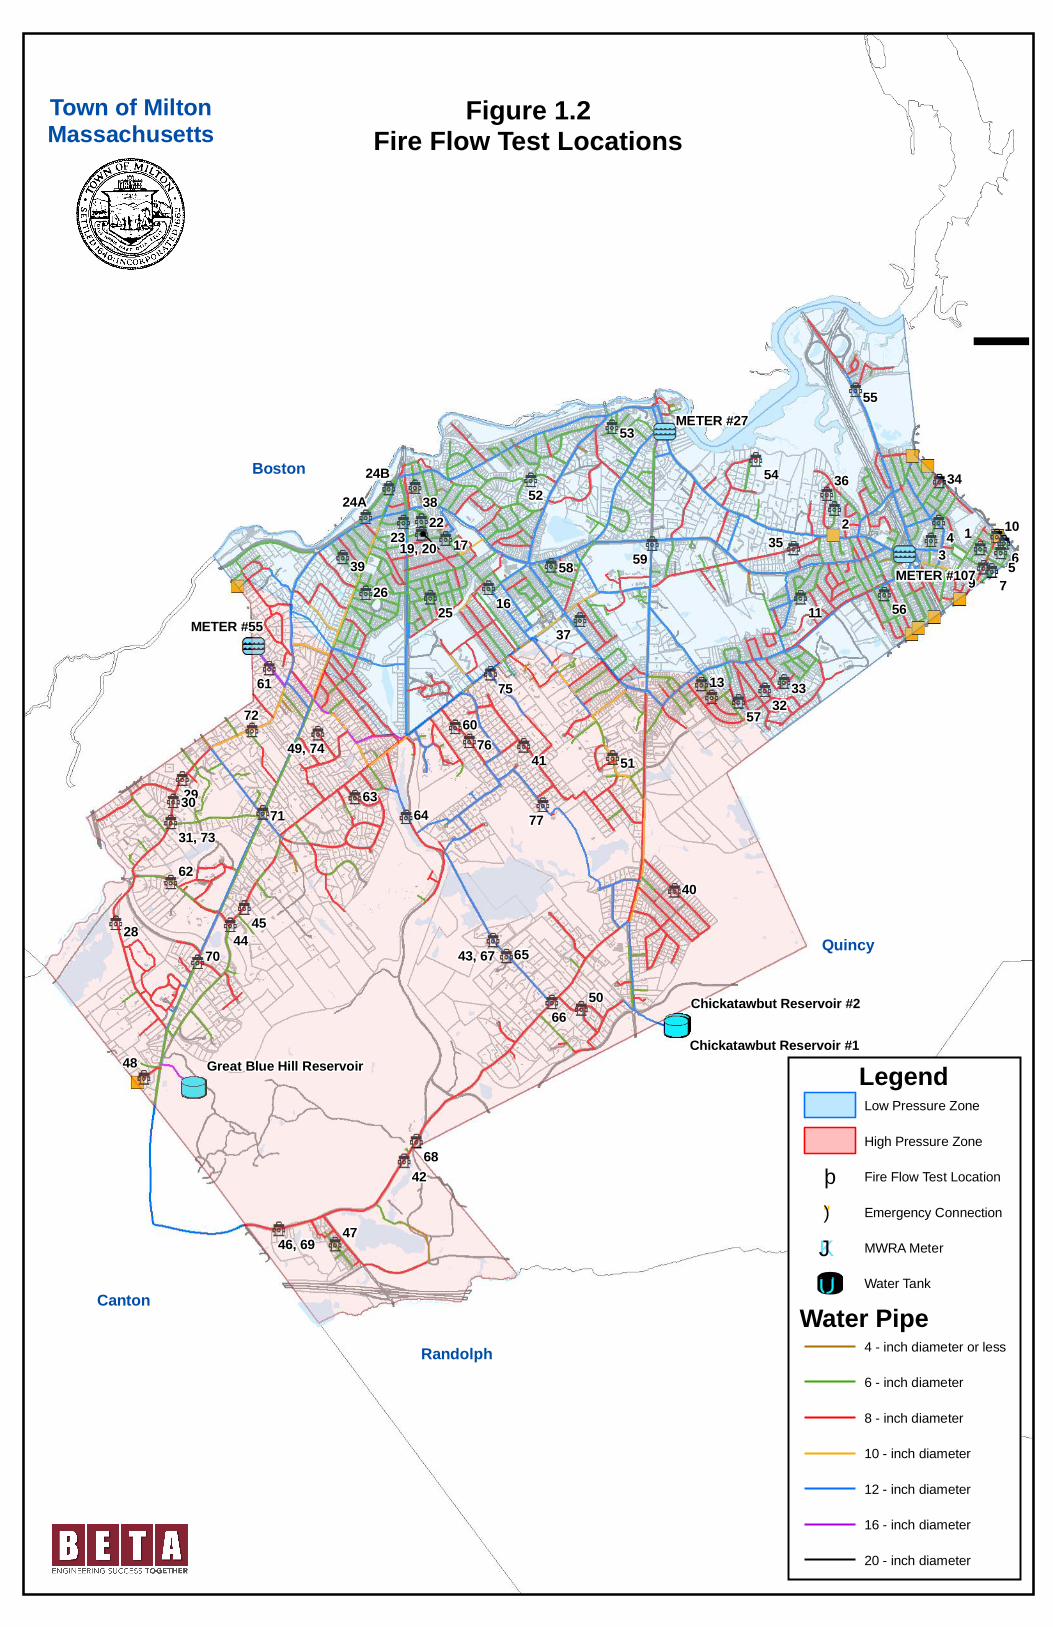
1.4.1 Hydrant Flow Testing A hydrant flow test is conducted to determine the volume of available water from a hydrant at a
pressure of 20 psi. BETA employees assisted the Town during the 12 hydrant flow tests conducted in
2014. In addition, BETA reviewed a total of 60 previous hydrant flow test results completed by Town
personnel; 40 tests were completed in 2012 and 20 tests completed in 2013 as shown in Table 1.6.
The results from the hydrant flow tests program were used to assist in the calibration of the hydraulic
model to actual field conditions. The 6 retested hydrant flow tests conducted in 2014 were all located
within the high pressure zone and were conducted to verify information (tests results) retrieved in
either 2012 or 2013. The retests were conducted where there was significant inconsistency between
the initial field test result and the simulated model run concerning the volume of availability water
from a hydrant. Location of the 72 hydrant fire flow tests are shown on Fig 1.2 and tabulations of the
field test results are provided in Appendix A of this report.
Table No. 1.6 - HYDRANT FLOW TESTS
# of Tests in # of Tests in
Test Year Low Pressure Zone High Pressure Zone Total # of tests
2012 28 12 40
2013 8 12 20
2014 0 6 6
2014 (Retest) 0 6 6
Total # of Tests 36 36 72
Fifteen out of the seventy-two sites tested, did not meet the minimum ISO requirement of 500 gallons
per minute (gpm) at 20 psi. The fifteen sites were typically in areas with old, unlined, 6-inch diameter
43
1
9
65
7
2
77
42
54
65
66
47
48
68
50
34
55
10
56
53
5238
35
11
36
59
2217
58
23
162526
39
57
3332
1413
37
7561
51
63
72
2930
40
6471
45
62
70
28 44
6076
41
24B
24A
43, 67
46, 69
19, 20
49, 74
31, 73
METER #27
METER #55
METER #107
Chickatawbut Reservoir #1Great Blue Hill Reservoir
Chickatawbut Reservoir #2
¯
Canton
Quincy
Boston
Randolph
Town of MiltonMassachusetts
Figure 1.2Fire Flow Test Locations
Legend
Fire Flow Test Location
Low Pressure Zone
High Pressure Zone
") Emergency Connection
KJ MWRA Meter
UT Water Tank
4 - inch diameter or less
6 - inch diameter
8 - inch diameter
10 - inch diameter
12 - inch diameter
16 - inch diameter
20 - inch diameter
þ
Water Pipe
1-5
water main within the low pressure system. Chapter 9 of the DEP Guidelines states that water mains
designed to provide fire flow shall not be smaller than 8-inches in diameter. Low volume of available
water typically indicates that there could be a closed or partially closed gated valve in the area, that
the pipe has excessive tuberculation or that the water main is undersized. In addition, there are
concerns in the Brush Hill Road, Harland Street, Randolph and Canton Avenue areas due to
discrepancies in hydrant flow tests conducted in close proximity to one another. Town personnel
confirmed the areas of concern. Typically, these results indicate that there may be gates in the closed
or partially closed position. BETA and town personnel believe that that is likely the case in the above
named areas.
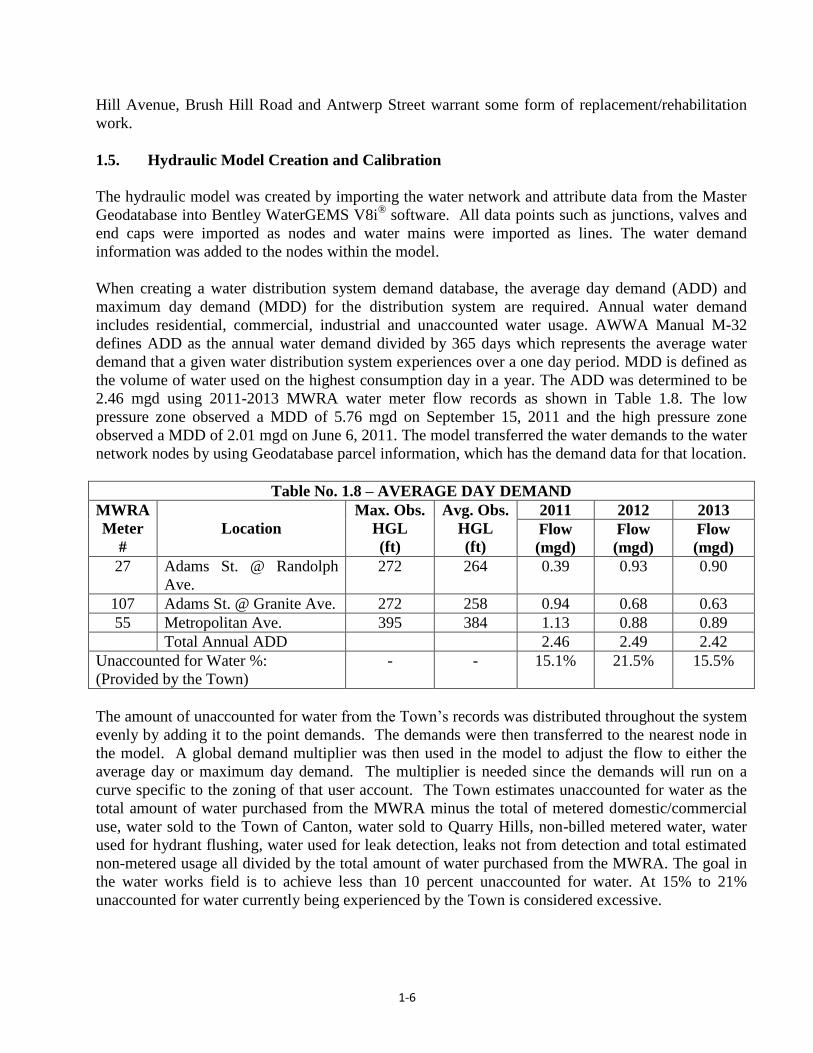
1.4.2. C-Value Testing
A pipe condition test (C-Value Testing) is conducted to estimate the hydraulic capacity of the pipe
and provides means to estimate the roughness coefficient (Hazen Williams C-Value) which is used
by water model to calculate the head loss due to internal friction on the water, by the pipe wall. The
coefficient C is a function of the roughness of the internal surface of the pipe and is directly
proportional to the carrying capacity of the water pipe. According to AWWA M-32, a typical C-
Value for a newly scraped 12-inch cast iron water main is approximately 120. Therefore, a C-Value
of 60 indicates that the carrying capacity of the pipe has been reduced to half the original capacity at
the same head loss. It is generally accepted in the industry that when a pipe’s capacity deteriorates to
50 percent of its original capacity it should be replaced or rehabilitated.
Town field personnel with the assistance of BETA personnel performed a total of eight “C-Value”
flow (CVF) tests on water mains throughout the Town. Five CVF tests were conducted within the
high pressure zone and three tests were conducted within the low pressure zone, as shown in Table
1.7. A location map of the 8 “C-Value” flow tests is provided as Fig 1.3 and tabulations of the test
results are presented in Appendix B of this report.
Table No. 1.7 – “C VALUE” FLOW TESTS
Street Name Pressure
Zone
Pipe Diameter
(in)
Pipe Material C-Value Actual Q
(gpm)
Hillside Street High 8 CICL 94 1071
Blue Hill Avenue High 6 CI 39 417
Brush Hill Road High 8 CICL 37 791
Canton Avenue High 8 CI 149 1699
Whittier Road High 8 CICL 129 1526
Wendell Park Low 6 CICL 91 769
Brandon Road Low 6 CI 109 264
Antwerp Street Low 6 CI/CICL 20 186
CI – Cast Iron
CICL – Cast Iron Cement Lined
Results indicate that three out of the eight sites tested had a C-Value of 60 or less which is considered
a low CVF test result. A low CVF test result typically indicates that the water main has excessive
tuberculation and should be either replaced or rehabilitated. The above CVF results indicate that Blue

1
87
6
3
2
5
4
METER #27
METER #55
Chickatawbut Reservoir #1Great Blue Hill Reservoir
Chickatawbut Reservoir #2
METER #107
¯
Canton
Quincy
Boston
Randolph
Town of MiltonMassachusetts
Figure 1.3C-Value Test Locations
Legend
C-Value Test Location
Low Pressure Zone
High Pressure Zone
") Emergency Connection
KJ MWRA Meter
UT Water Tank
4 - inch diameter or less
6 - inch diameter
8 - inch diameter
10 - inch diameter
12 - inch diameter
16 - inch diameter
20 - inch diameter
þ
Water Pipe
1-6
Hill Avenue, Brush Hill Road and Antwerp Street warrant some form of replacement/rehabilitation
work.
1.5. Hydraulic Model Creation and Calibration
The hydraulic model was created by importing the water network and attribute data from the Master
Geodatabase into Bentley WaterGEMS V8i® software. All data points such as junctions, valves and
end caps were imported as nodes and water mains were imported as lines. The water demand
information was added to the nodes within the model.
When creating a water distribution system demand database, the average day demand (ADD) and
maximum day demand (MDD) for the distribution system are required. Annual water demand
includes residential, commercial, industrial and unaccounted water usage. AWWA Manual M-32
defines ADD as the annual water demand divided by 365 days which represents the average water
demand that a given water distribution system experiences over a one day period. MDD is defined as
the volume of water used on the highest consumption day in a year. The ADD was determined to be
2.46 mgd using 2011-2013 MWRA water meter flow records as shown in Table 1.8. The low
pressure zone observed a MDD of 5.76 mgd on September 15, 2011 and the high pressure zone
observed a MDD of 2.01 mgd on June 6, 2011. The model transferred the water demands to the water
network nodes by using Geodatabase parcel information, which has the demand data for that location.
Table No. 1.8 – AVERAGE DAY DEMAND
MWRA
Meter
#
Location
Max. Obs.
HGL
(ft)
Avg. Obs.
HGL
(ft)
2011 2012 2013
Flow
(mgd)
Flow
(mgd)
Flow
(mgd)
27 Adams St. @ Randolph
Ave.
272 264 0.39 0.93 0.90
107 Adams St. @ Granite Ave. 272 258 0.94 0.68 0.63
55 Metropolitan Ave. 395 384 1.13 0.88 0.89
Total Annual ADD 2.46 2.49 2.42
Unaccounted for Water %:
(Provided by the Town)
- - 15.1% 21.5% 15.5%
The amount of unaccounted for water from the Town’s records was distributed throughout the system
evenly by adding it to the point demands. The demands were then transferred to the nearest node in
the model. A global demand multiplier was then used in the model to adjust the flow to either the
average day or maximum day demand. The multiplier is needed since the demands will run on a
curve specific to the zoning of that user account. The Town estimates unaccounted for water as the
total amount of water purchased from the MWRA minus the total of metered domestic/commercial
use, water sold to the Town of Canton, water sold to Quarry Hills, non-billed metered water, water
used for hydrant flushing, water used for leak detection, leaks not from detection and total estimated
non-metered usage all divided by the total amount of water purchased from the MWRA. The goal in
the water works field is to achieve less than 10 percent unaccounted for water. At 15% to 21%
unaccounted for water currently being experienced by the Town is considered excessive.
1-7
System features (i.e. storage tanks, pumps, special valves, etc.) were added manually. The controls
were then added to these features and a fire flow steady state model simulation was run. The fire
flow tests conducted in the field were then compared to the model simulation output to identify
discrepancies and potential problems within the water system. The model was then calibrated and
extended period simulations were run to simulate how the water system performs over a specified
period of time.
The model was used for various purposes including analysis of water age, observing the fluctuation
of the water level in the water storage tanks, determining the water available for fire flow protection
and identification of low pressure areas.
1.6. Mapping Fire Flow Deficiencies, Unlined Cast Iron Pipe and Pipe Break History
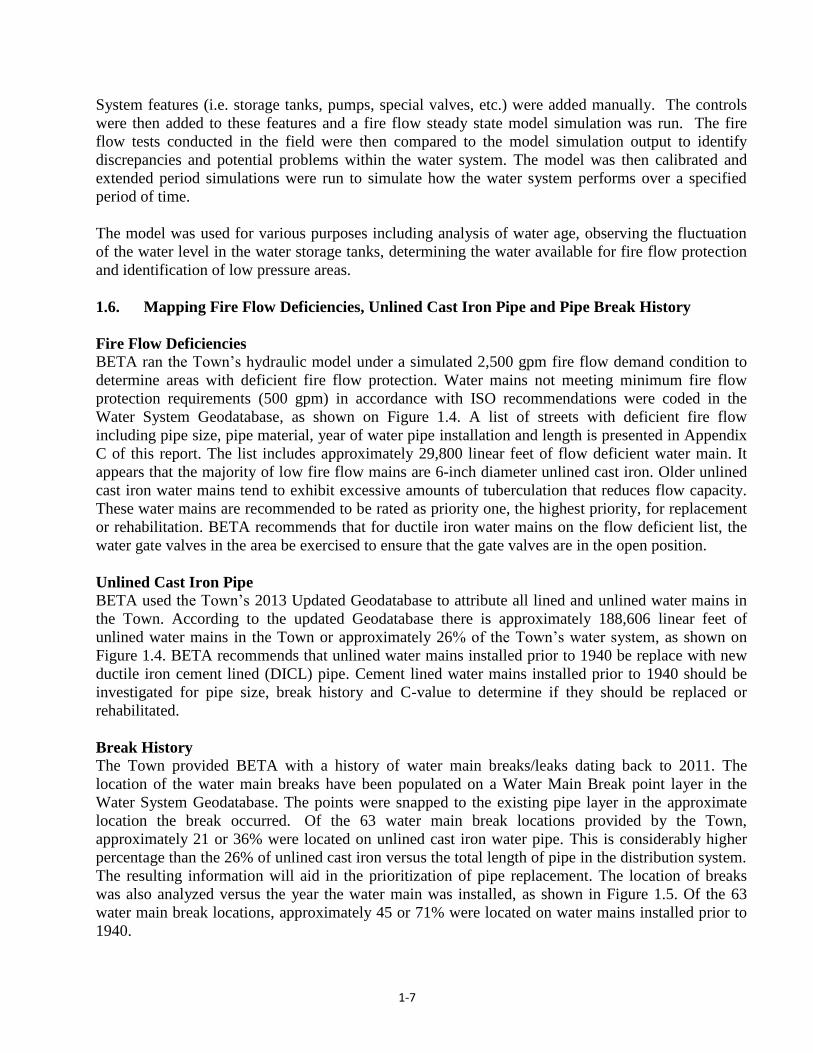
Fire Flow Deficiencies
BETA ran the Town’s hydraulic model under a simulated 2,500 gpm fire flow demand condition to
determine areas with deficient fire flow protection. Water mains not meeting minimum fire flow
protection requirements (500 gpm) in accordance with ISO recommendations were coded in the
Water System Geodatabase, as shown on Figure 1.4. A list of streets with deficient fire flow
including pipe size, pipe material, year of water pipe installation and length is presented in Appendix
C of this report. The list includes approximately 29,800 linear feet of flow deficient water main. It
appears that the majority of low fire flow mains are 6-inch diameter unlined cast iron. Older unlined
cast iron water mains tend to exhibit excessive amounts of tuberculation that reduces flow capacity.
These water mains are recommended to be rated as priority one, the highest priority, for replacement
or rehabilitation. BETA recommends that for ductile iron water mains on the flow deficient list, the
water gate valves in the area be exercised to ensure that the gate valves are in the open position.
Unlined Cast Iron Pipe
BETA used the Town’s 2013 Updated Geodatabase to attribute all lined and unlined water mains in
the Town. According to the updated Geodatabase there is approximately 188,606 linear feet of
unlined water mains in the Town or approximately 26% of the Town’s water system, as shown on
Figure 1.4. BETA recommends that unlined water mains installed prior to 1940 be replace with new
ductile iron cement lined (DICL) pipe. Cement lined water mains installed prior to 1940 should be
investigated for pipe size, break history and C-value to determine if they should be replaced or
rehabilitated.
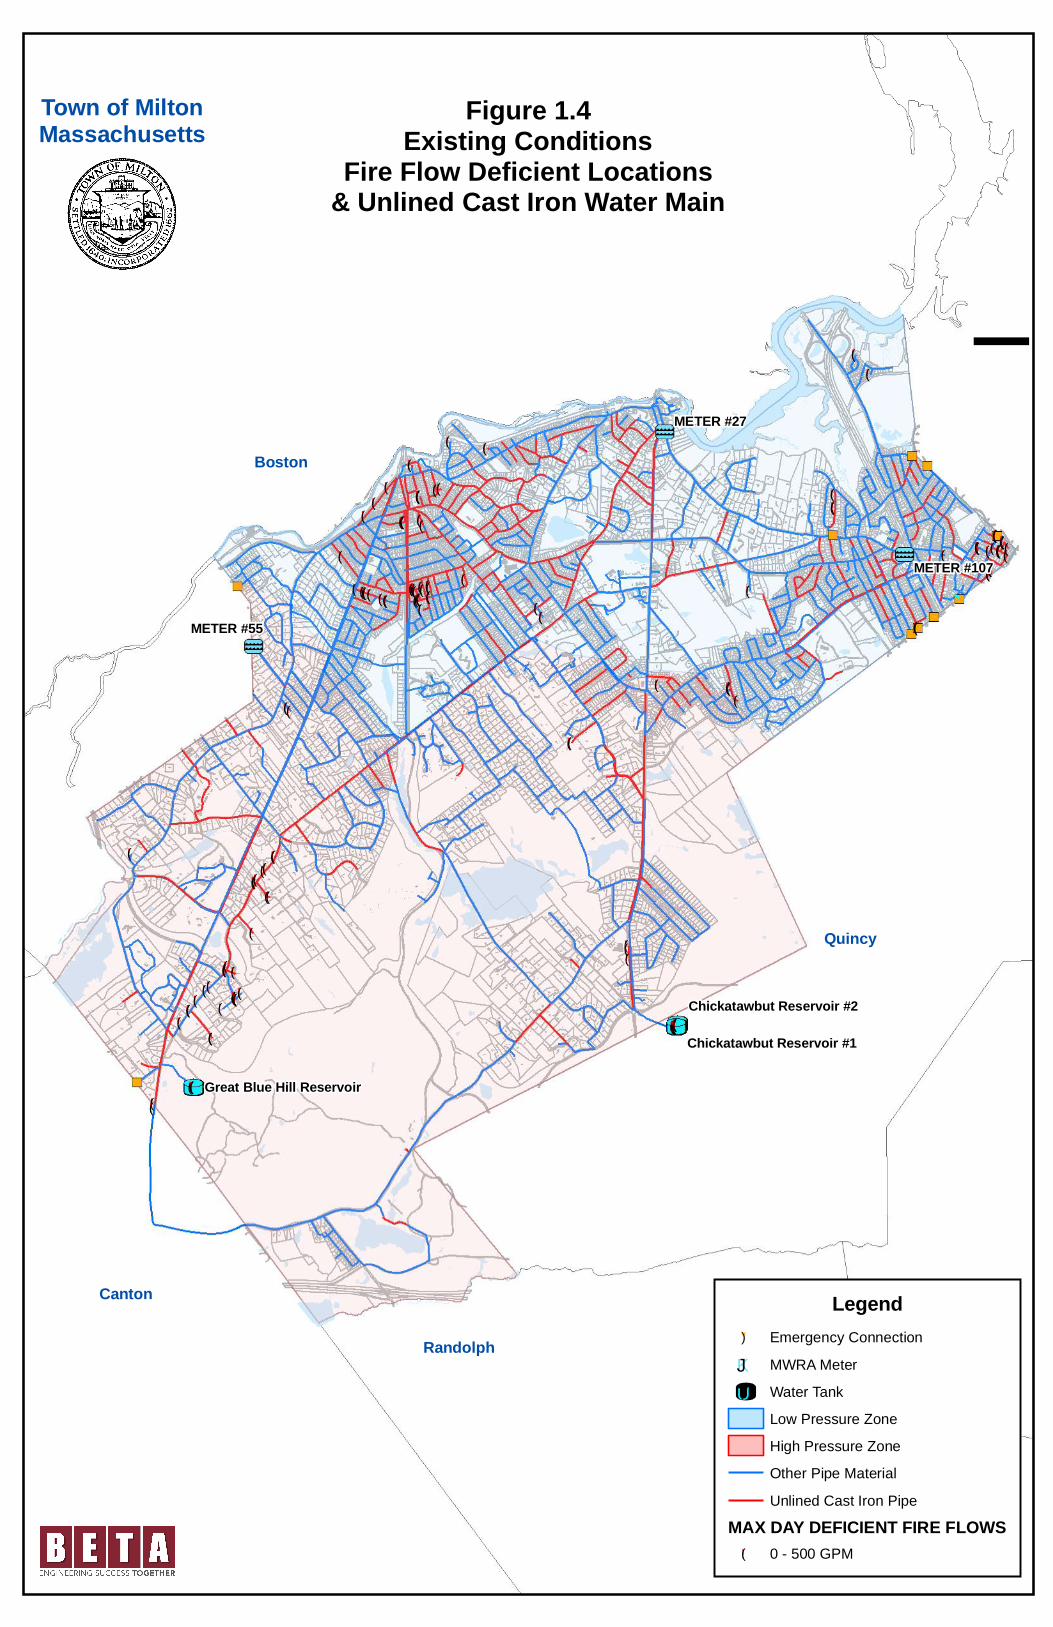
Break History
The Town provided BETA with a history of water main breaks/leaks dating back to 2011. The
location of the water main breaks have been populated on a Water Main Break point layer in the
Water System Geodatabase. The points were snapped to the existing pipe layer in the approximate
location the break occurred. Of the 63 water main break locations provided by the Town,
approximately 21 or 36% were located on unlined cast iron water pipe. This is considerably higher
percentage than the 26% of unlined cast iron versus the total length of pipe in the distribution system.
The resulting information will aid in the prioritization of pipe replacement. The location of breaks
was also analyzed versus the year the water main was installed, as shown in Figure 1.5. Of the 63
water main break locations, approximately 45 or 71% were located on water mains installed prior to
1940.
!(
!(
!(
!(!(
!( !(
!(
!(!( !(
!(
!(!(
!(
!(
!(
!(
!(
!(!(
!(
!(
!(!(
!(
!(
!(
!(
!(
!(
!(!(
!(
!(
!(
!(
!(!(
!(
!(
!(
!(
!(!(
!(!(
!(
!(!(
!(!(
!(!(
!(
!(
!(
!(!(
!(!(!(
!(!(!(!(!(
!(
!(
!(!(
!(
!(!(
!(
!(!(!(
!(
!(
!(
!(!(!(
!(
!(
!(
!(!(!(!(!(!(!(!(!(
!(!(
!(
!(!(
!(
!(!(
!(
!(
!(
!(
!(
!(
!(
!(
!(!(!(!(!(
!(
!(!(!(
!(
!(!(!(
!(
!(!(!(
!(
!(
!(
!(!(!(!(!(!(!(!(!(!(!(
!(
!(
!(
!(!(
!(!(
!(
METER #27
METER #55
METER #107
Chickatawbut Reservoir #1
Great Blue Hill Reservoir
Chickatawbut Reservoir #2
¯
Canton
Quincy
Boston
Randolph
Legend") Emergency Connection
KJ MWRA Meter
UT Water Tank
Low Pressure Zone
High Pressure Zone
Other Pipe Material
Unlined Cast Iron Pipe
MAX DAY DEFICIENT FIRE FLOWS!( 0 - 500 GPM
Town of MiltonMassachusetts
Figure 1.4Existing Conditions
Fire Flow Deficient Locations& Unlined Cast Iron Water Main
!(
!(
!(
!(!(
!(
!(
!(
!(
!(
!(
!(
!(
!(
!(
!(
!(
!(
!(
!(
!(!(
!(!(
!(
!(
!(
!(
!(
!(
!(
!(
!(
!(
!(
!(!(
!(
!(
!( !(
!(
!(
!(
!(
!(
!(
!(
!(!( !(
!(
!(
!(
!(
!(
!(
!(
!(
!(
!(
!(
!(
!(
!(
!(
!(
METER #27
METER #55
METER #107
Chickatawbut Reservoir #1
Great Blue Hill Reservoir
Chickatawbut Reservoir #2
¯
Canton
Quincy
Boston
Randolph
Legend") Emergency Connection
KJ MWRA Meter
UT Water Tank
Low Pressure Zone
High Pressure Zone
Water Pipe Install Decade1940s and older
1950s
1960s
1970s
1980s
1990s
2000s
2010s
MAIN BREAKS!( LEAK DETECTED
!( BREAK
Town of MiltonMassachusetts
Figure 1.5Existing Conditions
Water Main Install Decade& Water Main Breaks & Leaks
1-8
1.7. Recommended Improvements to Flushing and Leak Detection Programs
1.7.1 Flushing Program
The Town of Milton conducts a hydrant flushing program annually. They also, from time to time
conduct localized flushing in the rare occasion of rusty water complaints of more than one customer
in the same service area. However, in neither case, the hydrant flushing conducted by town personnel
is done in a systematic manner that would maximize efficiencies or maximize the benefits of
hydraulic condition or water quality. BETA has reviewed the Town of Milton’s water system
flushing program contained in two manuals. The first manual titled, “Comprehensive Distribution
System Flushing Program”, dated May 1996, prepared by Amory Engineers, consists of 10 flushing
areas for the high pressure zone. The second manual titled, “Comprehensive Distribution System
Flushing Program”, dated April 1997, prepared by Amory Engineers, consists of 21 flushing areas for
the low pressure zone.
The main benefits of a unidirectional flushing program are that naturally occurring sand, sediments,
non-solidified deposits, loose corrosion by-products and other debris can be removed from a water
supply system. This flushing is accomplished by opening each fire hydrant in the system under
controlled conditions. This exercise flushes pockets of stagnated water out of the water supply system
and improves the water quality not only in regard to color, odor and taste but also removes harmful
constituents from the water supply. Unidirectional flushing is one of the most effective and
economical solutions to clean the distribution system and to improve and maintain water quality.
The system should be flushed in sections to maximize control of the source water while yielding the
greatest velocity in the main. A complete Water System Map including valve and hydrant locations
is necessary to effectively implement the program. The following critical points should be
considered:
Flushing should begin at MWRA meters or water storage tanks depending on the ability to
provide the required flow rate. Fresh water should always be used to flush stagnant water.
A large main should not be flushed from a single smaller main to ensure adequate water
velocity and volume for effective flushing.
To avoid stirring up the system, only water from clean areas or large mains should be directed
into secondary pipes.
Water should be kept moving in one direction.
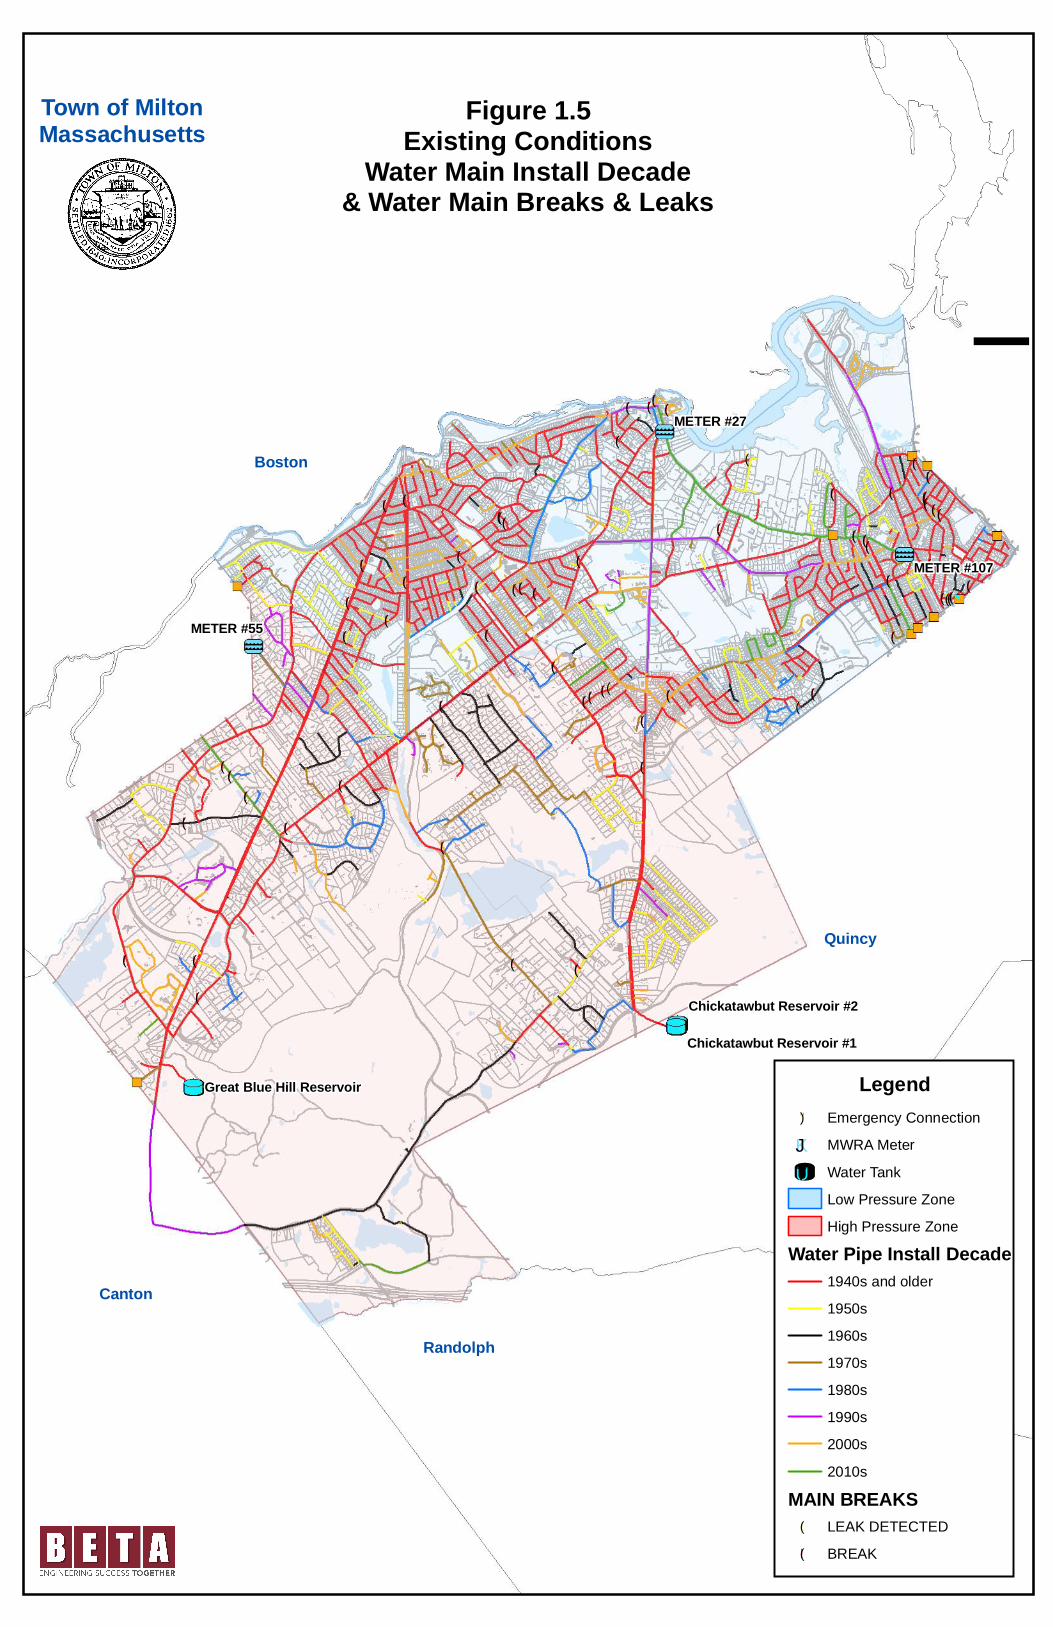
The flow from the hydrant should be proportionate to the size of the pipe being flushed.
Water velocities between 4-5 feet per second (fps) are considered optimal to remove sediment
and prevent pipe damage due to unreasonably high velocities. To achieve adequate flushing
velocity, it may be necessary to open more than one hydrant port or open more than one
hydrant. The table below indicates the ideal hydrant flow rates for each water main based on
its size.
Required Unidirectional Hydrant Flows (gpm)
Velocity Pipe Diameter (inches)
(fps) 6 8 10 12 16
4 350 630 980 1,410 2,510
5 440 790 1,230 1,770 3,140
1-9
Flushing can be accomplished with a two person crew and is best conducted at night to minimize the
number of rusty water complaints and traffic complications. Residents should be informed about
flushing in their area ahead of time.
The Town’s existing flushing program manuals outline a flushing program that commences at
MWRA meters or storage tanks and progresses from a clean area to areas to be flushed. The manual
provides a list and mapping of water gate valves that needed to be closed in a sequential order.
However, the manuals did not mention keeping records. It is recommended that town personnel
conduct its flushing program in accordance with the method, sequence, and procedures outlined in
the manual. However, during the flushing program town personnel should also collect and record the
following data:
Location, date and time of flushing test
Total flush time
List of gate valves operated and number of turns required
List of pipes flushed
Hydrant inventory number, hydrant model and hydrant year
Water main size
Static reading, residual reading and pitot reading on the hydrant diffuser or pitot device
Name of individuals conducting the test
BETA recommends the Town perform an annual unidirectional flushing program and keep records of
the above data information. The recorded information can be used to assist the Town in determining
future water projects.
1.7.2 Hydrant Inspection/Replacement Program
Ideally, every hydrant should be inspected twice a year; once in the spring and once in the fall. Since
it is not practicable to inspect hydrants twice a year, an annual program is recommended. Each
hydrant should be fully opened and checked for proper drainage, leakage, number of turns for
opening and closing, difficulty of turns, corrosion condition of caps, condition and color consistency
of paint, and flow rate. Any deficiencies should be repaired as soon as practical. Once gathered, the
information should be added to the Water System Geodatabase. The Hydrant Inspection Program can
be conducted in conjunction with the Hydrant Testing Program conducted for water modeling, and
the Town’s system flushing program. Some water departments coordinate fire department drill
programs to include hydrant inspections. Milton might consider training its fire department in how to
inspect and record hydrant inspection data so that their drill efforts could be used to supplement the
DPW’s inspection efforts. By performing these programs simultaneously the Town will be able to
maximize efficiency and save time and money. BETA recommends the replacement and/or repair of
hydrants during water main replacement/rehabilitation projects or when deficiencies are found during
annual hydrant inspections.
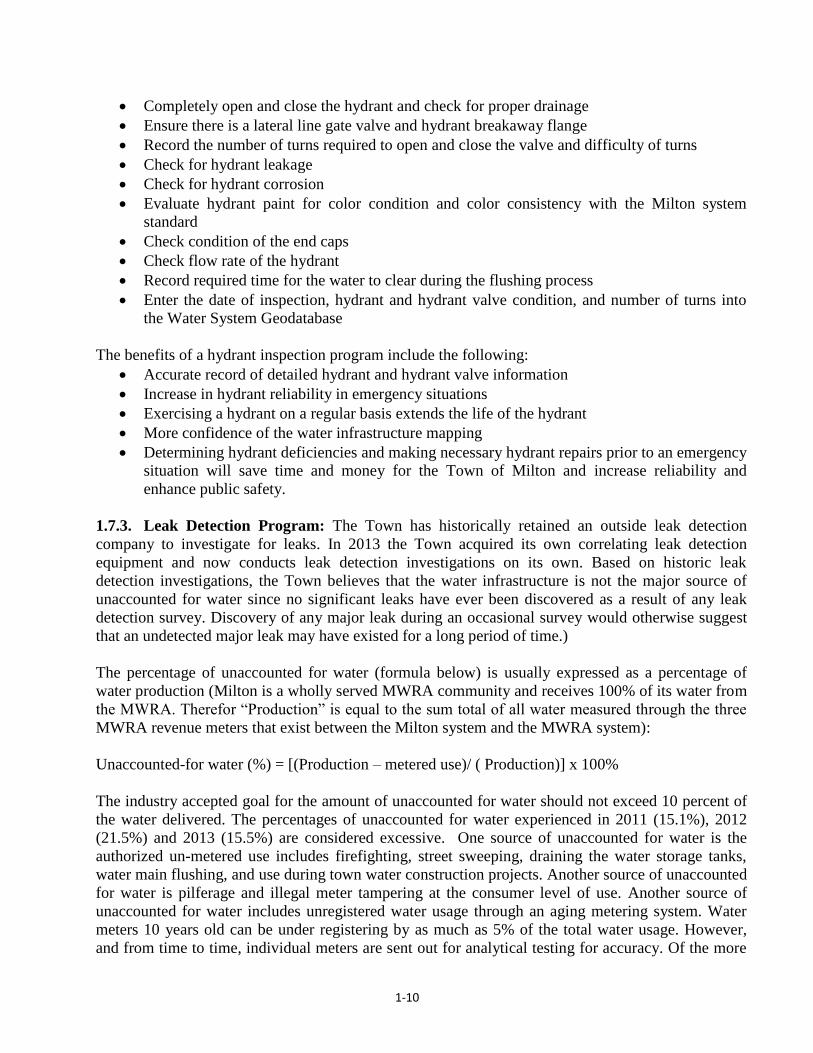
Fire hydrants should be inspected for the following:
Locate hydrant and hydrant gate box and verify its location with the Water System
Geodatabase
Evaluate whether there are any natural or manmade objects obstructing, interfering, or
otherwise compromising the function, use, or maintenance of the hydrant
1-10
Completely open and close the hydrant and check for proper drainage
Ensure there is a lateral line gate valve and hydrant breakaway flange
Record the number of turns required to open and close the valve and difficulty of turns
Check for hydrant leakage
Check for hydrant corrosion
Evaluate hydrant paint for color condition and color consistency with the Milton system
standard
Check condition of the end caps
Check flow rate of the hydrant
Record required time for the water to clear during the flushing process
Enter the date of inspection, hydrant and hydrant valve condition, and number of turns into
the Water System Geodatabase
The benefits of a hydrant inspection program include the following:
Accurate record of detailed hydrant and hydrant valve information
Increase in hydrant reliability in emergency situations
Exercising a hydrant on a regular basis extends the life of the hydrant
More confidence of the water infrastructure mapping
Determining hydrant deficiencies and making necessary hydrant repairs prior to an emergency
situation will save time and money for the Town of Milton and increase reliability and
enhance public safety.
1.7.3. Leak Detection Program: The Town has historically retained an outside leak detection
company to investigate for leaks. In 2013 the Town acquired its own correlating leak detection
equipment and now conducts leak detection investigations on its own. Based on historic leak
detection investigations, the Town believes that the water infrastructure is not the major source of
unaccounted for water since no significant leaks have ever been discovered as a result of any leak
detection survey. Discovery of any major leak during an occasional survey would otherwise suggest
that an undetected major leak may have existed for a long period of time.)
The percentage of unaccounted for water (formula below) is usually expressed as a percentage of
water production (Milton is a wholly served MWRA community and receives 100% of its water from
the MWRA. Therefor “Production” is equal to the sum total of all water measured through the three
MWRA revenue meters that exist between the Milton system and the MWRA system):
Unaccounted-for water (%) = [(Production – metered use)/ ( Production)] x 100%
The industry accepted goal for the amount of unaccounted for water should not exceed 10 percent of
the water delivered. The percentages of unaccounted for water experienced in 2011 (15.1%), 2012
(21.5%) and 2013 (15.5%) are considered excessive. One source of unaccounted for water is the
authorized un-metered use includes firefighting, street sweeping, draining the water storage tanks,
water main flushing, and use during town water construction projects. Another source of unaccounted
for water is pilferage and illegal meter tampering at the consumer level of use. Another source of
unaccounted for water includes unregistered water usage through an aging metering system. Water
meters 10 years old can be under registering by as much as 5% of the total water usage. However,
and from time to time, individual meters are sent out for analytical testing for accuracy. Of the more
1-11
than fifty such meters sent out for testing, 100% proved to be accurately measuring water passing
through them. Therefore, meter inaccuracy due to age does not appear to be a contributing factor
affecting recent or past high unaccounted for water. But as the existing meters continue to age
increases in accounted for water are likely to result.
There are different types of leaks including service line leaks, valve leaks, but in most cases the
largest portion of unaccounted for water is lost through leaks in supply lines. There are many possible
causes of leaks and often a combination of factors leads to their occurrence. The material
composition, age, and joining methods of the distribution system components can influence leak
occurrence. Water conditions are also a factor including temperature, velocity and pressure. External
conditions such as stray electrical current, contact with other structures stress from traffic vibrations,
frost loads and freezing soil around the pipe can also contribute to leaks.
There are various methods for detecting water distribution leaks. These methods usually involve
utilizing sonic leak detection equipment which identifies the sound of water escaping a pipe. These
devices can include pinpoint listening devices that make contact with valves and hydrants and
geophones that listen directly on the ground. In addition, correlator devices can listen at two points
simultaneously to pinpoint the exact location of the leak.
Large leaks do not necessarily constitute the greatest volume of lost water particularly if the water
reaches the surface where the leak is usually found quickly, isolated and repaired. However,
undetected leaks can lead to larger quantities of lost water since these leaks might exist over a longer
period of time.
Proactive leak detection program is important because:
Leaks get larger with age
Repairing leaks reduces the Town’s unaccounted for water
Repairing leaks with regularly scheduled maintenance reduces overtime costs of unscheduled
repairs saving the Town money
Leaks have been known to cause damage to nearby roads and other infrastructure
Public relations are improved by maintaining water system and reducing unaccounted for
water
An effective program will minimize leakage, reduce water demand, assure accurate revenue
collection and keep the system in good working order. The State DEP recommends the entire
distribution system be checked for leaks every other year but at the very least every five (5) years.
BETA recommends that the Town continue with its ongoing annual correlated leak detection
program.
1.8. Valve Exercising Program
The Town currently does not maintain an annual gate valve exercising program. BETA recommends
that Milton personnel perform a main line and hydrant gate valve exercising program. Such a
program should be performed consecutively with the flushing program and hydrant inspection
programs to maximize efficiency. By exercising the valve it can be determine if the gate valve was
1-12
left in the correct position. This will also ensure the proper water flow throughout the distribution
system. BETA recommends that the gate valve exercising program include exercising the gate valve,
collect data and document findings. AWWA recommends that valves on large feeder mains be
checked annually with the remainder inspected every two to three years. BETA recommends the
replacement and/or repair of gate valves during water main replacement/rehabilitation projects or
when deficiencies are found during annual gate valve inspections.
The following steps should be taken during inspection:
Locate gate box and verify its location with the Water System Geodatabase.
Remove gate box cover and inspect for damage and to ensure proper fit.
Ensure gate box is clear of debris. Clean out the box, if necessary.
Exercise the valve through at least one full cycle until the valve operates freely with little
resistance. This may take several full cycles. Fully close and open the gate and note the
number of turns needed to close it.
Check for leaking seals.
Enter the date of inspection, valve condition, and number of turns into the Water System
Geodatabase.
Repair and replace the box and valve, if necessary.
The benefits of a gate valve exercising program include the following:
Accurate record of detailed valve information.
Increase in valve reliability in emergency situations.
Reliable functioning valves provide the ability to immediately isolate main breaks resulting in
quicker water main break isolation.
Lower water loss and less disruption to the public will save time and money for the Town of
Milton.
Exercising a valve on a regular basis extends the life of the valve.
Determining valve deficiencies and necessary valve repairs prior to emergency situations will
save time and money for the Town of Milton in the future.
1.9. Recommended Improvements for Service to Customers Near Town Boundaries
BETA reviewed water service to customers near town boundaries to determine if domestic and fire
service being provided is meeting minimum Town requirements. BETA ran the hydraulic model
under a simulated fire flow to anticipate fire flows and pressures throughout the Town, see Section
2.1 of this report. In addition, there were 72 fire hydrant flow and 8 C-Value tests performed
throughout the Town between 2011 and 2014. Water mains not meeting minimum or have deficient
fire protection flow rates shall be put on a high priority list. The model indicates that East Milton
Square, and the Blue Hill Parkway and Brush Hill Road areas within the low service pressure zone
and the southern portion of Canton Avenue in the high pressure zone, exhibit low flow. The water
mains in these areas are typically old, unlined, undersized and dead ended pipes. Section 4 of this
report describes in detail the recommended improvements in these areas and across the entire water
distribution system.