1 Evaluate—Quantitative Methods October 4, 2007 Turn in Project Proposal NEEDS DESIGN...
68
1 Evaluate— Evaluate— Quantitative Methods Quantitative Methods October 4, 2007 October 4, 2007 Turn in Project Proposal Turn in Project Proposal NEEDS DESIGN IMPLEMENT EVALUATE
-
date post
15-Jan-2016 -
Category
Documents
-
view
214 -
download
0
Transcript of 1 Evaluate—Quantitative Methods October 4, 2007 Turn in Project Proposal NEEDS DESIGN...

11
Evaluate—Evaluate—Quantitative MethodsQuantitative Methods
October 4, 2007October 4, 2007
Turn in Project ProposalTurn in Project ProposalNEEDS
DESIGN
IMPLEMENTEVALUATE

22
TodayToday
Quantitative methodsQuantitative methods– Scientific methodScientific method– Aim for generalizable resultsAim for generalizable results
Privacy issues when collecting Privacy issues when collecting datadata

33
Quantitative methodsQuantitative methods
Reliably measure some aspect of Reliably measure some aspect of interfaceinterface– Especially to measurably compareEspecially to measurably compare
ApproachesApproaches– Controlled experimentsControlled experiments
Doing Psychology Experiments Doing Psychology Experiments David W. Martin, 7 David W. Martin, 7thth
edition, 2007edition, 2007
– Collect usage dataCollect usage data

44
Designing an Designing an experimentexperiment State hypothesisState hypothesis Identify variablesIdentify variables
– IndependentIndependent– DependentDependent
Design experimental protocolDesign experimental protocol Apply for human subjects reviewApply for human subjects review Select user populationSelect user population Conduct experimentConduct experiment

55
Conducting Conducting experimentexperiment Run pilot testRun pilot test Collect data from running Collect data from running
experimentexperiment Perform statistical analysisPerform statistical analysis Interpret data, draw conclusionsInterpret data, draw conclusions

66
Experiment hypothesisExperiment hypothesis
Testable hypothesisTestable hypothesis– Precise statement of expected outcomePrecise statement of expected outcome
More specifically, how you predict the More specifically, how you predict the dependent variable (i.e., accuracy) will dependent variable (i.e., accuracy) will depend on the independent variable(s)depend on the independent variable(s)
““Null” hypothesis (HNull” hypothesis (Hoo))– Stating that there will be Stating that there will be no effectno effect– e.g., “There will be no difference in e.g., “There will be no difference in
performance between the two groups”performance between the two groups”– Data used to try to Data used to try to disprovedisprove this null this null
hypothesishypothesis

77
Experiment designExperiment design
Independent variablesIndependent variables– Attributes we manipulate / vary in Attributes we manipulate / vary in
conditioncondition– Levels, value of attributeLevels, value of attribute
Dependent variablesDependent variables– Outcome of experiment, measures to Outcome of experiment, measures to
evaluateevaluate– Usually measure user performanceUsually measure user performance
Time to completionTime to completion ErrorsErrors Amount of productionAmount of production Measures of satisfactionMeasures of satisfaction

88
Experiment design (2)Experiment design (2)
Control variablesControl variables– Attributes that remain the same across Attributes that remain the same across
conditionsconditions Random variablesRandom variables
– Attributes that are randomly sampledAttributes that are randomly sampled– Can be used to increase generalizabilityCan be used to increase generalizability
Avoiding confoundsAvoiding confounds– Confounds are attributes that changed but Confounds are attributes that changed but
were not accounted forwere not accounted for– Confounds prevent drawing conclusions on Confounds prevent drawing conclusions on
independent variablesindependent variables

99
Example: Person Example: Person pickerpicker Picking from list of names to Picking from list of names to
invite to use facebook applicationinvite to use facebook application
Bryan TsaoChristine RobsonDavid SunJohn TangJonathan Tong…
Bryan Tsao
Christine Robson
David Sun
John Tang
Jonathan Tong…

1010
Example: VariablesExample: Variables
Independent variablesIndependent variables– Picture vs. no picturePicture vs. no picture– Ordered horizontally or verticallyOrdered horizontally or vertically– One column vs. 2 columnOne column vs. 2 column
Dependent variablesDependent variables– Time to completeTime to complete– Error rateError rate– User perceptionUser perception
Control variablesControl variables– Test settingTest setting– List to pick fromList to pick from
Random variablesRandom variables– Subject demographicsSubject demographics
ConfoundConfound– Only one woman in listOnly one woman in list– List mostly AsiansList mostly Asians

1111
Experimental design Experimental design goalsgoals Internal validityInternal validity
– Cause and effect: That change in independent Cause and effect: That change in independent variables variables change in dependent variables change in dependent variables
Eliminating confounds (turn them into independent Eliminating confounds (turn them into independent variables or random variables)variables or random variables)
Replicability of experimentReplicability of experiment
External validityExternal validity– Results generalizable to other settingsResults generalizable to other settings– Ecological validity—generalizable to the real-Ecological validity—generalizable to the real-
worldworld Confidence in resultsConfidence in results
– Statistical power (number of subjects, at least Statistical power (number of subjects, at least 10)10)
1212
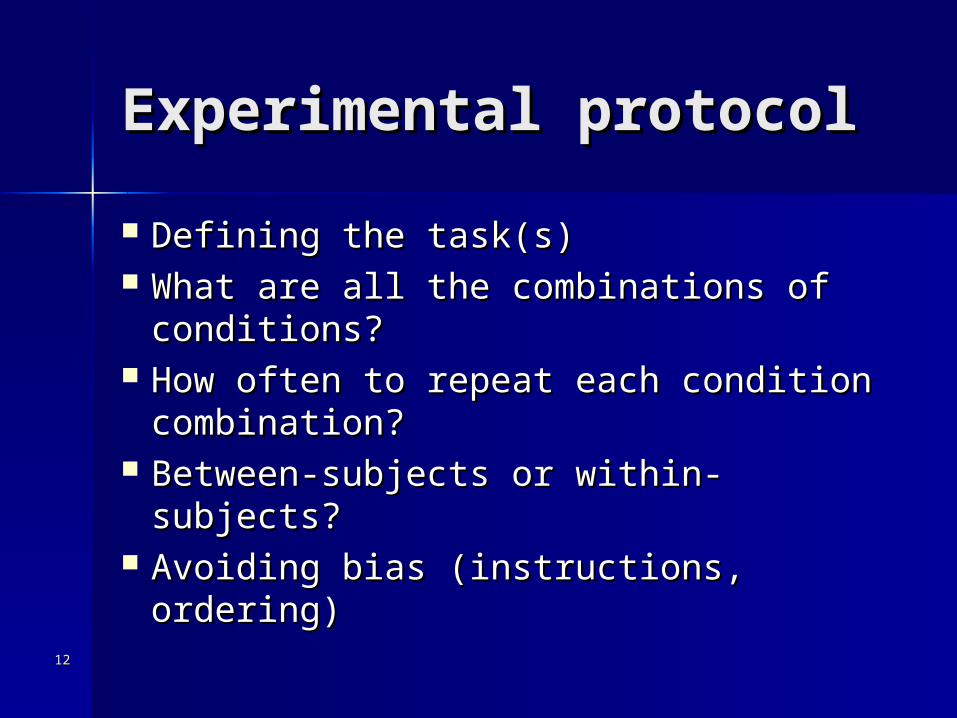
Experimental protocolExperimental protocol
Defining the task(s)Defining the task(s) What are all the combinations of What are all the combinations of
conditions?conditions? How often to repeat each condition How often to repeat each condition
combination?combination? Between-subjects or within-subjects?Between-subjects or within-subjects? Avoiding bias (instructions, ordering)Avoiding bias (instructions, ordering)

1313
TaskTask
Defining task to test hypothesisDefining task to test hypothesis– Pictures will lead to less errors Pictures will lead to less errors – Same time to pick users with and without Same time to pick users with and without
pictures (Hpictures (Ho))– Pictures will lead to higher satisfactionPictures will lead to higher satisfaction
How do you present the task?How do you present the task? Task: Users must select the following Task: Users must select the following
list of people to share application withlist of people to share application with– Jonathan TongJonathan Tong– Christine RobsonChristine Robson– David SunDavid Sun

1414
Motivating user tasksMotivating user tasks
Create scenario, movie plot for Create scenario, movie plot for tasktask– Immerse subject in story that Immerse subject in story that
removes them from “user testing” removes them from “user testing” situationsituation
– Focus subject on goal, system Focus subject on goal, system becomes tool (and more subject to becomes tool (and more subject to critique)critique)

1515
Number of ConditionsNumber of Conditions
Consider all combinations to isolate effects of Consider all combinations to isolate effects of each independent variable:each independent variable:
(2 order) * (2 columns) * (2 format) = 8(2 order) * (2 columns) * (2 format) = 8– Horizontal, 1 columnHorizontal, 1 column picture + textpicture + text– Horizontal, 2 columnHorizontal, 2 column picture + textpicture + text– Vertical, 1 columnVertical, 1 column picture + textpicture + text– Vertical, 2 columnVertical, 2 column picture + textpicture + text– Horizontal, 1 columnHorizontal, 1 column text onlytext only– Horizontal, 2 columnHorizontal, 2 column text onlytext only– Vertical, 1 columnVertical, 1 column text onlytext only– Vertical, 2 columnVertical, 2 column text onlytext only
Adding levels or factors Adding levels or factors exponential exponential combinationscombinations
This can make experiments expensive!This can make experiments expensive!

1616
Reducing conditionsReducing conditions
Vary only one independent Vary only one independent variable at a time variable at a time – But can miss interactionsBut can miss interactions
Factor experiment into series of Factor experiment into series of stepssteps– Prune branches if no significant Prune branches if no significant
effects foundeffects found

1717
Choosing subjectsChoosing subjects
Balance sample reflecting diversity of Balance sample reflecting diversity of target user population (random target user population (random variable)variable)– Novices, expertsNovices, experts– Age groupAge group– GenderGender– CultureCulture
ExampleExample– 30 college-age, normal vision or corrected 30 college-age, normal vision or corrected
to normal, with demographic distributions to normal, with demographic distributions of gender, cultureof gender, culture

1818
Population as variablePopulation as variable
Population as an independent Population as an independent variablevariable– Identifies interactionsIdentifies interactions– Adds conditionsAdds conditions
Population as controlled variablePopulation as controlled variable– Consistency across experimentConsistency across experiment– Misses relevant featuresMisses relevant features
Statistical post-hoc analysis can Statistical post-hoc analysis can suggest need for further studysuggest need for further study– Collect all the relevant demographic infoCollect all the relevant demographic info

1919
Recruiting participantsRecruiting participants
“ “Subject pools”Subject pools”– VolunteersVolunteers– Paid participantsPaid participants– Students (e.g., psych undergrads) for course Students (e.g., psych undergrads) for course
creditcredit– Friends, acquaintances, family, lab membersFriends, acquaintances, family, lab members– ““Public space” participants - e.g., observing Public space” participants - e.g., observing
people walking through a museumpeople walking through a museum Must fit user population (validity)Must fit user population (validity) Motivation is a big factor - not only $$ Motivation is a big factor - not only $$
but also explaining the importance of the but also explaining the importance of the researchresearch

2020
Current events: Current events: Population sampling Population sampling issueissue Currently, election polling conducted on Currently, election polling conducted on
land-lineland-line phones phones– LegacyLegacy– Laws about manual dialing of cell phonesLaws about manual dialing of cell phones– Higher refusal ratesHigher refusal rates– Cell phone users pay for incoming phone Cell phone users pay for incoming phone
callscallshave to compensate recipientshave to compensate recipients What bias is introduced by excluding cell What bias is introduced by excluding cell
phone only users?phone only users?– 7% of population (2004), growing to 15% 7% of population (2004), growing to 15%
(2008) (2008) – Which candidate claims polls underrepresent?Which candidate claims polls underrepresent?
http://www.npr.org/templates/story/story.php?storyId=14863373

2121
Between subjects Between subjects designdesign Different groups of subjects use Different groups of subjects use
different designsdifferent designs– 15 subjects use text only15 subjects use text only
– 15 subjects use text + pictures15 subjects use text + pictures

2222
Within subjects designWithin subjects design
All subjects try all conditionsAll subjects try all conditions
15 subjects
15 subjects

2323
Within Subjects Within Subjects DesignsDesigns More efficient: More efficient:
– Each subject gives you more data - they Each subject gives you more data - they complete more “blocks” or “sessions”complete more “blocks” or “sessions”
More statistical “power”More statistical “power”– Each person is their own control, less Each person is their own control, less
confoundsconfounds Therefore, can require fewer participantsTherefore, can require fewer participants May mean more complicated design to May mean more complicated design to
avoid “order effects”avoid “order effects”– Participant may learn from first conditionParticipant may learn from first condition– Fatigue may make second performance Fatigue may make second performance
worseworse

2424
Between Subjects Between Subjects DesignsDesigns Fewer order effectsFewer order effects Simpler design & analysisSimpler design & analysis Easier to recruit participants (only Easier to recruit participants (only
one session, shorter time)one session, shorter time) Subjects can’t compare across Subjects can’t compare across
conditions conditions – Need more subjectsNeed more subjects– Control more for confoundsControl more for confounds

2525
Within Subjects: Within Subjects: Ordering effectsOrdering effects Countering order effectsCountering order effects
– Equivalent tasks (less sensitive to Equivalent tasks (less sensitive to learning)learning)
– Randomize order of conditions Randomize order of conditions (random variable)(random variable)
– Counterbalance ordering (ensure all Counterbalance ordering (ensure all orderings covered)orderings covered)
– Latin Square ordering (partial Latin Square ordering (partial counterbalancing)counterbalancing)
2626
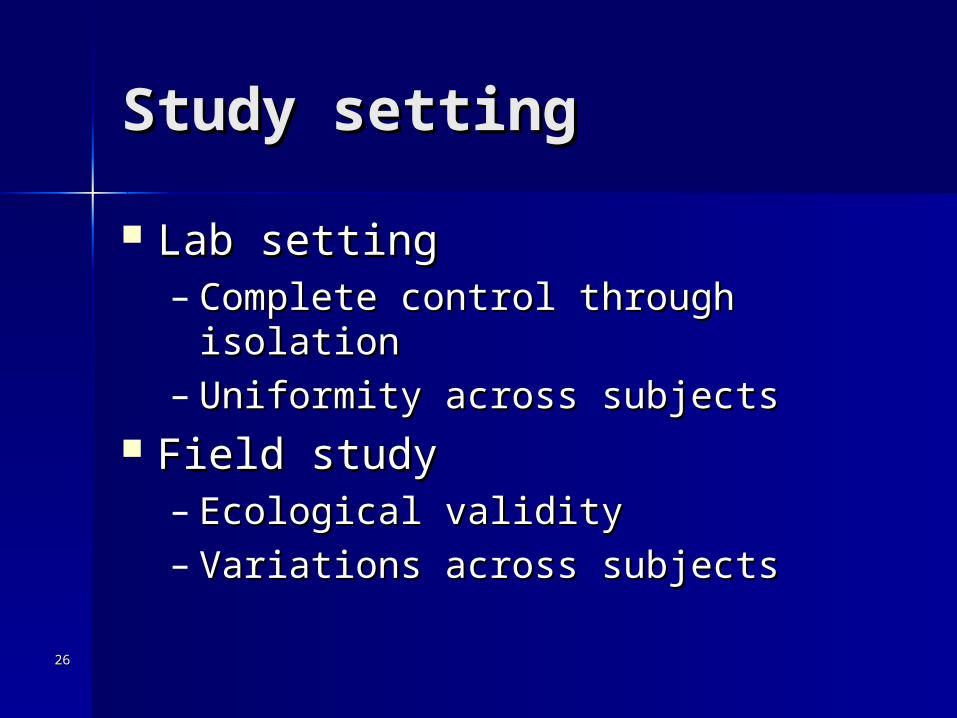
Study settingStudy setting
Lab settingLab setting– Complete control through isolationComplete control through isolation– Uniformity across subjectsUniformity across subjects
Field studyField study– Ecological validityEcological validity– Variations across subjectsVariations across subjects

2727
Before StudyBefore Study
Always pilot test firstAlways pilot test first– Reveals unexpected problemsReveals unexpected problems– Can’t change experiment design after Can’t change experiment design after
collecting datacollecting data Make sure they know you are testing Make sure they know you are testing
software, not themsoftware, not them– (Usability testing, not User testing)(Usability testing, not User testing)
Maintain privacyMaintain privacy Explain procedures without Explain procedures without
compromising resultscompromising results Can quit anytimeCan quit anytime Administer signed consent formAdminister signed consent form

2828
During StudyDuring Study
Always follow same steps—use Always follow same steps—use checklistchecklist
Make sure participant is Make sure participant is comfortablecomfortable
Session should not be too longSession should not be too long Maintain relaxed atmosphereMaintain relaxed atmosphere Never indicate displeasure or Never indicate displeasure or
angeranger

2929
After StudyAfter Study
State how session will help you State how session will help you improve system (“debriefing”)improve system (“debriefing”)
Show participant how to perform failed Show participant how to perform failed taskstasks
Don’t compromise privacy (never Don’t compromise privacy (never identify people, only show videos with identify people, only show videos with explicit permission)explicit permission)
Data to be stored anonymously, Data to be stored anonymously, securely, and/or destroyedsecurely, and/or destroyed

3030
Exercise: Quantitative Exercise: Quantitative testtest Pair up with someone who has Pair up with someone who has
computer, downloaded the filescomputer, downloaded the files DO NOT OPEN THE FILE (yet)DO NOT OPEN THE FILE (yet) Make sure one of you has a Make sure one of you has a
stopwatchstopwatch– Cell phoneCell phone– WatchWatch
Computer user will run test, Computer user will run test, observer will time eventobserver will time event

3131
Exercise: TaskExercise: Task
Open the fileOpen the file Find the item in the listFind the item in the list Highlight that entry like Highlight that entry like thisthis

3232
Example: VariablesExample: Variables
Independent variablesIndependent variables Dependent variablesDependent variables Control variablesControl variables Random variablesRandom variables ConfoundConfound

3333
Data InspectionData Inspection
Look at the resultsLook at the results First look at each participant’s dataFirst look at each participant’s data
– Were there outliers, people who fell Were there outliers, people who fell asleep, anyone who tried to mess up asleep, anyone who tried to mess up the study, etc.?the study, etc.?
Then look at aggregate results Then look at aggregate results and and descriptive statisticsdescriptive statistics
““What happened in this study?”What happened in this study?” relative to hypothesis, goals relative to hypothesis, goals

3434
Descriptive StatisticsDescriptive Statistics
For all variables, get a feel for For all variables, get a feel for results:results:
Total scores, times, ratings, etc.Total scores, times, ratings, etc. Minimum, maximumMinimum, maximum Mean, median, ranges, etc.Mean, median, ranges, etc.What is the
difference between mean & median? Why use one or the other?
e.g. “Twenty participants completed both sessions (10 males, 10 females; mean age 22.4, range 18-37 years).” e.g. “The median time to complete the task in the mouse-input group was 34.5 s (min=19.2, max=305 s).”

3535
Subgroup StatsSubgroup Stats
Look at descriptive stats (means, Look at descriptive stats (means, medians, ranges, etc.) for any medians, ranges, etc.) for any subgroupssubgroups– e.g. “The mean error rate for the e.g. “The mean error rate for the mouse-mouse-
input groupinput group was 3.4%. The mean error was 3.4%. The mean error rate for the rate for the keyboard groupkeyboard group was 5.6%.” was 5.6%.”
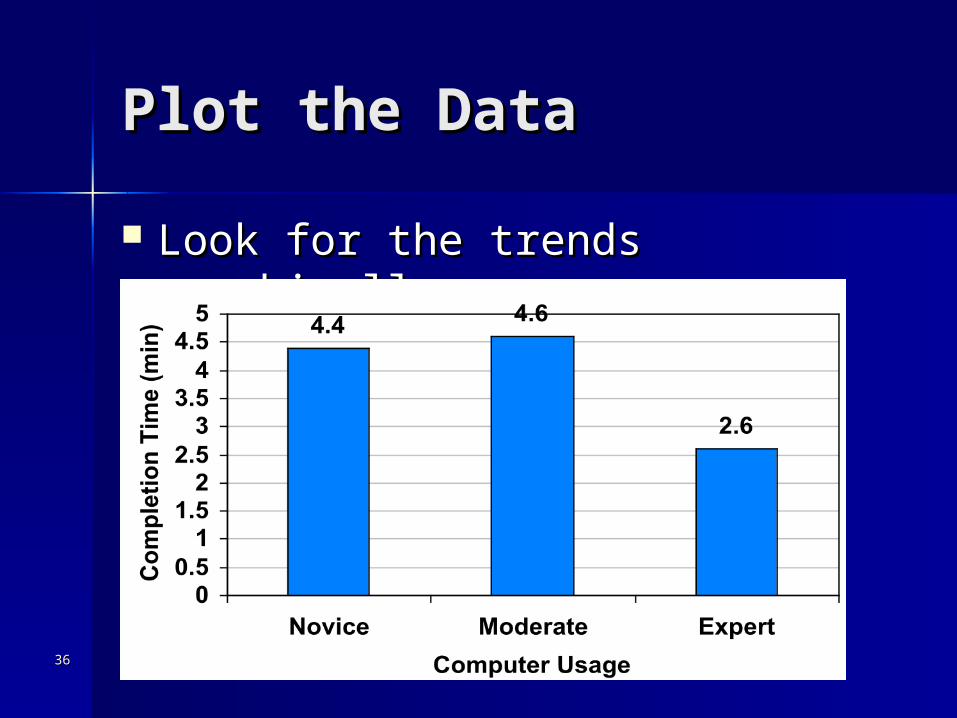
– e.g. “The median completion time (in e.g. “The median completion time (in seconds) for the three groups were: seconds) for the three groups were: novices: 4.4, moderate users: 4.6, and novices: 4.4, moderate users: 4.6, and experts: 2.6.”experts: 2.6.”
3636
Plot the DataPlot the Data
Look for the trends graphicallyLook for the trends graphically

3737
Other Presentation Other Presentation MethodsMethods
0 20
Mean
low highMiddle 50%
Time in secs.
Age
Box plot Scatter plot

3838
Experimental ResultsExperimental Results
How does one know if an How does one know if an experiment’s results mean experiment’s results mean anything or confirm any beliefs?anything or confirm any beliefs?
Example: 40 people participated, Example: 40 people participated, 28 preferred interface 1, 28 preferred interface 1, 12 preferred interface 212 preferred interface 2
What do you conclude?What do you conclude?

3939
Inferential (Diagnostic) Inferential (Diagnostic) StatsStats Tests to determine if what you see in Tests to determine if what you see in
the data (e.g., differences in the the data (e.g., differences in the means) are reliable (replicable), and if means) are reliable (replicable), and if they are likely caused by the they are likely caused by the independent variables, and not due to independent variables, and not due to random effectsrandom effects– e.g. t-test to compare two meanse.g. t-test to compare two means– e.g. ANOVA (Analysis of Variance) to e.g. ANOVA (Analysis of Variance) to
compare several meanscompare several means– e.g. test “significance level” of a e.g. test “significance level” of a
correlation between two variables correlation between two variables

4040
Means Not Always Means Not Always PerfectPerfect
Experiment 1
Group 1 Group 2Mean: 7 Mean: 10
1,10,10 3,6,21
Experiment 2
Group 1 Group 2Mean: 7 Mean: 10
6,7,8 8,11,11

4141
Inferential Stats and Inferential Stats and the Datathe Data
Ask diagnostic questions about the Ask diagnostic questions about the datadata
Are these really different? What would that mean?

4242
Hypothesis TestingHypothesis Testing
Going back to the hypothesis—Going back to the hypothesis—what do the data say?what do the data say?
Translate hypothesis into Translate hypothesis into expected difference in measureexpected difference in measure– If “First name” is faster, thenIf “First name” is faster, then
TimeTimeFirstFirst < Time < TimeLastLast
– If “null hypothesis” there should be If “null hypothesis” there should be no difference between the no difference between the completion timescompletion timesHH00: Time: TimeFirstFirst = Time = TimeLastLast

4343
Hypothesis TestingHypothesis Testing
““Significance level” (p):Significance level” (p):– The probability that your hypothesis was The probability that your hypothesis was
wrong, wrong, simply by chancesimply by chance– The cutoff or threshold level of p (“alpha” The cutoff or threshold level of p (“alpha”
level) is often set at 0.05, or 5% of the time level) is often set at 0.05, or 5% of the time you’ll get the result you saw, just by chanceyou’ll get the result you saw, just by chance
– e.g. If your statistical t-test (testing the e.g. If your statistical t-test (testing the difference between two means) returns a t-difference between two means) returns a t-value of t=4.5, and a p-value of p=.01, the value of t=4.5, and a p-value of p=.01, the difference between the means is difference between the means is statistically significantstatistically significant

4444
ErrorsErrors
Errors in analysis do occurErrors in analysis do occur Main Types:Main Types:
– Type I/False positive - You conclude Type I/False positive - You conclude there is a difference, when in fact there is a difference, when in fact there isn’tthere isn’t
– Type II/False negative - You Type II/False negative - You conclude there is no different when conclude there is no different when there isthere is

4545
Drawing ConclusionsDrawing Conclusions
Make your conclusions based on the Make your conclusions based on the descriptive stats, but back them up with descriptive stats, but back them up with inferential statsinferential stats– e.g., “The expert group performed faster e.g., “The expert group performed faster
than the novice group t(1,34) = 4.6, p < .01.”than the novice group t(1,34) = 4.6, p < .01.” Translate the stats into words that Translate the stats into words that
regular people can understandregular people can understand– e.g., “Thus, those who have computer e.g., “Thus, those who have computer
experience will be able to perform better, experience will be able to perform better, right from the beginning…”right from the beginning…”

4646
Feeding Back Into Feeding Back Into DesignDesign Your study was designed to yield information Your study was designed to yield information
you can use to redesign your interfaceyou can use to redesign your interface What were the conclusions you reached?What were the conclusions you reached? How can you improve on the design?How can you improve on the design? What are quantitative redesign benefits?What are quantitative redesign benefits?
– e.g. 2 minutes saved per transaction, 24% e.g. 2 minutes saved per transaction, 24% increase in production, or $45,000,000 per year in increase in production, or $45,000,000 per year in increased profitincreased profit
What are qualitative, less tangible benefit(s)?What are qualitative, less tangible benefit(s)?– e.g. workers will be less bored, less tired, and e.g. workers will be less bored, less tired, and
therefore more interested --> better customer therefore more interested --> better customer serviceservice

4747
Remote usability Remote usability testingtesting Telephone or video communicationTelephone or video communication Screen-sharing technologyScreen-sharing technology
– Microsoft NetMeetingMicrosoft NetMeetinghttps://www.microsoft.com/downloads/https://www.microsoft.com/downloads/
details.aspx?FamilyID=26c9da7c-f778-4422-details.aspx?FamilyID=26c9da7c-f778-4422-a6f4-efb8abba021e&DisplayLang=ena6f4-efb8abba021e&DisplayLang=en
– VNCVNChttp://www.realvnc.com/http://www.realvnc.com/
Greater flexibility in recruiting Greater flexibility in recruiting subjects, environmentssubjects, environments

4848
Usage loggingUsage logging
Embed logging mechanisms into Embed logging mechanisms into codecode
Study usage in actual deploymentStudy usage in actual deployment Some code can even “phone Some code can even “phone
home”home” facebook usage metricsfacebook usage metrics

4949
Example: Rhythmic Work Example: Rhythmic Work ActivityActivity
• Drawn from about 50 Awarenex (IM) Drawn from about 50 Awarenex (IM) usersusers• Bi-coastal teams (3-hour time Bi-coastal teams (3-hour time
difference)difference)• Work from home team membersWork from home team members
• Based on up to 2 years of collected dataBased on up to 2 years of collected data
Sun Microsystems Laboratories: James "Bo" Sun Microsystems Laboratories: James "Bo" Begole, Randall Smith, and Nicole YankelovichBegole, Randall Smith, and Nicole Yankelovich

5050
Activity Data CollectedActivity Data Collected
• Activity informationActivity information• Input device activity (1-minute Input device activity (1-minute
granularity)granularity)• Device location (office, home, mobile)Device location (office, home, mobile)• Email fetching and sendingEmail fetching and sending
• Online calendar appointmentsOnline calendar appointments
Activity Activity ≠≠ Availability Availability

5151
Computer Activity
Date
Actogram of an Individual's Computer Activity
Time of Day

5252
T
Computer Activity
Aggregate Activity

5353
T
Computer Activity
Appointment
Aggregate Activity with Appointments

5454
Comparing Aggregates Among 3 Comparing Aggregates Among 3 IndividualsIndividuals
a.
b.
c.
Computer Activity
Appointments

5555
Project deployment Project deployment issuesissues May have to be careful about May have to be careful about
widespread deployment of widespread deployment of applicationapplication– We’re only looking for a usability study We’re only looking for a usability study
with 4 peoplewith 4 people– Widespread deployment would be coolWidespread deployment would be cool
BUT, widespread deployment may BUT, widespread deployment may run into provisioning issuesrun into provisioning issues– Provide feedback on server provisioningProvide feedback on server provisioning

5656
Quantitative study of Quantitative study of your projectyour project What are your measures?What are your measures?
– Task measures, performance time, Task measures, performance time, errorserrors
– Usage measures (facebook utilities)Usage measures (facebook utilities) Compute summary statisticsCompute summary statistics
– Discussion sectionDiscussion section Identify independent, dependent, Identify independent, dependent,
control variablescontrol variables

5757
Privacy issues in Privacy issues in collecting user datacollecting user data
Collecting data involves respecting users’ privacyCollecting data involves respecting users’ privacy

5858
Informed consentInformed consent
Legal condition whereby a person Legal condition whereby a person can be said to have given consent can be said to have given consent based upon an appreciation and based upon an appreciation and understanding of the facts and understanding of the facts and implications of an action implications of an action
EULA?EULA? But what about actions in public But what about actions in public
places?places? What about recording in public What about recording in public
places?places?

5959
ConsentConsent
Why important?Why important?– People can be sensitive about this process People can be sensitive about this process
and issues and issues – Errors will likely be made, participant may Errors will likely be made, participant may
feel inadequatefeel inadequate– May be mentally or physically strenuousMay be mentally or physically strenuous
What are the potential risks (there are What are the potential risks (there are alwaysalways risks)? risks)?
““Vulnerable” populations need special Vulnerable” populations need special care & considerationcare & consideration– Children; disabled; pregnant; studentsChildren; disabled; pregnant; students

6060
Controlling data for Controlling data for privacyprivacy What data is being collected?What data is being collected? How will the data be used?How will the data be used? How can I delete data?How can I delete data? Who will have access to the data?Who will have access to the data? How can I review data before public How can I review data before public
presentations?presentations? What if I have questions What if I have questions
afterwards?afterwards?

6161
What datacollected
What activityobserved
Who can access data
How to Delete data
Review before showpublicly
Contact infofor questions
How datawill be used

6262
Human subjects Human subjects review, participants, & review, participants, & ethicsethics Academic, government research must go Academic, government research must go
through human subjects review process through human subjects review process Committee for Protection of Human SubjectsCommittee for Protection of Human Subjects
– http://cphs.berkeley.edu/http://cphs.berkeley.edu/ Reviews all research involving human (or Reviews all research involving human (or
animal) participantsanimal) participants Safeguarding the participants, and thereby the Safeguarding the participants, and thereby the
researcher and universityresearcher and university Not a science review (i.e., not to assess your Not a science review (i.e., not to assess your
research ideas); only safety & ethicsresearch ideas); only safety & ethics Complete Web-based forms, submit research Complete Web-based forms, submit research
summary, sample consent forms, training, etc.summary, sample consent forms, training, etc. Practices in industry varyPractices in industry vary

6363

6464

6565
The participant’s The participant’s perspectiveperspective User testing can be intimidatingUser testing can be intimidating
– Pressure to perform, please observerPressure to perform, please observer– Fear of embarassmentFear of embarassment– Fear of critiquing (cultural)Fear of critiquing (cultural)
You must remain unbiased and You must remain unbiased and invitinginviting
More tips in the “Conducting the More tips in the “Conducting the Test” reading by RubinTest” reading by Rubin

6666
EthicsEthics
Testing can be arduousTesting can be arduous Each participant should consent to Each participant should consent to
be in experiment (informal or formal)be in experiment (informal or formal)– Know what experiment involves, what Know what experiment involves, what
to expect, what the potential risks are to expect, what the potential risks are Must be able to stop without danger Must be able to stop without danger
or penaltyor penalty All participants to be treated with All participants to be treated with
respectrespect

6767
Assignment: Assignment: Storyboard + Storyboard + ImplementationImplementation Create storyboard for main tasks Create storyboard for main tasks
of applicationof application Test with at least one non-CS160 Test with at least one non-CS160
useruser Reflect on what you learnedReflect on what you learned
– How will you change interface?How will you change interface? Implement initiation of facebook Implement initiation of facebook
application and databaseapplication and database

6868
Next timeNext time
Lecture on implementing—Lecture on implementing—hardware, sensorshardware, sensors
Tom Zimmerman, guest lectureTom Zimmerman, guest lecture