1. Enrollment Report Academic and Student Affairs Committee December 1, 2009.
16
1
-
Upload
florence-stone -
Category
Documents
-
view
215 -
download
1
Transcript of 1. Enrollment Report Academic and Student Affairs Committee December 1, 2009.

1

Enrollment Report
Academic and Student Affairs Committee
December 1, 2009

Enrollment Report
• Graduation Rates
• Course Completion
• Strategic Questions
3
4
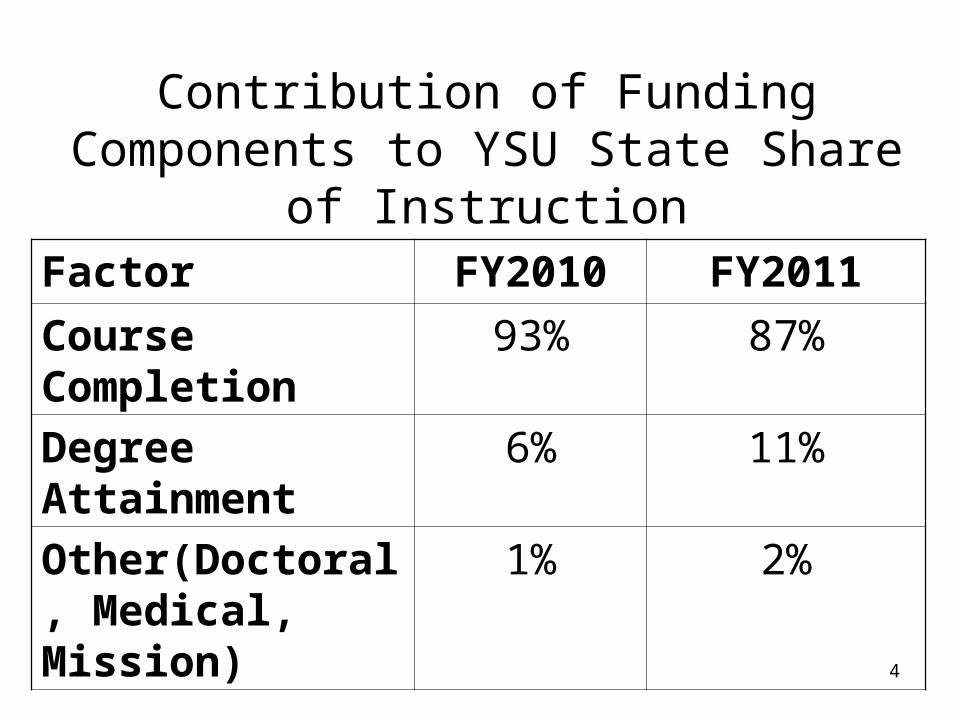
Factor FY2010 FY2011
Course Completion 93% 87%
Degree Attainment 6% 11%
Other(Doctoral, Medical, Mission)
1% 2%
Contribution of Funding Components to YSU State Share of Instruction
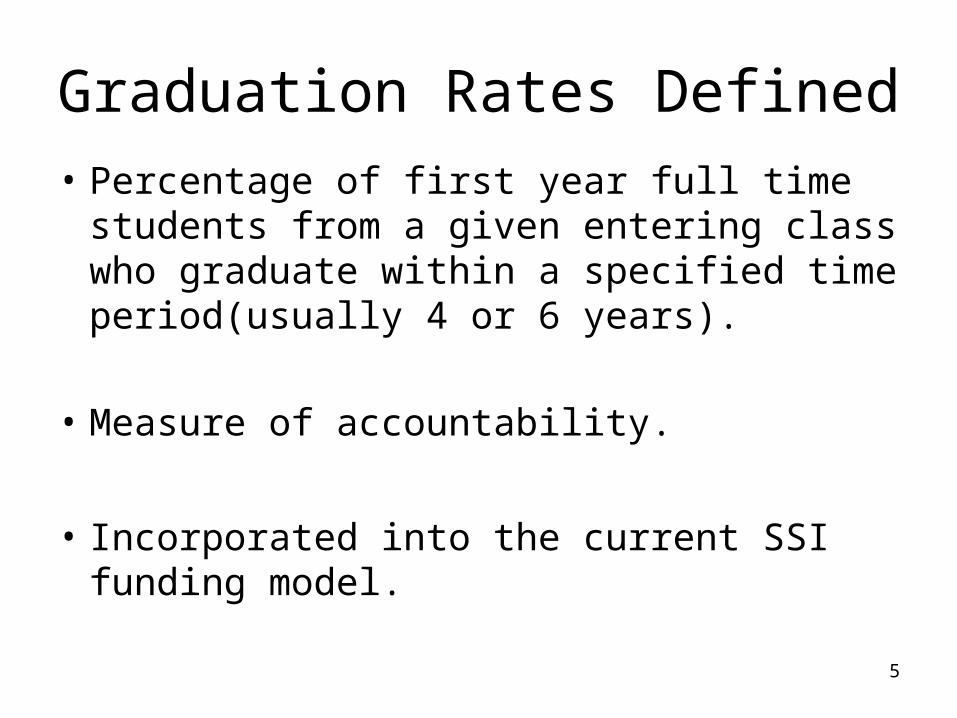
Graduation Rates Defined
• Percentage of first year full time students from a given entering class who graduate within a specified time period(usually 4 or 6 years).
• Measure of accountability.
• Incorporated into the current SSI funding model.
5
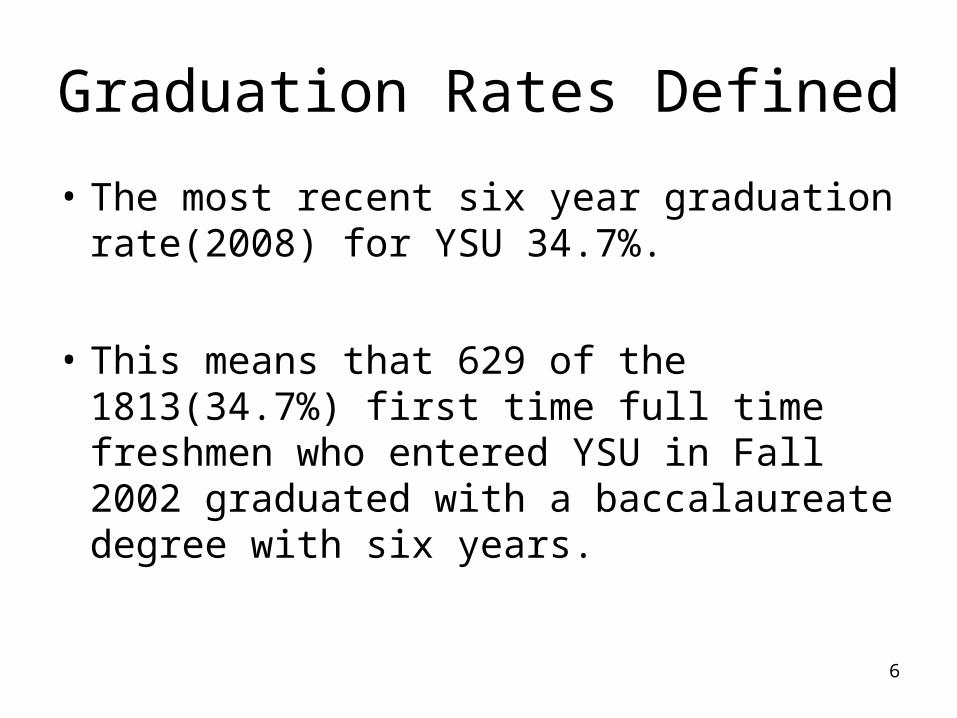
Graduation Rates Defined
• The most recent six year graduation rate(2008) for YSU 34.7%.
• This means that 629 of the 1813(34.7%) first time full time freshmen who entered YSU in Fall 2002 graduated with a baccalaureate degree with six years.
6

YSU Six Year Graduation Rate Trends1993-2002 Entering Classes
Average = 36%Minimum = 33% (1994)Maximum = 38% (1996)
7

Six Year Graduation Rates2001 Entering ClassesOhio Public Universities
ACT Less Than 21
ACT 21-24
ACT Greater Than 24
8
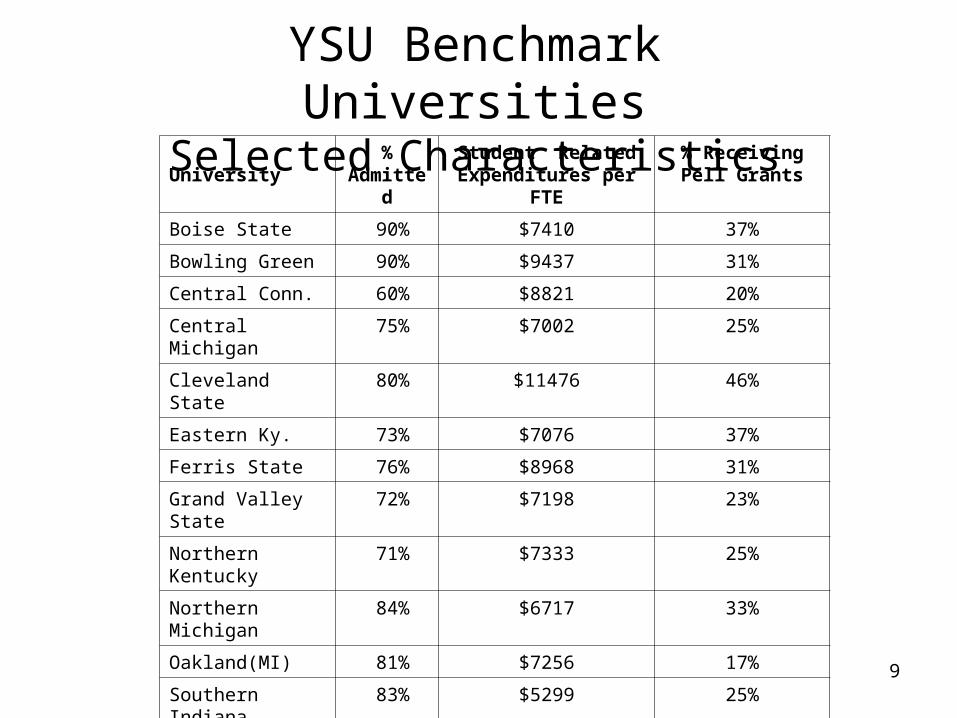
University%
AdmittedStudent Related
Expenditures per FTE% Receiving Pell
Grants
Boise State 90% $7410 37%
Bowling Green 90% $9437 31%
Central Conn. 60% $8821 20%
Central Michigan 75% $7002 25%
Cleveland State 80% $11476 46%
Eastern Ky. 73% $7076 37%
Ferris State 76% $8968 31%
Grand Valley State
72% $7198 23%
Northern Kentucky 71% $7333 25%
Northern Michigan 84% $6717 33%
Oakland(MI) 81% $7256 17%
Southern Indiana 83% $5299 25%
Wisc-Oshkosh 80% $7808 24%
Western Kentucky 100% $6919 38%
Wright State 100% $11853 31%
Youngstown State 100% $7564 44%
YSU Benchmark UniversitiesSelected Characteristics
9
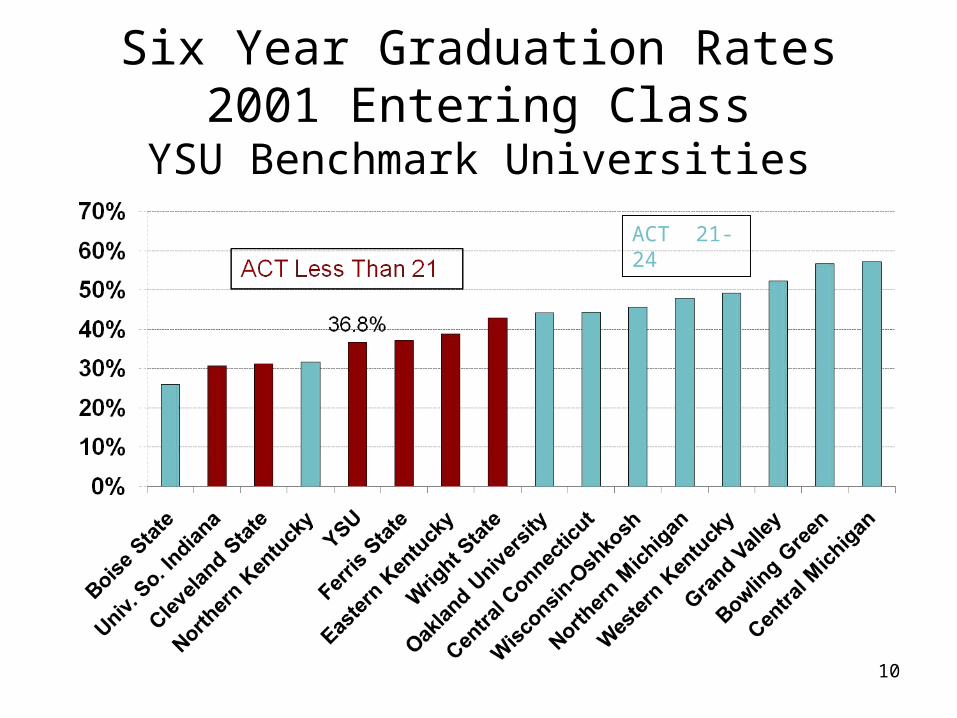
Six Year Graduation Rates2001 Entering Class
YSU Benchmark Universities
ACT 21-24
10
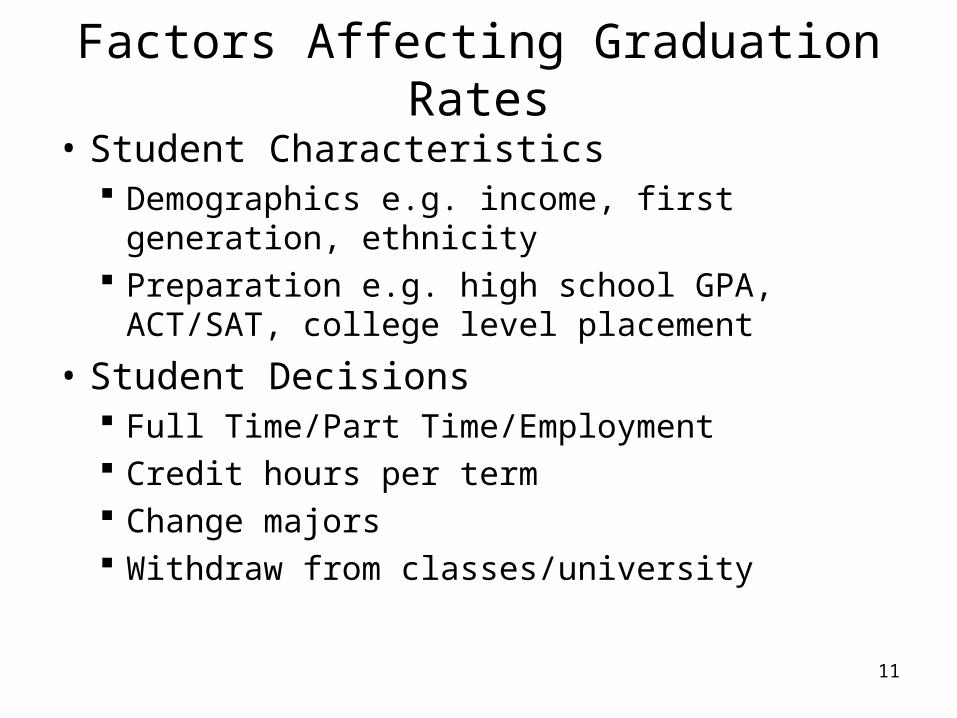
Factors Affecting Graduation Rates
• Student Characteristics Demographics e.g. income, first generation,
ethnicity Preparation e.g. high school GPA, ACT/SAT,
college level placement
• Student Decisions Full Time/Part Time/Employment Credit hours per term Change majors Withdraw from classes/university
11
Factors Affecting Graduation Rates
• Institutional Policies Admissions Standards Graduation Requirements Course Scheduling Advising/Student Support
12

Student Credit Hours and Graduation Rates• Most YSU academic programs require 124 semester hours of course
work.
• To complete 124 semesters hours in 4 years, a student must average between 15 and 16 credit hours each semester.
• To complete 124 semester hours in 6 years, a student must complete between 10 and 11 hours each semester.
• Fall 2008 The average YSU undergraduate successfully completed 10 credit hours. 11% of YSU undergraduates successfully completed 15 or more credit hours.
• Fall 2009 The average YSU undergraduate enrolled for 12 credit hours. 28% of YSU undergraduates enrolled for 15 or more credit hours.
13

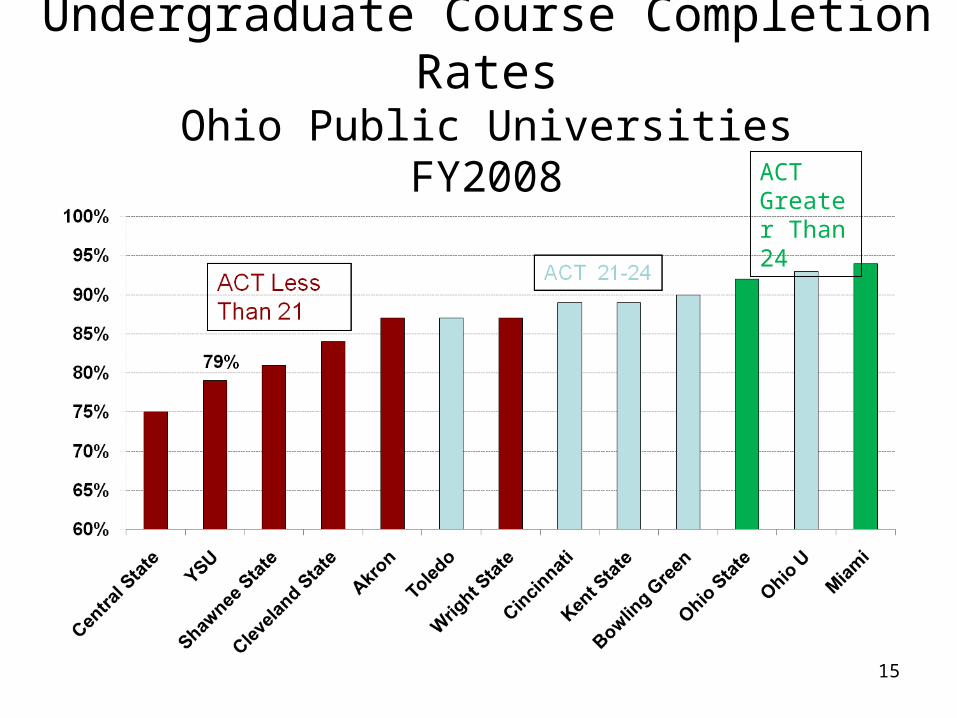
Course Completion Rates
• Percentage of Full Time Equivalent Credit Hours Successfully Completed.
• FY2008 YSU Course Completion Rate 47,349 FTE Credit Hours 37,574 FTE Credit Hours Successfully Completed 79% Course Completion Rate
87% Ohio Public University Average
14
15
Undergraduate Course Completion RatesOhio Public Universities
FY2008ACT Greater Than 24

Strategic Questions
• What graduation rate and course completion rate goals should YSU set?
• What policies / actions should YSU institute to achieve graduation rate and course completion rate goals?
• How much should YSU invest to achieve higher graduation rates and course completion rates?
16