1 Energy Efficient Scheduling of Cloud Application ... · Minxian Xu, Amir Vahid Dastjerdi,...
13
1 Energy Efficient Scheduling of Cloud Application Components with Brownout Minxian Xu, Amir Vahid Dastjerdi, Member, IEEE, and Rajkumar Buyya, Fellow, IEEE Abstract—It is common for cloud data centers meeting unexpected loads like request bursts, which may lead to overloading situation and performance degradation. Dynamic Voltage Frequency Scaling and VM consolidation have been proved effective to manage overload. However, they cannot function when the whole data center is overloaded. Brownout provides a promising direction to avoid overload through configuring applications to temporarily reduce user experience. Additionally, brownout can also be applied to reduce data center energy consumption. As a complementary option for Dynamic Voltage Frequency Scaling and VM consolidation, our combined brownout approach reduces energy consumption through selectively and dynamically deactivating application optional components, which can also be applied to self-contained microservices. The results show that our approach can save more than 25% energy consumption and there are trade-offs between energy saving and discount offered to users. Index Terms—Cloud Data Centers, Energy Efficient, Application Component, Microservices, Brownout ✦ 1 I NTRODUCTION The emergence of cloud computing is viewed as a new paradigm in IT industry [1]. Cloud computing provides compelling features such as pay-as-you-go pricing model, low operation cost, high scalability and easy access. This makes Cloud computing attractive to business owners as it eliminated the requirement for users to plan ahead for provisioning, and allows enterprises to start with minimum and request resources on demand. Providers like Amazon, Microsoft, IBM and Google have established data centers to support cloud applications around the world, and aimed to ensure that their services are flexible and suitable for the needs of the end-users. Energy consumption by the cloud data centers has cur- rently become one of the major problems for the computing industry. The growth and development of complex data- driven applications have promulgated the creation of huge data centers, which heightens the energy consumption [2]. The servers hosted in data centers dissipate more heat and need to be maintained in a fully air-conditioned and engi- neered environment. The cooling system is already efficient, while servers are still one of the major energy consumer. Hence, reducing server energy consumption have become a main concern of researchers [3]. Given the scenario that the budget and resource are limited, overloaded tasks may trigger performance degra- dation and lead the applications to saturate, in which some applications cannot be allocated by provider. Therefore, some users are not served in a timely manner or experience high latencies, others may even not receive service at all [4]. The saturated applications also bring over-utilized situation to hosts and cause high energy consumption. Unfortunately, current resource management approaches like Dynamic • M. Xu, A. V. Dastjerdi and R. Buyya are with Cloud Computing and Distributed Systems (CLOUDS) lab, Department of Computing and Information Systems, University of Melbourne, Australia, 3010 . E-mail: [email protected] Manuscript received ; revised Voltage Frequency Scaling (DVFS) and VM consolidation cannot function when the holistic data center is overloaded. Currently, applications can be constructed via set of self- contained components which are also called microservices. The components encapsulate its content and expose its func- tionality through interfaces, which makes them flexible to be deployed and replaced. With components or microservices, developers and users can benefit from their technological heterogeneity, resilience, scaling, ease of deployment, or- ganizational alignment, composability and optimizing for replaceability [5]. This brings the advantage of more fine- grained control over the application resource consumption. It is common that application components have different priorities to be provided to users. Therefore, not all compo- nents or microservices in an application are mandatory to be functional all the time on hosts. We investigate whether it is feasible to downgrade user experience by disabling part of non-mandatory application components or microservices to relieve the over-utilized condition and reduce energy consumption. Therefore, we take advantage of a paradigm called brownout. It is inspired from the concept of brownout in electric grids. Its original meaning is the voltage shutdown to cope with emergency cases, in which light bulbs emit fewer lights and consumes less power [6]. An brownout example for online shopping system is introduced in [4], the online shopping application provides a recommenda- tion engine to recommend similar products that users may be interested in. The recommendation engine component helps service provider to increase the profits but it is not essential to run the engine. Recommendation engine also requires more resource in comparison to other components. Therefore, with brownout, under overloaded situation, the recommendation engine could be deactivated to serve more clients who requires essential requirements. We consider component-level control in our system model. The model could also be applied to container or microservices architecture. We model the application com- arXiv:1608.02707v1 [cs.DC] 9 Aug 2016
Transcript of 1 Energy Efficient Scheduling of Cloud Application ... · Minxian Xu, Amir Vahid Dastjerdi,...

1
Energy Efficient Scheduling of Cloud ApplicationComponents with Brownout
Minxian Xu, Amir Vahid Dastjerdi, Member, IEEE, and Rajkumar Buyya, Fellow, IEEE
Abstract—It is common for cloud data centers meeting unexpected loads like request bursts, which may lead to overloading situationand performance degradation. Dynamic Voltage Frequency Scaling and VM consolidation have been proved effective to manageoverload. However, they cannot function when the whole data center is overloaded. Brownout provides a promising direction to avoidoverload through configuring applications to temporarily reduce user experience. Additionally, brownout can also be applied to reducedata center energy consumption. As a complementary option for Dynamic Voltage Frequency Scaling and VM consolidation, ourcombined brownout approach reduces energy consumption through selectively and dynamically deactivating application optionalcomponents, which can also be applied to self-contained microservices. The results show that our approach can save more than 25%energy consumption and there are trade-offs between energy saving and discount offered to users.
Index Terms—Cloud Data Centers, Energy Efficient, Application Component, Microservices, Brownout
F
1 INTRODUCTION
The emergence of cloud computing is viewed as a newparadigm in IT industry [1]. Cloud computing providescompelling features such as pay-as-you-go pricing model,low operation cost, high scalability and easy access. Thismakes Cloud computing attractive to business owners asit eliminated the requirement for users to plan ahead forprovisioning, and allows enterprises to start with minimumand request resources on demand. Providers like Amazon,Microsoft, IBM and Google have established data centers tosupport cloud applications around the world, and aimed toensure that their services are flexible and suitable for theneeds of the end-users.
Energy consumption by the cloud data centers has cur-rently become one of the major problems for the computingindustry. The growth and development of complex data-driven applications have promulgated the creation of hugedata centers, which heightens the energy consumption [2].The servers hosted in data centers dissipate more heat andneed to be maintained in a fully air-conditioned and engi-neered environment. The cooling system is already efficient,while servers are still one of the major energy consumer.Hence, reducing server energy consumption have become amain concern of researchers [3].
Given the scenario that the budget and resource arelimited, overloaded tasks may trigger performance degra-dation and lead the applications to saturate, in which someapplications cannot be allocated by provider. Therefore,some users are not served in a timely manner or experiencehigh latencies, others may even not receive service at all [4].The saturated applications also bring over-utilized situationto hosts and cause high energy consumption. Unfortunately,current resource management approaches like Dynamic
• M. Xu, A. V. Dastjerdi and R. Buyya are with Cloud Computing andDistributed Systems (CLOUDS) lab, Department of Computing andInformation Systems, University of Melbourne, Australia, 3010 .E-mail: [email protected]
Manuscript received ; revised
Voltage Frequency Scaling (DVFS) and VM consolidationcannot function when the holistic data center is overloaded.
Currently, applications can be constructed via set of self-contained components which are also called microservices.The components encapsulate its content and expose its func-tionality through interfaces, which makes them flexible to bedeployed and replaced. With components or microservices,developers and users can benefit from their technologicalheterogeneity, resilience, scaling, ease of deployment, or-ganizational alignment, composability and optimizing forreplaceability [5]. This brings the advantage of more fine-grained control over the application resource consumption.
It is common that application components have differentpriorities to be provided to users. Therefore, not all compo-nents or microservices in an application are mandatory tobe functional all the time on hosts. We investigate whetherit is feasible to downgrade user experience by disabling partof non-mandatory application components or microservicesto relieve the over-utilized condition and reduce energyconsumption.
Therefore, we take advantage of a paradigm calledbrownout. It is inspired from the concept of brownout inelectric grids. Its original meaning is the voltage shutdownto cope with emergency cases, in which light bulbs emitfewer lights and consumes less power [6]. An brownoutexample for online shopping system is introduced in [4],the online shopping application provides a recommenda-tion engine to recommend similar products that users maybe interested in. The recommendation engine componenthelps service provider to increase the profits but it is notessential to run the engine. Recommendation engine alsorequires more resource in comparison to other components.Therefore, with brownout, under overloaded situation, therecommendation engine could be deactivated to serve moreclients who requires essential requirements.
We consider component-level control in our systemmodel. The model could also be applied to container ormicroservices architecture. We model the application com-
arX
iv:1
608.
0270
7v1
[cs
.DC
] 9
Aug
201
6

2
ponents as mandatory and optional, if required, optionalcomponents can be deactivated. By deactivating the op-tional components selectively and dynamically, the appli-cation utilization is reduced and eventually total energyconsumption is saved as well. While under market scenario,service provider may provide discount for user as the ser-vices are deactivated.
Our objective is to tackle the problem of energy efficiencyand our contributions are as below:
• Our approach considers the trade-offs between dis-count that should be given to a user if a componentis deactivated and how much of energy can be saved.
• Then we propose number of policies that considerthe aforementioned trade-offs and dynamically makedecisions on which components are going to be de-activated.
The rest of this paper is organized as: Section 2 discussesthe related work on energy efficiency and brownout. Thebrownout enabled system model and problem statement arepresented in Section 3. Section 4 introduces our proposedbrownout enabled approach in details, while the experimen-tal results of proposed approach are illustrated in Section 5.The conclusions along with future work are given in Section6.
2 RELATED WORK
It is an essential requirement for Cloud providers to reduceenergy consumption, as it can both decrease operating costsand improve system reliability. Data centers can consumefrom 10 to 100 times more power per square foot thantypical office building. A large body of literature has focusedon reducing energy consumption in cloud data centers,and the dominant categories for solving this problem areVM consolidation and Dynamic Voltage Frequency Scaling(DVFS) [7]. Server virtualization and VM consolidation havebeen applied in approaches [8] [9] [10]. DVFS techniqueshave been adopted to reduce energy consumption in [11][12] [13].
VM consolidation is regarded to be an act of combininginto an integral whole, which helps minimizing the energyconsumed by allocating work among fewer machines andturning off unused machines [14]. Under this approach,the VMs hosted on underutilized hosts would be consol-idated to other servers and the remaining hosts wouldbe transformed into power-saving state. Mastroianni [8]et al. presented a self-organizing and adaptive approachfor consolidation of VMs CPU and RAM resource, whichis driven by probabilistic processes and local information.Corradi [9] et al. considered VM consolidation in a morepractical viewpoint related to power, CPU and networkingresource sharing and tested VM consolidation in OpenStack,which shows VM consolidation is a feasible solution toreduce energy consumption. Salehi et al. [10] proposed aVM consolidation based approach, which is an adaptiveenergy management policy that preempts VMs to reduce theenergy consumption according to user-specific performanceconstraints and used fuzzy logic for obtaining appropriatedecisions.
The DVFS technique introduces a trade-off between com-puting performance and energy consumed by the server.The DVFS technique lowers the frequency and voltagewhen the processor is lightly loaded, and utilizes maxi-mum frequency and voltage when the processor is heavilyloaded. Von et al. [11] introduced a power-aware schedulingalgorithm based on DVFS-enabled cluster. Kim et al. [12]proposed several power-aware VM schemes based on DVFSfor hard real-time services. Hanumaiah [13] et al. introduceda solution that considers DVFS, thread migration and activecooling to control the cores to maximize overall energyefficiency.
Brownout was originally applied to prevent blackoutsthrough voltage drops in case of emergency. Klein et al. [4]firstly borrowed the approach of brownout and applied it tocloud applications, aiming to design more robust applica-tions under unpredictable loads. Tomas et al. [15] used thebrownout along with overbooking to ensure graceful degra-dation during load spikes and avoid overload. Durango etal. [6] introduced novel load balancing strategies for appli-cations by supporting brownout. In a brownout-compliantapplication or service, the optional parts are identified bydevelopers and a control knob called dimmer that controlsthese optional parts is also exported. The dimmer valuerepresents a certain probability given by a control variableand shows how often these optional parts are executed. Inaddition, a brownout controller is also required to adjust thedimmer value to avoid overload [15].
To the best of our knowledge, our approach is the firstresearch to reduce energy consumption with brownout atcomponents level, which also considers revenues for cloudservice provider. Our approach provides a complementaryoption apart from VM consolidation and DVFS.
3 PROBLEM STATEMENT
In this section, we explain our system model and state theproblem we aim to tackle.
3.1 System ModelOur system model (Fig. 1) includes entities such as users,applications and cloud providers and they are discussedbelow:
Users: Users submit services requests to cloud data cen-ters to process. User entities contain user id and requestedapplications (services) information.
Applications: The application entities in our modelcome into system together with user entities. The applica-tions consist of a number of components, which are taggedas mandatory or optional.
Mandatory component: The mandatory component arealways running (activated) when the application is exe-cuted.
Optional component: The optional component can beset as activated or deactivated. These components haveparameters like utilization and discount (penalty paymentamount). Utilization indicates the amount of reduced uti-lization, and discount represents the price that is cut. Thedeactivation and activation of optional components are con-trolled by the brownout controller, which makes decisionbased on system status and component selection policies.

3
The components can also be connected, which meansthat they communicate with each other and there are datadependencies between them. Therefore, we consider that ifa component is deactivated, then all its connected optionalcomponents would also be set as deactivated. For examplein Fig. 1, if Com3 in Application #1 is deactivated, Com2should also be deactivated; in Application #n, if Com4 isdeactivated, Com3 should also be deactivated, but Com2 isstill working (Com1 is connected with Com3, but Com1 ismandatory, so it is not deactivated).
Cloud Providers: Cloud providers offer resources tomeet service demands, which host a set of VMs or containersto run applications.
Fig. 1. System Model with Brownout
3.2 Power Model
To calculate the total energy consumption of data center, weadopt the server power model proposed by Zheng et al. [16].The server power consumption is modeled as:
P serveri =
{P idlei +
∑wij=1 u(VMi,j)× P dynamic
i , wi > 0
0 , wi = 0
P serveri is composed of idle power and dynamic power. The
idle power is regarded as constant and the dynamic poweris linear to the total utilization of all the VMs on that server.If no VM is hosted on a server, the server can be turned offto save power. VMi,j refers to the jth VM on the ith server,wi means the number of VMs assigned to server i.
u(VMi,j) =
Aj∑c=1
u(Appc) (1)
The utilization of VMi,j is represented as u(VMi,j), whichis computed by summing up all the application utilization onthe jth VM. The c is the component id and Aj is the number ofapplication components.
3.3 Discount Amount
Di =
wi∑j=1
d(VMi,j) (2)
In equation (2), Di is the total discount amount obtainedfrom all VMs, in which the individual discount d(VMi,j)from VMi,j is the sum of all application components discountamount d(Appc) as shown in equation (3).
d(VMi,j) =
Aj∑c=1
d(Appc) (3)
Aj is the number of applications hosted on VMj , andd(VMi,j) is the discount happened from VMj on serveri, and Di is the total discount amount on server i.
3.4 Constraints and Objectives
While the above equations subject to the following con-straints:
M∑i=1
wi = N (4)
wi∑j=1
u(VMi,j) ≤ 1, ∀i ∈ [1,M ] (5)
N is the total number of VMs and M is the total numberof servers. Equation (4) represents the total number of VMsassigned to hosts equals to the sum of VMs. Equation (5)represents the sum of all the VMs utilization cannot surpasstheir host available utilization.
We formulate the objectives of this problem as:
min
M∑i=1
P serveri (6)
As well as
min(
M∑i=1
Di) (7)
Therefore, we aim at investigating the trade-off total energyconsumption and discount amount.
To measure the performance of an algorithm, we nor-malize the reduced energy and discount amount as 0 to 1 torepresent the algorithm efficiency Effpa:
Effpa =Epa
Eb+Dpa (8)
where Epa is the energy consumption of proposed algo-rithm, Eb is the baseline algorithm energy consumption,Dpa is the discount amount offered by the proposed algo-rithm. If the proposed algorithm saves more energy thanbaseline algorithm, Epa
Ebis a value between 0 to 1, and Dpa
is normalized between 0 to 1. Thus, the smallerEffpa is, themore energy is reduced and less discount amount is offered.

4
Algorithm 1 Energy Efficient with Brownout Algorithm (EEBA)Input: hostList with size hostNum, vmList with size vmNum, application components information, component selection
strategy, power thresholdOutput: total energy consumption, discount amount, number of shutting down hosts
1: powerThreshold TP ← 0.8; dimmerValue θ← 0; //Default power threshold and dimmer value2: deactivatedComponentList← NULL3: while true do4: ni ← number of hosts surpasses the power threshold at time interval i5: if ni > 0 then6: θi ← =
√ni
hostNum7: for all host in hostList do8: if (hostPower > (TP × hostMaxPower)) then9: hostPowerShouldBeReduced← θi × hostPower
10: utilizationShoudBeReduced← calculate(hostPowerShouldBeReduced, powerModel)11: utilizationOfVMShoudBeReduced← calculate(utilizationShoudBeReduced, vmList)12: deactivatedComponentList← componentSelectionPolicy(utilizationOfVMShoudBeReduced)13: end if14: end for15: else16: activateComponent(deactivatedComponentList)17: end if18: using PCO algorithm VM consolidation to optimize VM placement19: end while
4 PROPOSED APPROACH
Prior to brownout approach, we require a VM placementand consolidation strategy. We adopt the placement andconsolidation algorithm (PCO) proposed by Beloglazov etal. [17]. Then we propose our brownout enabled algorithmbased on PCO and introduce a number of componentselection policies considering component utilization anddiscount.
4.1 VM Placement and Consolidation Algorithm (PCO)The VM placement and consolidation (PCO) algorithm is anadaptive heuristics for dynamic consolidation of VMs andextensive experiments show that it can significantly reduceenergy consumption. In the VM placement phase, PCOsorts all the VMs in decreasing order of their current CPUutilization and allocates each VM to the host that increasesthe least power consumption due to this allocation. In theVM consolidation phase, PCO optimizes VM placementaccording to loads of hosts. PCO separately picks VMs fromover-utilized and under-utilized hosts to migrate, and findsnew placements for these VMs. After migration, the over-utilized hosts are not overloaded any more and the under-utilized hosts are switched to sleep mode.
4.2 Energy Efficient Brownout Enabled Algorithm(EEBA)Our proposed energy efficient brownout enabled approach(it is noted as EEBA in the following contents) is anenhanced approach based on PCO algorithm. Accordingto host power consumption, the brownout controller willdynamically deactivate or activate applications’ optionalcomponents on VMs, which could reduce the power con-sumption of hosts.
As shown in Algorithm 1, EEBA mainly consists of 5steps:
Before entering the approach procedures, serviceprovider firstly needs to initialize parameters like powerthreshold and dimmer value (line 1). The power thresholdis a value for checking whether a host is overloaded, and asmentioned in related work, the dimmer value is a controlknob used to determine the adjustment degree of powerconsumption. An empty componentDeactivateList storingdeactivated components is also initialized (line 2).
1) Checking all hosts and counting the hosts that abovepower threshold (line 4);
2) Adjusting dimmer value according to the numberof hosts surpassing power threshold (line 6). The dimmervalue is set as
√ni
hostNum , where ni is the number of hostsabove power threshold, and hostNum is the total numberof hosts in the system.
The dimmer value is 1 when all the hosts are overloadedand it means brownout controls components on all thehosts. The dimmer value is 0 when no host is overloadedand brownout is not triggered. The dimmer adjustmentapproach shows that dimmer value varies along with thenumber of overloaded hosts.
3) Calculating the utilization should be reduced of VMson overloaded host (lines 8-11). According to the dimmervalue, EEBA calculates reduced host power amount. Thenthe VM utilization reduction is computed as ui based onhost power model.
4) Applying component selection policy to find and de-activate components (line 12). According to VM utilizationreduction ui, component selection policy is responsible forfinding the components satisfying the utilization constraint,deactivating these components and their connected ones,and updating total discount amount. As applications mayhave multiple optional components with different utiliza-tion and discount amount, we have designed several com-ponents selections policies:
Nearest Utilization First Component Selection Pol-

5
Algorithm 2 Component Selection Policy: Lowest Utilization First Component Selection Policy (LUFCS)Input: utlizationOfVMShouldBeReduced uOutput: deactivatedComponentList
1: Sort the component lists based on utilization parameter in ascending order //Other policies may change the sortingapproach at this line. If there are connected components, the connected components are treated together and sorted bytheir average utilization
2: disabledTagSet← NULL3: if optionalComponentList[0].getUtilizaton() ≥ u then4: put optionalComponentList[0] into deactivateComponentList5: add optionalComponentList[0].getTag into disabledTagSet6: for all component comp in optionalComponentList do7: if disabledTagSet.contains(comp.getTag()) is TRUE then8: put comp into deactivateComponentList9: update discount amount
10: end if11: end for12: else13: location index p← 014: for index = 0; index < optionalComponentList.size(); index++ do15: tempUtilization1← 0, tempUtilization2← 016: for i = 0; i < index - 1; i ++ do17: tempUtilization1 = tempUtilization1 + optionalComponentList[i].getUtilization()18: end for19: tempUtilization2 = tempUtilization1 + optionalComponentList[i + 1].getUtilization()20: if (tempUtilization1 < u) & (tempUtilization2 > u) then21: if (tempUtilization1 - u) ≤ (u− tempUtilization2) then22: p = index - 123: else24: p = index25: end if26: break27: end if28: end for29: for i = 0; i < p; i++ do30: put optionalComponentList[i] into deactivateComponentList31: add optionalComponentList[i].getTag into disabledTagSet32: end for33: for all component comp in optionalComponentList do34: if disabledTagSet.contains(comp.getTag()) is TRUE then35: put comp as deactivated into deactivateComponentList36: add comp.getTag() into disabledTagSet37: update discount amount38: end if39: end for40: end if41: return deactivatedComponentList
icy (NUFCS): The objective of NUFCS is finding a singlecomponent in the component list to deactivate. The singlecomponent has the nearest utilization to ui in comparisonto other components. NUFCS can find and deactivate thegoal component in O(n) time, which is efficient in onlinescheduling.
If the deactivated component is connected with othercomponents, NUFCS also deactivates other connected com-ponents. NUFCS runs fast and can reduce utilization, but ifui is much larger than all the single component utilization inthe component list, more components should be deactivatedto achieve energy reduction goal. Therefore, we propose
another 3 component selection policies to achieve utilizationconstraints by selecting multiple components:
Lowest Utilization First Component Selection Policy(LUFCS): LUFCS selects component from the componentwith the lowest utilization. This policy follows the assump-tion that the component with less utilization is less impor-tant for users. Hence, with this policy, the service providerdeactivates a number of components with low utilization tosatisfy the utilization constraint.
Lowest Price First Component Selection Policy(LPFCS): LPFCS selects component from the componentwith lowest discount. This policy focuses more on discount

6
and its objective is deactivating a number of componentswith less discount amount and satisfying the utilizationconstraint.
Highest Utilization and Price Ratio First ComponentSelection Policy (HUPRFCS): HUPRCS selects componentconsidering component utilization and discount together. Itsobjective is deactivating the components with higher utiliza-tion and smaller discount. Therefore the service providersaves more energy while offering less discount amount.
Algorithm 2 shows an example about how the compo-nent selection policy works. The example is about LUFCS:the input of the algorithm is the expected configured uti-lization u and the output is the deactivated componentslist. a) Algorithm 2 sorts the optional components list basedon component utilization parameter in ascending sequence(line 1), therefore, the component with lowest utilization isput at the list head. For connected components, the sortingprocess is modified as treating the connected componentstogether and using their average utilization for sorting,which lowers the priority of deactivating connected com-ponents to avoid deactivating too many components due toconnections; b) Algorithm 2 deactivates the first componentand its connected components if it satisfies the utilizationconstraint (lines 3-11). If the first component utilization pa-rameter value is above u, Algorithm 2 puts this componentinto deactivated components list and puts its connectionparameter (a tag shows how it is connected with other com-ponents) into the set that stores the deactivated connectionparameter. After that, Algorithm 2 finds other connectedcomponents and put them into deactivated components list.The end of this step is summing up the deactivated compo-nents discount amount; c) If the first component utilizationdoes not satisfy the utilization constraint, Algorithm 2 findsa position index in components list (lines 13-28). The sublistbefore index-1 is the last sublist that makes its componentsutilization sum less than u, and the sublist that before indexis the first sublist that makes its components utilization sumlarger than u. The policy selects the sublist with utilizationsum closer to the u from these two sublists; d) Algorithm2 puts all the components in the sublist into deactivatedcomponents list and puts their connection parameters intotags set (lines 29-32); e) Algorithm 2 finds other connectedcomponents and puts them into deactivated componentslist, and updates the discount amount (lines 33-40); f) Fi-nally, Algorithm 2 returns the deactivated components list(line 41).
The LPFCS and HUPRCS procedures are quite similarto LUFCS except the sorting process at line 1. For example,the LPFCS sorts the optional components list according tocomponent discount, while HUPRFCS sorts the optionalcomponents list based on component utilization and dis-count ratio. For connected components, these policies alsotreat them together and use their discount or utilization anddiscount ratio to sort.
5) In EEBA, if no host is above the power threshold, thealgorithm activates the optional components that have beenset as deactivated (line 16).
The EEBA algorithm takes effect between the VM place-ment and VM consolidation in PCO. After VMs are placedby PCO algorithm in the first time interval, then in the fol-lowing time intervals, if no host is above the power thresh-
TABLE 1Host Types and Capacity
Name CPU Cores Memory Bandwidth StorageType 1 1.86 GHz 2 4 GB 1 Gbit/s 100 GBType 2 2.66 GHz 2 4 GB 1 Gbit/s 100 GB
TABLE 2VM Types and Capacity
Name CPU Cores Memory Bandwidth StorageType 1 2.5 GHz 1 870 MB 100 Mbit/s 1 GBType 2 2.0 GHz 1 1740 MB 100 Mbit/s 1 GBType 3 1.0 GHz 1 1740 MB 100 Mbit/s 1 GBType 4 0.5 GHz 1 613 MB 100 Mbit/s 1 GB
old, the EEBA does not work. Otherwise, the brownoutis triggered, and then the number of VM migration andnumber of active hosts are influenced in the VM consolida-tion process (line 18), which finally changes the total powerconsumption.
The complexity of our proposed algorithm at each timeinterval is calculated based on two phases, one is thebrownout phase and the other is the VM consolidationphase. At each time interval, the complexity of the brownoutphase is O(m ∗ N), where m is the maximum number ofcomponents in all applications, N is the number of hosts.The complexity of the VM consolidation phase is O(2N),where N is the number of hosts. The complexity at eachtime interval of our proposed algorithm is the sum of thetwo phase, which is to O((2 +m) ∗N).
5 PERFORMANCE EVALUATION
5.1 Environment Setting
We use the CloudSim framework [18] to simulate a clouddata center, with 400 hosts and 800 VMs. Two types ofhosts and four types of VMs are modeled based on currentofferings in EC2 as shown in Table 1 and Table 2. The powermodels of hosts we adopted are derived from IBM Systemx3550 M3 with CPU Intel Xeon X5670 and X5675 [19].
The application modeled in CloudSim is based in a classcalled cloudlet. We have extended the cloudlet to modelapplication with optional components, and each componenthas its corresponding CPU utilization, discount amount,and connection parameter.
Our experiments are simulated under one-day durationand brownout is invoked every 5 minutes if hosts powersurpasses the power threshold. To create an overloadedenvironment, we define the workload requires 85% to 100%resource, which means an application with this type ofworkload occupies 85% to 100% CPU resource on VM. Ifthe CPU resource is measured with capacity of runninginstructions and a VM has 1000 million instructions persecond (MIPS) computation capacity, then the applicationconstantly requires 0.85 × 1000 = 850 MI to 1.0 × 1000 =1000 MI per second in the 5 minutes.
To reflect the impact of different configurations, weinvestigate a set of parameters as shown in Table 3:
1) Optional component threshold utilization: it repre-sents the threshold portion of utilization that is optional

7
TABLE 3Parameter Configurations for Testing
Parameters P1: Optional componentthreshold utilization
P2: Percentage ofoptional Components
P3: Percentage ofconnected components P4: Discount
Range 0% to 100% 0% to 100% 0% to 100% 0% to 100%Categories 20%, 40%, 60%, 80%, 100% 20%, 40%, 60%, 80%, 100% 20%, 40%, 60%, 80%, 100% varying with P1
TABLE 4A Testcase Example
Testcase ID Optional componentthreshold utilization
Percentage ofoptional Components
Percentage ofconnected components Discount
TC1 40% 60% 20% 40%
and can be reduced by deactivating optional components.An optional component with 10% utilization means 10% ofapplication utilization is reduced if it is set as deactivated.We adjust this parameter from 0% to 100% and categorize itas 20%, 40%, 60%, 80% and 100%.
2) Percentage of optional components: it represents howmany components of the total components are optional.Assuming the number of all components is numcom andthe number of optional components is numopt, then the per-centage of optional components is numopt
numcom. This parameter
varies from 0% to 100% and is categorized as 20%, 40%, 60%,80% and 100%.
3) Percentage of connected components: it representshow many components are connected among all the com-ponents. Assuming the number of connected components isnumconnected, then the percentage of connected componentsis numconnected
numcom. This parameter varies from 0% to 100% and
is categorized as 20%, 40%, 60%, 80% and 100%.4) Discount: It represents the discount amount that is
paid back to user if the component is deactivated. Weassume that application maximum discount is identical tothe optional component threshold utilization, for example20% optional component threshold utilization comes alongwith 20% discount.
According to Table 3, Table 4 shows a testcase withconfigured parameters, the optional component thresholdutilization is configured as 40%, the percentage of optionalutilization is configured as 60%, the percentage of connectedcomponents is set as 20% and the discount is 40%.
Table 5 demonstrates an application components ex-ample fits the configurations in Table 4. This applicationconsists of 10 components: 4 of them (40%) are optionalcomponents. Each component has different utilization, dis-count and connected relationship with other components:the optional component threshold utilization is 40% (thesum utilization of component 7, 8, 9 and 10), there are 2components (20%) of all components are connected (compo-nent 7 and 8) and the total discount of optional componentsis 40%.
5.2 Results and AnalysisIn this section, we compare performance of EEBA with
different component selection policies. The benchmark is thePCO algorithm described in Section 4.1.
We consider two component design patterns accordingto component utilization and discount. One pattern is that
TABLE 5An Application Component Example1
ComponentsID
Mandatory /Optional Utilization Discount Connected
Comp 1 Mandatory 10% 10% N/AComp 2 Mandatory 10% 10% N/AComp 3 Mandatory 10% 20% N/AComp 4 Mandatory 10% 5% N/AComp 5 Mandatory 12% 5% N/AComp 6 Mandatory 8% 10% N/AComp 7 Optional 5% 5% Comp8Comp 8 Optional 8% 10% Comp7Comp 9 Optional 12% 10% N/AComp 10 Optional 15% 15% N/A
components are designed with uniform or approximate uti-lization and discount, which means that each component isdesigned to require same or approximate resource amount,like there are 10 components and each component requires10% utilization and offers 10% discount. We define thecomponents as approximate if their utilization standarddeviation and discount standard deviation are both lessthan 0.1. Under this design pattern, our proposed policiesLUFCS, LPFCS and HUPRFCS select the same components,so we focus on comparing PCO, NUFCS and LUFCS polices,which represent algorithm without brownout, EEBA withsingle component selection policy and EEBA with multiplecomponents selection policy respectively. Another pattern isthat components utilization and discount are conspicuousdifferent, which means the components are designed torequire quite different resource. We define the componentsas different if either their utilization standard deviationor discount standard deviation is large than 0.1. In thisdesign pattern, we focus on comparing the LUFCS, LPFCSand HUPRFCS policies to evaluate performance of differentmultiple components selection policies.
Additionally, to investigate the effects of individual com-ponents scheduling and connected components scheduling,we run our experiments for components without connec-tions and connected components separately.
5.2.1 Components without Connections1) Varying Optional Component Utilization Threshold
Fig. 2 shows the comparison between PCO, NUFCS,LUFCS polices when components are approximate by vary-ing optional utilization threshold (the percentage of optional

8
Fig. 2. Comparison by Varying Optional Utilization Threshold for Approximate Components
Fig. 3. Comparison by Varying Optional Utilization Threshold for Different Components
Fig. 4. Comparison by Varying Optional Component Percentage for Approximate Components
components is fixed as 60%). Fig. 2a shows the energyconsumption of these three policies respectively. NUFCSand LUFCS can save more energy when the optional compo-nent utilization threshold is larger. However, more discountamount is also offered to users according to Fig. 2b. Thereason lies in that Fig 2c and Fig 2d demonstrate thatmore utilization amount is disabled in NUFCS and LUFCS,and more hosts are shutdown by these policies, whichcontributes to more energy reduction. We use NUFCS with20% optional utilization threshold and NUFCS with 100%optional utilization threshold to compare the number ofshutdown hosts with PCO, which shows the maximum andminimum number of shutdown hosts in this series of exper-iments. The number of shutdown hosts of other experimentsfalls between the LUFCS-20% and LUFCS-100% lines in Fig2d. In these cases, NUFCS reduces 5% to 13% energy andLUFCS reduces 8% to 28% energy while 1% to 8% and 7%to 35% discount amount are offered respectively.
Fig. 3 shows LUFCS, LPFCS and HUPRFCS policies ef-fects on energy and discount amount when components aredifferent and optional utilization threshold increases, moreenergy is reduced and more discount amount is paid. As
Fig. 3a and Fig. 2a illustrate, when components are different,LUFCS cannot save as much energy as when componentsare approximate. For example, LUFCS-100% in Fig 3a showsit reduces maximum 17% energy (the dotted line representsPCO energy consumption), while LUFCS-100% in Fig. 2asaves 28% energy. Therefore, our proposed policies workbetter when components are designed with approximateresource requirement, which also shows the value of properdesign of components or microservices. According to Fig. 3aand Fig. 3b, LUFCS reduces the maximum energy but alsooffers the maximum discount amount, which gives LUFCS< LPFCS < HUPRFCS in energy and LUFCS > LPFCS >HUPRFCS in discount amount. This reflects more utilizationamount is disabled and more hosts are shutdown in LUFCSas shown in Fig. 3c and Fig. 3d. The different effects betweenthese polices come from the LUFCS selects componentswithout considering discount, as it can select as many com-ponents as possible until achieving utilization constraint.While other two policies consider discount amount and donot deactivate as many components as in LUFCS.
2) Varying Percentage of Optional ComponentsFig 4 shows the results when components are approxi-

9
Fig. 5. Comparison by Varying Optional Component Percentage for Different Components
Fig. 6. Comparison by Varying Percentage of Connected Components for Approximate Components
Fig. 7. Comparison by Varying Percentage of Connected Components for Different Components
mate by varying percentage of optional components (the op-tional component threshold utilization is fixed as 60%). Fig.4a and Fig. 4b illustrate that in NUFCS and LUFCS, more en-ergy is saved and more discount amount is offered with theincrease of optional components, which results from moreoptions of components can be selected. In comparison toPCO, NUFCS saves 3% to 11% energy and offers maximum5% discount amount, and LUFCS saves 9% to 25% energybut offers 9% to 40% discount amount. As shown in Fig.4c and Fig. 4d, compared with NUFCS, LUFCS disablesabout 5-10 times utilization amount and more than 100 hostsaveragely.
Fig. 5 compares LUFCS, LPFCS, HUPRFCS policies fordifferent components when varying the percentage of op-tional components. The results in Fig. 5a and Fig 5b showthat these polices save more energy when optional compo-nents increases, and show LUFCS < LPFCS < HUPRFCS inenergy as well as LUFCS > LPFCS > HUPRFCS in discountamount. As demonstrated in Fig. 5c and Fig. 5d, LUFCSdisables more utilization amount than other two policiesand shuts down the maximum number when with 100%optional components.
Although LUFCS with 100% optional components savesabout 25% and 20% energy for approximate componentsand different components respectively, it is not recom-mended to set all components as optional since too muchdiscount amount is offered. We will discuss polices selectionconsidering the trade-offs in the Section 5.2.3.
5.2.2 Connected ComponentsAfter investigating the components without connections, wemove to investigate connected components. As mentionedin Algorithm 2, in these cases, our proposed polices treatthe connected components together and use their averageutilization or discount to sort. Fig. 6 shows the PCO, NUFCSand LUFCS for approximate components when varying thepercentage of connected components (optional componentthreshold utilization and percentage of optional compo-nents are both fixed as 60%). Fig. 6a shows that connectedcomponents affects the NUFCS impressively. The energyconsumption drops heavily in NUFCS when percentageof connected components increases, i.e., from 9% to 25%reduction. While in LUFCS, the connected components donot affect its performance significantly. Although the energy

10
Fig. 8. Energy Consumption Comparison by Varying Percentage of Connected Components and Optional Component Utilization Threshold
Fig. 9. Discount Amount Comparison by Varying Percentage of Connected Components and Optional Component Utilization Threshold
Fig. 10. Disabled Utilization Amount Comparison by Varying Percentage of Connected Components and Optional Component Utilization Threshold
consumption is also reduced when percentage of connectedcomponents increases, energy consumption drops slowlyfrom 18% to 25%. When 100% components are connected,NUFCS and LUFCS produce same effects. As shown in Fig.6b, with the increase of connected components, discountamount increases fast from 8% to 27% in NUFCS whileslowly in LUFCS from 16% to 27%. NUFCS and LUFCS bothoffer same discount amount when all the components areconnected. For the cases that save more energy, like NUFCSor LUFCS with 100% connected components, Fig. 6c andFig. 6d show that more utilization amount is disabled andmore hosts are shutdown in these cases than cases with lessconnected components.
Fig .7 illustrates LUFCS, LPFCS and HUPRFCS for differ-ent components when varying the percentage of connectedcomponents. Fig. 7a shows that when connected compo-nents are larger than 60%, these policies do not result insignificant differences, this is due to when percentage ofconnected components increases, similar deactivated com-ponent list is obtained although these components maybe put into the list in different orders by these policies.Apparent differences for discount amount and disabled
utilization amount are illustrated in Fig. 7a and Fig. 7bwhen connected components are less than 60%, like LUFCSreduces 2% to 5% energy than LPFCS and 4% to 12% energythan HUPRFCS, LUFCS offers 4% to 10% more discountthan LPFCS and 9% to 15% more discount amount thanHUPRFCS. When all the components are connected, thesethree policies shut down the same number of hosts. Thus,our proposed multiple components selection policies worksbetter under components with lower connected percentageup to 60%, which enables to provide multiple choices forservice provider rather than providing same effects.
To evaluate the effects of combined parameters, we varypercentage of connected components and optional com-ponent utilization threshold together. We choose optionalcomponent utilization threshold, as this parameter showsmore significant effects than percentage of optional compo-nent in energy and discount. Fig. 8 to 10 demonstrate theenergy consumption, discount amount and disabled utiliza-tion amount separately when varying these two parameterstogether. Each subfigure is with fixed optional componentthreshold utilization and variable percentage of connectedcomponents, for example, Fig. 8a represents energy con-
11
TABLE 6Recommended Policies for Components without Connections under Different Configurations
ComponentsDesign Pattern
DiscountConstraint
Optional ComponentUtilization Threshold
Percentage ofOptional Components
RecommendedPolicy
ApproximateComponents
≤ 10% ≤100% ≤100% NUFCS>10% LUFCS
DifferentComponents
≤10% ≤100%≤ 40% LUFCS40%-60% LPFCS>60% HUPRFCS
>10%≤40%
≤100%LUFCS
40%-60% LPFCS>60% HUPRFCS
TABLE 7Recommended Policies for Connected Components under Different Configurations
ComponentsDesign Pattern
DiscountConstraint
Percentage ofConnected Components
Optional ComponentUtilization Threshold
OptionalComponents
RecommendedPolicy
ApproximateComponents
≤20% ≤100% ≤100% ≤100% NUFCS>20% LUFCS
Differentcomponents
≤10% ≤20% ≤100% ≤100% LPFCS>20% HUPRFCS
10%-20% ≤40% ≤40% ≤100% LUFCS>40% HUPRFCS
>40% ≤100% ≤100% HUPRFCS
20%-30% ≤60% ≤60% ≤100% LPFCS>60% HUPRFCS
>60% ≤100% ≤100% HUPRFCS>30% ≤100% ≤100% ≤100% HUPRFCS
sumption when optional component threshold utilizationis 20% and percentage of connected component is variedfrom 20% to 100%. Fig. 8 shows that energy is reducedwhen connected components increases or larger optionalcomponent utilization is given. For the compared policies,LUFCS, LPFCS and HUPRFCS show similar results whenoptional component threshold utilization is below 20% orpercentage of connected components is above 60%. Thisis due to when optional component threshold utilizationis low, the disabled utilization is quite close for differentpolicies, and higher percentage of connected componentscontributes to deactivating the same list of components. Forother cases that show significant differences in energy withdifferent policies, the results are given as LUFCS ≤ LPFCS≤ HUPRFCS. In these cases, Fig. 9 and Fig. 10 also showthat LUFCS > LPFCS > HUPRFCS in discount amount anddisabled utilization.
In the following, we summarize suitable polices underdifferent configurations to achieve better energy efficiencyand less discount amount.
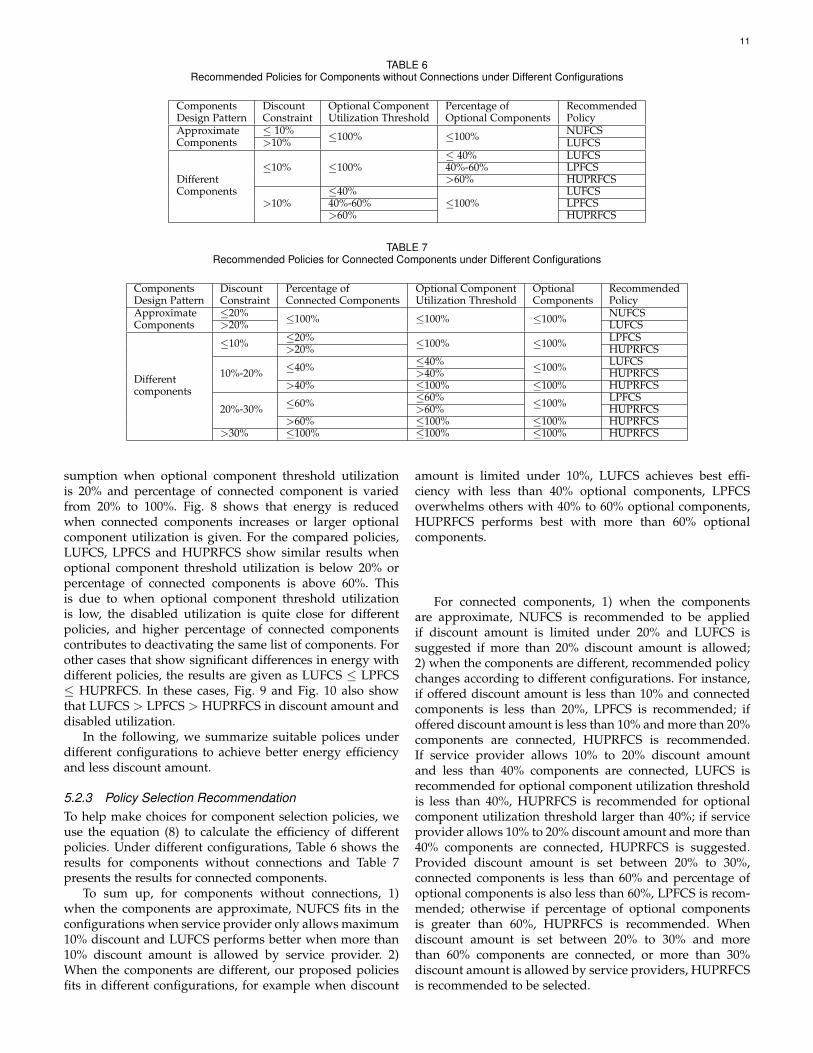
5.2.3 Policy Selection RecommendationTo help make choices for component selection policies, weuse the equation (8) to calculate the efficiency of differentpolicies. Under different configurations, Table 6 shows theresults for components without connections and Table 7presents the results for connected components.
To sum up, for components without connections, 1)when the components are approximate, NUFCS fits in theconfigurations when service provider only allows maximum10% discount and LUFCS performs better when more than10% discount amount is allowed by service provider. 2)When the components are different, our proposed policiesfits in different configurations, for example when discount
amount is limited under 10%, LUFCS achieves best effi-ciency with less than 40% optional components, LPFCSoverwhelms others with 40% to 60% optional components,HUPRFCS performs best with more than 60% optionalcomponents.
For connected components, 1) when the componentsare approximate, NUFCS is recommended to be appliedif discount amount is limited under 20% and LUFCS issuggested if more than 20% discount amount is allowed;2) when the components are different, recommended policychanges according to different configurations. For instance,if offered discount amount is less than 10% and connectedcomponents is less than 20%, LPFCS is recommended; ifoffered discount amount is less than 10% and more than 20%components are connected, HUPRFCS is recommended.If service provider allows 10% to 20% discount amountand less than 40% components are connected, LUFCS isrecommended for optional component utilization thresholdis less than 40%, HUPRFCS is recommended for optionalcomponent utilization threshold larger than 40%; if serviceprovider allows 10% to 20% discount amount and more than40% components are connected, HUPRFCS is suggested.Provided discount amount is set between 20% to 30%,connected components is less than 60% and percentage ofoptional components is also less than 60%, LPFCS is recom-mended; otherwise if percentage of optional componentsis greater than 60%, HUPRFCS is recommended. Whendiscount amount is set between 20% to 30% and morethan 60% components are connected, or more than 30%discount amount is allowed by service providers, HUPRFCSis recommended to be selected.
12
6 CONCLUSIONS AND FUTURE WORK
Brownout has been proven effectively to solve overloadedsituation in cloud data centers. Additionally, brownout canalso be applied to reduce energy consumption. We modelthe brownout enabled system model by considering appli-cation components, which are either mandatory or optional.In the model, the brownout controller can deactivate theoptional components to reduce data center energy con-sumption while offering discount to users. We propose abrownout enabled algorithm to determine when to usebrownout and how much utilization on host is reduced.Then we present a number of policies to select componentsand investigate their effects on energy consumption anddiscount offering.
In our experiments, we consider different configurations,such as components without connections, connected com-ponents, approximate components, different componentsand other parameters, like optional components utilizationthreshold, percentage of optional components and percent-age of connected components. The results show that theseproposed policies save more energy than the baseline algo-rithm PCO. The comparison for proposed policies demon-strates that these policies fit in different configurations. Con-sidering the discount amount offered by service provider,NUFCS is recommended when a small amount of discount(like less than 10%) is offered, as it can reduce maximum15% energy consumption. When more discount amount(like more than 10%) is allowed by service provider, othermultiple components selection polices are recommended,for example, HUPRFCS saves more than 20% energy with10% to 15% discount amount.
As for future work, to avoid ineffective deactivation, weplan to investigate Markov Decision Process (MDP) to de-termine whether the energy consumption would be reducedif some components are deactivated. By using MDP, we aimto find and deactivate the most effective components.
ACKNOWLEDGMENTS
This work is supported by China Scholarship Council (CSC),Australia Research Council Future Fellowship and Discov-ery Project Grants.
REFERENCES
[1] R. Buyya, C. S. Yeo, and S. Venugopal, “Market-oriented cloudcomputing: Vision, hype, and reality for delivering it services ascomputing utilities,” in 10th IEEE International Conference on HighPerformance Computing and Communications, 2008, pp. 5–13.
[2] T. Kaur and I. Chana, “Energy efficiency techniques in cloudcomputing: A survey and taxonomy,” ACM Computing Surveys(CSUR), vol. 48, no. 2, p. 22, 2015.
[3] M. Pedram, “Energy-efficient datacenters,” IEEE Transactions onComputer-Aided Design of Integrated Circuits and Systems, vol. 31,no. 10, pp. 1465–1484, 2012.
[4] C. Klein, M. Maggio, K.-E. Arzen, and F. Hernandez-Rodriguez,“Brownout: building more robust cloud applications,” in Proceed-ings of the 36th International Conference on Software Engineering, 2014,pp. 700–711.
[5] S. Newman, Building Microservices. ” O’Reilly Media, Inc.”, 2015.[6] J. Durango, M. Dellkrantz, M. Maggio, C. Klein, A. V. Pa-
padopoulos, F. Hernandez-Rodriguez, E. Elmroth, and K.-E.Arzen, “Control-theoretical load-balancing for cloud applicationswith brownout,” in 53rd IEEE Conference on Decision and Control,2014, pp. 5320–5327.
[7] N. J. Kansal and I. Chana, “Cloud load balancing techniques:A step towards green computing,” IJCSI International Journal ofComputer Science Issues, vol. 9, no. 1, pp. 238–246, 2012.
[8] C. Mastroianni, M. Meo, and G. Papuzzo, “Probabilistic consoli-dation of virtual machines in self-organizing cloud data centers,”IEEE Transactions on Cloud Computing, vol. 1, no. 2, pp. 215–228,2013.
[9] A. Corradi, M. Fanelli, and L. Foschini, “Vm consolidation: Areal case based on openstack cloud,” Future Generation ComputerSystems, vol. 32, pp. 118–127, 2014.
[10] M. A. Salehi, P. R. Krishna, K. S. Deepak, and R. Buyya,“Preemption-aware energy management in virtualized data cen-ters,” in 5th International Conference on Cloud Computing (CLOUD),2012, pp. 844–851.
[11] G. Von Laszewski, L. Wang, A. J. Younge, and X. He, “Power-aware scheduling of virtual machines in dvfs-enabled clusters,” inIEEE International Conference on Cluster Computing and Workshops,2009, pp. 1–10.
[12] K. H. Kim, A. Beloglazov, and R. Buyya, “Power-aware provision-ing of virtual machines for real-time cloud services,” Concurrencyand Computation: Practice and Experience, vol. 23, no. 13, pp. 1491–1505, 2011.
[13] V. Hanumaiah and S. Vrudhula, “Energy-efficient operation ofmulticore processors by dvfs, task migration, and active cooling,”IEEE Transactions on Computers, vol. 63, no. 2, pp. 349–360, 2014.
[14] J. E. Pecero, H. J. F. Huacuja, P. Bouvry, A. A. S. Pineda, M. C. L.Loces, and J. J. G. Barbosa, “On the energy optimization for prece-dence constrained applications using local search algorithms,” inInternational Conference on High Performance Computing and Simula-tion (HPCS), 2012, pp. 133–139.
[15] L. Tomas, C. Klein, J. Tordsson, and F. Hernandez-Rodrıguez, “Thestraw that broke the camel’s back: safe cloud overbooking withapplication brownout,” in International Conference on Cloud andAutonomic Computing, 2014, pp. 151–160.
[16] K. Zheng, X. Wang, L. Li, and X. Wang, “Joint power optimizationof data center network and servers with correlation analysis,”in IEEE INFOCOM 2014-IEEE Conference on Computer Communi-cations, 2014, pp. 2598–2606.
[17] A. Beloglazov, J. Abawajy, and R. Buyya, “Energy-aware resourceallocation heuristics for efficient management of data centers forcloud computing,” Future generation computer systems, vol. 28,no. 5, pp. 755–768, 2012.
[18] R. Buyya, R. Ranjan, and R. N. Calheiros, “Modeling and simula-tion of scalable cloud computing environments and the cloudsimtoolkit: Challenges and opportunities,” in International Conferenceon High Performance Computing & Simulation, 2009, pp. 1–11.
[19] “Standard performance evaluation corporation.” [Online]. Avail-able: http://www.spec.org/power-ssj2008/results/res2010q2/
Minxian Xu received the BSc degree in 2012and the MSc degree in 2015, both in softwareengineering from University of Electronic Sci-ence and Technology of China. He is workingtowards the PhD degree at the Cloud Computingand Distributed Systems (CLOUDS) Laboratory,Department of Computing and Information Sys-tems, the University of Melbourne, Australia. Hisresearch interests include resource schedulingand optimization in cloud computing.
13
Amir Vahid Dastjerdi is a Research Fellow withthe Cloud Computing and Distributed Systems(CLOUDS) Laboratory at the University of Mel-bourne. His current research interests includeCloud service coordination, scheduling, and re-source provisioning using optimization, machinelearning, and artificial intelligence techniques.
Rajkumar Buyya is professor and future fellowof the Australian Research Council, and the di-rector of the Cloud Computing and DistributedSystems (CLOUDS) Laboratory at the Universityof Melbourne, Australia. He is also serving as thefounding CEO of Manjrasoft, a spin-off companyof the University, commercializing its innovationsin Cloud Computing. He has authored more than425 publications and four text books includingMastering Cloud Computing published by Mc-Graw Hill and Elsevier/Morgan Kaufmann, 2013
for Indian and international markets, respectively. He is one of the highlycited authors in computer science and software engineering worldwide.Microsoft Academic Search Index ranked him as the worlds top authorin distributed and parallel computing between 2007 and 2012. Softwaretechnologies for grid and cloud computing developed under his lead-ership have gained rapid acceptance and are in use at several aca-demic institutions and commercial enterprises in 40 countries aroundthe world.
![IEEE Life Cycle Standards and the CMMI Implementation Considerations · 2017-05-19 · [IEEE 1998] IEEE 1062, IEEE Recommended Practice for Software Acquisition [IEEE 2005] IEEE 15288,](https://static.fdocuments.us/doc/165x107/5e740ab442e6042c3d2f498e/ieee-life-cycle-standards-and-the-cmmi-implementation-considerations-2017-05-19.jpg)