
1 ECA Technology Absorption and Technological Development: What Can We Learn from Patent Data? Lee...
26
1 ECA Technology Absorption and Technological Development: What Can We Learn from Patent Data? Lee Branstetter Carnegie Mellon University and NBER June 17, 2008
-
Upload
homer-lamb -
Category
Documents
-
view
214 -
download
0
Transcript of 1 ECA Technology Absorption and Technological Development: What Can We Learn from Patent Data? Lee...

1
ECA Technology Absorption and Technological Development:What Can We Learn from Patent Data?
Lee BranstetterCarnegie Mellon University and NBER
June 17, 2008

2
Quote from a skeptic: Paul Krugman
“…knowledge flows, by contrast, are invisible; theyleave no paper trail by which they may be measuredor tracked, and there is nothing to prevent the theoristfrom assuming anything about them that she likes.”
- P. Krugman, Geography and Trade, 1991

3
WRONG!
Patents provide rich information on technological development, even in “follower” countries
And (some) patents can even provide direct measures of technology absorption
Patents can be quite useful in filling in the gaps in our knowledge surrounding technological development and technology absorption in ECA and other developing regions
4
The two faces of R&D
Seminal paper by Cohen and Levinthal
Argued that technology absorption requires active learning effort on the part of recipient firms
Most successful technology absorbers invest in the technology they seek to understand
Investments in “absorptive capacity”

5
The pyramid of technological development
6
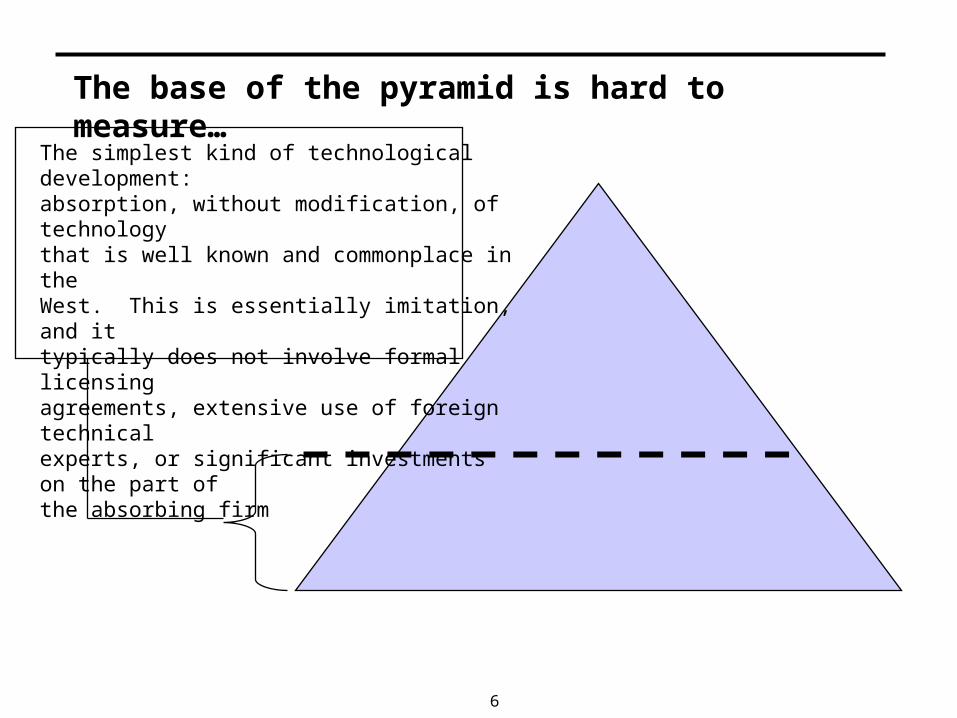
The base of the pyramid is hard to measure…
The simplest kind of technological development:absorption, without modification, of technologythat is well known and commonplace in the West. This is essentially imitation, and it typically does not involve formal licensingagreements, extensive use of foreign technicalexperts, or significant investments on the part ofthe absorbing firm

7
But measurement gets easier as absorption gets more sophisticated. . .
More sophisticated firms will strategically invest in the absorption of foreign technology,and modify it to fit the local context. This willrequire incremental innovation on the part of the absorbing firm. Firms and industries at thisstage will often engage in formal technologylicensing and the use of external consultants.They will also generate incremental inventions,some of which may be patented.
8
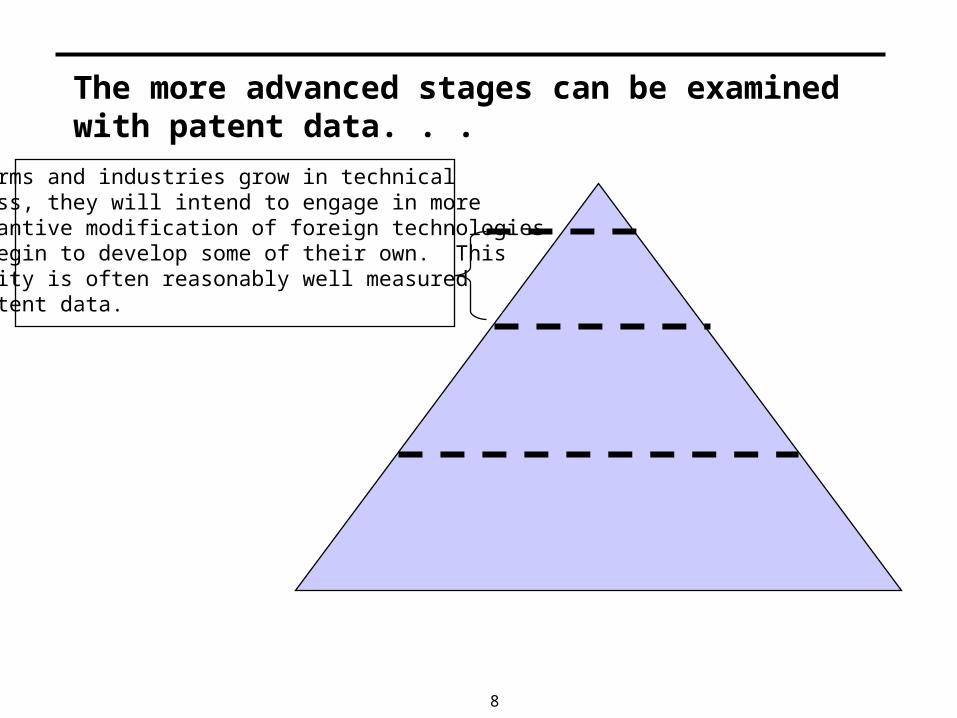
The more advanced stages can be examined with patent data. . .
As firms and industries grow in technical prowess, they will intend to engage in moresubstantive modification of foreign technologiesand begin to develop some of their own. This activity is often reasonably well measured by patent data.
9
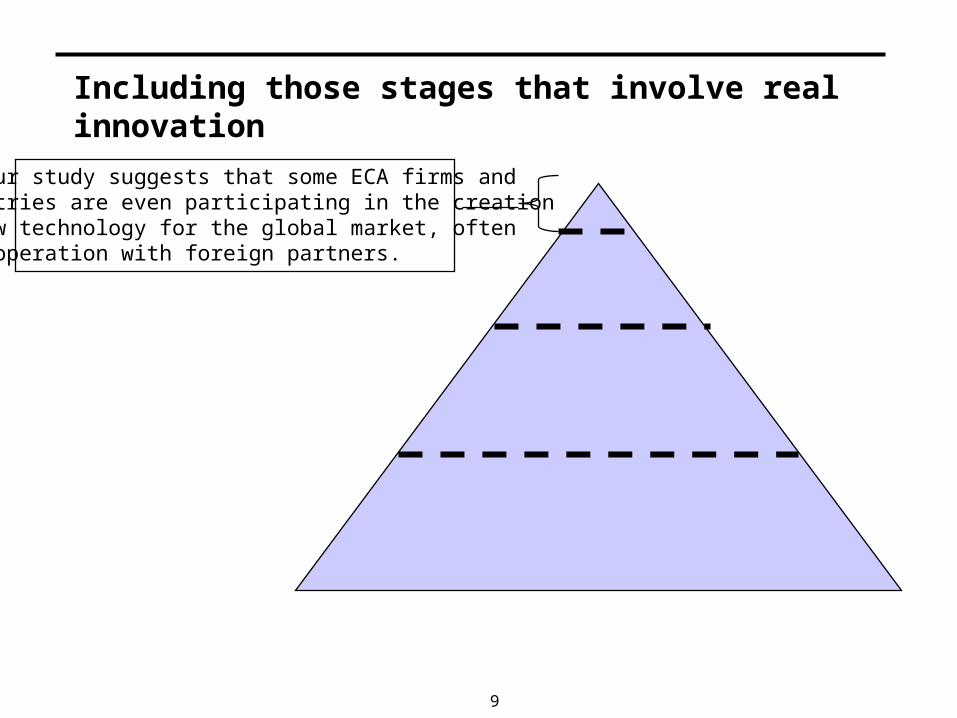
Including those stages that involve real innovation
And our study suggests that some ECA firms andindustries are even participating in the creationof new technology for the global market, oftenin cooperation with foreign partners.
10
Most patents represent “incremental” innovation
Nonspecialists often believe patents are reserved for “breakthrough” inventions
But, even in the West, the vast majority of patented inventions are quite incremental in nature
This has been demonstrated by expert studies of the technical content of patents as well as studies of the distribution of patents’ economic value.
11
The most successful “technological followers” engaged in vigorous incremental invention at an early stage
Even in the mid-1960s, Japan was already generating large numbers of (mostly) incremental patents
As Taiwan and Korea followed in Japan’s footsteps, they began to ramp up their patenting rapidly in the 1980s and early 1990s
More recently, India and China have substantively increased their patenting
The World Bank has used patents to study the technological development of other developing regions

12
Patents as an indicator of knowledge absorption and technological development in ECA
Careful examination of ECA-generated patents provides a detailed look into the absorption/innovation process
Can view trends over time
Can see where ECA absorption and incremental innovation is concentrated in geographic space and technology space
Inventors and firms are named in patent documents
Patent citations link ECA inventions to the foreign and local knowledge upon which the inventor builds

13
ECA patenting in the EPO, 1978-2004
ECA Patenting at the EPO, 1978-2004
0
200
400
600
800
1000
1200
1978
1979
1980
1981
1982
1983
1984
1985
1986
1987
1988
1989
1990
1991
1992
1993
1994
1995
1996
1997
1998
1999
2000
2001
2002
2003
2004

14
U.S. patent grants for ECA, China, and India
Figure 2.4: U.S. Patent Grants for the ECA 7 vs. India and China
0
200
400
600
800
1000
1200
1993 1994 1995 1996 1997 1998 1999 2000 2001 2002 2003 2004 2005 2006
Year patent granted
Num
ner o
f U.S
. pat
ent g
rant
s
ECA 7
India
China
Source: Authors’ calculations based on the U.S. Patent and Trademark Office Cassis CD-ROM, December 2006 version.
Note: The graph compares counts of patents in which at least one inventor is based in one of seven ECA countries, India, or China. The ECA-7 are Russia, Hungary, Poland, Slovenia, the Czech Republic, Bulgaria, and Ukraine.
15
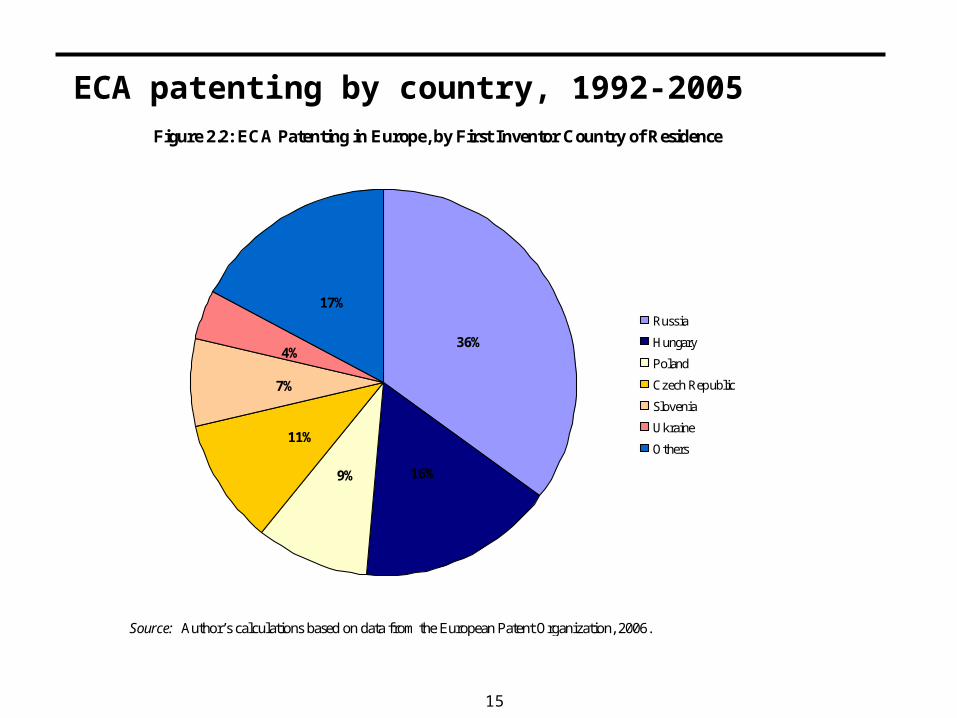
ECA patenting by country, 1992-2005Figure 2.2: ECA Patenting in Europe, by First Inventor Country of Residence
36%
16%9%
11%
7%
4%
17%Russia
Hungary
Poland
Czech Republic
Slovenia
Ukraine
Others
Source: Author’s calculations based on data from the European Patent Organization, 2006.
16
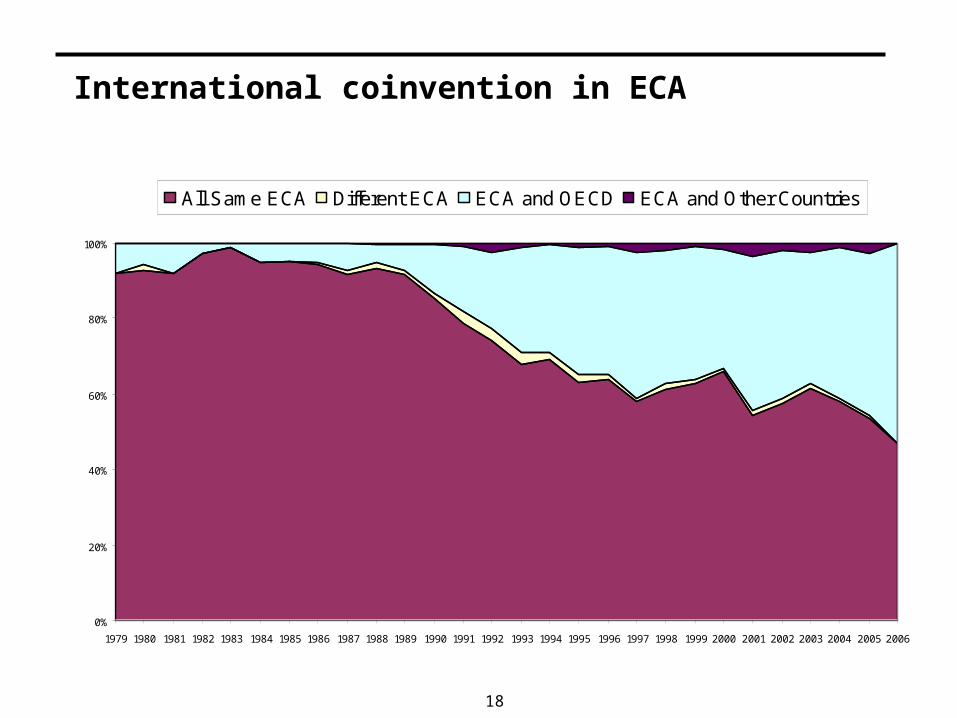
“International coinvention” is increasingly important in ECA patenting
A large fraction of ECA patents are made up of multinational inventor teams
We call this phenomenon “international coinvention”
Much of it takes place under the auspices of Western multinationals
Are ECA inventors increasingly participating in an international division of R&D labor?
We also see growth in international coinvention in India and China

17
International coinvention in the ECA 7
Figure 2.5: The Expanding Role of International Coinvention in the ECA 7
0
100
200
300
400
500
600
700
1993 1995 1997 1999 2001 2003 2005
Year patent granted
Num
ner o
f U.S
. pat
ent g
rant
s
Total patents
Purely indigenous patents
Source: Authors’ calculations based on the U.S. Patent and Trademark Office Cassis CD-ROM, December 2006 version.
Note: The graph tracks total counts of patents in which at least one inventor is based in one of seven ECA countries: Russia, Hungary, Poland, Slovenia, the Czech Republic, Bulgaria, and Ukraine. “Purely indigenous patents” are those generated by a team whose members are all based in a single ECA country.
18
International coinvention in ECA
0%
20%
40%
60%
80%
100%
1979 1980 1981 1982 1983 1984 1985 1986 1987 1988 1989 1990 1991 1992 1993 1994 1995 1996 1997 1998 1999 2000 2001 2002 2003 2004 2005 2006
All Same ECA Different ECA ECA and OECD ECA and Other Countries
19
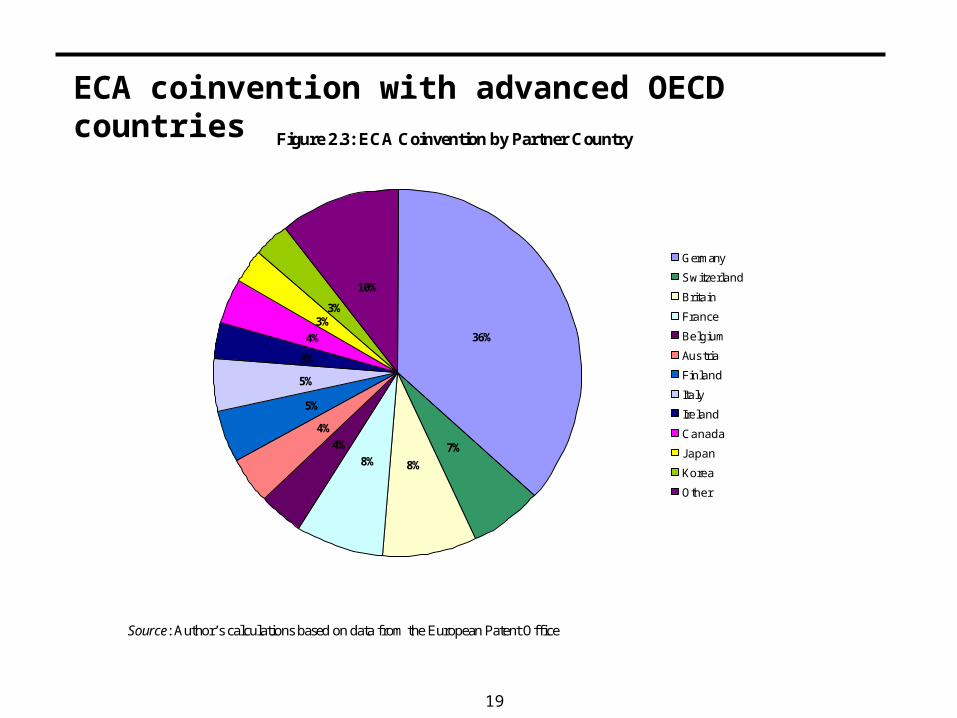
ECA coinvention with advanced OECD countries Figure 2.3: ECA Coinvention by Partner Country
36%
7%
8%8%
4%
4%
5%
5%
3%
4%
3%3%
10%
Germany
Switzerland
Britain
France
Belgium
Austria
Finland
Italy
Ireland
Canada
Japan
Korea
Other
Source: Author’s calculations based on data from the European Patent Office
20
International coinvention in Russia
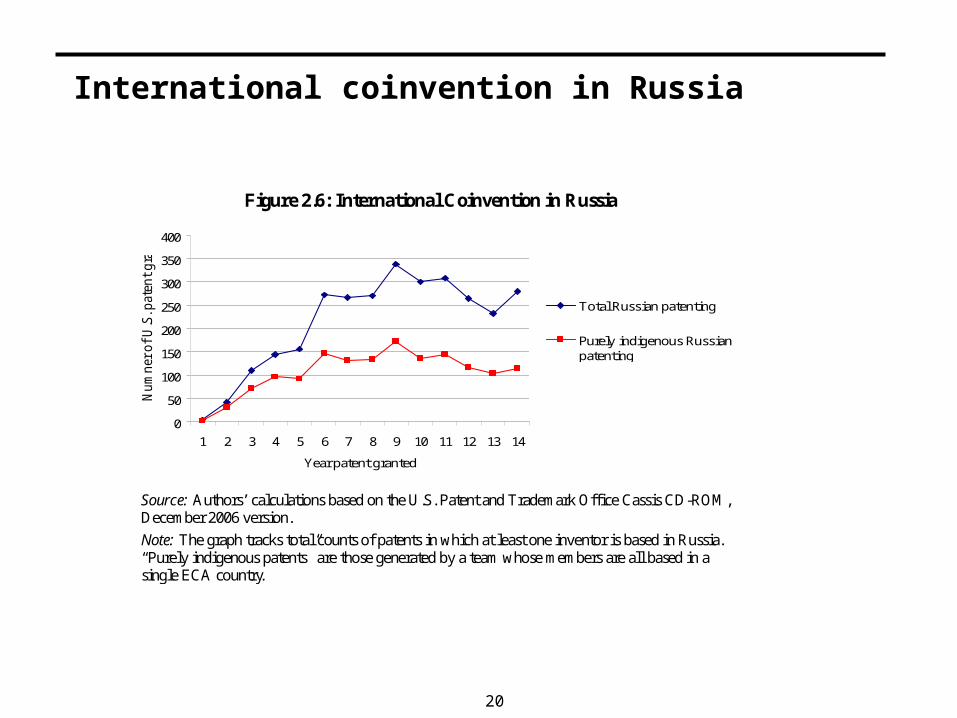
Figure 2.6: International Coinvention in Russia
0
50
100
150
200
250
300
350
400
1 2 3 4 5 6 7 8 9 10 11 12 13 14
Year patent granted
Nu
mn
er o
f U
.S. p
aten
t g
ran
ts
Total Russian patenting
Purely indigenous Russianpatenting
Source: Authors’ calculations based on the U.S. Patent and Trademark Office Cassis CD-ROM, December 2006 version.
Note: The graph tracks total counts of patents in which at least one inventor is based in Russia. “Purely indigenous patents” are those generated by a team whose members are all based in a single ECA country.

21
Top 10 Russian generators of U.S. patents
Table 2.1: Top 10 Russian Generators of U.S. Patents
Rank Name NationalityNumber of U.S.
Patents1 LSI Corp. United States 1112 Samsung Electronics South Korea 713 General Electric Co. United States 37
4 Elbrus International Russia 364 Sun Microsystems United States 36
5 Ceram Optec Industries Germany 28
6 Nippon Mektron Japan 267 Ajinomoto Co. Japan 258 Otkrytoe Aktsionernoe
ObschestvoRussia 20
9 Procter & Gamble United States 19
9 Ramtech United States 1910 Advanced Renal Technologies United States 16
10 Corning Inc. United States 1610 Nortel Networks Canada/United States 16
Source: Authors’ calculations based on the U.S. Patent and Trademark Office Cassis CD-ROM, December 2006 version.
Note: The graph tracks total counts of patents in which at least one inventor is based in Russia.
22
Patent citations as indicators of knowledge flows
U.S. patent applicants are required to “make appropriate citations to the prior art” on which they build
An analogy can be drawn between patent citations and the citations that appear in an academic paper
The citations received by ECA patents provide an indication of their technological impact
The citations made by ECA patents provide an indication of the knowledge base from which the ECA inventors draw
23
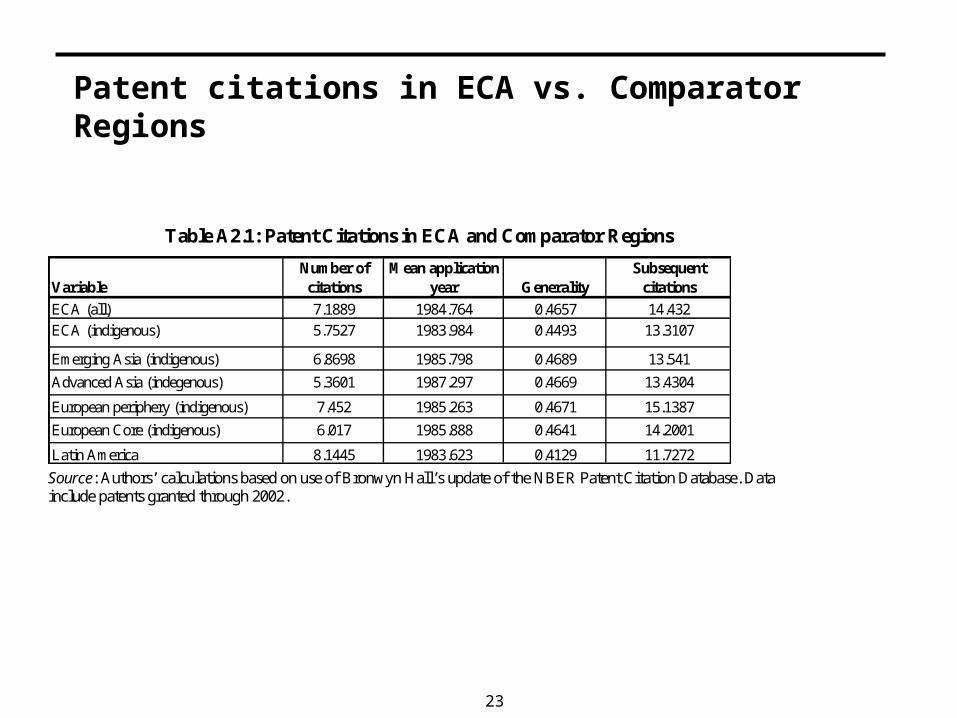
Patent citations in ECA vs. Comparator Regions
Table A2.1: Patent Citations in ECA and Comparator Regions
VariableNumber of
citationsMean application
year GeneralitySubsequent
citations
ECA (all) 7.1889 1984.764 0.4657 14.432
ECA (indigenous) 5.7527 1983.984 0.4493 13.3107
Emerging Asia (indigenous) 6.8698 1985.798 0.4689 13.541
Advanced Asia (indegenous) 5.3601 1987.297 0.4669 13.4304
European periphery (indigenous) 7.452 1985.263 0.4671 15.1387
European Core (indigenous) 6.017 1985.888 0.4641 14.2001
Latin America 8.1445 1983.623 0.4129 11.7272 Source: Authors’ calculations based on use of Bronwyn Hall’s update of the NBER Patent Citation Database. Data include patents granted through 2002.
24
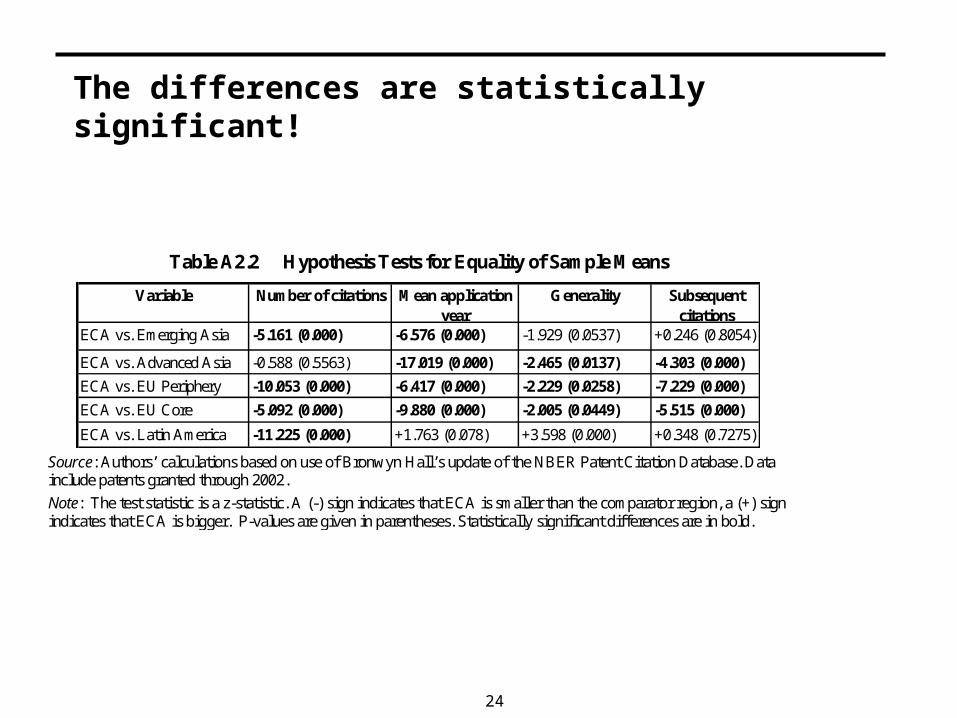
The differences are statistically significant!
Table A2.2 Hypothesis Tests for Equality of Sample Means
Variable Number of citations Mean application year
Generality Subsequent citations
ECA vs. Emerging Asia -5.161 (0.000) -6.576 (0.000) -1.929 (0.0537) +0.246 (0.8054)
ECA vs. Advanced Asia -0.588 (0.5563) -17.019 (0.000) -2.465 (0.0137) -4.303 (0.000)
ECA vs. EU Periphery -10.053 (0.000) -6.417 (0.000) -2.229 (0.0258) -7.229 (0.000)
ECA vs. EU Core -5.092 (0.000) -9.880 (0.000) -2.005 (0.0449) -5.515 (0.000)
ECA vs. Latin America -11.225 (0.000) +1.763 (0.078) +3.598 (0.000) +0.348 (0.7275)
Source: Authors’ calculations based on use of Bronwyn Hall’s update of the NBER Patent Citation Database. Data include patents granted through 2002. Note: The test statistic is a z-statistic. A (-) sign indicates that ECA is smaller than the comparator region, a (+) sign indicates that ECA is bigger. P-values are given in parentheses. Statistically significant differences are in bold.

25
Policy implications
The growth of ECA patenting is decelerating, even as Chinese and Indian patenting accelerates
Indigenous ECA patenting continues to lag in quality, quantity, and connectedness to the global state of the art
Multinational R&D in ECA raises the quality and quantity of ECA patenting
ECA inventors are participating in international coinvention networks, a phenomenon worthy of further study
26
Next steps – peering into the coinvention process
Patent data identify the ECA and Western members of international inventor teams
We propose to interview (some of) these inventors, survey others
What are the dynamics of invention inside an international inventor team?
Are ECA inventors graduating from “coinvention” to “invention”?