1 Diet and Nutrition Situation and Time Trends in India Dr. B. Sesikeran, MD, FAMS Director National...
36
1 Diet and Nutrition Situation and Time Trends in India Dr. B. Sesikeran, MD, FAMS Director National Institute of Nutrition, I.C.M.R. Hyderabad – 500 604 E-mail: [email protected]
-
Upload
carol-pullins -
Category
Documents
-
view
217 -
download
0
Transcript of 1 Diet and Nutrition Situation and Time Trends in India Dr. B. Sesikeran, MD, FAMS Director National...

1
Diet and Nutrition Situation and Time Trends in India
Dr. B. Sesikeran, MD, FAMS
Director National Institute of Nutrition, I.C.M.R.
Hyderabad – 500 604E-mail: [email protected]

2

3
Infant Mortality Rate (Per 1000 Live Births) in India and South-east Asian Countries
Source : WHO/SEARO 2000
8577
72 69
5954
17 12
0
20
40
60
80
100
IMR
58 *
* SRS, Registrar General of India, 2004
*

4
Prevalence of Low Birth Weight in India and South-east Asian Countries
Source : WHO/SEARO 2000
33 30
25 2523
13
8
10
10
20
30
40
Pe
r c
en
t
IndiaBangladesh
Nepal
Myanm
ar
Bhutan
Maldives
Indnesia
DPR Korea
23 (NFHS 2) *
* Increase in Institutional Deliveries

5
Andhra Pradesh
Madhya Pradesh
Maharashtra
Karnataka
Kerala Tamilnadu
Orissa
West Bengal
Uttar Pradesh
Gujarat
NATIONAL NUTRITION MONITORING BUREAU (Estd: 1972)
Objectives of NNMB
1.Assessment of Nutritional status of various communities by adopting standardized procedures and techniques
2.Periodical evaluation of National Nutrition programs operation in India

6
Average Daily Food Intake (% RDA) among 1-3 Year Children : By Gender
31
321918
26
31 232
21987
6917
1435
3680
74
0 50 100 150 200
Sugar & Jaggery
Fats & Oils
Milk & Milk Prod.
Roots & Tubers
Other Veg.
Green Leafy Veg.
Pulses
Cereals BoysGirls
Percent RDA

7
Median Intake of Nutrients (as % RDA) Among 1-3 year children : By gender
6058
3230
6156
4343
67
671414
3835
4040
5754 87
83
0 25 50 75 100 125
F.Folic Acid
Vitamin C
Niacin
Riboflavin
Thiamin
Vitamin A
Iron
Calcium
Energy
Protein BoysGirls
Percent of RDA

8
Average Daily Food Intake (% RDA) among 4-6 Year Children : By Gender
26
2630
3323
27166
181
87
8623
1954
5276
79
0 50 100 150 200
Sugar & Jaggery
Fats & Oils
Milk & Milk Prod.
Roots & Tubers
Other Veg.
Green Leafy Veg.
Pulses
Cereals BoysGirls
Percent RDA

9
Median Intake of Nutrients (as % RDA) Among 4-6 year children : By gender
6466
3637 65
683030
67
6716
173738
4952
5759 87
90
0 25 50 75 100 125
F.F.Acid
Vitamin C
Niacin
Riboflavin
Thiamin
Vitamin A
Iron
Calcium
Energy
Protein BoysGirls
Percent of RDA

10
0
20
40
60
80
100
% R
DI
DISTRIBUTION OF MICRONUTRIENT INTAKES IN CHILDREN - % RDI
Riboflavin 76.1 11.4 2.6
Vitamin A 87.4 3.8 8.8
Iron 71.4 13.4 15.2
F.F.Acid 31.5 24.2 44.3
<50% RDA 50-70% RDA >=70% RDA

11
Prevalence (%) of Undernutrition Among 1-5 yr children According to SD Classification (<Median - 2SD): By Gender
55 5550 52
16 15
0
20
40
60
Underweight Stunting Wasting
Boys
Girls
Per
cen
t

12
Prevalence of Undernutrition among <5 years children according to Weight for Age
(IAP classification)
39.9
56.458.7
57.4
56.8
61.0
20
40
60
80
6 12 24 36 48 60
Age (Months)
Per
Cen
t
Faulty BF Faulty Complementary feeding

13
INFANT AND YOUNG CHILD FEEDING PRACTICES (NFHS 3)
22
2923
48
4046
5462
56
0
20
40
60
80
100
Early Initiation of BF
Exclusive BF Upto 6 months
Compl. Feeding among 6- 9
months Children
Rural Urban Pooled

14
MICRO-NUTRIENT DEFICIENCIES

15
Pooled: 0.7%
< 0.5 %
0.5 %
Kerala0
Tamil Nadu 0.5
Karnataka0.7
Andhra Pradesh 1.2
Maharashtra1.3
Madhya Pradesh1.4
Orissa0.3 West Bengal
0.6
Prevalence (%) of Bitot spots among1 - <5 year children
Boys: 0.9% Girls 0.6%

16
0.7 0.70.6
0
0.2
0.4
0.6
0.8
1
1.2
MND-NNMB-2003
MND-ICMR-2001
NNMB-2006
Prevalence (%) of Bitot Spots among 1 - <5 yrs. Children
* WHO cut-off level (0.5%) of Public Health significance

17
AGE / PHYSIOLOGICAL GROUP Gender
Hb
(g/dl)
6 months – 6 Years Boys & Girls <11
6 – 14 Years Boys & Girls <12
14 Years Men <13
Women <12
Pregnant Women <11
WHO, Nutritional Anemia - TRS No. 405, Geneva 1968.
Definition of Anemia

18
32.5 31.4 30.325.7 22.3 24.8
45.2
23.7
47 47.2
24.7
43.3 41.9
45.8
41.7
20.5 20.7
45.5
31.4 30.5
8.42.8 0.63.04.11.81.12.1
1-5 yr B+G 12-14 YrGirls.
15-17 Yr.Girls
Preg. W Lact. W NPNL. W Men
Normal Mild Moderate Severe
10.20.03
11.20.03
11.00.03
9.90.03
10.60.03
Mean ±SE
Prevalence (%) of Anaemia by Age, Gender & Physiological Groups
> 6 months < 6 months
10.71.99
12.62.09

19
Pooled: 3.9
< 5 %
> 5 %
Kerala0.6
Tamil Nadu 0
Karnataka1.9
Andhra Pradesh 3.8
Maharashtra12.2
Madhya Pradesh4.3
Orissa0.1
West Bengal
9.0
Prevalence (%) of IDD among 6 – 11 Year
Children
Source: MND-NNMB, Tech Rep 22, 2003
20
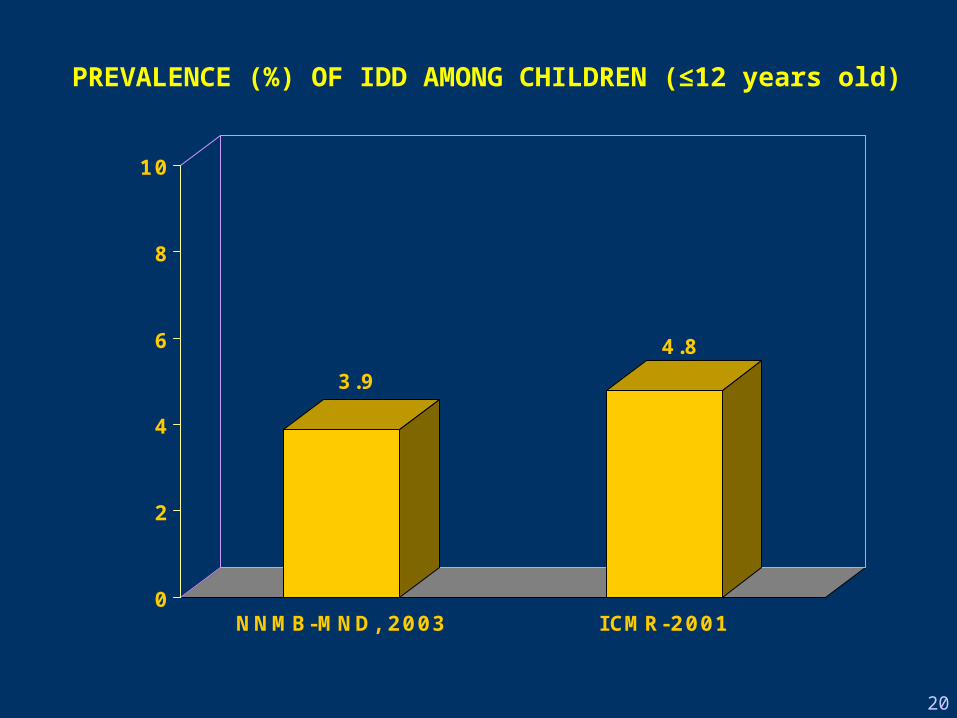
PREVALENCE (%) OF IDD AMONG CHILDREN (≤12 years old)
3.9
4.8
0
2
4
6
8
10
NNMB-MND, 2003 ICMR-2001

21
54.649.9
29.7 29.425.6 24.4
23.3
10.1
31.3
0
10
20
30
40
50
60
70
80
WB KER AP MR TN KAR ORI MP POOLED
Percent of Households consuming salt having Percent of Households consuming salt having adequateadequate
Amount (≥15 ppm) of IodineAmount (≥15 ppm) of Iodine
* By spot test

22
Time Trends

23
Average Intake of Foodstuffs (per CU/day) as % of RDI by Period of Survey
82
78
8290
40
3823
20
70
68
80
85
86
98
102110
0 50 100 150
O.Veg.
GLV
Pulses
Cereals
1975-77
1988-90
1996-97
2005-06
Percent

24
Average Intake of Foodstuffs (per CU/day) as % of RDI by Period of Survey (contd.)
4770
9777
7060
65
70
55
5761
77
120
8882
112
0 50 100 150
Sug&J ag.
Fats&Oils
Milk&MP
Roots&Tub.
1975-771988-90
1996-972005-06
Percent

25
Average Intake of Nutrients (per CU/day) as % of RDI by Period of Survey
5389
97
108
110130
141
152
76
87
94
97
8290
97
103
0 50 100 150
Iron
Calcium
Energy
Protein
1975-791988-901996-972005-06
Percent

26
110100
9398
9279
8992
436464
57100
100108
12543
5047
41
0 50 100 150
Vitamin C
Niacin
Riboflavin
Thiamin
Vitamin A
1975-791988-901996-972005-06
Percent
Average Intake of Nutrients (per CU/day) as % of RDI by Period of Survey (Contd.)

27
Distribution (%) of Children by Undernutrition and Period of Survey
64
4955
67
60
52
21 23
15
0
20
40
60
80
Underweight Stunting Wasting
1988-902000-012005-06
Per
cen
t
UNDERNUTRITION (< Median - 2SD)

28
37.437.6
21.8
26.136.0
38.9
51.3
54.9
17.5
21.022.526.6
37.037.0
42
39.1
39.939.539.5
45.1
39.9
31.4
23.523.5
0
10
20
30
40
50
60
1973-74 1977-78 1987-88 1993-94 1999-2000 2005-06
Year
Per
cen
t
Population BPL Severe underweightModerate Underweight Normal
Trends in poverty line estimates and Prevalence of Undernutrition among 1-5 yr. Children
(According to SD Classification Using NCHS Standards)
Source :- BPL : Economic survey and NNMB Surveys

29
0
5
10
15
20
25
30
35
World
wide
Amer
icas
Europe
Near/m
iddle
Eas
t
Asia-
Pacifi
c
Sub-Sah
ara
Africa
Pre
vale
nce
(%
)
overweight
obese
Prevalence of overweight and obesity among Prevalence of overweight and obesity among school-age boys aged 5-17 years by global regionschool-age boys aged 5-17 years by global region

30
Author Year Age groups
(yr)
Number of
subjects
Prevalence (%)
Overweight
Obesity
Mohan B 2004 11- 17 2467 11.6 2.6
Khadilkar Y 2004 10 – 15 1228 19.9 5.7
Chatwal J 2004 9 – 15 2008 14.2 11.1
Subramaniam V 2003 10 – 15 707 10.0 6.0
Laxmaiah A et al 2004 12 - 17 1208 04.6 1.6
Chatterji P 2002 4 – 18 5000 29.0 6.0
Kapil U 2002 10 – 16 870 24.7 7.4
Ramchandran A 2002 13 – 18 4700 16.8 3.1
Pandey S & Vaidya R
2001 3 - 17 2439 15.1 15.3
PREVALENCE (%) OVERWEIGHT AND OBESITY AMONG CHILDREN: VARIOUS STUDIES

31
Category NOverweight/
ObeseP value
TV viewing (hrs/day)
None 143 5.6 a b
P < 0.05
< 3 hrs/day 730 4.9 a b
3hrs/day 335 9.3 b
Participation in outdoor games (hrs/week)
None 526 8.4 a
P < 0.004< 6 hrs 228 6.6 a
6hrs 416 5.1 b
Participation in HH activities (hours/day)
None 221 18.6 a
P < 0.001< 3 hrs 233 4.7 b
3hrs 716 3.9 b
Prevalence of Overweight/Obesity and Physical Activity (NIN Study)

32
VariableOverweight/
Obese Adolescents
Normal Adolescents P value
Consumption of Soft drinks
21.0 16.0 p < 0.05
Consumption of soft drinks 300 ml/day
16.7 9.0 p < 0.05
Prevalence of Hypertension
(JNC VII)8.3 3.7 P < 0.05
Overweight/Obesity Vs Lifestyle practices (n:941)
Laxmaiah et al 2007

33
Prevalence of Overweight in relation to activity score.
19.7
13.1
10.5
0
5
10
15
20
25
1 2 3
Overweight % Prevalence of Overweight
was higher in lower tertile of physical activity. Trend 2 = 45.6, P <0.001.
Tertiles of activity score
% O
verw
eigh
t
Ramachandran et al 2002

34
Conclusion Despite rapid progress in the area of food production,
the intake of food and nutrients continues to be deficient, both in terms of quantity and quality
Prevalence of LBW is about 30%, and about 55% of preschool children are underweight and 50% are stunted.
Even though, the prevalence of undernutrition is significantly declining over a period of 3 decades, still the current prevalence is exceptionally high.
MNDs such as IDA VAD and IDD continues to be of public health problem.

35
The prevalence of overweight and obesity is significantly increasing over a period of 3 decades even among rural population, which is the major independent risk factor for metabolic syndrome.
Prevalence of overweight and obesity is considerably high, especially when Asian cut of levels were used (≥23 BMI).
India is passing through a critical phase i.e. ‘double burden of disease’.
One fourth of our rural adults are suffering from hypertension About 5-6% of the adults have IGT/DM.
Conclusion (Contd..)

36