1 Development Tools for ARM-Powered Devices MDK-ARM Microcontroller Development Kit ULINK Adapters...
53
1 Development Tools for ARM-Powered Devices MDK-ARM Microcontroller Development Kit ULINK Adapters Evaluation Boards May 2010
-
Upload
shanna-strickland -
Category
Documents
-
view
237 -
download
0
Transcript of 1 Development Tools for ARM-Powered Devices MDK-ARM Microcontroller Development Kit ULINK Adapters...

1
Development Toolsfor ARM-Powered Devices
MDK-ARM Microcontroller Development KitULINK Adapters
Evaluation Boards
May 2010

2
Introduction and Overview
Keil MDK-ARM Microcontroller Development Kit µVision4 Integrated Development Environment
ARM Compilation Tools
Verification and Debug
Complete device simulation
Analysis tools
CoreSight Debug & Trace
Hardware Components ULINK USB-JTAG Adapters
Evaluation Boards
Agenda

3
Keil Microcontroller Tools Leading supplier of MCU development tools
ANSI C/C++ compilers, Debuggers
Device simulation
Middleware components
Extensive Device Database®
>1,870 8/16/32 bit MCUs
Established support Web support portal
User group structure
Global distribution network
Huge installed base 100K+ users world wide

4
Software Development Tools

5
MDK-ARM Complete software development environment
For ARM7/9 and Cortex-R4 MCU devices
Any Cortex-M embedded system
Easy to learn and easy to use
Industry leading technology ARM Compiler
Keil µVision IDE / Debugger
Complete device support Start-up code & Flash algorithms
Board support packages (BSPs)
Extensive library of example code
RTX Real-Time Kernel Full-feature RTOS Kernel for embedded systems
MDK-ARMMicrocontroller Development Kit
MDK-ARMMicrocontroller Development Kit
Exa
mp
les
and
Tem
pla
tes
µVisionDevice Database & IDE
RTX RTOS Kernel Library
ARM C/C++ Compiler
µVision Debugger & Analysis
Tools
Device Peripheral Simulation

6
RL-ARM Extensive library of ready-to-use middleware components
Speed up software development
Meets Embedded Developers’ needs Solves common embedded challenges
Real-Time Systems
Embedded communication & networking
Designed for use with MCU Devices
Extensive Range of Examples Easy to begin working
Can be used as building blocks
Royalty Free Includes RTX source code.
License – single user, multi project
RL-ARMReal-Time Library
RL-ARMReal-Time Library
RTX RTOS Source Code
TCPnet Networking Suite
Flash File System
USB Device Interface
CAN Interface
Exa
mp
les
and
Tem
pla
tes

7
Hardware Components Range of evaluation boards and debug hardware
Verify application running on hardware target
ULINK family of USB Adapters Debug and Flash programming
JTAG and SWD support
Hi-Speed Streaming Trace
Evaluation Boards ARM7/9 and Cortex-M
Numerous MCU vendors
NXP, ST, Toshiba
Nuvoton, Triad, TI

8
MDK-ARMMicrocontroller Development Kit
MDK-ARMMicrocontroller Development Kit
MDK-ARMMicrocontroller Development Kit
Exa
mp
les
and
Tem
pla
tes
µVisionDevice Database & IDE
RTX RTOS Kernel Library
ARM C/C++ Compiler
µVision Debugger & Analysis Tools
Device Peripheral Simulation

9
µVision4 IDE Industry-leading IDE for MCU and smartcard devices
Common to ARM, C166, and 8051 platforms
Includes target device configuration and Device Database
Source code editor
High speed simulation
Project debugging
Powerful analysis tools
Flash programming

10
µVision4 Ease of Use Device Database
Directory of over 670 supported ARM MCUs
Enables quick selection of device
In µVision for easy project creation
Also online, with parametric search
Device Configuration Start-up code for effortless device setup
Configuration Wizard helps to configure device parameters
Examples and Templates Fast out-of-box experience
Can be used as a base for user project
BSPs for numerous boards

11
MDK-ARMCompilation Tools
MDK-ARMMicrocontroller Development Kit
MDK-ARMMicrocontroller Development Kit
Exa
mp
les
and
Tem
pla
tes
µVisionDevice Database & IDE
RTX RTOS Kernel Library
ARM C/C++ Compiler
µVision Debugger & Analysis Tools
Device Peripheral Simulation

12
ARM Compilation Tools Best-in-class compilation tools
Architecture-specific optimisations enable applications to run faster
Small code size reduces system cost
The ARM Compilation tools contain: Highly-optimizing ISO C/C++ compiler
Supports ARM, Thumb and Thumb2 Instruction sets including FPU
Full C and C++ run-time library support
MicroLib optimized C Libraries Superset of standard ARM C Library
Optimized for embedded applications Un-used functions removed from memory footprint
Minimal overhead for un-used OS functions
Faster system bring-up Most functions initialized at point of use

13
MicroLib – Optimized for Embedded Reduces system code size by 50% to 90%
Library Totals RO Totals
63% 51%
Based on Dhrystone 2.1 Benchmark
Processor Object Standard MicroLib % saving
ARM7TDMI ARM Library Total 21,352 8,980 61%
RO Total 25,608 12,816 51%
ARM7TDMI Thumb Library Total 17,156 6,244 57%
RO Total 20,129 9,348 50%
Cortex-M0 Thumb Library Total 16,452 5,996 64%
RO Total 19,472 9,016 54%
Cortex-M3 Thumb-2 Library Total 15,018 5,796 63%
RO Total 18,616 8,976 54%

14
Improved Performance in MicroLib v4.1 Complete re-optimization of the floating point library
Improved performance for both Cortex-M3 and Cortex-M0
Fewer cycles required per call Single precision add/subtract are now 2x faster
Conversion functions are now 3x faster
fadd is 2x faster, i2f is 3x faster, dmul is 6x faster
3x 10x6x2x

15
MDK-ARMVerification and Debug
MDK-ARMMicrocontroller Development Kit
MDK-ARMMicrocontroller Development Kit
Exa
mp
les
and
Tem
pla
tes
µVisionDevice Database & IDE
RTX RTOS Kernel Library
ARM C/C++ Compiler
µVision Debugger & Analysis Tools
Device Peripheral Simulation

16
µVision Application Verification High speed simulator
Complete of simulation of instruction set, peripherals and interfaces
Verify your application before hardware is available
Target debugger Connect target hardware to µVision debugger
BSP for evaluation boards from many vendors
Test actual behaviour of application on targeted device
Powerful analysis tools Monitor signals and variables in your application
Logic Analyzer, Code Coverage, and Execution Profiling
Quickly identify and fix bottlenecks for improved performance
Supported by simulator and target debugger

17
System Viewer Windows Displays contents of device’s peripheral registers
Detailed status information is available
Change register values directly from the window
Flexible views Window can show registers
from one or multiple peripherals
Can open multiple windows during a debug session

18
Kernel-Aware Debugging Analysis of RTOS tasks and events while the application runs
Enabled by tight integration of RTX Kernel with µVision
Monitoring of system resources Understand how your application interacts with the Kernel
Optimize your application to make better use of resources

19
MDK-ARMCoreSight Debug and Trace
MDK-ARMMicrocontroller Development Kit
MDK-ARMMicrocontroller Development Kit
Exa
mp
les
and
Tem
pla
tes
µVisionDevice Database & IDE
RTX RTOS Kernel Library
ARM C/C++ Compiler
µVision Debugger & Analysis Tools
Device Peripheral Simulation

20
Run-Stop Debugging has Limitations
Stopping code execution changes system behaviour Execution timing cannot be analyzed
Not servicing interrupts may have catastrophic results Buffers may overrun or connected hardware gets no service
Many practical problems result from a run-stop debugging Communications systems get into timeout state Motor controllers freeze with high current state

21
CoreSight Introduction Debug and trace technology in Cortex-M devices On-the-fly debugging
Debug application while the processor is running Set breakpoints, read/write memory locations
Direct access to memory, no need to go through processor Increased number of watchpoints
Flexible trace options Integrated Data Trace Optional Instruction Trace (ETM)
Reduced pin count interface 2-pin Serial Wire Debug (SWD) 1-pin Serial Wire Viewer (SWV) Uses standard JTAG connectors
Supported in MDK-ARM and ULINK family of adapters

CONFIDENTIAL22
CoreSight™ Debug Technology (Cortex-M)
Start, Stop, and Single-stepUser Program
8 Hardware Breakpoints in User Program
Application Trace Information:Debug printf, RTOS nfo, Unit Test,
UML Annotation
ITM, DWT, ETM Output via
4 trace data pins+ 1 clock pin
Data Trace or Access Breakpoints
for 4 Variables
Timing InformationPC Sampling,
Event Counters, Interrupt Execution
On-the-Fly (while User Program runs)read/write access to Variables and
Memory Contents
JTAG (5-pin) or Serial Wire (2-pin
+ 1 trace pin)
Instruction Stream for Code Execution Analysis,
Time Profiling, Code Coverage
ITM, DWT Output via 1 serial trace data pin
(UART or Manchester Mode)
Trace (ETM, ITM, DWT) not available on Cortex-M0

23
Debug and Trace Connectors
20-pin (0.1”) ARM JTAG
10-pin (0.05”) Cortex Debug
20-pin (0.05”) Cortex Debug+ETM
More Information: www.keil.com/coresight/connectors.asp
20-pin (0.1”) or 10-pin (0.05”) Connector Identical Debugging capabilities
Support 2 Operating Modes:
Standard 5-pin JTAG mode (device chaining)
Serial CoreSight mode 2-pin Serial Wire Debug (SWD)
1-pin Serial Wire Trace Output (SWO) for Data Trace at minimum system cost
20-pin (0.05”) Debug+ETM Connector Superset of 10-pin 0.05” Connector Adds 4 (trace data) +1 (trace clock) pins
for high-speed Data + Instruction Trace in any operating mode (JTAG or SWD)

24
Cortex-M CoreSight Offers Simple Solutions
#1: Direct memory access to running system Native support in the debugger interface
Values updated dynamically
In-place editing of live variables
Set breakpoints while system is running
No software overhead, no extra hardware,works with any Cortex-M device
#2: printf-style output via an ITM Channel Output details to a debug console Uses CMSIS standard interface Intrusive (the debug printf is a routine that
adds to execution time and needs memory), but can be shipped within the end product

25
Trace Records (DWT + ITM)
Trace Records display program flow Capture timestamp, PC sample, and Read/Write accesses
Time delay and lost cycles are noted
Raw trace data from all trace sources Filter window to refine the view
Updated while target system is running

26
Instrumented Trace (ITM)
32 ITM channels: write to memory location creates trace data Channel 0: for printf-style debug information
Channel 31: for RTX event viewer
Remaining ITM channels for user data output
// Output 32-bit variable // to ITM channel 1
ITM->PORT[1].u32 = value;
// Output 32-bit variable // to ITM channel 1
ITM->PORT[1].u32 = value;
A write operation to an ITM channel memory location
creates a trace record with output value, time stamp,
and program location.

27
Exception and Interrupt Trace (DWT)
Statistical information about exceptions and interrupts
Captures detailed information Name and number of exception; number of times entered
Max and Min time spent in and out of exceptions

28
Event Counters (DWT)
Display real-time values of specific event counters
Provide performance indications Extra cycles taken to execute instructions
May be due to memory contentions (Flash waitstates)
Cycles of overhead caused by handling exceptions
Cycles spent in sleep mode
Number of cycles spentperforming memory accesses
Number of folded branchinstructions

29
Logic Analyzer (DWT)
Allows signals to be monitored graphically Monitor variables in the application
Accurate timing Easy, fast analysis of signal timing with access to source code
View delta changes from cursor to current location
Code analysis View instruction that
caused variable change

30
Instruction Trace (ETM) Execution history of all executed instructions
Instruction Trace window displays: cycle count (timing) and assembly code synchronized to the C source code.
Instruction Trace is useful to analyze sporadic problems Data corruption by incorrect interrupt/thread protection Incorrect timing caused by interrupt/thread nesting

31
Sporadic Data Problem (ETM)void Alert (void) { // Alarm Function
if (clock.min != 59 && // Validate Time
clock.hour != 12) {
debug_printf ("System Should never be there");
}
}
void CheckAlert (void) { // check for alarm at 12:59
if (clock.min == 59 && // check minute for 59
clock.hour == 12) { // check hour for 12
Alert (); // call Alarm Function
:
Instruction Trace shows Interrupt Execution within the compare statement

32
Code Coverage (ETM)
Complete software validation requires code coverage Product liability and industry standards (IEC61508) demand for testing
according to “State of Science and Technology” methodologies
ETM enabled devices provide complete instruction stream Non-intrusive - use final, optimized code at full speed
Feedback provided directly in the debugger window Source & disassembly view
Color-coded details for individual instructions
Summary analysis by function or module
Log File Support Coverage information can
be saved for documentation

33
Execution Time Profiling and Analysis (ETM)
Instruction Trace provides timing information Identify where most time is spent in your application
Isolate problems by finding which C statements take longer than expected to execute

34
Debug and Trace Units
35
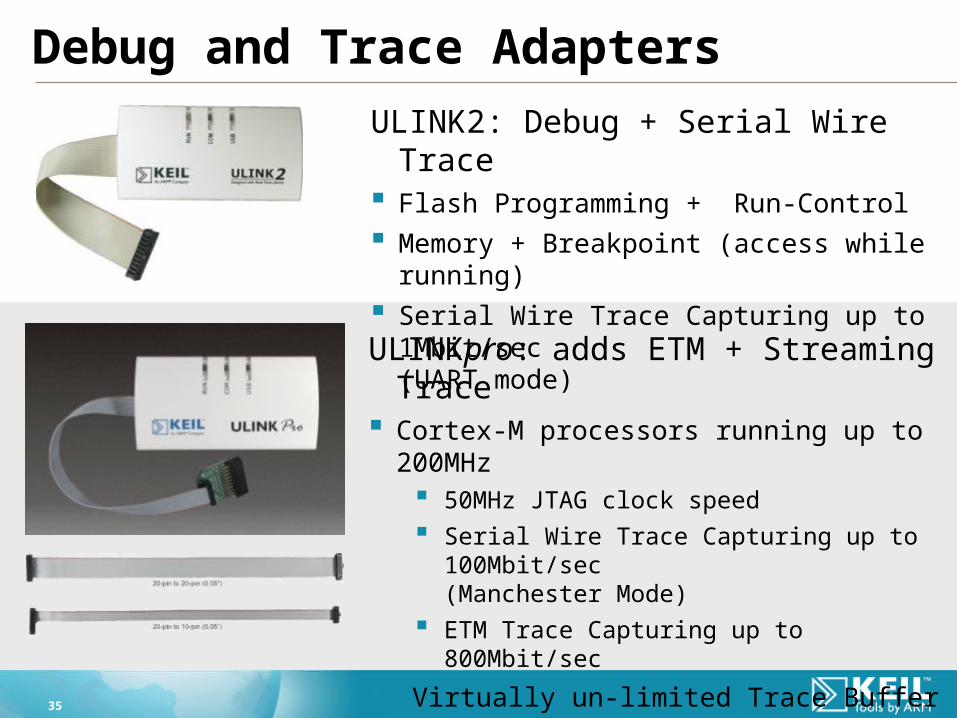
Debug and Trace Adapters
ULINK2: Debug + Serial Wire Trace Flash Programming + Run-Control
Memory + Breakpoint (access while running)
Serial Wire Trace Capturing up to 1Mbit/sec(UART mode)
ULINKpro: adds ETM + Streaming Trace Cortex-M processors running up to 200MHz
50MHz JTAG clock speed
Serial Wire Trace Capturing up to 100Mbit/sec(Manchester Mode)
ETM Trace Capturing up to 800Mbit/sec
Virtually un-limited Trace Buffer Streaming Trace allows contiguous
Code Coverage and Performance Analysis

36
ULINKpro Debug and Trace Unit Features
Debug via JTAG interface for ARM7/9 and Cortex-M
Serial Wire Debug (SWD) for Cortex-M
Serial Wire Viewer (SWV) data trace for Cortex-M
Instruction trace (via ETM) for Cortex-M
Data streaming direct to host PC
Cortex-M processors running up to 200MHz
Connectors:
20-pin 0.10“ JTAG
10-pin 0.05“ Cortex Debug
20-pin 0.05“ Cortex Debug+ETM
Performance 50MHz JTAG clock speed
1MB/s memory read/write

37
What is Streaming Trace? Trace data transferred in
real-time to debug host
Capture size only limited by host resources (hard disk)
Trace for minutes, hours, or longer
Required for full code-coverage and timing analysis
Today’s workstations can present trace data instantly

38
ULINKpro Benefits Performance Analysis
Dynamic analysis of running application
Identify program bottlenecks and optimize your application
Code Coverage Easily prove complete testing of application where required
Quickly determine where to improve your testing strategy
Execution History Find bugs which cause failures long after the event
Streaming Trace No trace buffer removes risk of overflow and lost data
Analyze large sections of code and observe true behaviour

39
Comparison of debug and trace unitsULINKpro ULINK2 ULINK-ME
Features
Run control debug (ARM 7/9 and Cortex-M)
Memory + Breakpoint (while running)
Data trace (Cortex-M)
ETM Instruction Trace (Cortex-M)
Performance
CPU Clock speed
JTAG Clock speed
Memory read/write
Data Trace streaming (UART mode)
Data Trace streaming (Manchester mode)
ETM Trace streaming
200MHz
50MHz
1MByte/s
-
100Mbit/s
800Mbit/s
200MHz
10MHz
25KByte/s
1Mbit/s
-
-
200MHz
10MHz
25KByte/s
1Mbit/s
-
-
Analysis Tools
Logic Analyzer
Performance Analyzer
Execution Profiling
Code Coverage

40
MDK-ARMRTX Real-Time Kernel
MDK-ARMMicrocontroller Development Kit
MDK-ARMMicrocontroller Development Kit
Exa
mp
les
and
Tem
pla
tes
µVisionDevice Database & IDE
RTX RTOS Kernel Library
ARM C/C++ Compiler
µVision Debugger & Analysis Tools
Device Peripheral Simulation

41
Why use a Real-Time Kernel? Structured framework for embedded applications
Hardware interface layer
Easy expansion of system software
Hardware independent
Housekeeping Process scheduling
CPU resource management
Task communication
Focus on Application Development Leave basic system management to the RTOS kernel
Avoid re-writing resource management code that already exists
Reduce porting and testing overheads
42
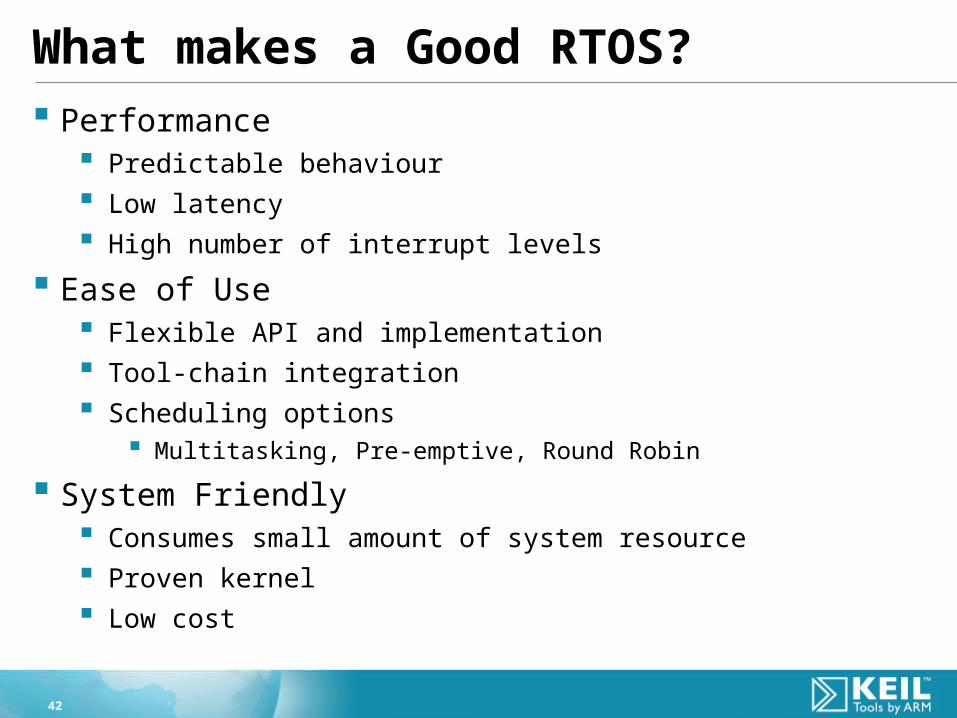
What makes a Good RTOS? Performance
Predictable behaviour
Low latency
High number of interrupt levels
Ease of Use Flexible API and implementation
Tool-chain integration
Scheduling options Multitasking, Pre-emptive, Round Robin
System Friendly Consumes small amount of system resource
Proven kernel
Low cost

43
Real-Time? Real-Time does not simply mean High Speed
Not all tasks are ‘Most Urgent’
Tasks need to complete before deadline and other tasks
Real-Time OS not to be confused with high speed requirements
Real-Time, not mission critical Varying levels of Real-Time
Hard, Firm, Soft and Non
RTOS not confined to critical systems
Deterministic behaviour is often most important
A Real-Time OS is a framework RTOS provides good multitasking environment
Reliable and scalable management of housekeeping tasks

44
RTX Real-Time Kernel Full-featured real-time kernel for embedded systems
Process Management Create and delete tasks, change task priorities
Manage event flag and CPU resources
Multi-Tasking Pre-emptive context switching, scheduling, and semaphores
Real-Time Control Deterministic behaviour
Inter-task communication Mailbox management
Interface to interrupt functions
Memory allocation Thread-safe (usage even in ISR)

45
RTX Specifications Provides all real-time kernel requirements
Multi-tasking: Round Robin, Pre-emptive, Cooperative
Unlimited: User Timers, Semaphores and Mailboxes
Royalty-free
Task Specifications
Priority levels 256
No. of Tasks Defined Unlimited
No. of Active Tasks 256
Context Switch < 300 Cycles
Interrupt Latency < 100 Cycles
Memory Requirements Bytes
CODE Space(depending on used functionality)
1.5K – 5K
RAM Space(each active task requires its own stack space)
< 500

46
RTX Performance
Task Specifications ARM7TDMI Cortex-M3
CPU Clock Speed 60MHz 72MHz
Initialize system, start task 46.2µS 22.1µS
Create defined task, (no task switch) 17.0µS 8.1µS
Create defined task, (with task switch) 19.1µS 9.3µS
Delete Task 9.3µS 4.8µS
Task Switch 6.6µS 3.9µS
Set event (no task switch) 2.4µS 1.9µS
Send semaphore 1.7µS 1.6µS
Send message 4.5µS 2.5µS
Max Interrupt lockout for IRQ ISR’s 3.1µS -

47
RTX Benefits I Commercial level RTOS at no additional cost
Full feature RTOS, included in MDK-ARM
No Royalty fees or other on-going costs
Short learning curve for increased productivity Fully integrated into µVision IDE and Debugger
RTX kernel-aware tools enable easy configuration and debug
Developed specifically for embedded systems Uses minimum system resources
Fast operation, with memory footprint as small as 5KB
Flexible scheduling Choose the best kernel scheduling option for your application
Pre-emptive, Round Robin, or Co-operative
48
RTX Benefits II Deterministic behaviour
Events and interrupts handled within a pre-defined time
Reliable behaviour for time-critical applications
Source code available RL-ARM provides full source code for RTX
Useful when certification is required
Market leading RTOS Top 5 in EETimes 2010 Embedded Market OS survey

49
Consistently one of the top ranked RTOS
Market Leading RTOS

50
Starter Kits

51
Evaluation Boards Proven hardware for quick development and debug
Designed for easy set-up
Extensive program examples
Available as starter kits
Evaluation version of MDK-ARM
ULINK-ME adapter
STMicro STM32C(Cortex-M3)
NXP LPC2929(ARM968E-S)
Nuvoton NUC1xx(Cortex-M0)

52
Get More Information Customers use www.keil.com on a daily basis to obtain
Program examples
Latest technical information
Support Knowledgebase
Application Notes
Device Database
Discussion Forum

53
Summary Out-of-box user experience
Easy to learn and use
Device Database and Startup code
Industry-leading tools µVision IDE
ARM Compilation tools
Advanced verification and debug Sophisticated analysis tools
Code Coverage and Profiling
Hardware components Complete the testing cycle by running on target hardware
Complete solution for developing embedded applications ARM7/9 & Cortex-R4 MCU devices, and Cortex-M systems
MDK-ARMMicrocontroller Development Kit
MDK-ARMMicrocontroller Development Kit
Ex
am
ple
s a
nd
Te
mp
late
s
µVisionDevice Database & IDE
RTX RTOS Kernel Library
ARM C/C++ Compiler
µVision Debugger & Analysis Tools
Device Peripheral Simulation