1 CyberGate: A Design Framework and System for Text Analysis of CMC Ahmed Abbasi and Hsinchun Chen...
65
1 CyberGate: A Design Framework and System for Text Analysis of CMC Ahmed Abbasi and Hsinchun Chen MISQ, 32(4), 2008
-
Upload
alan-ramsey -
Category
Documents
-
view
222 -
download
0
Transcript of 1 CyberGate: A Design Framework and System for Text Analysis of CMC Ahmed Abbasi and Hsinchun Chen...

1
CyberGate: A Design Framework and System for Text
Analysis of CMC
Ahmed Abbasi and Hsinchun Chen
MISQ, 32(4), 2008

2
Outline
• Introduction
• Background
• Design Framework for CMC Text Analysis
• System Design: CyberGate
• CMC Text Analysis Example using CyberGate
• Evaluation
• Conclusions

3
Introduction
• Computer mediated communication (CMC) has seen tremendous growth due to the fast propagation of the Internet.
• Text-based modes of CMC include email, listservs, forums, chat, and the world wide web (Herring, 2002).– These modes of CMC have a profound impact on organizations.
• Electronic communication - Culture and Interaction• Online Communities - Business Operations
• Business online communities provide invaluable mechanisms for various forms of interaction (Cothrel, 2000).– Knowledge dissemination (communities/networks of practice)
• (Wenger, 1998; Wenger & Snyder, 2000; Wasko & Faraj, 2005)– Transfer of goods/services (internet marketplaces)– Product/service reviews (consumer rating forums)
• (Turney & Littman, 2003; Pang et al., 2002)

4
Introduction
• Large volumes of information inherent in online communities has proven to be problematic– Very large scale conversations (VLSC) involving thousands of
people and messages (Sack, 2000; Herring, 2002)– Enormous information quantities make such places noisy and
difficult to navigate (Viegas & Smith, 2004).
• Many believe solution is to develop systems for navigation and knowledge discovery (Wellman, 2001). – Such CMC systems can improve informational transparency
• (Smith, 1999; Erickson & Kellogg, 2000; Sack, 2000; Kelly, 2002).– Intended for online community participants and
researchers/analysts studying these communities (Smith, 1999).
• Consequently, numerous CMC information systems have been developed – (Xiong & Donath, 1999; Fiore & Smith, 2002; Viegas et al., 2004;
Viegas & Smith, 2004).

5
Introduction
• These techniques generally visualize information provided in the message headers.– Interaction (send/reply structure) and activity (posting
patterns) based information
• Little support provided for analysis of textual information contained in messages.– When provided, text analysis is based on simple
feature representations used in IR systems (Sack, 2000; Whitelaw & Patrick, 2004).
• E.g., bag-of-words (Mladenic & Stefan, 1999)
6
Introduction
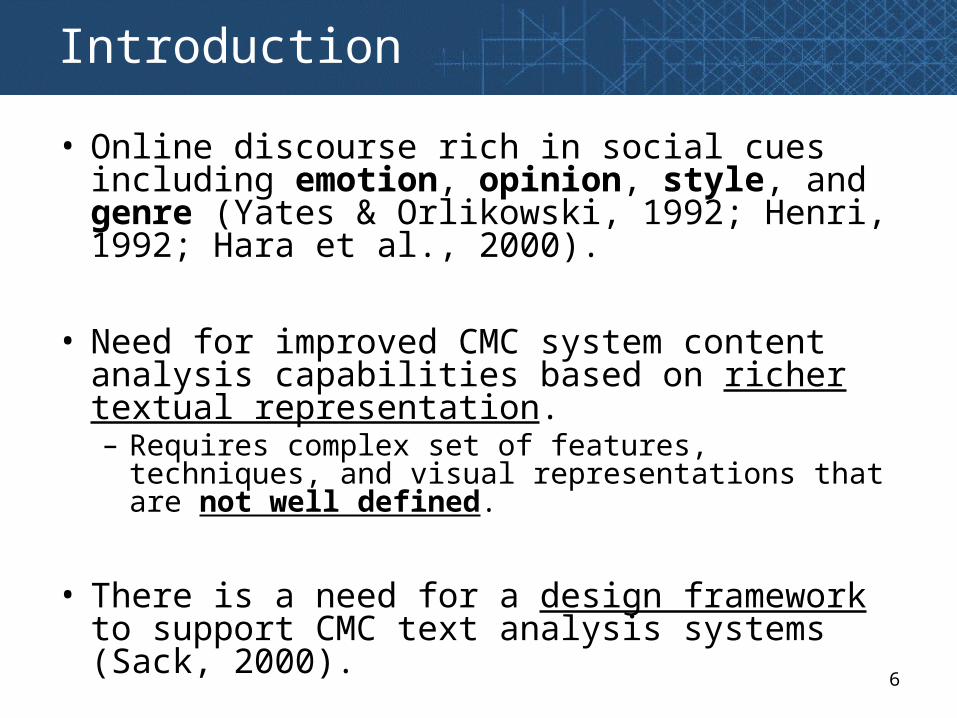
• Online discourse rich in social cues including emotion, opinion, style, and genre (Yates & Orlikowski, 1992; Henri, 1992; Hara et al., 2000).
• Need for improved CMC system content analysis capabilities based on richer textual representation.– Requires complex set of features, techniques, and
visual representations that are not well defined.
• There is a need for a design framework to support CMC text analysis systems (Sack, 2000).

7
Introduction
In this study we propose:
• A Design Framework for the creation of CMC systems that provide improved text analysis capabilities.– By incorporating richer set of information types.
• Our framework addresses several important issues from the text mining literature.– E.g., tasks, information types, features, selection methods, and
visualization techniques.
• We then develop the CyberGate system based on our design framework. – Includes the Writeprint and Ink Blot techniques that can be used
for analysis and categorization of CMC text.

8
Background: CMC Systems
• CMC Content Analysis
– Several dimensions have been proposed for CMC content analysis (Henri, 1992; Hara et al., 2000).
– The information utilized for CMC content analysis can be categorized as either structural or textual.
• Structural features – based on communication topology• Textual features – based on communication content

9
Background: CMC Systems
• Structural Features
– Features extracted from message headers
– Posting activity (Fiore et al., 2002)• E.g., # posts, # initial messages, # replies, # responses to author
post etc.• Represent social accounting metrics (Smith, 2002).• Can provide insight into different roles such as debaters, experts,
etc. (Zhu & Chen, 2001; Viegas & Smith, 2004)
– Interaction/Social networks (Sack, 2000; Smith & Fiore, 2001)• Can help identify key members and relationships (e.g., centrality,
link densities)

10
Background: CMC Systems
• Structural Features
– Plethora of CMC systems developed to support structural features.
• Several tools visualize posting patterns: Loom (Donath et al., 1999), Authorlines (Viegas & Smith, 2004).
• Conversation Map visualizes social networks based on send/reply patterns (Sack, 2000).
• Netscan visualizes interaction threads and networks (Smith & Fiore, 2001; Smith, 2002)
• PeopleGarden and Communication Garden both use flower metaphors to display author and thread activity (Xiong & Donath, 1999; Zhu & Chen, 2001).
• Babble (Erickson & Kellog, 2000) and Coterie (Donath, 2002) are geared towards showing structural and activity patterns in persistent conversation.

11
Background: CMC Systems
• Textual Features
– Features derived from message body
– The informational richness of CMC text was previously questioned (Daft & Lengel, 1986)
– Numerous studies have since demonstrated the richness of CMC content (Contractor & Eisenberg, 1990; Fulk et al., 1990; Yates & Orlikowski, 1992; Lee, 1994; Panteli, 2002).
– In additional to topical information and events (e.g., Allan et al., 1998), textual online discourse contains:
• Social cues (Spears & Lea, 1992; 1994; Henri, 1992)– Emotions (Picard, 1997; Subasic & Huettner, 2001)– Opinions (Hearst, 1992)– Power cues (Panteli, 2002) – Style (Abbasi & Chen, 2006; Zheng et al., 2006)– Genres, e.g., questions, statements, comments (Yates & Orlikowski, 1992)

12
Background: CMC Systems
• Textual Features– Limited support for text features in CMC systems
• Loom (Donnath et al., 1999) shows some content patterns based on message moods.
• Chat Circles (Donnath et al., 1999) displays messages based on message length.
• Conversation Map (Sack, 2000) uses computational linguistics to build semantic networks for discussion topics.
• Communication Garden (Zhu & Chen, 2001) performs topic categorization based on noun phrases.
– Features used in CMC systems are insufficient to effectively capture textual content in online discourse (Sack, 2000; Whitelaw & Patrick, 2004).
• Most use text information retrieval system features.• IR systems more concerned with information access than analysis
(Hearst, 1999)• Mladenic & Stefan (1999) presented a review of 29 IR systems, all
of which used bag-of-words.

13
Background: CMC Systems
System Name Reference Feature Types Feature Descriptions
Structural Textual
Chat Circles Donnath et al., 1999 √ √ Headers, Message length
Loom Donnath et al., 1999 √ √ Terms, Punctuation, Headers
People Garden Xiong & Donnath, 1999 √ Headers
Babble Erickson & Kellogg, 2000 √ Headers
Conversation Map Sack, 2000 √ √ Semantic, Headers
Communication Garden Zhu & Chen, 2001 √ √ Noun phrases, Headers
Coterie Donath, 2002 √ Headers
Newsgroup Treemaps Fiore & Smith, 2002 √ Headers
PostHistory Viegas et al., 2004 √ Headers
Social Network Fragments Viegas et al., 2004 √ Headers
Authorlines Viegas & Smith, 2004 √ Headers
Newsgroup Crowds Viegas & Smith, 2004 √ Headers
Previous CMC Systems

14
Background: Need for Enhanced Systems
• Numerous CMC researchers and analysts have stated the need for tools to support CMC text analysis.
– Textual features are important yet often overlooked in email analysis (Panteli, 2002).
• Features such as use of greetings and signatures, which can be important power cues, can easily be captured using stylistic feature extractors (Zheng et al., 2006).
– Hara et al. (2000) noted that there has been limited CMC content analysis since manual methods are time consuming.
– Paccagnella (1997) suggested that computer programs to support CMC text analysis would be helpful, yet do not exist.
– Cothrel (2000) stated that discussion content is an essential dimension of online community success measurement, yet proper definition and measurement remains elusive.

15
Background: Need for Enhanced Systems
• Why do most CMC systems support structural information but not textual content?
• Structural features well defined, easy to extract, and easy to visualize.– Activity based features (Fiore et al., 2002) and
interaction features (network metrics)– Posting activity and interaction easily extracted from
message headers.– Visualization: bar chart variants for activity frequency,
networks for interaction (Xiong & Donath, 1999; Zhu & Chen, 2001; Viegas & Smith, 2004).

16
Background: Need for Enhanced Systems
• Why do most CMC systems support structural information but not textual content?
• Rich textual features not well defined, difficult to extract, and harder to present to end users.– Text classification requires complex set of subjective features
(Donath et al., 1999).• E.g., over 1000 features used for analyzing style, with no consensus
(Rudman, 1997).– Extraction can be challenging due to high levels of noise in
online discourse text (Knight, 1999; Nasukawa & Nagano, 2001).– Many techniques developed to support different facets of text
visualization (Wise, 1999; Miller et al., 1998, Rohrer et al., 1998, Huang et al., 2005) with no single solution.
• Text presentation requires the use of multiple views (Losiewicz et al., 2000)
17
Background: Need for Enhanced Systems
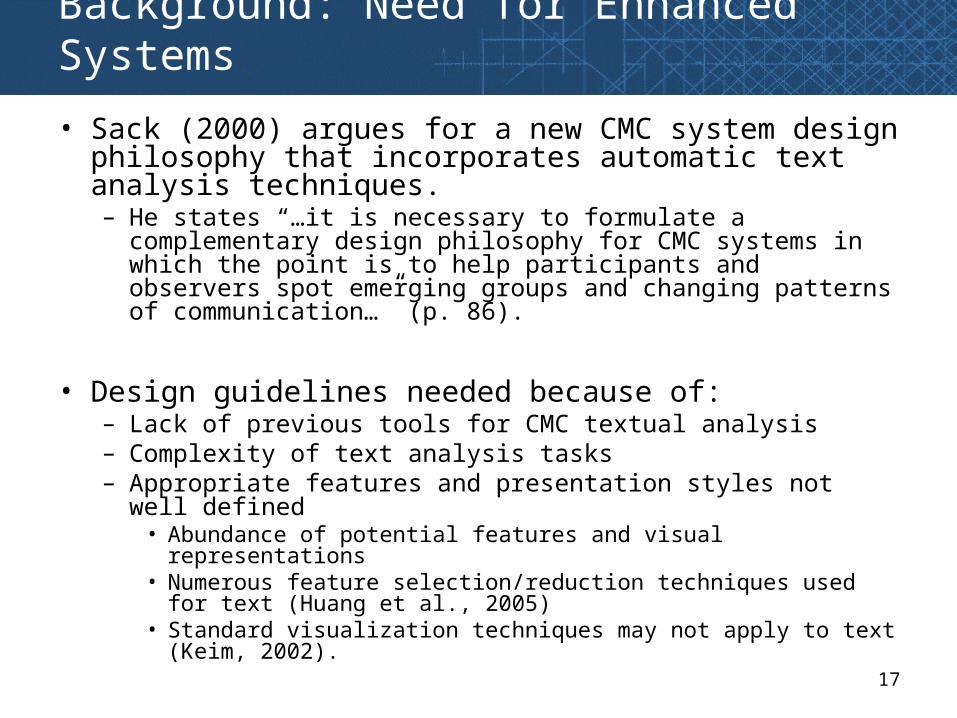
• Sack (2000) argues for a new CMC system design philosophy that incorporates automatic text analysis techniques.– He states “…it is necessary to formulate a complementary
design philosophy for CMC systems in which the point is to help participants and observers spot emerging groups and changing patterns of communication…” (p. 86).
• Design guidelines needed because of:– Lack of previous tools for CMC textual analysis– Complexity of text analysis tasks– Appropriate features and presentation styles not well defined
• Abundance of potential features and visual representations• Numerous feature selection/reduction techniques used for text
(Huang et al., 2005)• Standard visualization techniques may not apply to text (Keim,
2002).

18
Design Framework for CMC Text Analysis
• Design is a product and a process (Walls et al., 1992; Hevner et al., 2004).– Product is the set of requirements and necessary design guidelines for IT
artifacts.– Process is the steps taken to develop IT artifacts.
• IS development typically follows an iterative process of building and evaluating (March & Smith, 1995; Simon, 1996).
– Important in design situations involving a complex or poorly defined set of user requirements (Markus et al., 2002).
– The ambiguities associated with CMC text analysis component alternatives also warrant the use of such a design process.
• Thus, we focus on the design product elements of Walls et al.’s (1992) model, which are presented in the table below.
Design Product
1. Kernel theories Theories from natural of social sciences governing design requirements
2. Meta-requirements Describes a class of goals to which theory applies
3. Meta-design Describes a class of artifacts hypothesized to meet meta-requirements
4. Testable hypotheses Used to test whether meta-design satisfies meta-requirements(Walls et al., 1992)

19
Design Framework for CMC Text Analysis
Components of the Proposed Design Framework for CMC Text Analysis Systems

20
Design Framework: Kernel Theory
• Effective analysis of CMC text entails the utilization of a language theory that can provide representational guidelines.
• Systemic Functional Linguistic Theory (SFLT) provides an appropriate mechanism for representing CMC text information (Halliday, 2004).
• SFLT states that language has three meta-functions:– Ideational – language consists of ideas– Textual – language has organization, structure, and flow– Interpersonal – language is a medium of exchange between people
• The three meta-functions are intended to provide a comprehensive functional representation of language meaning by encompassing the physical, mental, and social elements of language (Fairclough, 2003).

21
Design Framework: Meta-Requirements
• Information Types
– Text-based information systems should incorporate a wide range of information types capable of representing the ideational, textual, and interpersonal meta-functions.
– “Any summary of a very large scale conversation is incomplete if it does not incorporate all three of these meta-functions (ideational, interpersonal, and textual),” (Sack, 2000; p. 75).
22
Design Framework: Meta-Requirements
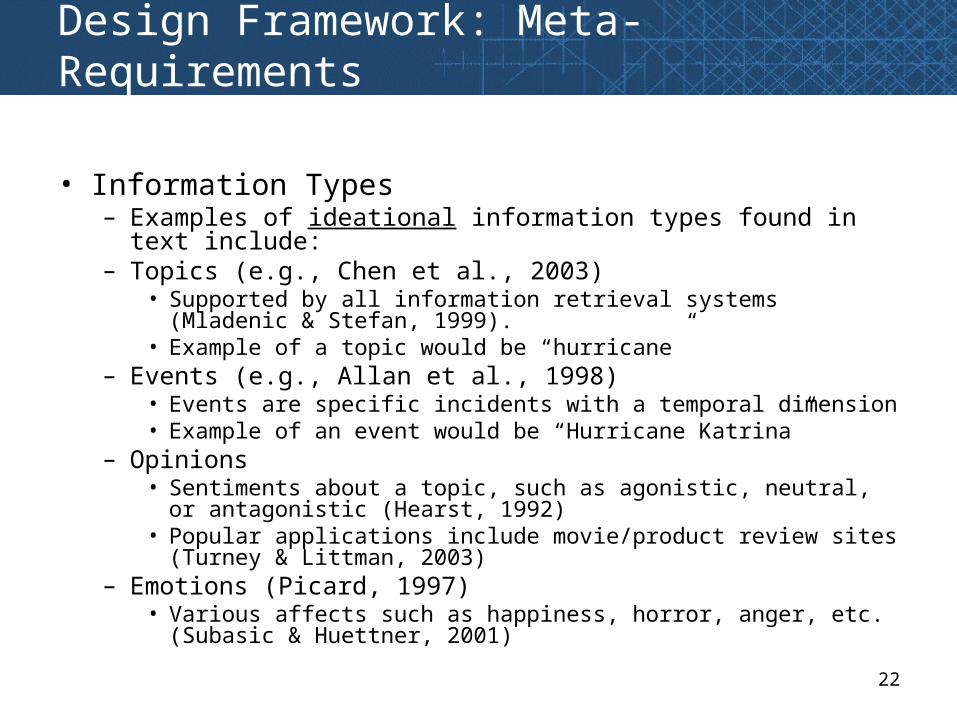
• Information Types– Examples of ideational information types found in text include: – Topics (e.g., Chen et al., 2003)
• Supported by all information retrieval systems (Mladenic & Stefan, 1999).
• Example of a topic would be “hurricane”– Events (e.g., Allan et al., 1998)
• Events are specific incidents with a temporal dimension• Example of an event would be “Hurricane Katrina”
– Opinions• Sentiments about a topic, such as agonistic, neutral, or antagonistic
(Hearst, 1992)• Popular applications include movie/product review sites (Turney &
Littman, 2003)– Emotions (Picard, 1997)
• Various affects such as happiness, horror, anger, etc. (Subasic & Huettner, 2001)

23
Design Framework: Meta-Requirements
• Information Types– Examples of textual information types include:
– Style • Numerous stylistic attributes, including vocabulary richness, word
choices, and punctuation usage (Argamon et al., 2003; Abbasi & Chen, 2006).
• Example styles include formal (use of greetings, structured sentences, paragraphs), informal (no sentences, no greetings, erratic punctuation usage), etc.
– Genres• Genres are classes of writing• Genres found in an organizational communication settings include
inquiries, informational messages, news articles, memos, resumes, reports, interviews, etc. (Yates & Orlikowski, 1992; Santini, 2004).

Design Framework: Meta-Requirements
• Information Types– The table below shows example for each information type and their
corresponding analysis applications.
Information Type Examples Analysis Types References
Ideational Topics Topical Analysis Mladenic & Stefan, 1999; Chen et al., 2003
Events Event Detection Allan et al., 1998
Opinions Sentiment Analysis Hearst, 1992; Turney & Littman, 2003
Emotions Affect Analysis Picard, 1997; Subasic & Huettner, 2001
Textual Style Authorship Analysis
Deception Detection
Power Cues
Argamon et al.,2003; Abbasi & Chen, 2006; Zhou et al., 2004; Panteli, 2002
Genres Genre Analysis Yates & Orlikowski, 1992; Santini, 2004
Metaphors/
Vernaculars
Semantic Networks Sack, 2000
Interpersonal Interaction Social Networks Sack, 2000; Viegas et al., 2004
Conversation Streams Smith & Fiore, 2001
25
Design Framework: Meta-Design
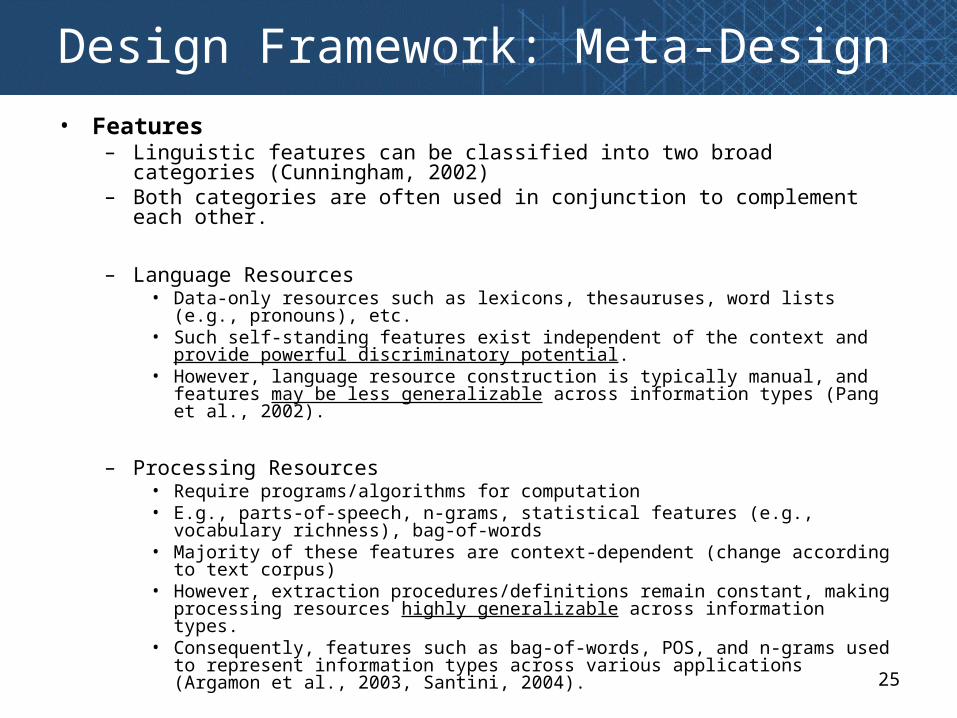
• Features– Linguistic features can be classified into two broad categories (Cunningham,
2002)– Both categories are often used in conjunction to complement each other.
– Language Resources• Data-only resources such as lexicons, thesauruses, word lists (e.g., pronouns), etc.• Such self-standing features exist independent of the context and provide powerful
discriminatory potential.• However, language resource construction is typically manual, and features may be less
generalizable across information types (Pang et al., 2002).
– Processing Resources• Require programs/algorithms for computation• E.g., parts-of-speech, n-grams, statistical features (e.g., vocabulary richness), bag-of-
words• Majority of these features are context-dependent (change according to text corpus)• However, extraction procedures/definitions remain constant, making processing
resources highly generalizable across information types.• Consequently, features such as bag-of-words, POS, and n-grams used to represent
information types across various applications (Argamon et al., 2003, Santini, 2004).
26
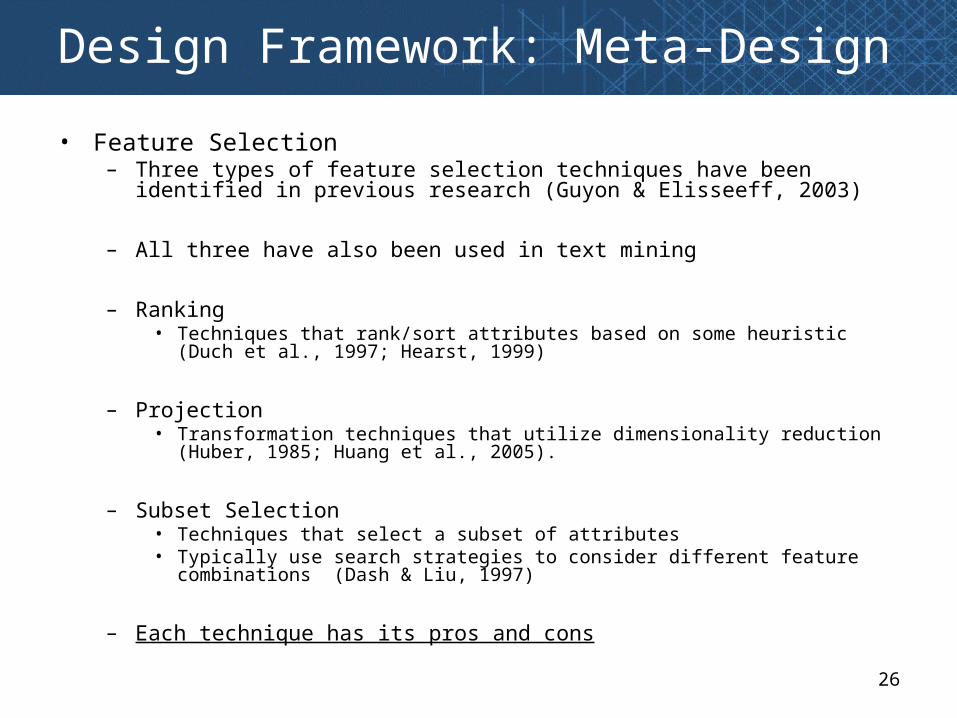
Design Framework: Meta-Design
• Feature Selection– Three types of feature selection techniques have been identified in previous
research (Guyon & Elisseeff, 2003)
– All three have also been used in text mining
– Ranking• Techniques that rank/sort attributes based on some heuristic (Duch et al., 1997;
Hearst, 1999)
– Projection• Transformation techniques that utilize dimensionality reduction (Huber, 1985; Huang et
al., 2005).
– Subset Selection• Techniques that select a subset of attributes• Typically use search strategies to consider different feature combinations (Dash & Liu,
1997)
– Each technique has its pros and cons

27
Design Framework: Meta-Design
• Feature Selection– Ranking and projection methods have seen greater use due to their
simplicity/efficiency and propensity to handle noise, respectively.– Therefore we limit our discussion to these two categories.
– Ranking Methods, e.g., information gain, chi-squared, Pearson’s correlation, etc. (Forman, 2003)
• Pros– Greater explanatory potential (Seo & Shneiderman, 2002)– Simplicity and scalability
• Cons– Typically only consider individual features’ predictive power (Guyon & Elisseeff,
2003; Li et al., 2006)
– Projection Methods, e.g., PCA, MDS, SOM (Huang et al., 2005)• Pros
– Robust against noise» Consequently used a lot in text mining (Abbasi & Chen, 2006)
• Cons– Transformation results in reduced explanatory potential (Seo & Shneiderman,
2002)

28
Design Framework: Meta-Design
• Feature Selection
– The table below shows example selection methods that have been applied to text mining and the type of analysis performed.
Selection Method Examples Analysis Types Reference
Ranking Information Gain Topical Efron et al., 2004
Decision Tree Model Authorship Abbasi & Chen, 2005
Minimum Frequency Sentiment Pang et al., 2002
Projection Principal Component Analysis Authorship Abbasi & Chen, 2006
Multi-Dimensional Scaling Topical Allan & Leuski, 2000
Self-Organizing Map Topical Chen et al., 2003
29
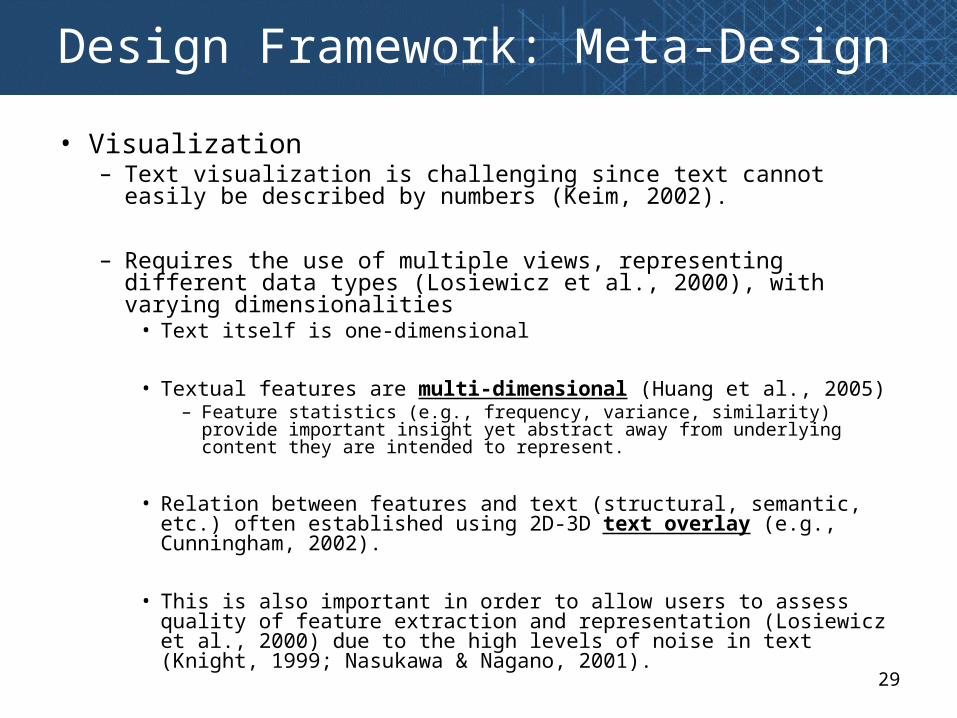
Design Framework: Meta-Design
• Visualization– Text visualization is challenging since text cannot easily be
described by numbers (Keim, 2002).
– Requires the use of multiple views, representing different data types (Losiewicz et al., 2000), with varying dimensionalities
• Text itself is one-dimensional
• Textual features are multi-dimensional (Huang et al., 2005)– Feature statistics (e.g., frequency, variance, similarity) provide
important insight yet abstract away from underlying content they are intended to represent.
• Relation between features and text (structural, semantic, etc.) often established using 2D-3D text overlay (e.g., Cunningham, 2002).
• This is also important in order to allow users to assess quality of feature extraction and representation (Losiewicz et al., 2000) due to the high levels of noise in text (Knight, 1999; Nasukawa & Nagano, 2001).
30
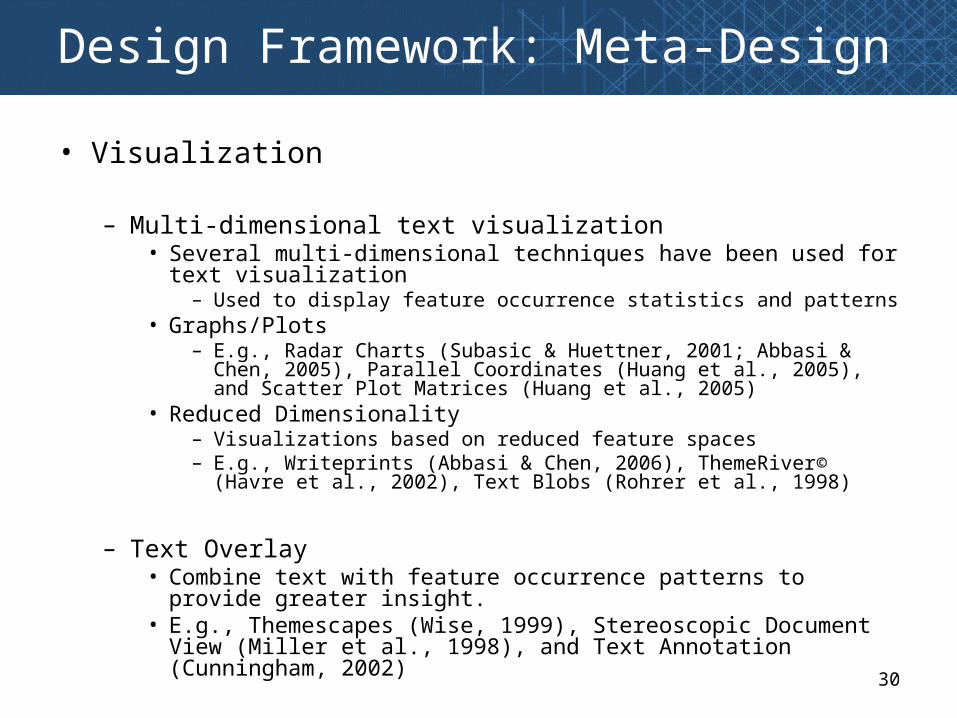
Design Framework: Meta-Design
• Visualization
– Multi-dimensional text visualization• Several multi-dimensional techniques have been used for text
visualization– Used to display feature occurrence statistics and patterns
• Graphs/Plots– E.g., Radar Charts (Subasic & Huettner, 2001; Abbasi & Chen, 2005),
Parallel Coordinates (Huang et al., 2005), and Scatter Plot Matrices (Huang et al., 2005)
• Reduced Dimensionality– Visualizations based on reduced feature spaces– E.g., Writeprints (Abbasi & Chen, 2006), ThemeRiver© (Havre et al.,
2002), Text Blobs (Rohrer et al., 1998)
– Text Overlay• Combine text with feature occurrence patterns to provide greater
insight.• E.g., Themescapes (Wise, 1999), Stereoscopic Document View
(Miller et al., 1998), and Text Annotation (Cunningham, 2002)
31
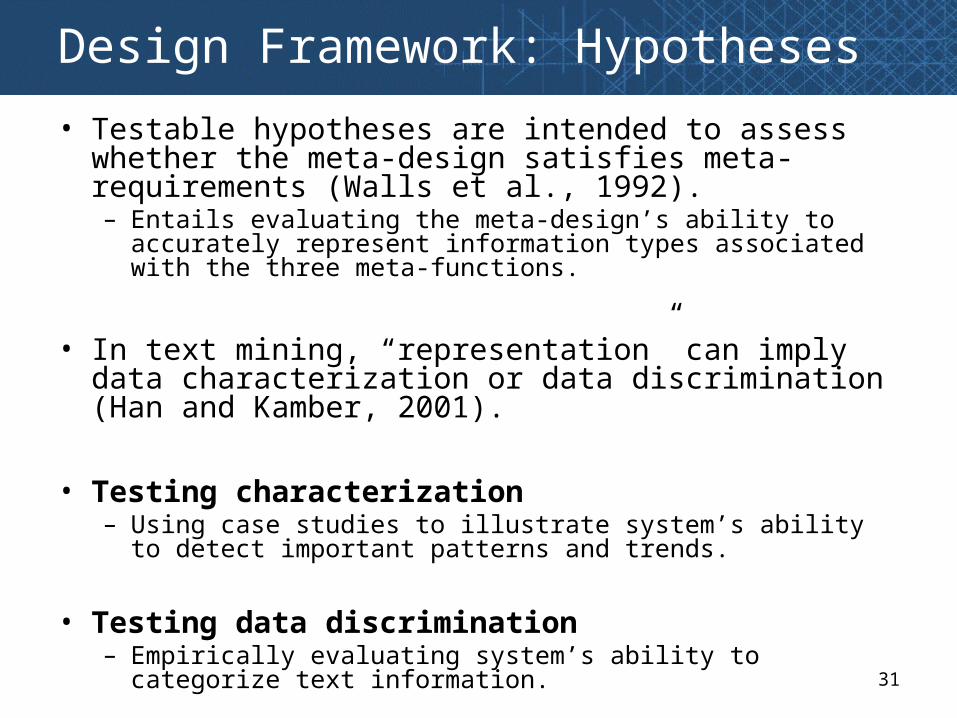
Design Framework: Hypotheses
• Testable hypotheses are intended to assess whether the meta-design satisfies meta-requirements (Walls et al., 1992). – Entails evaluating the meta-design’s ability to accurately
represent information types associated with the three meta-functions.
• In text mining, “representation” can imply data characterization or data discrimination (Han and Kamber, 2001).
• Testing characterization– Using case studies to illustrate system’s ability to detect
important patterns and trends.
• Testing data discrimination– Empirically evaluating system’s ability to categorize text
information.

32
System Design: CyberGate
• Description
– Using our design framework as a guideline, we developed a text-based information system for CMC analysis called CyberGate.
• Developed in several iterations of adding and testing information types.
• Supports many tasks, information types, features, and selection and visualization techniques.
– Two core components are the Writeprint and Ink Blot techniques.
– We present an overview of the entire system, then focus on these two techniques.

33
System Design: CyberGate

34
System Design: CyberGate
• Information Types and Features– CyberGate supports several information types, including topics,
sentiments, affects, style, and genres.
– In order to enable the capturing of such a breadth of information, several language and processing resources were included.
• These include language resources such as sentiment and affect lexicons, word lists, and the Wordnet thesaurus (Fellbaum, 1998).
• Processing resources such as an n-grams, statistical features (Abbasi & Chen, 2005; Zheng et al., 2006), parts-of-speech, noun phrases, and named entities (McDonald et al., 2004)

35
System Design: CyberGate
Resource Category Feature Groups Quantity Examples
Language Lexical Word Length 20 word frequency distribution
Letters 26 A,B,C
Special Characters 21 $,@,#,*,&
Digits 10 0,1,2
Syntactic Function Words 250 of, for, the, on, if
Pronouns 20 I, he, we, us, them
Conjunctions 30 and, or, although
Prepositions 30 at, from, onto, with
Punctuation 8 !,?,:,”
Structural Document Structure 14 has greeting, has url, requoted content
Technical Structure 50 file extensions, fonts, images
Lexicons Sentiment Lexicons 3000 positive, negative terms
Affect Lexicons 5000 happiness, anger, hate, excitement
Process Lexical Word-Level Lexical 8 % char per word
Char-Level Lexical 7 % numeric char per message
Vocabulary Richness 8 hapax legomana, Yules K,
Syntactic POS Tags 2200 NP_VB
Content-Based Noun Phrases Varies account, bonds, stocks
Named Entities Varies Enron, Cisco, El Paso, California
Bag-of-words Varies all words except function words
N-Grams Character-Level Varies aa, ab, aaa, aab
Word-Level Varies went to, to the, went to the
POS-Level Varies NNP_VB VB,VB ADJ
Digit Level 1100 12, 94, 192
Feature Set
36
System Design: CyberGate
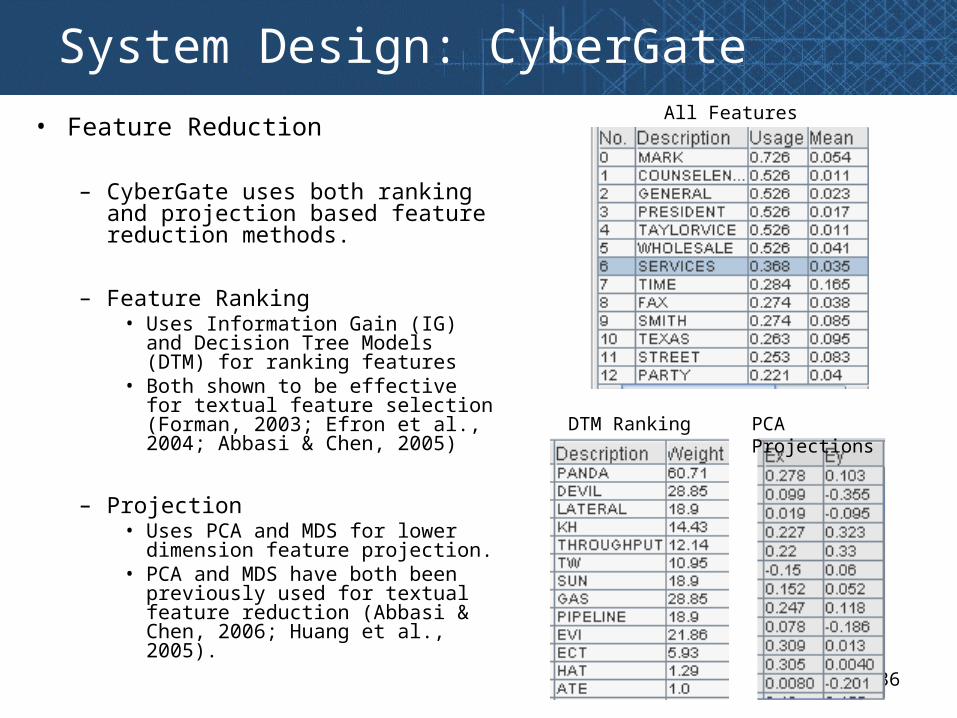
• Feature Reduction
– CyberGate uses both ranking and projection based feature reduction methods.
– Feature Ranking• Uses Information Gain (IG) and
Decision Tree Models (DTM) for ranking features
• Both shown to be effective for textual feature selection (Forman, 2003; Efron et al., 2004; Abbasi & Chen, 2005)
– Projection• Uses PCA and MDS for lower
dimension feature projection.• PCA and MDS have both been
previously used for textual feature reduction (Abbasi & Chen, 2006; Huang et al., 2005).
All Features
DTM Ranking PCA Projections

37
System Design: CyberGate
• Visualization– CyberGate includes basic, multi-dimensional, and text overlay
based visual representations.• Basic
– Tables and graphs for point values and usage comparisons.
• Multi-dimensional– Writeprints to show usage variation across messages, windows, and
time (Abbasi & Chen, 2006).– Parallel coordinates to show feature similarities across messages,
windows, and time.– Radar Charts to compare feature usage across authors.– MDS plots to show feature usage correlations.
• Text Overlay – Ink Blots that superimpose colored circles (blots) onto text for usage
frequency analysis» Size of blot indicates feature rank/weight (based on feature
ranking techniques)» Color indicates usage (red = high, blue = low, yellow = medium).
– Text annotation simply highlights key features in text (Cunningham, 2002).
38
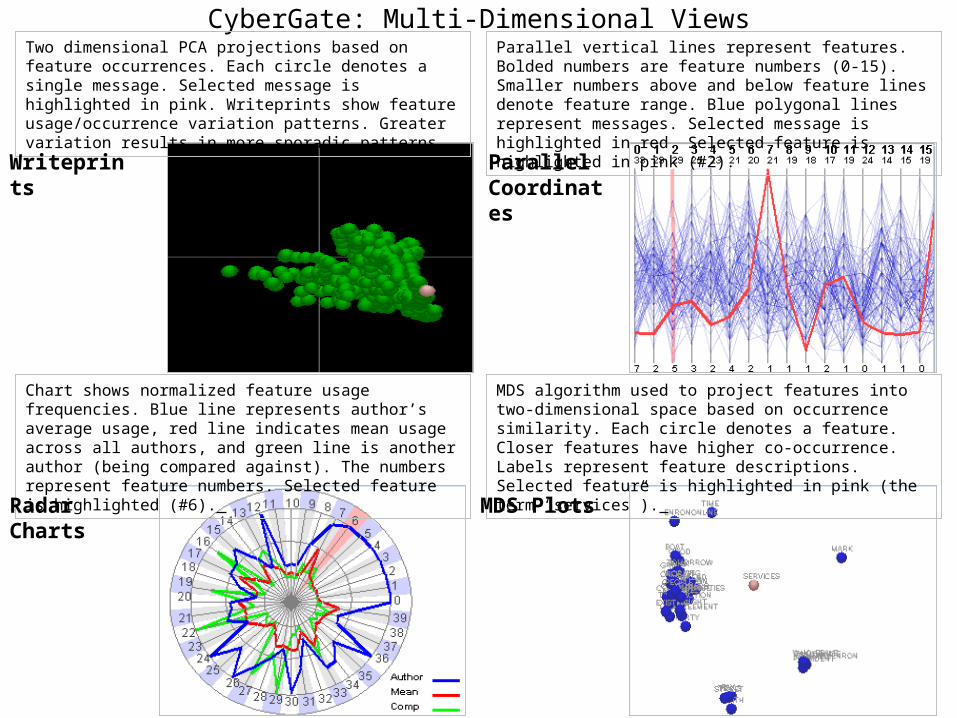
CyberGate: Multi-Dimensional ViewsTwo dimensional PCA projections based on feature occurrences. Each circle denotes a single message. Selected message is highlighted in pink. Writeprints show feature usage/occurrence variation patterns. Greater variation results in more sporadic patterns.
Parallel vertical lines represent features. Bolded numbers are feature numbers (0-15). Smaller numbers above and below feature lines denote feature range. Blue polygonal lines represent messages. Selected message is highlighted in red. Selected feature is highlighted in pink (#2).
Chart shows normalized feature usage frequencies. Blue line represents author’s average usage, red line indicates mean usage across all authors, and green line is another author (being compared against). The numbers represent feature numbers. Selected feature is highlighted (#6).
MDS algorithm used to project features into two-dimensional space based on occurrence similarity. Each circle denotes a feature. Closer features have higher co-occurrence. Labels represent feature descriptions. Selected feature is highlighted in pink (the term “services”).
Writeprints Parallel Coordinates
Radar Charts MDS Plots

39
CyberGate: Text Views
Feature occurrences are highlighted in blue. The selected bag-of-words feature is highlighted in red (“CounselEnron”).
Colored circles (blots) superimposed onto feature occurrence locations in text. Blot size and color indicates feature importance and usage. Selected feature’s blots are highlighted with black circles.
Text Annotation
Ink Blots

40
CyberGate: Interaction Views
CyberGate includes graph and tree visualizations• A-B: Author and thread level social networks• C: Thread discussion trees
A)
B)
C)

41
System Design: Writeprints and Ink Blots
CyberGate includes the Writeprint and Ink Blot techniques
• Core components driving the system’s analysis and categorization functions.
• These techniques epitomize the essence of the proposed design framework:
• Representational Richness– Writeprints and Ink Blots can incorporate a wide
range of features representing various information types.
– Both techniques also utilize feature selection and visualization.

42
System Design: Writeprints
Writeprints uses principal component analysis (PCA) with a sliding window algorithm to create lower dimensional plots that accentuate feature usage variation.
Writeprint Technique Steps1) Derive two primary eigenvectors (ones with the largest eigenvalues) from
feature usage matrix.2) Extract feature vectors for sliding window instance.3) Compute window instance coordinates by multiplying window feature vectors
with two eigenvectors.4) Plot window instance points in two dimensional space.5) Repeat steps 2-4 for each window.

43
System Design: Ink BlotsInk Blots uses decision tree models (DTM) to select features which are superimposed onto
text to show usage frequencies as they occur within their textual structure.
Ink Blot Technique Steps1) Separate input text into two classes (one for class of interest, one class containing all remaining texts).2) Extract feature vectors for messages.3) Input vectors into DTM as binary class problem.4) For each feature in computed decision tree, determine blot size and color based on DTM weight and feature usage.5) Overlay feature blots onto their respective occurrences in text.6) Repeat steps 1-5 for each class.

44
Application Example: The Enron Case
• We use Writeprints and Ink Blots to illustrate how CyberGate supports text analysis of CMC. – Additional CyberGate views such as parallel coordinates and
MDS plots are also incorporated.– Used to illustrate CyberGate’s ability to support data
characterization.
• The example application on the Enron email corpus reflects the ability of these techniques to collectively support the analysis of ideational and textual information.
• Example relates to two authors from Enron, neither of which was directly involved in the scandal. – Author A worked in the sales division while Author B was in the
company’s legal department.
45
Application Example: The Enron Case
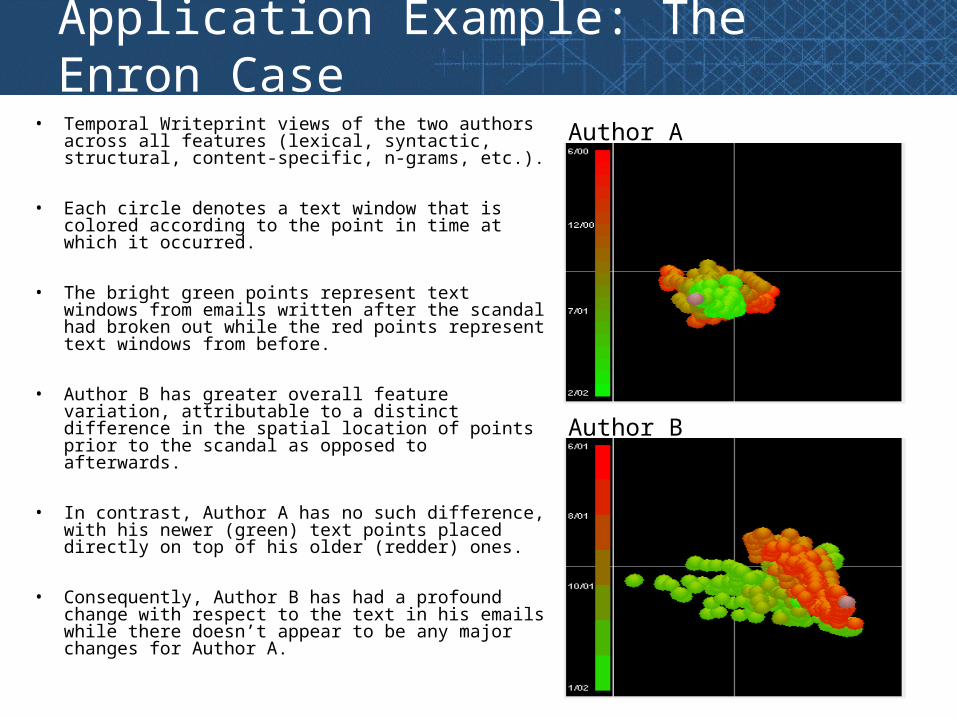
• Temporal Writeprint views of the two authors across all features (lexical, syntactic, structural, content-specific, n-grams, etc.).
• Each circle denotes a text window that is colored according to the point in time at which it occurred.
• The bright green points represent text windows from emails written after the scandal had broken out while the red points represent text windows from before.
• Author B has greater overall feature variation, attributable to a distinct difference in the spatial location of points prior to the scandal as opposed to afterwards.
• In contrast, Author A has no such difference, with his newer (green) text points placed directly on top of his older (redder) ones.
• Consequently, Author B has had a profound change with respect to the text in his emails while there doesn’t appear to be any major changes for Author A.
Author B
Author A

46
Application Example: The Enron Case
Before Scandal Text
After Scandal Text
Ink Blots and parallel coordinates for sample points taken from Author A for text windows before and after the scandal.
The Ink Blot views show the author’s key features superimposed onto the text.
There doesn’t appear to be a major difference in the usage of these features in text before and after the scandal.
Parallel coordinates shows the author’s 32 most important bag-of-words, including sales and business deal related terms (the major topical content of the author’s text).
Again, the before and after coordinate patterns seem similar, suggesting little topical deviation attributable to the scandal.

47
Application Example: The Enron Case
Before Scandal Text
After Scandal Text
Author B’s after scandal text has greater occurrence of key ink blot features. While emails before the scandal focus on legal aspects of business deals with terms such as “counterparties” and “negotiations,” after scandal discourse revolves around Author B providing advice and legal counsel to fellow employees.
The post-scandal emails are more formal, containing greater usage of email signatures (e.g., job title, contact information).
Bag-of-word parallel coordinates for these signature terms (e.g., title, address, phone number) correspond to the first 12 features while terms relating to business legalities correspond to the latter features (e.g., 15-30).

48
Application Example: The Enron Case
• Yates and Orlikowski (1999) stated that “the purpose of a genre is not an individual’s private motive for communicating, but purpose socially constructed and recognized by the relevant organizational community…” (p. 15).
• Important characteristics of a genre form include structural and linguistic features including elements of style such as the level of formality and text formatting.
• For Author B, the post scandal emails signify a shift in genres.
MDS Plots of Bag-of-Words
Before Scandal:
Business/legal terms
After Scandal:
Job title and contact information

49
Evaluation
Text Categorization using Writeprints and Ink Blots– Writeprints and Ink Blots represent the two core components of
CyberGate. – In addition to analysis, the two techniques can also support text
categorization. • Writeprints is effective at capturing occurrence variation which can be
useful for categorizing style. • Ink Blots is geared towards occurrence frequency which can be beneficial
for topical and sentiment categorization.
• Conducted 5 experiments to evaluate techniques:– Categorization of Ideational Information
• Topics -> Topic Categorization • Opinions -> Sentiment Classification
– Categorization of Textual Information• Style -> Authorship Classification• Genres -> Genre Classification
– Categorization of Interpersonal Information• Interaction -> Interactional Coherence Analysis
50
Evaluation
• Compared Writeprints and Ink Blots with SVM.– SVM – SVM run using same features as CyberGate– Baseline – SVM run using bag-of-words
– Support Vector Machine (SVM) has been a powerful machine learning algorithm for text categorization.
• Topic Classification (Dumais et al., 1998)• Sentiment Classification (Pang et al., 2002)• Authorship Classification (Abbasi & Chen, 2005; Zheng et al.,
2006)• Genre Classification (Santini, 2004)
– Run using linear kernel with sequential minimal optimization (SMO) algorithm (Platt, 1999)
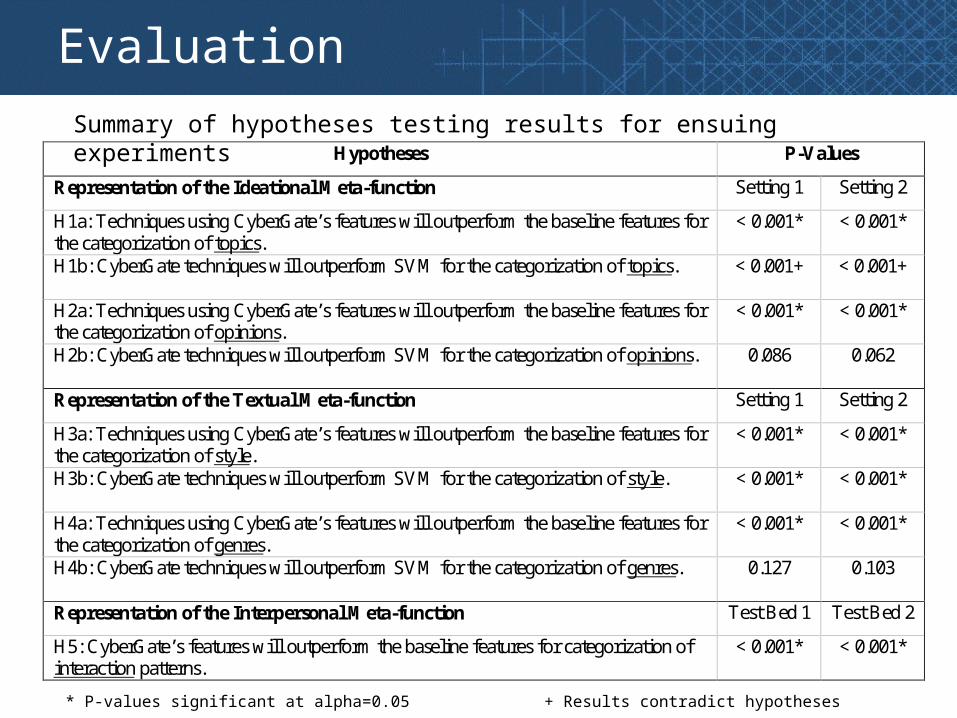
Evaluation
Hypotheses P-Values
Representation of the Ideational Meta-function Setting 1 Setting 2
H1a: Techniques using CyberGate’s features will outperform the baseline features for the categorization of topics.
< 0.001* < 0.001*
H1b: CyberGate techniques will outperform SVM for the categorization of topics.
< 0.001+ < 0.001+
H2a: Techniques using CyberGate’s features will outperform the baseline features for the categorization of opinions.
< 0.001* < 0.001*
H2b: CyberGate techniques will outperform SVM for the categorization of opinions.
0.086 0.062
Representation of the Textual Meta-function Setting 1 Setting 2
H3a: Techniques using CyberGate’s features will outperform the baseline features for the categorization of style.
< 0.001* < 0.001*
H3b: CyberGate techniques will outperform SVM for the categorization of style.
< 0.001* < 0.001*
H4a: Techniques using CyberGate’s features will outperform the baseline features for the categorization of genres.
< 0.001* < 0.001*
H4b: CyberGate techniques will outperform SVM for the categorization of genres.
0.127 0.103
Representation of the Interpersonal Meta-function Test Bed 1 Test Bed 2
H5: CyberGate’s features will outperform the baseline features for categorization of interaction patterns.
< 0.001* < 0.001*
Summary of hypotheses testing results for ensuing experiments
* P-values significant at alpha=0.05 + Results contradict hypotheses
52
Evaluation: Experiment 1
• Topic Categorization
– Objective to test effectiveness of features and techniques for capturing topical information.
– Test bed = 10 topics taken from Enron email corpus (100 emails per topic).
– Compared SVM against Ink Blot technique.
– Feature set = bag-of-words and noun phrases• Both effective in prior research (Dumais et al., 1998; Chen et al., 2003).
– Two experiment settings were run, one using 5 topics and the other one using all 10 topics.
– Both techniques were run using 10-fold cross validation.
– For Ink Blots, the class with the highest ratio of red to blue blot area was assigned the anonymous message.

53
Evaluation: Experiment 1
• Topic Categorization Results
– Both techniques achieved accuracy over 90% in all instances.
– SVM significantly outperformed the Ink Blot technique for the 5 and 10 topic experiment settings.
– The higher performance of SVM was attributable to its ability to better classify the small percentage of messages that were in the gray area between topics.
Techniques
# Topics SVM Ink Blots Baseline
5 topics 95.70 92.25 88.75
10 Topics 93.25 90.10 86.55
54
Evaluation: Experiment 2
• Sentiment Classification
– Objective to test effectiveness of features and techniques for capturing opinions.
– Test bed of 2000 digital camera product reviews taken from www.epinions.com.
• 1000 positive (4-5 star) and 1000 negative (1-2 star) reviews• 500 for each star level (i.e., 1,2,4,5)
– Two experimental settings were tested• Classifying 1 star versus 5 star (extreme polarity)• Classifying 1+2 star versus 4+5 star (milder polarity)
– Feature set encompassed a lexicon of 3000 positive or negatively oriented adjectives and word n-grams (Pang et al., 2002; Turney & Littman, 2003).
– Compared Ink Blots against SVM.• Both run using 10-fold cross validation.

55
Evaluation: Experiment 2• Sentiment Classification Results
– SVM marginally outperformed Ink Blots however the enhanced performance was not statistically significant (p-values on pair wise t-tests > 0.05).
– The overall accuracies for both techniques were consistent with previous work which has been in the 85%-90% range (e.g., Pang et al., 2002).
– Once again the improved performance of SVM was attributable to its ability to better detect messages containing sentiments with less polarity.
– Many of the milder (2 and 4 star) reviews contained positive and negative comments about different aspects of the product.
• It was more difficult for the Ink Blot technique to detect the overall orientation of many of these messages.
Techniques
Sentiments SVM Ink Blots Baseline
Extreme Polarity 93.00 92.20 83.00
Mild Polarity 89.40 86.80 77.10
56
Evaluation: Experiment 3
• Style Classification– Used to test effectiveness of features and techniques for
capturing style.
– Test bed = Enron email corpus (used 25 or 50 authors)
– Entity resolution classification task in which half of messages used for training (known entity) and half for testing (anonymous identity).
• Objective is to match anonymous identity to the correct known entities (in training data) based on stylistic/authorship tendencies.
– Feature set consisted of lexical, syntactic, structural, content-specific, and n-grams.
• The effectiveness of these features as style markers has previously been demonstrated (Abbasi & Chen, 2005; Zheng et al., 2006).
– Compared Writeprints against SVM.

57
Evaluation: Experiment 3
• Style Classification Results
– Writeprints outperformed SVM by 8%-10% for both experimental settings.
– The improved performance was statistically significant for 25 and 50 authors.
– Furthermore, the Writeprint accuracies for such a large number of authors are higher than previous studies (Zheng et al., 2006).
Techniques
# Authors SVM Writeprints Baseline
25 Authors 84.00 92.00 62.00
50 Authors 80.00 90.00 51.00

58
Evaluation: Experiment 4
• Genre Classification
– Objective to test effectiveness of features and techniques for capturing genres.
– Test bed of 3000 forum postings from the Sun Technology Forum (forum.java.sun.com)
– Genres included questions, informative messages, and general messages (no information, just comments).
• 1000 messages used for each genre.
– Two experimental settings were run:• Questions (1000 messages) versus non-questions (500 informative, 500 comments)• All three genres (1000 messages each)
– The feature set consisted of lexical, syntactic, structural, content-specific, and n-gram features.
– Compared Ink Blots with SVM (again, 10-fold CV).

59
Evaluation: Experiment 4
• Genre Classification Results
– Ink Blots marginally outperformed SVM however the enhanced performance was not statistically significant based on pair wise t-tests (p-values > 0.05).
– The overall accuracies for both techniques were consistent with previous results dealing with 2-3 genres (e.g., Santini, 2004).
– This provides evidence for the effectiveness of the underlying features and techniques for categorizing genres.
Techniques
Genres SVM Ink Blots Baseline
Questions vs. Non-questions 98.10 98.55 90.10
All Three Genres 96.40 96.50 86.00

60
Evaluation: Experiment 5
• Interactional Coherence Analysis
– We used two test beds: • Four conversation threads taken from the Sun Java Technology
forum (1200 messages posted by 120 users).• Three threads taken from the LNSG social discussion forum (400
messages posted by 100 users).
– The CyberGate feature set consisted of structural features (taken from the message headers) as well as function words, bag-of-words, noun phrases, and named entities derived from body text.
• Intended to represent various interaction cues, including direct address and lexical relations.
– The baseline feature set consisted of only structural features, as used in prior systems (Donath et al., 1999; Smith and Fiore, 2001).
– Used the F-measure to evaluate performance

61
Evaluation: Experiment 5
• Interactional Coherence Analysis Results
– CyberGate’s extended feature set significantly outperformed the baseline (p-values < 0.001).
– The performance difference was more pronounced on the LNSG forum.
– Users in this forum make less use of structural features when interacting with one another, instead preferring to rely on text-based interaction cues.
– The results illustrate the importance of using richer features for representing CMC interactions.
Features
Test Bed CyberGate Baseline
Sun Java Forum 86.00 77.40
LNSG Forum 77.11 55.55

62
Evaluation
• Results Discussion
• The Writeprint and Ink Blot techniques performed well, typically with categorization accuracy over 90%.
• SVM performed better on ideational information types while Writeprints and Ink Blots outperformed SVM on textual information. – SVM had higher accuracy for topic and sentiment classification
(significantly higher for topics).– Writeprints and Ink Blots had higher accuracy for style and genre
classification (significantly higher for authorship style classification).
• In all instances, the Writeprint and Ink Blot performance was at least on par with the state-of-the art categorization accuracies reported in previous studies. – In the case of Writeprints for style classification, the performance was
considerably better than results obtained in previous research.
• The results support the viability of CyberGate’s core techniques for textual categorization of ideational and textual information.
63
Conclusion
• In this paper our major research contributions are two-fold:
• Firstly, we developed a framework for the categorization and analysis of computer mediated communication text. – Based on representational richness, taken from Systemic Functional
Linguistic Theory, and methodological triangulation.
• Secondly, we developed the CyberGate system to evaluate the efficacy of our design framework.– Features the Writeprint and Ink Blot techniques – Presented an application example to illustrate text analysis capabilities – Experiments were conducted to evaluate the ability of the CyberGate
components for categorization of CMC text.
• The results indicated that Writeprints and Ink Blots were effective for analysis and categorization of web discourse.

64
Appendix: CyberGate Interface

65
Appendix: CyberGate Interface


![Abbasi MM Lect1 [Compatibility Mode]](https://static.fdocuments.us/doc/165x107/577d33d41a28ab3a6b8bdfc7/abbasi-mm-lect1-compatibility-mode.jpg)