1 Copyright © 2015, Health and Social Care Information Centre. All rights reserved Breast Screening...
13
1 Copyright © 2015, Health and Social Care Information Centre. All rights reserved Breast Screening Programme, England, Statistics for 2013-14: Graphs
-
Upload
rogelio-newbrough -
Category
Documents
-
view
215 -
download
1
Transcript of 1 Copyright © 2015, Health and Social Care Information Centre. All rights reserved Breast Screening...

1
Copyright © 2015, Health and Social Care Information Centre. All rights reserved
Breast Screening Programme, England, Statistics for 2013-14: Graphs

Figure 1: Breast screening coverage among women aged 53-70 England at 31 March, 2004 to 2014
N.B. The definition of coverage changed in 2013 to include short term recalls.© Data prior to 2005, re-used with the permission of the Department of Health.Source: KC63 Health and Social Care Information Centre.

Figure 2: Breast screening coverage among women aged 53-70, by regionEngland, 31 March 2014
Source: KC63, Health and Social Care Information Centre.
78.9
77.1
68.9
76.6
76.5
80.3
72.7
76.1
77.9
45 50 55 60 65 70 75 80 85
South West
South East
London
East of England
West Midlands
East Midlands
North West
Yorkshire & Humber
North East
Percent
Minimum standard - 70.0 England - 75.9

Figure 3: Breast screening coverage among women aged 53-70, by Local AuthorityEngland, 31 March 2014
Source: KC63, Health and Social Care Information Centre
England Coverage – 75.9%

* Data excludes short term recalls and self/GP referrals.© Data prior to 2005, re-used with the permission of the Department of Health.Source: KC62 (Part 1, Tables A to C2) Health and Social Care Information Centre
Figure 4: Uptake* by women aged 50-70 of invitations to screenEngland, 2003-04 to 2013-14

Figure 5: Uptake by women aged 50 to 70 of invitations to screen by invitation typeEngland, 2013-14
Source: KC62 (Part 1, Tables A to D) Health and Social Care Information Centre.
65.8 18.3 86.8 42.4 99.6 83.3 72.10
20
40
60
80
100
First invitationfor screening
Routineinvitation
(previous non-attender)
Routineinvitation
(within 5 yrs)
Routineinvitation (more
than 5 yrs)
Short-termrecall
invitations
First & routineinvitation
(within 5 yrs)
First & allroutine
invitations
Percent
Invitation type grouping
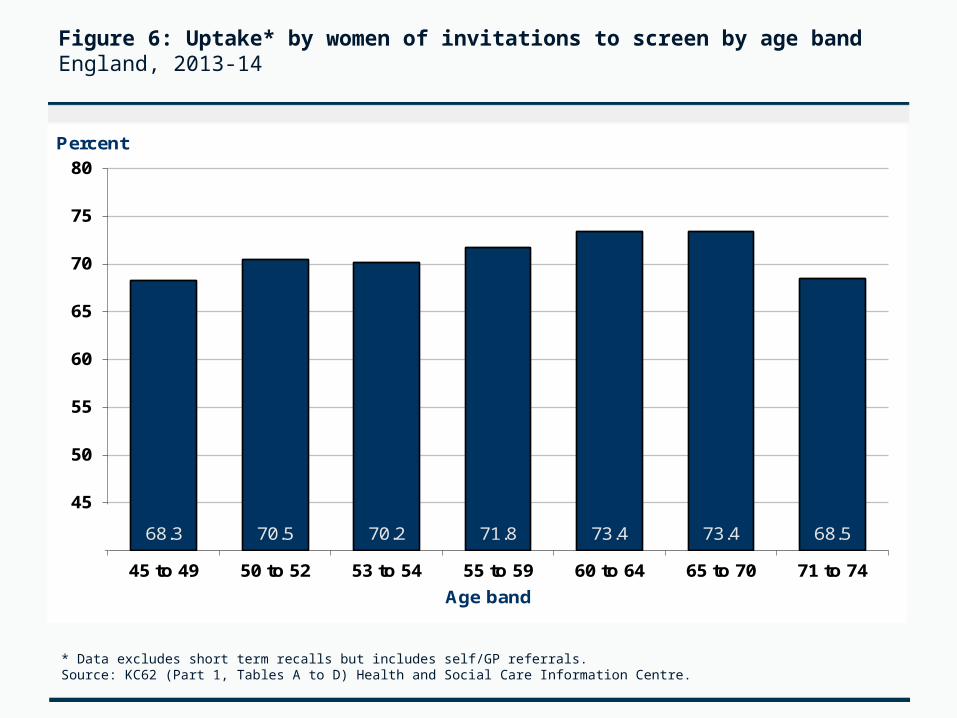
Figure 6: Uptake* by women of invitations to screen by age bandEngland, 2013-14
* Data excludes short term recalls but includes self/GP referrals.Source: KC62 (Part 1, Tables A to D) Health and Social Care Information Centre.
68.3 70.5 70.2 71.8 73.4 73.4 68.540
45
50
55
60
65
70
75
80
45 to 49 50 to 52 53 to 54 55 to 59 60 to 64 65 to 70 71 to 74
Percent
Age band

Figure 7: Uptake* by women aged 50-70 of invitations to screen by reporting region**England, 2012-13 and 2013-14
* Data excludes short term recalls and self/GP referrals. ** The South East reporting region is further broken down into the South Central and South East Coast sub regions. The North East, Yorkshire & the Humber (NEYH) reporting region is further broken down into the Yorkshire & the Humber and the North East sub regions. Source: KC62 (Part 1, Tables A to C2) Health and Social Care Information Centre.
74.0 76.2 72.7 70.0 76.1 72.1 74.4 63.3 73.5 72.3 74.9 75.672.7 74.9 71.5 69.3 78.6 73.0 74.6 62.9 73.7 73.3 74.1 75.850
55
60
65
70
75
80
NEYH NorthEast
Yorkshire& the
Humber
NorthWest
EastMidlands
WestMidlands
East ofEngland
London SouthEast
SouthEast
Coast
SouthCentral
SouthWest
Percent 2012-13 2013-14 England Min Standard
Yorkshire& the
Humber
NorthEast
South East
Coast
South Central
Reporting regions
Sub regions2012-13 2013-14

Figure 8: Uptake* by women aged 50-70 of invitations to screen by breast screening unitEngland, 2013-14
* Data excludes short term recalls and self/GP referrals.Source: KC62 (Part 1, Tables A to C2) Health and Social Care Information Centre.
2 211 29 34
2
0
5
10
15
20
25
30
35
40
55 to <60 60 to <65 65 to <70 70 to <75 75 to <80 80 to <85
Number of BSUs
Percent
Minimum standard

Figure 9: Women aged 45 and over with cancer detected (rate per 1,000 women screened) by type/sizeEngland, 2003-04 to 2013-14
Source: KC62 (Parts 1 and 3, Table T) Health and Social Care Information Centre.
7.98.3
8.6
2.83.0 3.1
3.3 3.3 3.5
1.7 1.8 1.9
0.0
1.0
2.0
3.0
4.0
5.0
6.0
7.0
8.0
9.0
10.0
2003-04 2004-05 2005-06 2006-07 2007-08 2008-09 2009-10 2010-11 2011-12 2012-13 2013-14
Year
All cancers detected Invasive (15mm or greater)
Small invasive (less than 15mm) Non-invasive or micro-invasive
Extension of screening to women aged 47-49 and 71-73 begins – 2009-10
All BSUs had started screening women aged 65-70 –April 2006
Rate (per 1,000screened)

Figure 10: Women with cancer detected (rate per 1,000 women screened) by age groupEngland, 2003-04 to 2013-14
© Data prior to 2004-05, re-used with the permission of the Department of Health.Source: KC62 (Parts 1 and 3, Table T) Health and Social Care Information Centre.
6.1
6.77.06.9
6.6 6.5
8.8 8.9 9.0
11.8
10.311.1
16.1
14.6
15.6
0
2
4
6
8
10
12
14
16
18
2003-04 2004-05 2005-06 2006-07 2007-08 2008-09 2009-10 2010-11 2011-12 2012-13 2013-14
Year
50 - 54 55 - 59 60 - 64
65 - 70 Over 70
Rate (per 1,000 screened)

Figure 11: EXPERIMENTAL STATISTICS – Total high-risk women screened by risk categoryEngland, 2013-14
Source: KC62 (Table U) Health and Social Care Information Centre.

Figure 12: EXPERIMENTAL STATISTICS – Total high-risk women screened by reporting region*England, 2013-14
* The South East reporting region is further broken down into the South Central and South East Coast sub regions. The North East, Yorkshire & the Humber (NEYH) reporting region is further broken down into the Yorkshire & the Humber and the North East sub regions.Source: KC62 (Table U) Health and Social Care Information Centre.
128
85
81
166
400
99
0
59
105
156
118
274
0 50 100 150 200 250 300 350 400 450
South West
South Central
South East Coast
South East
London
East of England
West Midlands
East Midlands
North West
Yorkshire and the…
North East
NEYH
No. screened
North East
Yorkshire & the Humber
South East Coast
South Central

![Screening for Breast Cancer[1]](https://static.fdocuments.us/doc/165x107/577d2c841a28ab4e1eac7094/screening-for-breast-cancer1.jpg)