Six Sigma Workbook For Dummies (For Dummies (Business & Personal Finance))
Upload
verity-barkerCategory
view
221download
1
11
Contextual Value Contextual Value Added and Data Added and Data
For DummiesFor Dummies
The mystery explainedThe mystery explained

22
Objectives – to understandObjectives – to understand
Contextual Value added – how it Contextual Value added – how it is calculated and factors which is calculated and factors which affect it.affect it.
Performance descriptors “good”, Performance descriptors “good”, “satisfactory” and “satisfactory” and “unsatisfactory”.“unsatisfactory”.
How Ofsted form judgements on How Ofsted form judgements on performance data.performance data.

33
Objectives – to understandObjectives – to understand
Key Lessons from data analysis – Key Lessons from data analysis – self evaluationself evaluation
What are we going to do about What are we going to do about it?it?
Links with Performance Links with Performance Management and improvement Management and improvement plans (school and subject)plans (school and subject)

44
School ContextSchool Context

55
School ContextSchool Context

66
School ContextSchool Context

77
School ContextSchool Context

88
School ContextSchool Context

99
School ContextSchool Context

1010
School ContextSchool Context
“bulge” of average students

1111
School ContextSchool Context
“top slicing” of most able students

1212
Value AddedValue Added
Value added is a prediction based on Value added is a prediction based on prior attainment (in SATs (standard prior attainment (in SATs (standard assessment tests) at the end of assessment tests) at the end of primary school (key stage 2 or KS2)primary school (key stage 2 or KS2)
How does progress compare with the How does progress compare with the average progress made by students average progress made by students with the same prior attainmentwith the same prior attainment
1313
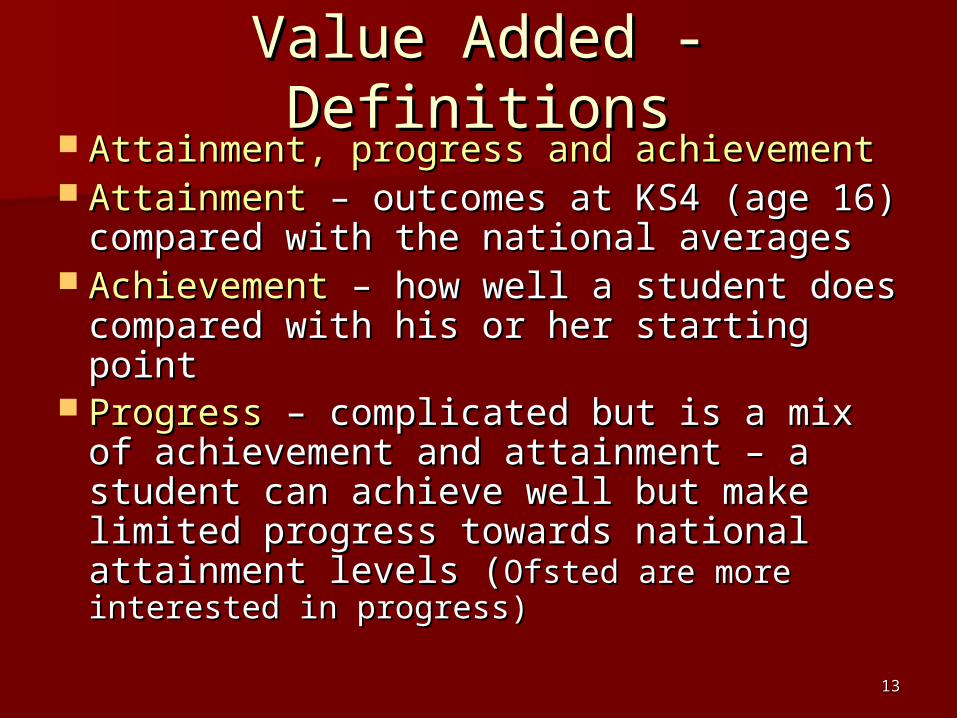
Value Added - DefinitionsValue Added - Definitions Attainment, progress and achievementAttainment, progress and achievement AttainmentAttainment – outcomes at KS4 (age 16) – outcomes at KS4 (age 16)
compared with the national averagescompared with the national averages AchievementAchievement – how well a student does – how well a student does
compared with his or her starting pointcompared with his or her starting point ProgressProgress – complicated but is a mix of – complicated but is a mix of
achievement and attainment – a achievement and attainment – a student can achieve well but make student can achieve well but make limited progress towards national limited progress towards national attainment levels (attainment levels (Ofsted are more Ofsted are more interested in progress)interested in progress)

1414
Contextual Value AddedContextual Value Added
Student Outcomes at
Age 16 (end of KS4)
Student Characteristics
School Characteristics
Prior attainment

1515
Socioeconomic and Socioeconomic and Demographic – some factors Demographic – some factors
included in CVAincluded in CVA Ethnicity – Gender – Age within year Ethnicity – Gender – Age within year
groupgroup Special Educational Needs – in care – Special Educational Needs – in care –
mobilitymobility Deprivation indicator – free school Deprivation indicator – free school
mealsmeals English as second languageEnglish as second language Prior attainment (in English and Prior attainment (in English and
Mathematics)Mathematics)

1616
Expected Progress - Expected Progress - SatisfactorySatisfactory

1717
Progress – Value AddedProgress – Value Added

1818
Progress – Value AddedProgress – Value Added
“measure of
value added”

1919
Progress – Less than PredictedProgress – Less than Predicted
“measure of under
performance”

2020
Progress – Broadly Average Progress – Broadly Average RangeRange

2121
Progress - 2008Progress - 2008

2222
Progress - 2008Progress - 2008
Seriously underachievin
g students

2323
Progress - 2008Progress - 2008
Above line is positiv
e value

2424
Progress – Broadly Average Progress – Broadly Average RangeRange
The middle 50% of children
nationally fall into this range

2525
Progress – “Good” Value AddedProgress – “Good” Value Added

2626
Progress – “Good” Value AddedProgress – “Good” Value Added Progress made by
children in top 25%
nationally

2727
Progress – Progress – “Unsatisfactory” Value “Unsatisfactory” Value
AddedAdded
Poor progress made by
children in bottom 25% nationally

2828
Secondary Schools – Secondary Schools – relative relative
performanceperformance

2929
Secondary Schools – Secondary Schools – relative relative
performanceperformance Each 1% strip
contains about 33 schools

3030
Secondary Schools – Secondary Schools – relative relative
performanceperformance “Median” position –
comparing all schools by
progress and achievement
3131
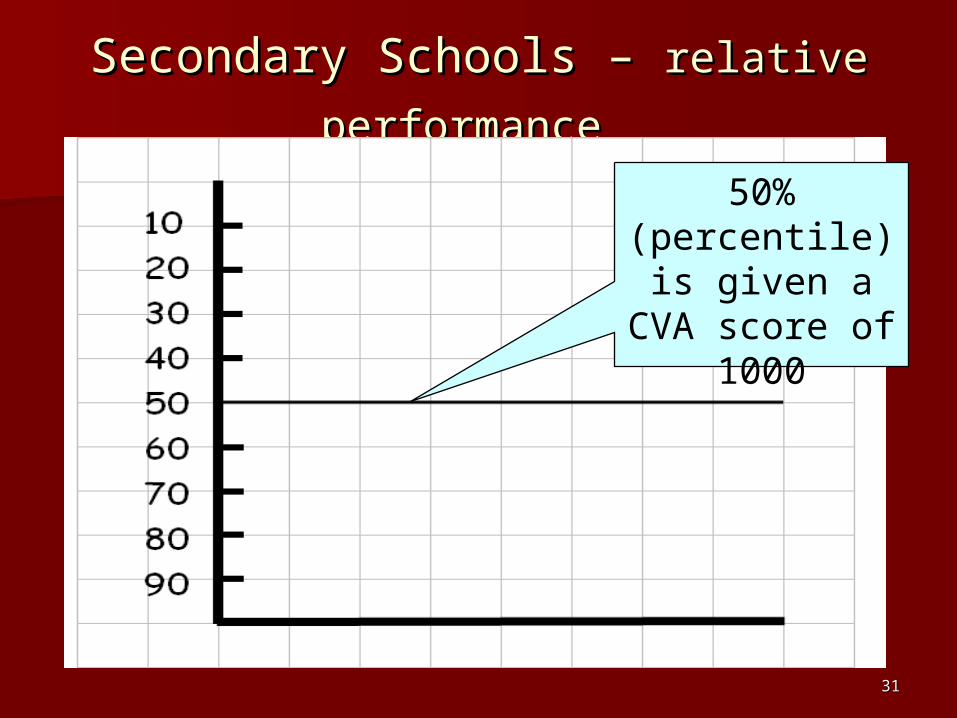
Secondary Schools – Secondary Schools – relative relative
performanceperformance 50%
(percentile) is given a CVA
score of 1000

3232
Secondary Schools – Secondary Schools – middle 50% of middle 50% of all schools is “broadly average all schools is “broadly average
performance”performance”

3333
Secondary Schools – Secondary Schools – middle 50% of middle 50% of all schools is “broadly average all schools is “broadly average
performance”performance”
Moving towards the
“good” schools

3434
Secondary Schools – Secondary Schools – middle 50% of middle 50% of all schools is “broadly average all schools is “broadly average
performance”performance” Moving
towards the “unsatisfactory” schools

3535
Secondary Schools – Secondary Schools – relative relative
performanceperformance
Above 25% are the “good” schools

3636
Secondary Schools – Secondary Schools – relative relative
performanceperformance
Top end – the “outstanding
” schools

3737
Secondary Schools – Secondary Schools – relative relative
performanceperformance Below 25% are
the “unsatisfactory”
schools

3838
Secondary Schools – Secondary Schools – relative relative
performanceperformance Bottom “very
weak” schools – possible “special
measures”

3939
Secondary Schools – Secondary Schools – relative relative
performanceperformance
1025
1005 995
980

4040
Conversion of Grades to Points Conversion of Grades to Points for Calculationsfor Calculations
GCSE GCSE GradesGrades
GCSE GCSE PointsPoints
GCSE GCSE GradesGrades
GCSE GCSE PointsPoints
A*A* 5858 DD 3434
AA 5252 EE 2828
BB 4646 FF 2222
CC 4040 GG 1616

4141
Subject Performance at GCSE in 2009Subject Performance at GCSE in 2009

4242
Subject Performance at GCSE in 2009Subject Performance at GCSE in 2009
58% predicted to get A-C, 76% achieved = significant value added = “good”
8% more students got A-A* than expected – value added but not significant (top end of satisfactory)

4343
Subject Performance at GCSE in 2009Subject Performance at GCSE in 2009

4444
CVA – Individual StudentsCVA – Individual Students
This student is predicted This student is predicted to get 8 GCSEs at grade Cto get 8 GCSEs at grade C
Total points score = 320Total points score = 320 This is the FFT B (median) This is the FFT B (median)
predictionspredictions He gets 320 points He gets 320 points This student achieves 0 This student achieves 0
value added points.value added points.

4545
CVA – Individual StudentsCVA – Individual Students This student is predicted This student is predicted
to get 8 GCSEs at grade B to get 8 GCSEs at grade B from prior attainment.from prior attainment.
Total points score = 384Total points score = 384 This is the FFT B (median) This is the FFT B (median)
predictionspredictions She gets 394 points She gets 394 points What is her value added What is her value added
score?score?

4646
CVA – Individual StudentsCVA – Individual Students She is a girl and she gets She is a girl and she gets
free school meals (FSM)free school meals (FSM) Prediction from prior Prediction from prior
attainment = 384 pointsattainment = 384 points Add 14 points (female) = Add 14 points (female) =
398398 Subtract 22 points for FSMSubtract 22 points for FSM Total prediction = 376Total prediction = 376 Value added = 18 pointsValue added = 18 points