Biogeochemical cycle and impact of anthropogenic activity by shashi shekhar singh SES,JNU,New Delhi
date post
22-Dec-2015Category
view
215download
0
1
Context-Inclusive Approach to Speed-up Function Evaluation for Statistical Queries:
An Extended Abstract
Vijay Gandhi, James Kang, Shashi ShekharUniversity of Minnesota, USA
Junchang Ju, Eric D. Kolaczyk, Sucharita GopalBoston University, USA
ICDM Workshop on Spatial and Spatio-Temporal Data Mining
December 2006

2
Overview Motivation Problem Statement Challenges Related Work Contribution Validation Conclusion & Future Work
3
Motivation Landcover Change
Loss of land - 217 square miles of Louisiana’s coastal lands were transformed to water after Hurricanes Katrina and Rita.
Deforestation – Brazil lost 150,000 sq. km. of forest between
May 2000 and August 2006 Urban Sprawl
Mississippi River Delta, Louisiana(Red represents land loss between 2004
and 2005. Courtesy: USGS)
Deforestation, Ariquemes, Brazil(Courtesy: Global Change Program,
University of Michigan)
Urban Sprawl in Atlanta(Red indicates expansion between
1976 and 1992)
4
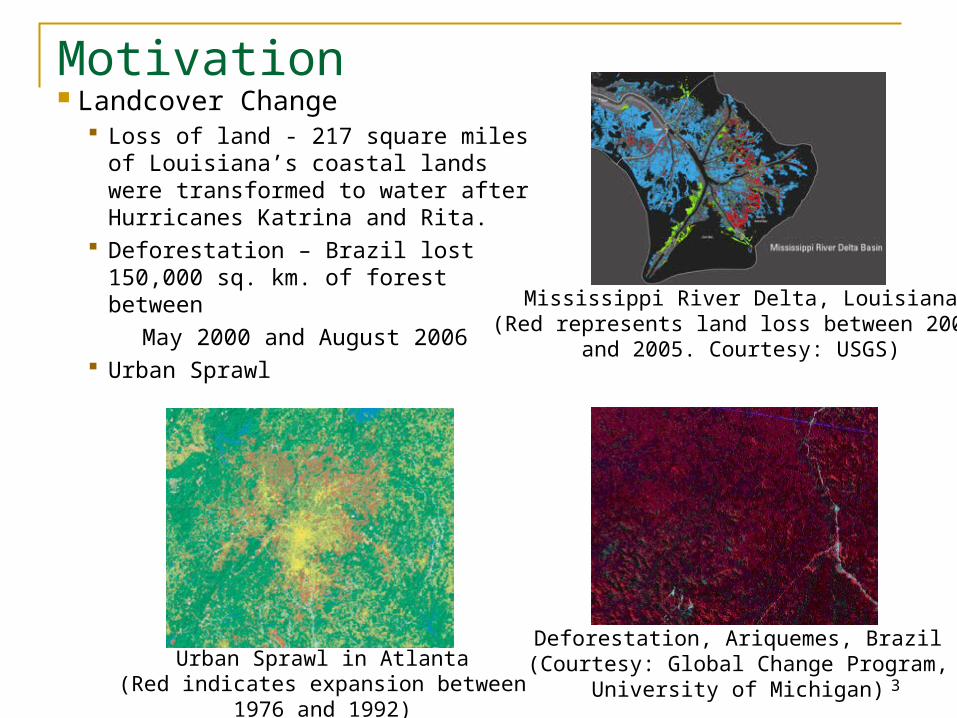
Multiscale Multigranular Image Classification (MSMG) Input: Class hierarchy, Likelihood of specific classes
Conifer Hardwood Brush Grass
Likelihood of specific-classesLand-use Class Hierarchy
Output: Classified images at multiple scales
Scale: 2x2 Scale: 4x4 Scale: 64x64. . .
Scale: 1x1
5
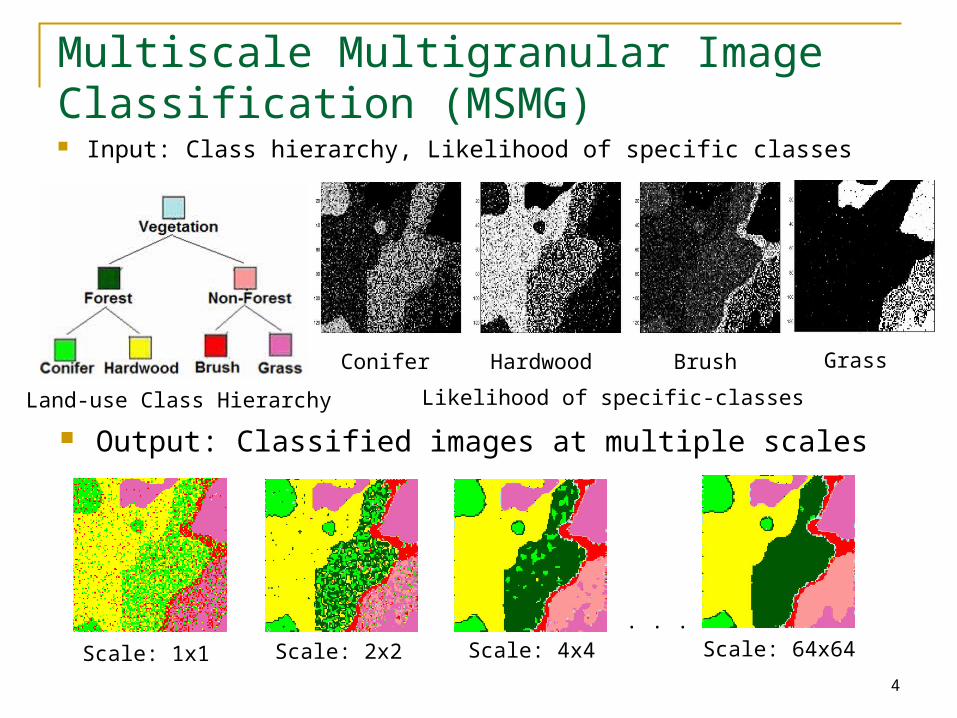
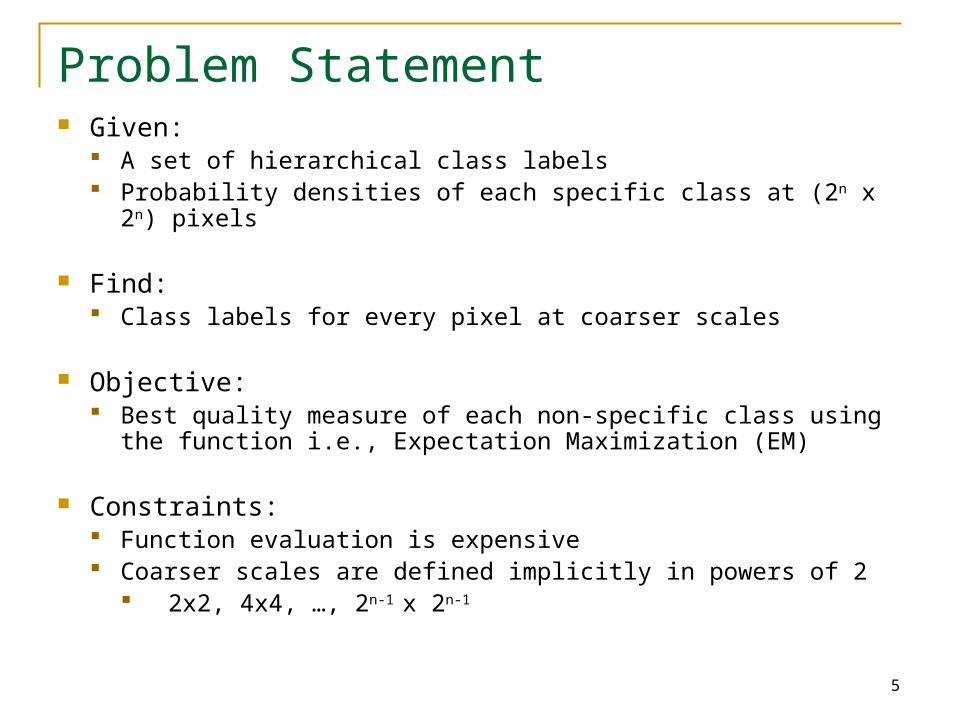
Problem Statement Given:
A set of hierarchical class labels Probability densities of each specific class at (2n x 2n) pixels
Find: Class labels for every pixel at coarser scales
Objective: Best quality measure of each non-specific class using the function
i.e., Expectation Maximization (EM)
Constraints: Function evaluation is expensive Coarser scales are defined implicitly in powers of 2
2x2, 4x4, …, 2n-1 x 2n-1
6
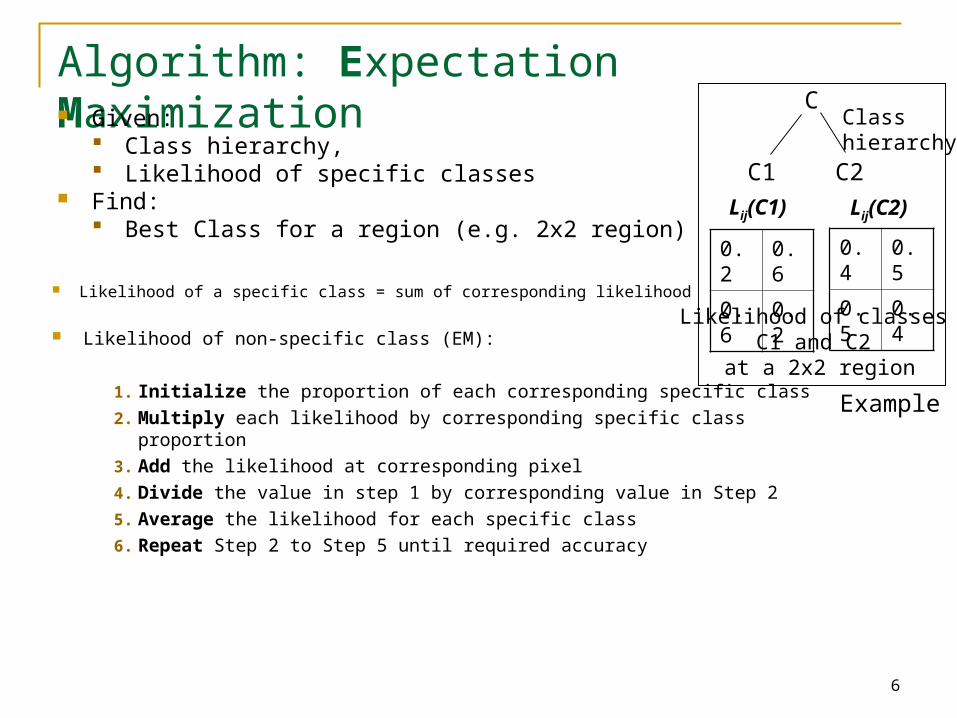
Algorithm: Expectation Maximization Given:
Class hierarchy, Likelihood of specific classes
Find: Best Class for a region (e.g. 2x2 region)
Likelihood of a specific class = sum of corresponding likelihood
Likelihood of non-specific class (EM):
1. Initialize the proportion of each corresponding specific class
2. Multiply each likelihood by corresponding specific class proportion
3. Add the likelihood at corresponding pixel
4. Divide the value in step 1 by corresponding value in Step 2
5. Average the likelihood for each specific class
6. Repeat Step 2 to Step 5 until required accuracy
Likelihood of classes C1 and C2
at a 2x2 region
C
C1 C2
Class hierarchy
Lij(C1) Lij(C2)
0.4 0.5
0.5 0.4
0.2 0.6
0.6 0.2
Example
7
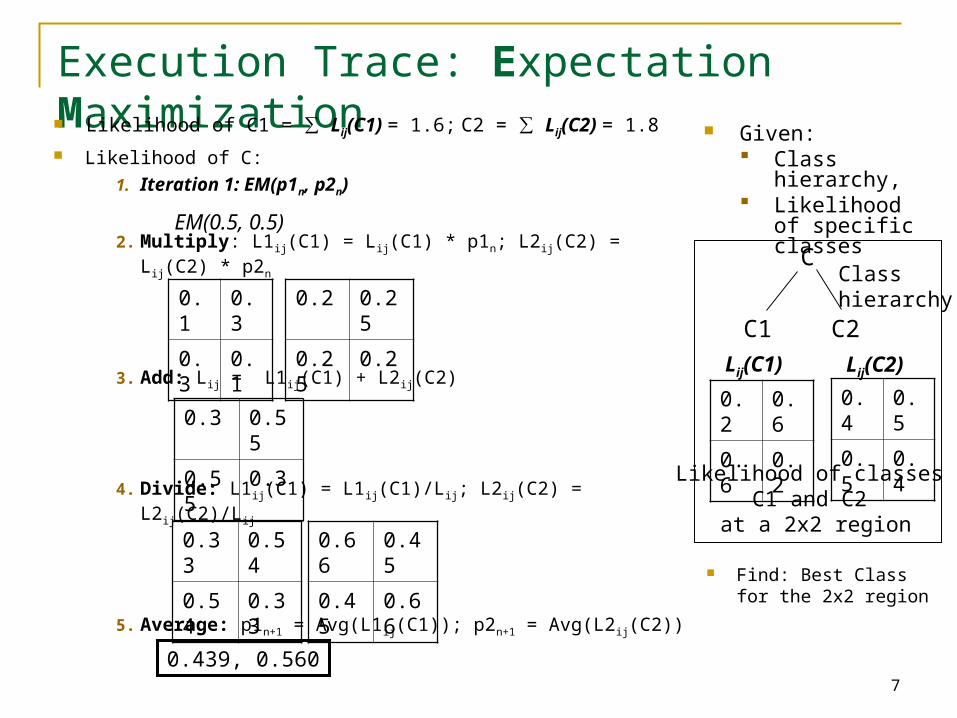
Execution Trace: Expectation Maximization
Given: Class hierarchy, Likelihood of
specific classes
0.2 0.6
0.6 0.2
0.4 0.5
0.5 0.4
Find: Best Class for the 2x2 region
Likelihood of C1 = ∑ Lij(C1) = 1.6; C2 = ∑ Lij(C2) = 1.8 Likelihood of C:
1. Iteration 1: EM(p1n, p2n)
2. Multiply: L1ij(C1) = Lij(C1) * p1n; L2ij(C2) = Lij(C2) * p2n
3. Add: Lij = L1ij(C1) + L2ij(C2)
4. Divide: L1ij(C1) = L1ij(C1)/Lij; L2ij(C2) = L2ij(C2)/Lij
5. Average: p1n+1 = Avg(L1ij(C1)); p2n+1 = Avg(L2ij(C2))
0.1 0.3
0.3 0.1
0.2 0.25
0.25 0.2
EM(0.5, 0.5)
0.3 0.55
0.55 0.3
0.33 0.54
0.54 0.33
0.66 0.45
0.45 0.66
0.439, 0.560
Likelihood of classes C1 and C2
at a 2x2 region
C
C1 C2
Class hierarchy
Lij(C1) Lij(C2)
8
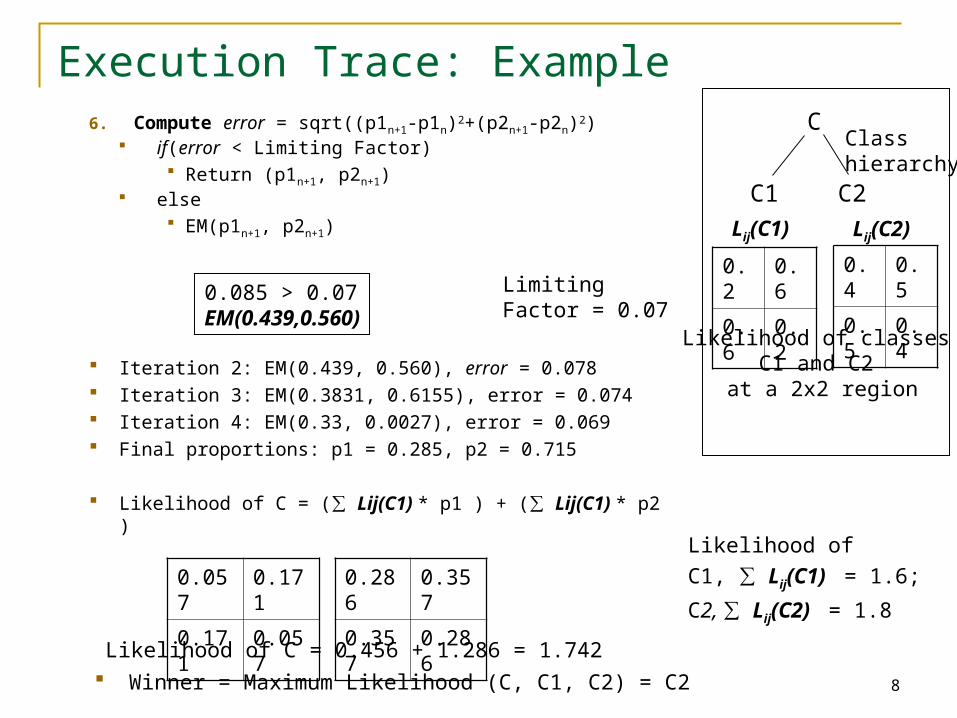
6. Compute error = sqrt((p1n+1-p1n)2+(p2n+1-p2n)2) if(error < Limiting Factor)
Return (p1n+1, p2n+1) else
EM(p1n+1, p2n+1)
Execution Trace: Example
0.085 > 0.07EM(0.439,0.560)
0.2 0.6
0.6 0.2
0.4 0.5
0.5 0.4
Likelihood of classes C1 and C2
at a 2x2 region
C
C1 C2
Class hierarchy
Lij(C1) Lij(C2)
0.057 0.171
0.171 0.057
0.286 0.357
0.357 0.286
Likelihood of C = 0.456 + 1.286 = 1.742 Winner = Maximum Likelihood (C, C1, C2) = C2
Likelihood of
C1, ∑ Lij(C1) = 1.6;
C2, ∑ Lij(C2) = 1.8
LimitingFactor = 0.07
Iteration 2: EM(0.439, 0.560), error = 0.078 Iteration 3: EM(0.3831, 0.6155), error = 0.074 Iteration 4: EM(0.33, 0.0027), error = 0.069 Final proportions: p1 = 0.285, p2 = 0.715
Likelihood of C = (∑ Lij(C1) * p1 ) + (∑ Lij(C1) * p2 )

9
Best Class at a region
= candidate models e.g. Forest, Vegetation, Conifer
= observations Likelihood of specific classes corresponding to M within the region
= likelihood (Quality Measure) of M For non-specific classes, calculated using the function i.e. EM
= Penalty function Used for non-specific classes
MSMG Classification - Formulation
})(2)|({maxargˆ MpenMxlMM
x
M
)|( Mxl
pen
10
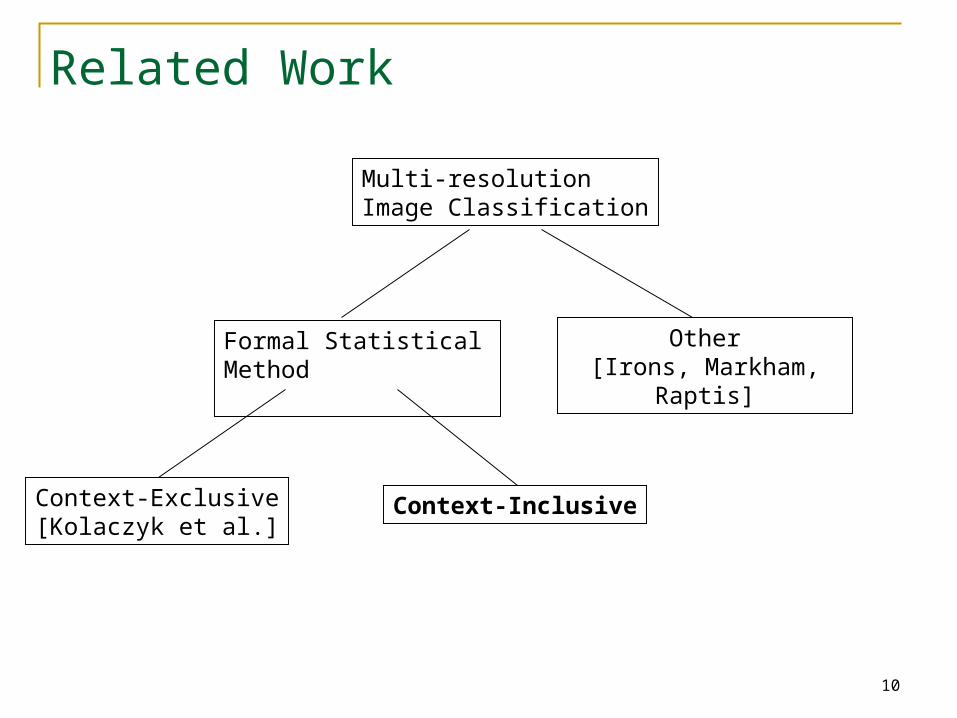
Related Work
Multi-resolution Image Classification
Formal Statistical Method
Other[Irons, Markham,
Raptis]
Context-Exclusive[Kolaczyk et al.]
Context-Inclusive

11
Context-Exclusive Approach Instance Tree
Each candidate model is analyzed independently until convergence
The candidate model with maximum likelihood is selected
Instance Tree
Context-Exclusive Approach:1. Select the best specific class, Brush2. Vegetation is evaluated until convergence (46)3. Forest is evaluated until convergence (34)4. Non-Forest is evaluated until convergence (3)5. Select the best class (Non-Forest)
1.2.
3.4.
1
2
3
4
Land-use Class Hierarchy
Total iterations: 46 + 34 + 3 = 83
12
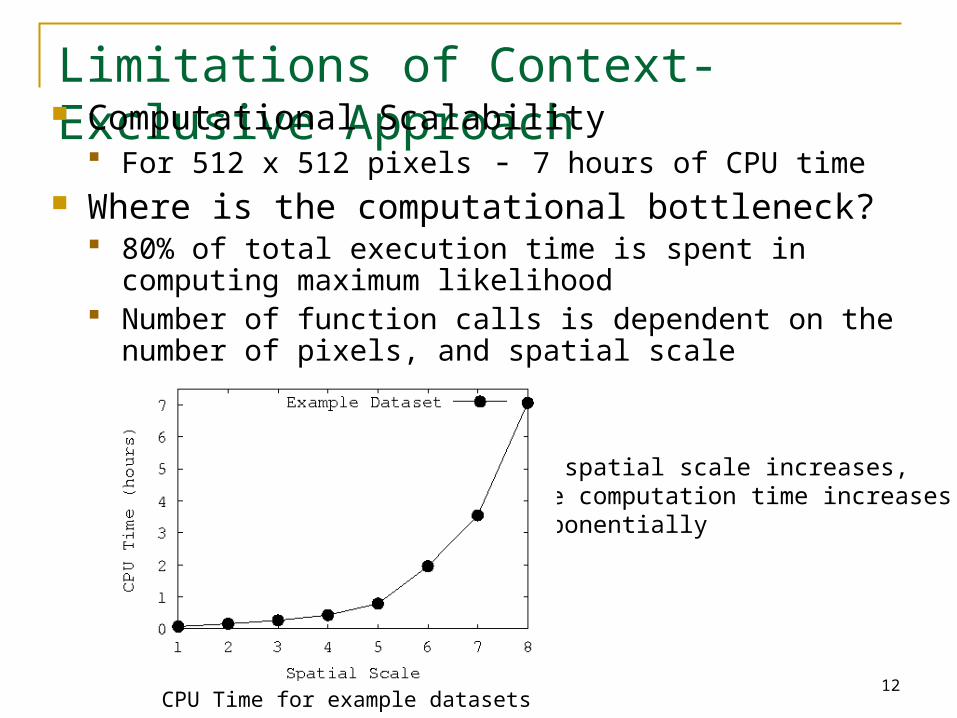
Limitations of Context-Exclusive Approach Computational Scalability
For 512 x 512 pixels - 7 hours of CPU time Where is the computational bottleneck?
80% of total execution time is spent in computing maximum likelihood
Number of function calls is dependent on the number of pixels, and spatial scale
CPU Time for example datasets
As spatial scale increases, the computation time increases exponentially

13
Contributions Context Inclusive Approach Instance Tree is evaluated with context
Each candidate model is analyzed until it is better than the current best
Uses a instance-level syntax tree
Context-Inclusive Approach:1. Select the best specific class, Brush2. Vegetation is evaluated until convergence (46)3. Forest is evaluated (4)4. Non-Forest is evaluated (1)5. Non-Forest is the best-so-far
1.2.
3.4.
1
2
3
4
Land-use Class Hierarchy
Total iterations: 46 + 4 + 1 = 51

14
Context-Exclusive vs. Context-InclusiveAlgorithm 1 Context-Exclusive Approach
1: Function ContextExclusive(set Cand)2: Select the best specific class3: for each candidate model c Cand do4: repeat5: Refine quality measure for each candidate model c Cand6: until EM converges7: end for8: Select candidate model with the maximum quality measure9: return c
1: Function ContextInclusive(set Cand)2: Select the best specific class3: for each remaining candidate model c Cand do4: repeat5: Refine quality measure for each candidate model c Cand 6: until EM converges OR quality measure exceeds best so far7: end for8: Select candidate model that is best so far9: return c
Algorithm 2 Context-Inclusive Approach

15
Convergence Test Convergence
Until ABS(Quality Measurei+1 – Quality Measurei) < Limiting Factor
Impact As Limiting Factor decreases, Computation cost increases
for Context-Exclusive As Limiting Factor decreases, precision of Quality Measure
increases for Context-Exclusive
Tradeoff Precision of Quality Measure vs. Computation cost Tradeoff is controlled by Limiting Factor

16
Experimental Design
Input: Synthetic dataset and Real dataset Language: MATLAB Platform: UltraSparc III 1.1 GHz, 1 GB RAM Measurements: Number of Iterations, CPU Time, Accuracy
ImageClassification
Benchmark Datasets
Limiting Factor
Measurements
Experimental Design
Experimental Questions: How does change in the limiting factor affect the Context-
Exclusive approach? How does Context-Exclusive compare to Context-Inclusive
approach?Candidates:Context-Exclusive,Context-Inclusive
CompareClassifications
ClassificationAccuracy
17
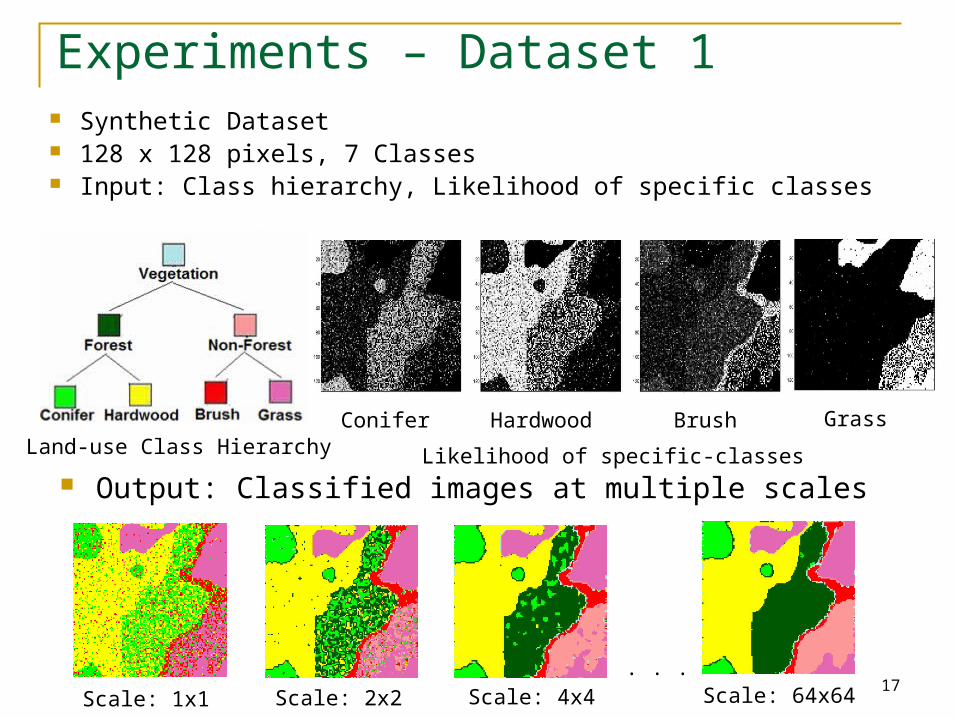
Experiments – Dataset 1 Synthetic Dataset 128 x 128 pixels, 7 Classes Input: Class hierarchy, Likelihood of specific classes
Conifer Hardwood Brush Grass
Likelihood of specific-classesLand-use Class Hierarchy
Output: Classified images at multiple scales
Scale: 2x2 Scale: 4x4 Scale: 64x64. . .
Scale: 1x1
18
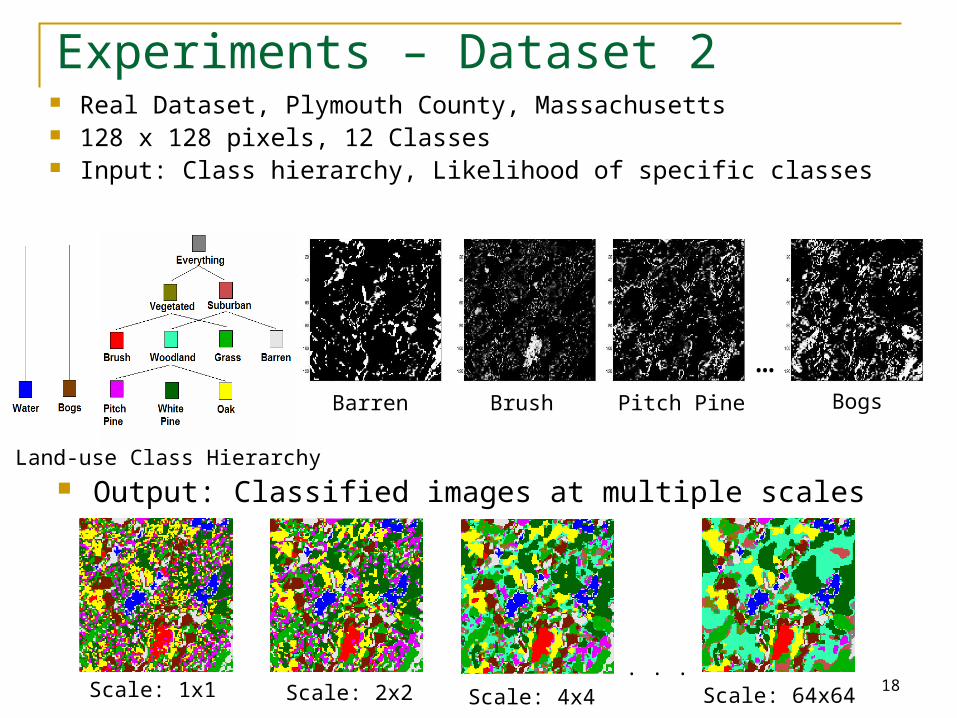
Experiments – Dataset 2 Real Dataset, Plymouth County, Massachusetts 128 x 128 pixels, 12 Classes Input: Class hierarchy, Likelihood of specific classes
Land-use Class Hierarchy
Output: Classified images at multiple scales
Scale: 2x2 Scale: 4x4 Scale: 64x64. . .
Barren Brush Pitch Pine Bogs
…
Scale: 1x1
19
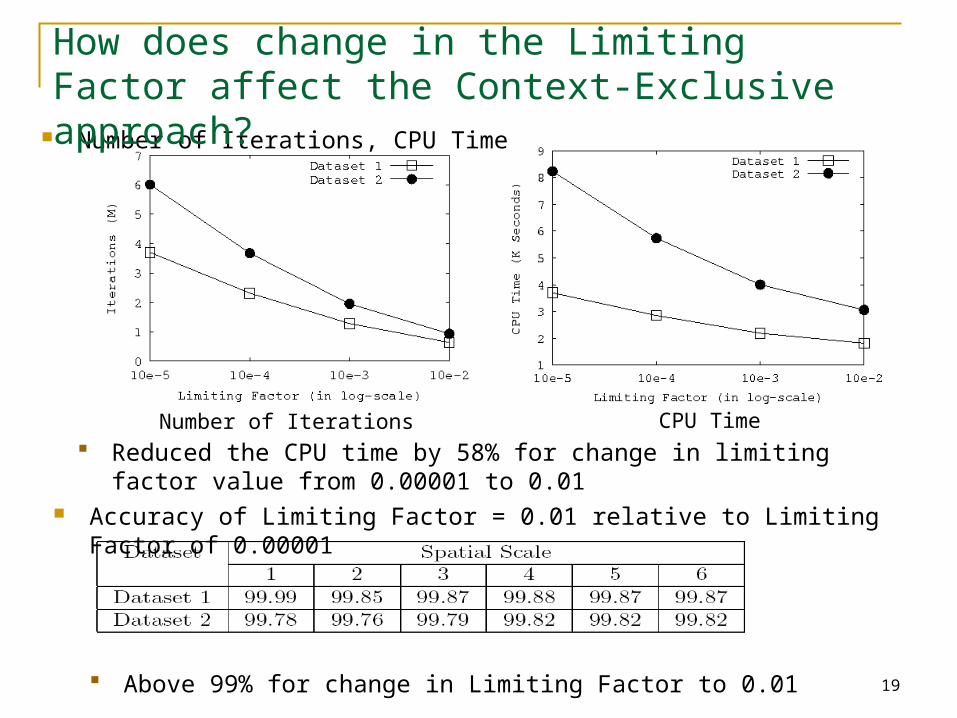
Accuracy of Limiting Factor = 0.01 relative to Limiting Factor of 0.00001
Above 99% for change in Limiting Factor to 0.01
Number of Iterations CPU Time
Number of Iterations, CPU Time
Reduced the CPU time by 58% for change in limiting factor value from 0.00001 to 0.01
How does change in the Limiting Factor affect the Context-Exclusive approach?
20
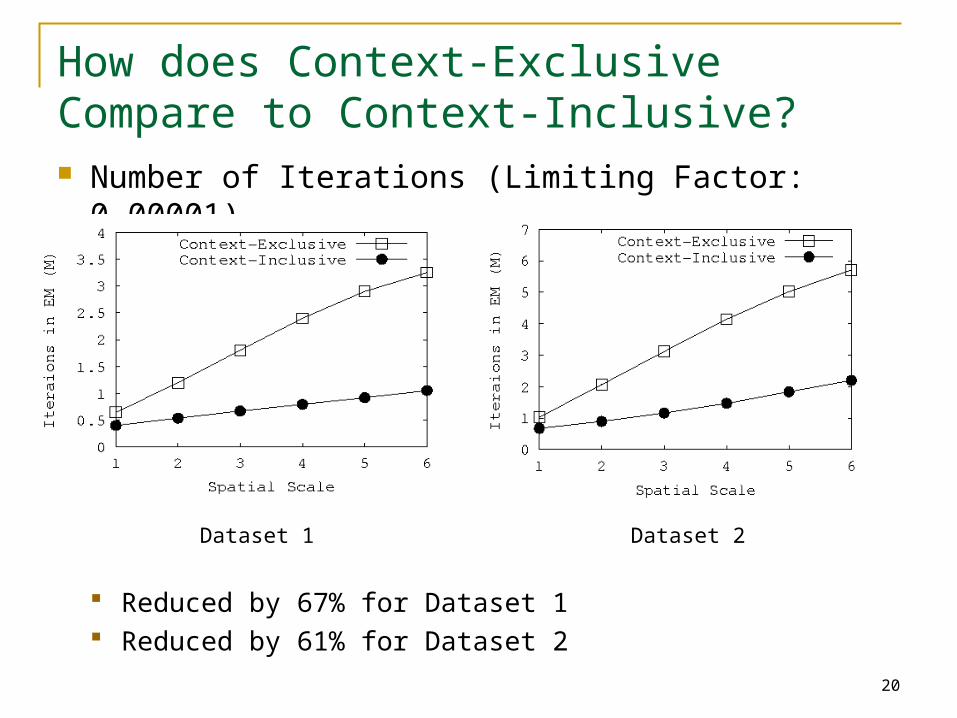
How does Context-Exclusive Compare to Context-Inclusive? Number of Iterations (Limiting Factor: 0.00001)
Reduced by 67% for Dataset 1 Reduced by 61% for Dataset 2
Dataset 1 Dataset 2
21
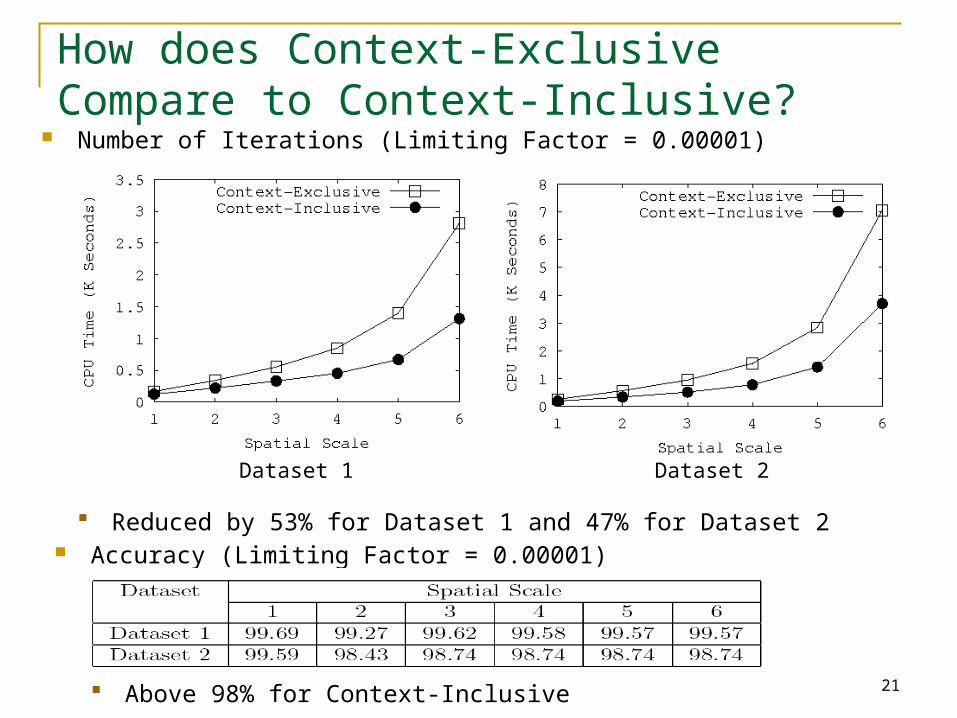
Accuracy (Limiting Factor = 0.00001)
Above 98% for Context-Inclusive
Number of Iterations (Limiting Factor = 0.00001)
Reduced by 53% for Dataset 1 and 47% for Dataset 2
How does Context-Exclusive Compare to Context-Inclusive?
Dataset 1 Dataset 2

22
Conclusion & Future Work Context-Inclusive approach for function evaluation Insight into Limiting Factor Experimental results supporting contributions Other methods may be explored:
Other type of context: Spatial Correlation between regions Bottom-up strategy instead of top-down approach
23
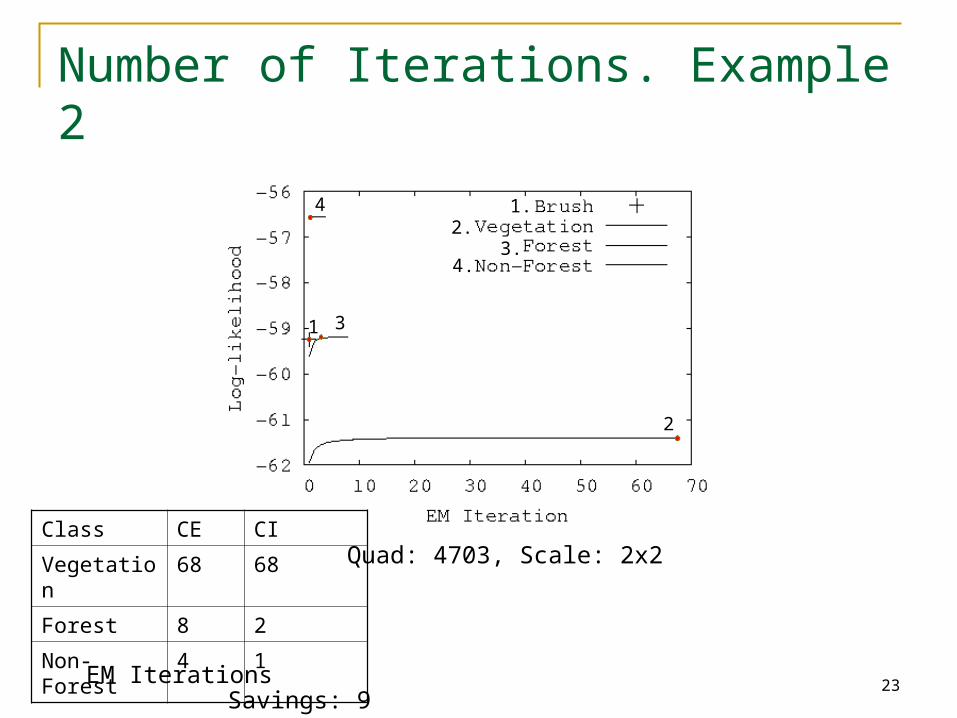
Number of Iterations. Example 2
Quad: 4703, Scale: 2x2
1
2
3
4
Class CE CI
Vegetation 68 68
Forest 8 2
Non-Forest 4 1
Savings: 9EM Iterations
1.2.
3.4.

24
Number of Iterations. Example 3
Quad: 10855, Scale: 2x2
Class CE CI
Vegetation 34 34
Forest 19 2
Non-Forest 3 1
Savings: 19EM Iterations
1.2.
3.4.
1
2
3
4

27
Forest
Non-Forest
VegetationL1
Context-Exclusive Approach Instance Tree
Each candidate model is analyzed independently until convergence
The candidate model with maximum likelihood is selected
Instance Tree
Iterations
Qua
lity
Mea
sure
Context-Exclusive Approach:1. Vegetation is evaluated until convergence, L12. Forest is evaluated until convergence, L23. Non-Forest is evaluated until convergence, L3
L2
L3
28
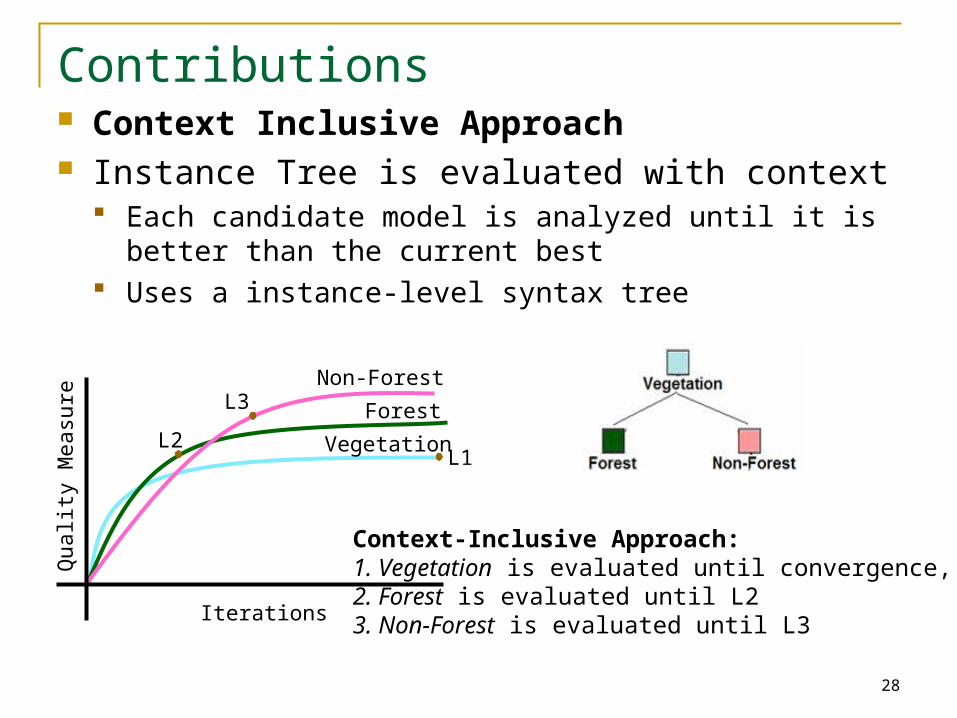
Contributions Context Inclusive Approach Instance Tree is evaluated with context
Each candidate model is analyzed until it is better than the current best
Uses a instance-level syntax tree
Context-Inclusive Approach:1. Vegetation is evaluated until convergence, L12. Forest is evaluated until L23. Non-Forest is evaluated until L3
Forest
Non-Forest
Vegetation
Iterations
Qua
lity
Mea
sure
L1L2
L3