1 Chapter 4. 2 Market Indices for USA and Latin America, 1988 - 1996 Market Indices for USA and...
63
1 Chapter 4 Chapter 4
-
date post
21-Dec-2015 -
Category
Documents
-
view
217 -
download
2
Transcript of 1 Chapter 4. 2 Market Indices for USA and Latin America, 1988 - 1996 Market Indices for USA and...

1
Chapter 4Chapter 4
2
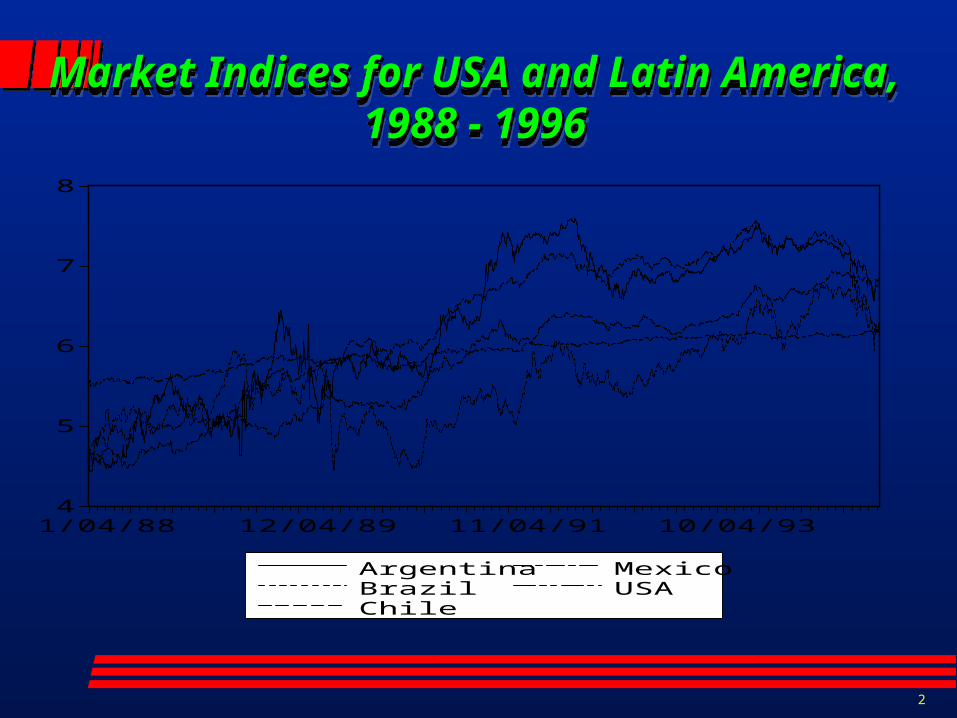
Market Indices for USA and Latin America,Market Indices for USA and Latin America,1988 - 19961988 - 1996
Market Indices for USA and Latin America,Market Indices for USA and Latin America,1988 - 19961988 - 1996
4
5
6
7
8
1/04/88 12/04/89 11/04/91 10/04/93
ArgentinaBrazilChile
MexicoUSA
3
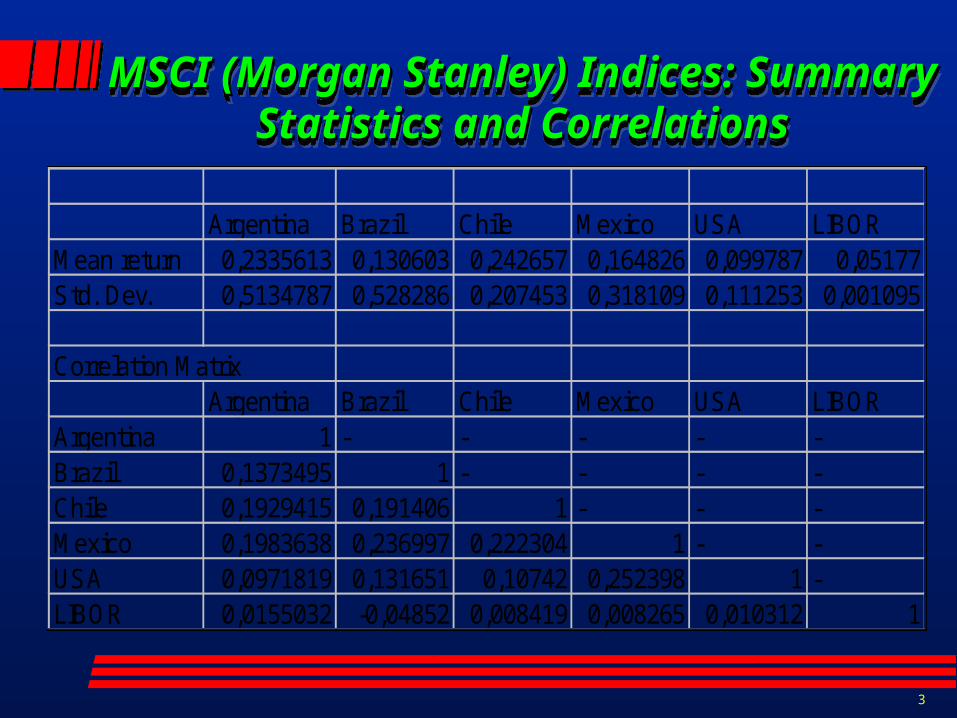
MSCI (Morgan Stanley) Indices: SummaryMSCI (Morgan Stanley) Indices: SummaryStatistics and CorrelationsStatistics and Correlations
MSCI (Morgan Stanley) Indices: SummaryMSCI (Morgan Stanley) Indices: SummaryStatistics and CorrelationsStatistics and Correlations
Argentina Brazil Chile Mexico USA LIBORMean return 0,2335613 0,130603 0,242657 0,164826 0,099787 0,05177Std. Dev. 0,5134787 0,528286 0,207453 0,318109 0,111253 0,001095
Correlation MatrixArgentina Brazil Chile Mexico USA LIBOR
Argentina 1 - - - - -Brazil 0,1373495 1 - - - -Chile 0,1929415 0,191406 1 - - -Mexico 0,1983638 0,236997 0,222304 1 - -USA 0,0971819 0,131651 0,10742 0,252398 1 -LIBOR 0,0155032 -0,04852 0,008419 0,008265 0,010312 1

4
Specification of the ModelSpecification of the ModelSpecification of the ModelSpecification of the Model
Brasily ts
USAMexico, Chile, Brazil, Argentina,],,,[ *11 kconstisx t
kt
5
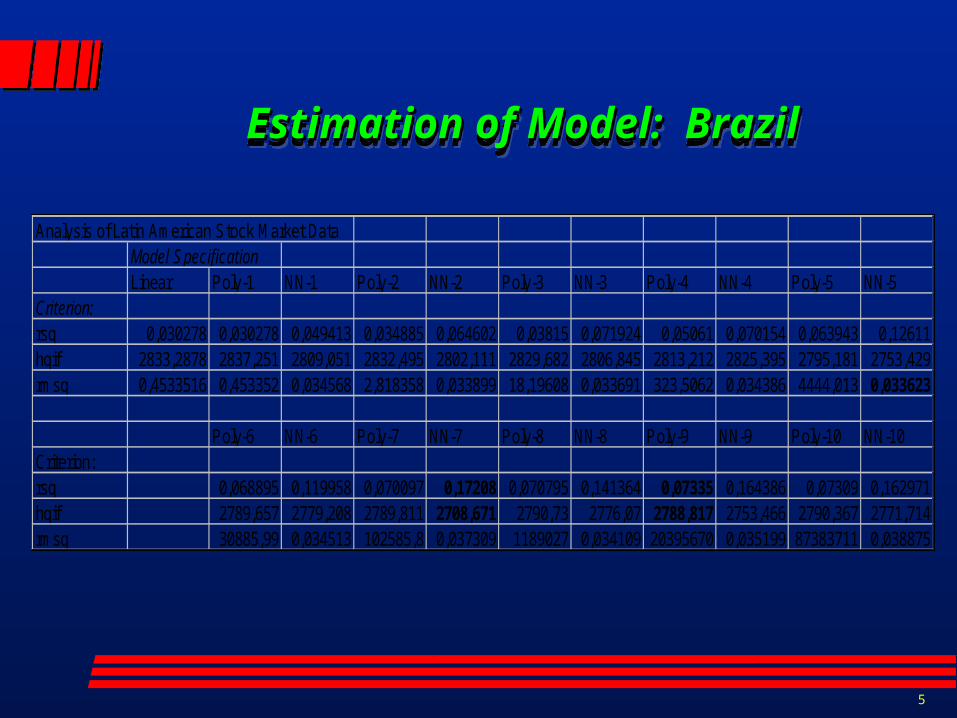
Estimation of Model: BrazilEstimation of Model: BrazilEstimation of Model: BrazilEstimation of Model: Brazil
Analysis of Latin American Stock Market DataModel SpecificationLinear Poly-1 NN-1 Poly-2 NN-2 Poly-3 NN-3 Poly-4 NN-4 Poly-5 NN-5
Criterion:rsq 0,030278 0,030278 0,049413 0,034885 0,064602 0,03815 0,071924 0,05061 0,070154 0,063943 0,12611hqif 2833,2878 2837,251 2809,051 2832,495 2802,111 2829,682 2806,845 2813,212 2825,395 2795,181 2753,429rmsq 0,4533516 0,453352 0,034568 2,818358 0,033899 18,19608 0,033691 323,5062 0,034386 4444,013 0,033623
Poly-6 NN-6 Poly-7 NN-7 Poly-8 NN-8 Poly-9 NN-9 Poly-10 NN-10Criterion:rsq 0,068895 0,119958 0,070097 0,17208 0,070795 0,141364 0,07335 0,164386 0,07309 0,162971hqif 2789,657 2779,208 2789,811 2708,671 2790,73 2776,07 2788,817 2753,466 2790,367 2771,714rmsq 30885,99 0,034513 102585,8 0,037309 1189027 0,034109 20395670 0,035199 87383711 0,038875

6
Eq. 1 : Pre-filtering of DataEq. 1 : Pre-filtering of DataEq. 1 : Pre-filtering of DataEq. 1 : Pre-filtering of Data
)min()max(
)min(jj
jjtj
t xx
xxz

7
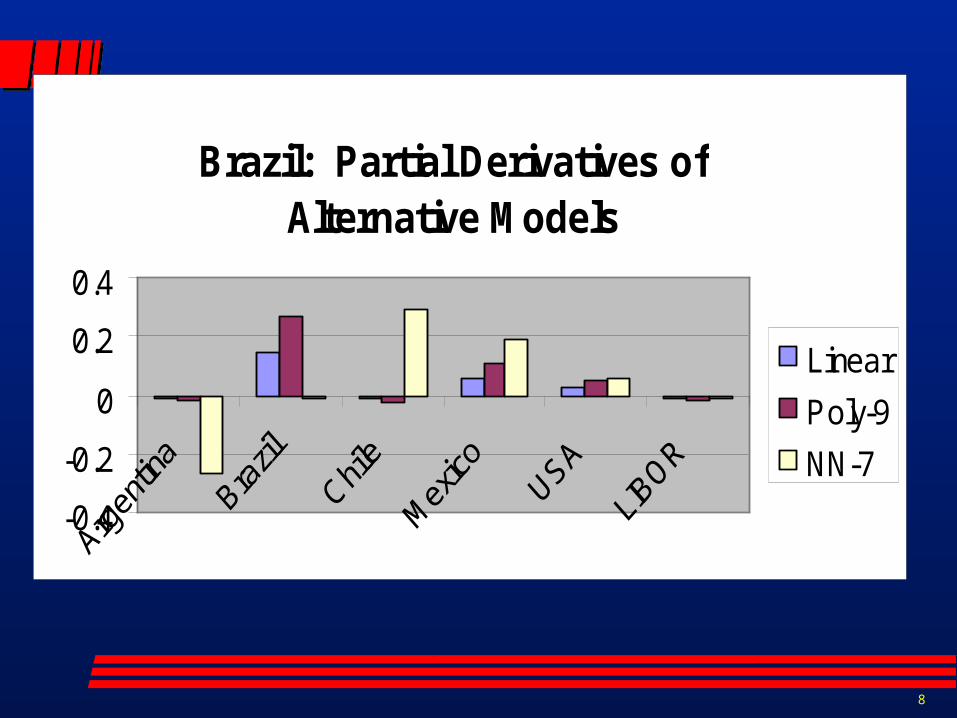
Partial Derivatives for BrazilPartial Derivatives for BrazilPartial Derivatives for BrazilPartial Derivatives for BrazilArgentina Brazil Chile Mexico USA LIBOR
Model:Linear -0,0102074 0,144331 -0,01393 0,058201 0,026291 -0,00976(T-Stat) -0,479694 5,50654 -0,43508 1,924551 1,367279 -1,57274Polynomial SpecificationsPoly-1 -0,0102074 0,144331 -0,01393 0,058201 0,026291 -0,00976Poly-2 -0,0096818 0,136898 -0,01321 0,055203 0,024937 -0,00926Poly-3 -0,0075212 0,106348 -0,01026 0,042884 0,019372 -0,00719Poly-4 -0,0088505 0,125145 -0,01208 0,050464 0,022796 -0,00847Poly-5 -0,0155906 0,220448 -0,02127 0,088894 0,040157 -0,01491Poly-6 -0,0142444 0,201413 -0,01944 0,081219 0,036689 -0,01362Poly-7 -0,0163794 0,231601 -0,02235 0,093392 0,042188 -0,01567Poly-8 -0,0155586 0,219995 -0,02123 0,088712 0,040074 -0,01488Poly-9 -0,0186907 0,264283 -0,0255 0,106571 0,048142 -0,01788Poly-10 -0,017961 0,253964 -0,02451 0,10241 0,046262 -0,01718Summary Statistics on Polynomial SpecificationsMean -0,0134686 0,190442 -0,01838 0,076795 0,034691 -0,01288Std Dev. 0,0040424 0,057159 0,005516 0,023049 0,010412 0,003866Max -0,0075212 0,264283 -0,01026 0,106571 0,048142 -0,00719Min -0,0186907 0,106348 -0,0255 0,042884 0,019372 -0,01788
Neural Network SpecificationsNN-1 0,0196132 0,029201 -0,01795 -0,006 0,016189 -0,00049NN-2 -0,0281003 0,074453 0,010285 0,078748 0,011395 -0,00336NN-3 0,0667939 0,110024 0,000249 0,046215 0,058526 0,000699
NN-4 -0,0632609 0,536676 -0,28184 0,483266 0,15534 -0,08304NN-5 -0,0191964 0,116759 -0,01836 0,121203 0,026149 -0,01318NN-6 0,0055764 0,328876 0,015166 0,128195 0,088273 -0,0128NN-7 -0,2657341 -0,01341 0,287715 0,189479 0,05493 -0,00782NN-8 -0,1153557 0,113938 0,111595 0,126811 0,06044 -0,02306NN-9 -0,0336189 0,114776 0,090983 0,071473 -0,12019 -0,00298NN-10 -0,2580538 0,718556 -0,20303 0,09836 0,284815 -0,09151Summary Statistics on Neural Network SpecificationsMean -0,0691337 0,212985 -0,00052 0,133775 0,063587 -0,02375Std Dev. 0,1124901 0,239756 0,158169 0,133688 0,10447 0,034284Max 0,0667939 0,718556 0,287715 0,483266 0,284815 0,000699Min -0,2657341 -0,01341 -0,28184 -0,006 -0,12019 -0,09151
8
Brazil: Partial Derivatives ofAlternative Models
-0.4
-0.2
0
0.2
0.4
Linear
Poly-9
NN-7

9
Estimated Weights and T-StatisticsEstimated Weights and T-StatisticsBrazilBrazil
Estimated Weights and T-StatisticsEstimated Weights and T-StatisticsBrazilBrazil
Analysis of Neural Network Model with 7 NeuronsInput links to neuronsArgentina Brazil Chile Mexico USA LIBOR
-139,3167 -102,69611 26,37142 -36,1128 -72,715 0,06275-0,08568747 0,2276812 -0,23613 0,080728 -0,17666 -0,07012-8,64346128 -163,34476 -65,3709 -52,1957 -9,60275 27,2530931,92096453 -118,47723 -108,667 60,92568 118,5059 -14,9959-20,6958315 -70,99267 -86,2973 -7,78543 -29,2504 22,78494-215,984028 -152,00798 301,3084 84,38792 38,0817 -32,2175120,9214181 165,38697 9,789699 86,32571 188,1902 145,1561
Neuron links to output1 2 3 4 5 6 7
-0,0250236 4,5640078 7,853648 16,06283 -8,29142 0,025893 0,033409
T-Statistics:Input links to neurons:Argentina Brazil Chile Mexico USA LIBOR
-11,4658418 -13,944564 3,402688 -5,63894 -8,27394 0,051598-15,7380033 3,8232263 -10,9386 0,55321 -0,82298 -1,35131-7,12895984 -149,30852 -40,6504 -997,545 -16,7603 45,7870419,76167223 -311,59472 -28,2626 148,4441 2210,206 -18,0502-17,3744045 -2168,8365 -45,9334 -4,06989 -116,773 118,4172-20,6859087 -17,768905 47,35806 9,423647 4,668982 -4,6185923,19147824 13,468656 0,927494 4,424036 14,53711 25,97282
Neuron links to output1 2 3 4 5 6 7
-0,69470629 11,809833 61,18872 10,50077 -25,8791 0,719969 6,723198

10
Chile ModelChile ModelChile ModelChile Model
Chiley ts
USAMexico, Chile, Brazil, Argentina,],,,[ *11 kconstisx t
kt
11
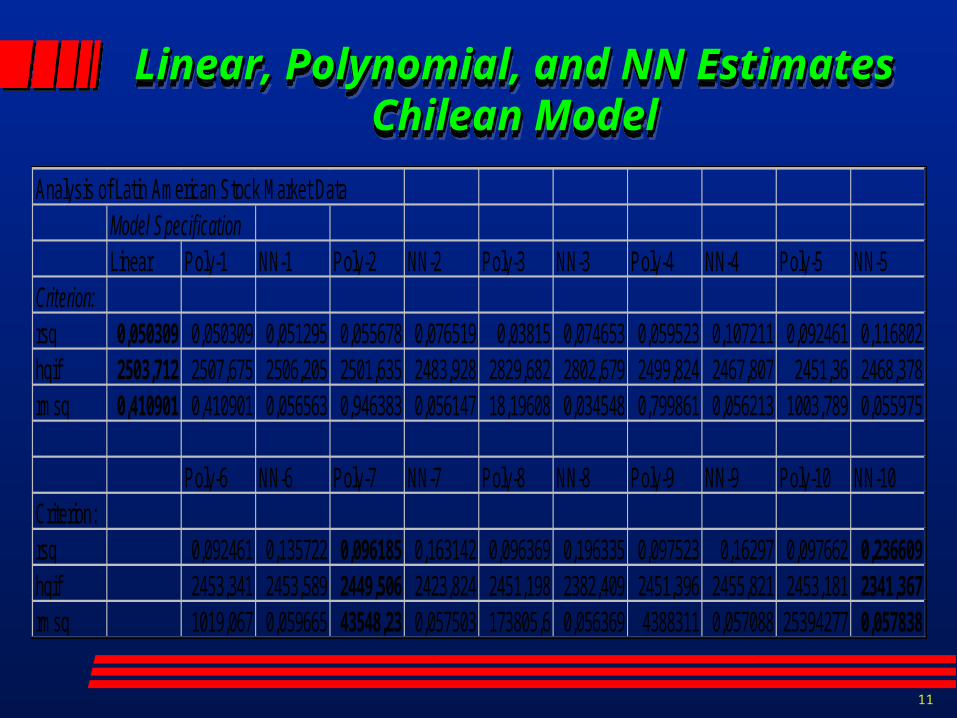
Linear, Polynomial, and NN EstimatesLinear, Polynomial, and NN EstimatesChilean ModelChilean Model
Linear, Polynomial, and NN EstimatesLinear, Polynomial, and NN EstimatesChilean ModelChilean Model
Analysis of Latin American Stock Market DataModel SpecificationLinear Poly-1 NN-1 Poly-2 NN-2 Poly-3 NN-3 Poly-4 NN-4 Poly-5 NN-5
Criterion:rsq 0,050309 0,050309 0,051295 0,055678 0,076519 0,03815 0,074653 0,059523 0,107211 0,092461 0,116802hqif 2503,712 2507,675 2506,205 2501,635 2483,928 2829,682 2802,679 2499,824 2467,807 2451,36 2468,378rmsq 0,410901 0,410901 0,056563 0,946383 0,056147 18,19608 0,034548 0,799861 0,056213 1003,789 0,055975
Poly-6 NN-6 Poly-7 NN-7 Poly-8 NN-8 Poly-9 NN-9 Poly-10 NN-10Criterion:rsq 0,092461 0,135722 0,096185 0,163142 0,096369 0,196335 0,097523 0,16297 0,097662 0,236609hqif 2453,341 2453,589 2449,506 2423,824 2451,198 2382,409 2451,396 2455,821 2453,181 2341,367rmsq 1019,067 0,059665 43548,23 0,057503 173805,6 0,056369 4388311 0,057088 25394277 0,057838

12
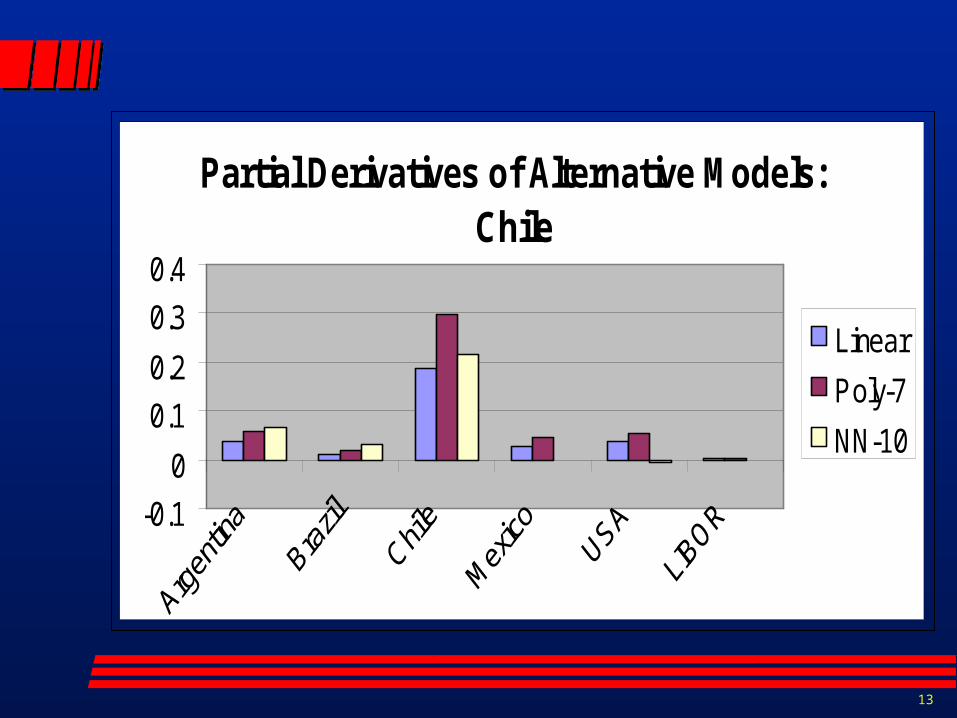
Partial Derivatives for ChilePartial Derivatives for ChilePartial Derivatives for ChilePartial Derivatives for ChilePartial Derivatives
Argentina Brazil Chile Mexico USA LIBORModel:Linear 0,035621 0,011871 0,18539 0,027442 0,034823 0,002824(T-Stat) 1,510645 0,50794 7,293638 0,673486 1,53221 0,332198Polynomial SpecificationsPoly-1 0,035621 0,011871 0,18539 0,027442 0,034823 0,002824Poly-2 0,034584 0,011526 0,179997 0,026644 0,03381 0,002742Poly-3 -0,00752 0,106348 -0,01026 0,042884 0,019372 -0,00719Poly-4 0,040203 0,013398 0,20924 0,030973 0,039303 0,003187Poly-5 0,068269 0,022752 0,355314 0,052595 0,066741 0,005412Poly-6 0,068283 0,022756 0,355387 0,052606 0,066755 0,005413Poly-7 0,056993 0,018994 0,296626 0,043908 0,055717 0,004518Poly-8 0,055055 0,018348 0,286538 0,042415 0,053822 0,004364Poly-9 0,048099 0,01603 0,250335 0,037056 0,047022 0,003813Poly-10 0,045782 0,015257 0,238277 0,035271 0,044757 0,003629Summary Statistics on Polynomial SpecificationsMean 0,044537 0,025728 0,234684 0,039179 0,046212 0,002871Std Dev. 0,021895 0,02861 0,106443 0,009362 0,015078 0,003663Max 0,068283 0,106348 0,355387 0,052606 0,066755 0,005413Min -0,00752 0,011526 -0,01026 0,026644 0,019372 -0,00719
Neur+A22al Network SpecificationsNN-1 0,036352 0,012961 0,187824 0,029044 0,03472 0,0026NN-2 0,036561 0,044056 0,330907 0,008982 0,046482 0,005828NN-3 -0,02778 0,074963 0,010919 0,118799 0,007302 -0,00201NN-4 -0,00436 0,078354 0,277556 0,059984 0,042645 0,006758NN-5 0,055488 0,027372 0,247756 0,147327 0,003098 -0,00669NN-6 -0,02507 -0,04451 0,229592 0,131773 -0,01667 0,066076NN-7 0,036835 -0,04713 0,243576 -0,08965 0,090727 -0,00378NN-8 0,05643 0,03451 0,190352 0,022404 0,006222 -0,0065NN-9 0,042431 0,05919 0,475232 -0,05869 0,096415 0,010601NN-10 0,064573 0,031404 0,218143 -0,00037 -0,00531 -0,00169Summary Statistics on Neural Network SpecificationsMean 0,027147 0,027118 0,241186 0,036961 0,030563 0,007119Std Dev. 0,033826 0,043647 0,117056 0,078901 0,039128 0,021515Max 0,064573 0,078354 0,475232 0,147327 0,096415 0,066076Min -0,02778 -0,04713 0,010919 -0,08965 -0,01667 -0,00669
13
Partial Derivatives of Alternative Models: Chile
-0.1
0
0.1
0.2
0.3
0.4
Linear
Poly-7
NN-10

14
Weights and T-Statistics for NN Model:Weights and T-Statistics for NN Model:ChileChile
Weights and T-Statistics for NN Model:Weights and T-Statistics for NN Model:ChileChile
Analysis of Neural Network Model with 10 NeuronsInput links to neuronsArgentina Brazil Chile Mexico USA LIBOR4,390876 1,160476 -7,26427 -2,18529 -4,14954 -1,01732-21,8337 58,17705 3,370917 -59,0528 -69,4121 -11,677626,22099 -60,8773 -38,9234 -40,1501 14,82589 -10,36271,802467 34,49849 -9,82297 12,7297 -18,8456 -2,7874-1,50414 6,338336 3,702966 1,657758 0,031535 -0,01292-4,42206 0,536188 7,51274 2,400154 3,700753 0,9193922,479839 -8,12841 -6,09381 -2,39637 -0,74479 -0,12349-13,6997 36,69659 -37,2897 -130,582 -54,3181 0,8772350,675274 -21,2288 40,4209 5,906465 18,16056 3,868869
-14,92 40,77395 -38,5114 -134,798 -57,0544 0,881617
Neuron links to output1 2 3 4 5
2,897881 -0,02614 0,248371 21,69474 -3,291286 7 8 9 10
2,925146 -2,12913 -4,45485 0,060825 4,407098
T-Statistics:Input links to neurons:Argentina Brazil Chile Mexico USA LIBOR2,541097 0,3255 -4,7465 -3,80587 -2,54743 -0,7627-3,48562 7,291116 0,386887 -8,25341 -6,77674 -0,935510,676381 -3,80213 -3,15003 -1,53316 0,480465 -0,589750,134703 5,48179 -0,8648 0,952148 -1,79481 -1,14346-0,33325 1,88873 0,88235 0,453313 0,009655 -0,00772-2,55973 0,160359 3,46418 1,539668 4,218498 0,5819260,367691 -1,88711 -0,90209 -0,50104 -0,15217 -0,05107-5,88036 7,039314 -6,8372 -9,05146 -5,58048 0,1968550,036154 -2,81909 2,160178 0,261627 1,152731 1,077262-3,57936 5,870709 -22,2528 -12,9948 -5,51727 0,194429
Neuron links to output1 2 3 4 5
4,194266 -0,11049 0,753449 5,466166 -4,649016 7 8 9 10
7,316547 -3,56913 -4,21705 0,434728 4,019506

15
Mexico ModelMexico ModelMexico ModelMexico Model
Mexicoy ts
USAMexico, Chile, Brazil, Argentina,],,,[ *11 kconstisx t
kt

16
Linear, Polynomial, and NN Esitamtes:Linear, Polynomial, and NN Esitamtes:MexicoMexico
Linear, Polynomial, and NN Esitamtes:Linear, Polynomial, and NN Esitamtes:MexicoMexico
Analysis of Latin American Stock Market DataModel SpecificationLinear Poly-1 NN-1 Poly-2 NN-2 Poly-3 NN-3 Poly-4 NN-4 Poly-5 NN-5
Criterion:rsq 0,019052 0,019052 0,019274 0,021592 0,115825 0,039473 0,128055 0,039473 0,160748 0,044308 0,14988hqif 2279,586 2283,549 2283,229 2281,862 2152,435 2257,745 2148,58 2259,727 2110,357 2254,567 2144,421rmsq 0,404268 0,404268 0,068036 2,431121 0,083128 106,7242 0,083432 109,4999 0,066574 14558,37 0,073818
Poly-6 NN-6 Poly-7 NN-7 Poly-8 NN-8 Poly-9 NN-9 Poly-10 NN-10Criterion:rsq 0,049921 0,17556 0,052647 0,195708 0,052657 0,247799 0,052665 0,309815 0,051987 0,248546hqif 2248,214 2116,868 2246,13 2097,711 2248,097 2018,819 2250,065 1912,921 2252,471 2049,119rmsq 278966,8 0,064497 3738046 0,067967 7764750 0,068775 47073812 0,080961 9,82E+08 0,069215
17
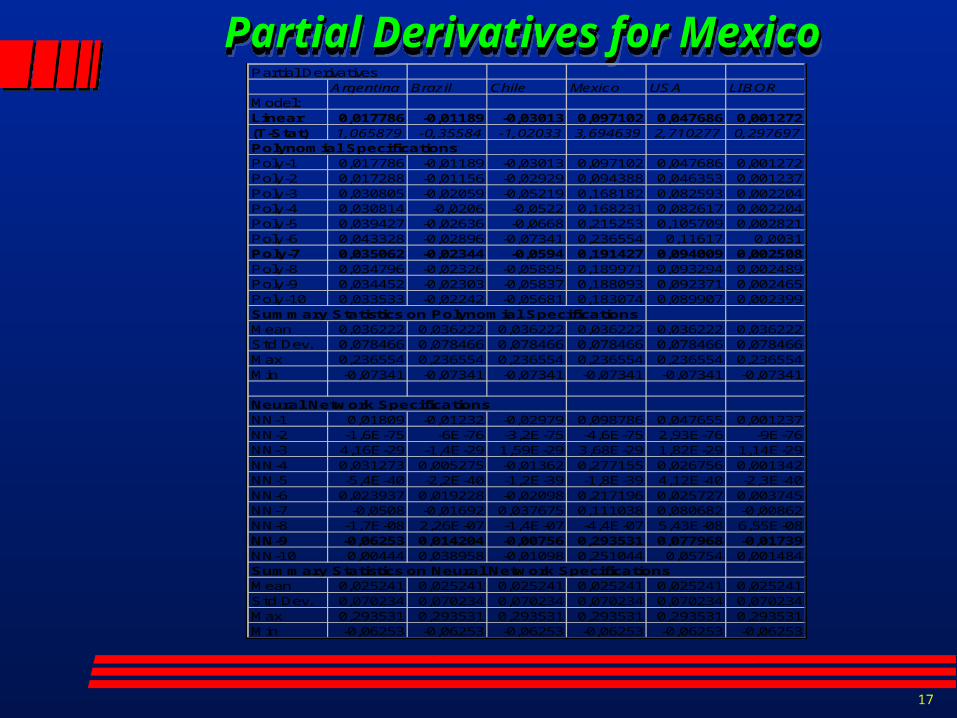
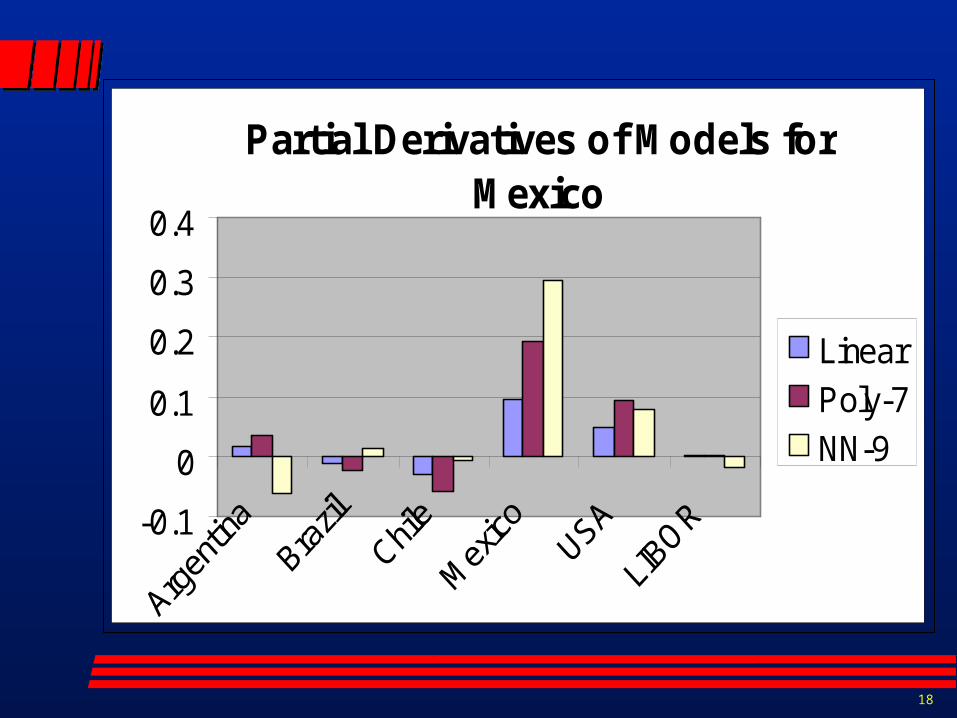
Partial Derivatives for MexicoPartial Derivatives for MexicoPartial Derivatives for MexicoPartial Derivatives for MexicoPartial Derivatives
Argentina Brazil Chile Mexico USA LIBORModel:Linear 0,017786 -0,01189 -0,03013 0,097102 0,047686 0,001272(T-Stat) 1,065879 -0,35584 -1,02033 3,694639 2,710277 0,297697Polynomial SpecificationsPoly-1 0,017786 -0,01189 -0,03013 0,097102 0,047686 0,001272Poly-2 0,017288 -0,01156 -0,02929 0,094388 0,046353 0,001237Poly-3 0,030805 -0,02059 -0,05219 0,168182 0,082593 0,002204Poly-4 0,030814 -0,0206 -0,0522 0,168231 0,082617 0,002204Poly-5 0,039427 -0,02636 -0,0668 0,215253 0,105709 0,002821Poly-6 0,043328 -0,02896 -0,07341 0,236554 0,11617 0,0031Poly-7 0,035062 -0,02344 -0,0594 0,191427 0,094009 0,002508Poly-8 0,034796 -0,02326 -0,05895 0,189971 0,093294 0,002489Poly-9 0,034452 -0,02303 -0,05837 0,188093 0,092371 0,002465Poly-10 0,033533 -0,02242 -0,05681 0,183074 0,089907 0,002399Summary Statistics on Polynomial SpecificationsMean 0,036222 0,036222 0,036222 0,036222 0,036222 0,036222Std Dev. 0,078466 0,078466 0,078466 0,078466 0,078466 0,078466Max 0,236554 0,236554 0,236554 0,236554 0,236554 0,236554Min -0,07341 -0,07341 -0,07341 -0,07341 -0,07341 -0,07341
Neural Network SpecificationsNN-1 0,01809 -0,01232 -0,02979 0,098786 0,047655 0,001237NN-2 -1,6E-75 -6E-76 -3,2E-75 -4,6E-75 2,93E-76 -9E-76NN-3 4,16E-29 -1,4E-29 1,59E-29 3,68E-29 1,82E-29 1,14E-29NN-4 0,031273 0,005275 -0,01362 0,277155 0,026756 0,001342NN-5 -5,4E-40 -2,2E-40 -1,2E-39 -1,8E-39 4,12E-40 -2,3E-40NN-6 0,023937 0,019228 -0,02098 0,217196 0,025727 0,003745NN-7 -0,0508 -0,01692 0,037675 0,111038 0,080682 -0,00862NN-8 -1,7E-08 2,26E-07 -1,4E-07 -4,4E-07 5,43E-08 6,55E-08NN-9 -0,06253 0,014204 -0,00756 0,293531 0,077968 -0,01739NN-10 0,00444 0,038958 -0,01098 0,251044 0,05754 0,001484Summary Statistics on Neural Network SpecificationsMean 0,025241 0,025241 0,025241 0,025241 0,025241 0,025241Std Dev. 0,070234 0,070234 0,070234 0,070234 0,070234 0,070234Max 0,293531 0,293531 0,293531 0,293531 0,293531 0,293531Min -0,06253 -0,06253 -0,06253 -0,06253 -0,06253 -0,06253
18
Partial Derivatives of Models for Mexico
-0.1
0
0.1
0.2
0.3
0.4
Linear
Poly-7
NN-9
19
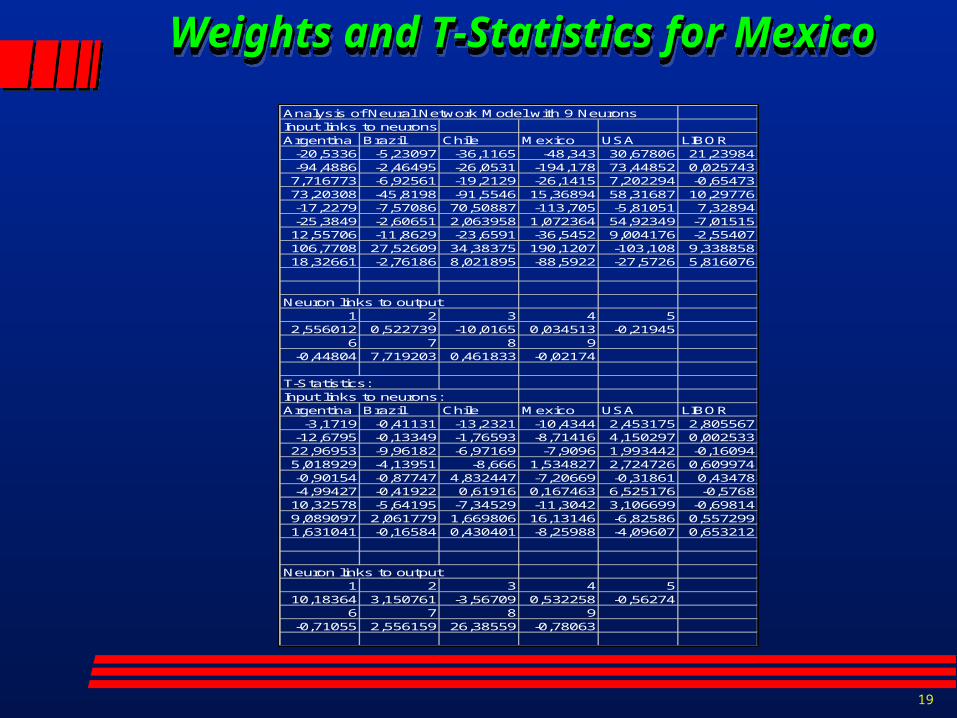
Weights and T-Statistics for MexicoWeights and T-Statistics for MexicoWeights and T-Statistics for MexicoWeights and T-Statistics for Mexico
Analysis of Neural Network Model with 9 NeuronsInput links to neuronsArgentina Brazil Chile Mexico USA LIBOR
-20,5336 -5,23097 -36,1165 -48,343 30,67806 21,23984-94,4886 -2,46495 -26,0531 -194,178 73,44852 0,0257437,716773 -6,92561 -19,2129 -26,1415 7,202294 -0,6547373,20308 -45,8198 -91,5546 15,36894 58,31687 10,29776-17,2279 -7,57086 70,50887 -113,705 -5,81051 7,32894-25,3849 -2,60651 2,063958 1,072364 54,92349 -7,0151512,55706 -11,8629 -23,6591 -36,5452 9,004176 -2,55407106,7708 27,52609 34,38375 190,1207 -103,108 9,33885818,32661 -2,76186 8,021895 -88,5922 -27,5726 5,816076
Neuron links to output1 2 3 4 5
2,556012 0,522739 -10,0165 0,034513 -0,219456 7 8 9
-0,44804 7,719203 0,461833 -0,02174
T-Statistics:Input links to neurons:Argentina Brazil Chile Mexico USA LIBOR
-3,1719 -0,41131 -13,2321 -10,4344 2,453175 2,805567-12,6795 -0,13349 -1,76593 -8,71416 4,150297 0,00253322,96953 -9,96182 -6,97169 -7,9096 1,993442 -0,160945,018929 -4,13951 -8,666 1,534827 2,724726 0,609974-0,90154 -0,87747 4,832447 -7,20669 -0,31861 0,43478-4,99427 -0,41922 0,61916 0,167463 6,525176 -0,576810,32578 -5,64195 -7,34529 -11,3042 3,106699 -0,698149,089097 2,061779 1,669806 16,13146 -6,82586 0,5572991,631041 -0,16584 0,430401 -8,25988 -4,09607 0,653212
Neuron links to output1 2 3 4 5
10,18364 3,150761 -3,56709 0,532258 -0,562746 7 8 9
-0,71055 2,556159 26,38559 -0,78063

20
Chapter 5Chapter 5
21
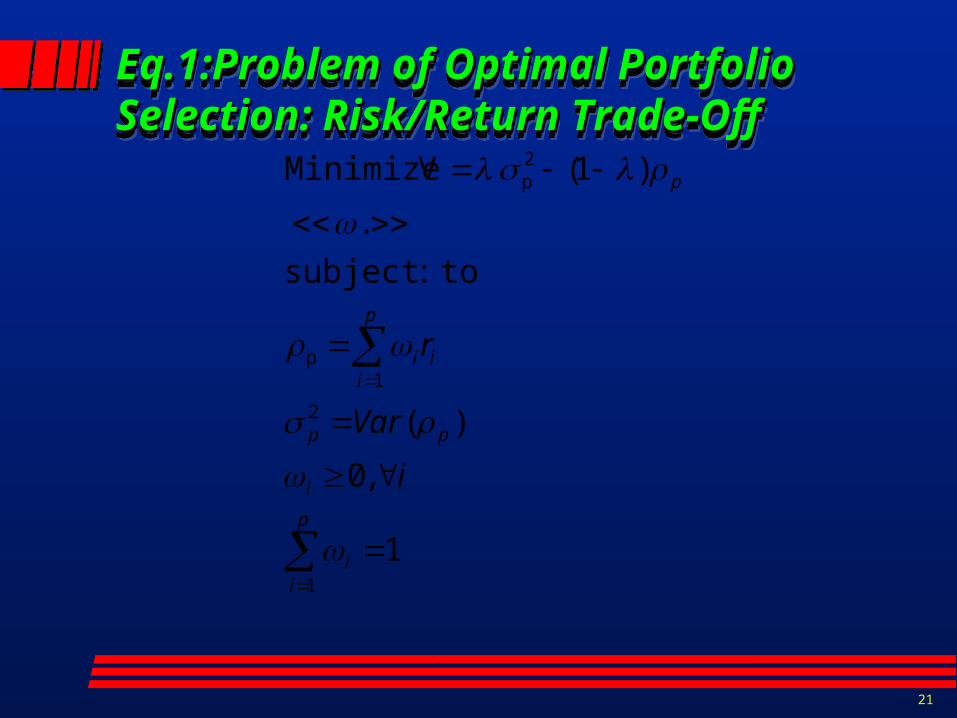
Eq.1:Problem of Optimal Portfolio Eq.1:Problem of Optimal Portfolio Selection: Risk/Return Trade-OffSelection: Risk/Return Trade-OffEq.1:Problem of Optimal Portfolio Eq.1:Problem of Optimal Portfolio Selection: Risk/Return Trade-OffSelection: Risk/Return Trade-Off
1
,0
)(
:subject to
.
)1( V Minimize
1
2
1p
2p
p
ii
i
pp
i
p
ii
p
i
Var
r
22
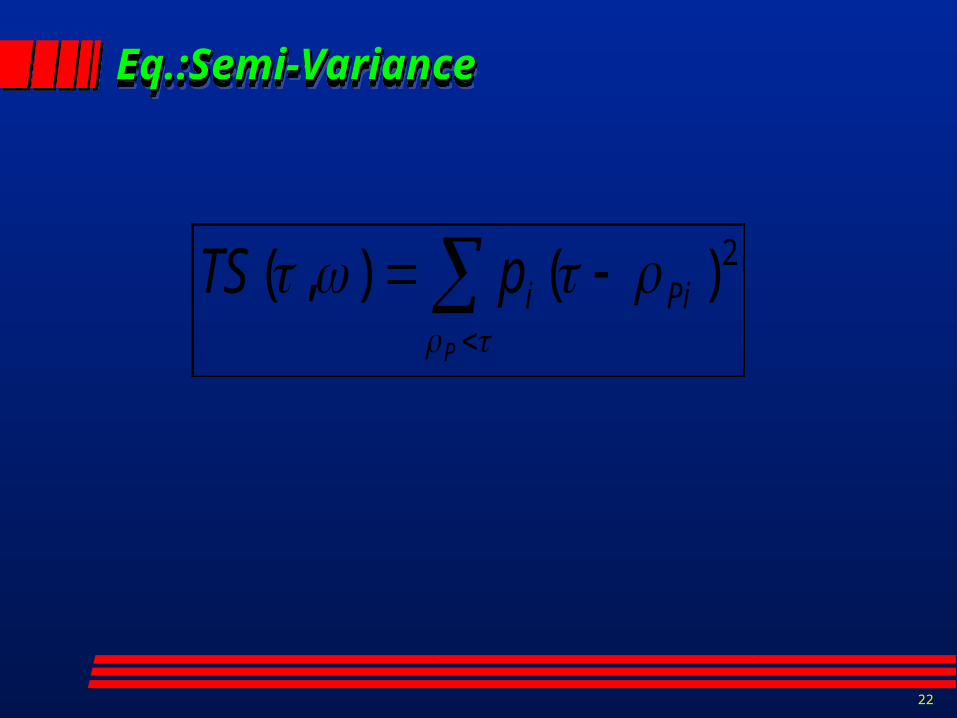
Eq.:Semi-VarianceEq.:Semi-VarianceEq.:Semi-VarianceEq.:Semi-Variance
2)(),( Pii
P
pTS
23
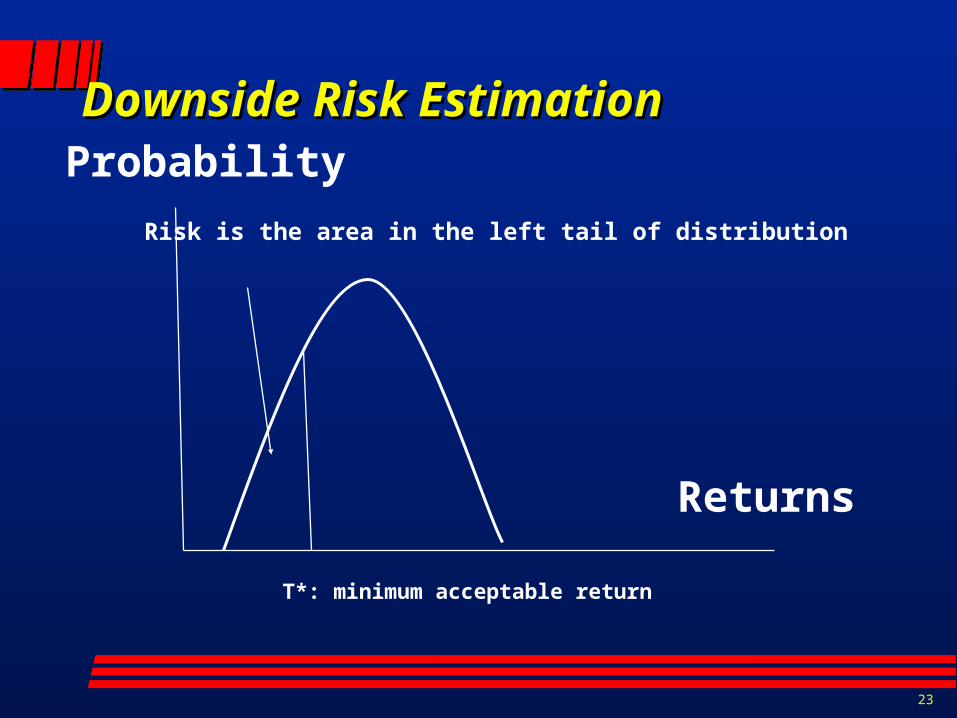
Downside Risk EstimationDownside Risk Estimation
Risk is the area in the left tail of distribution
T*: minimum acceptable return
Returns
Probability

24
Eq:3 :Gaussian Probability DistributionEq:3 :Gaussian Probability DistributionEq:3 :Gaussian Probability DistributionEq:3 :Gaussian Probability Distribution
]ˆ/)ˆ(exp[)ˆ2( 225.2 iNi rp
25
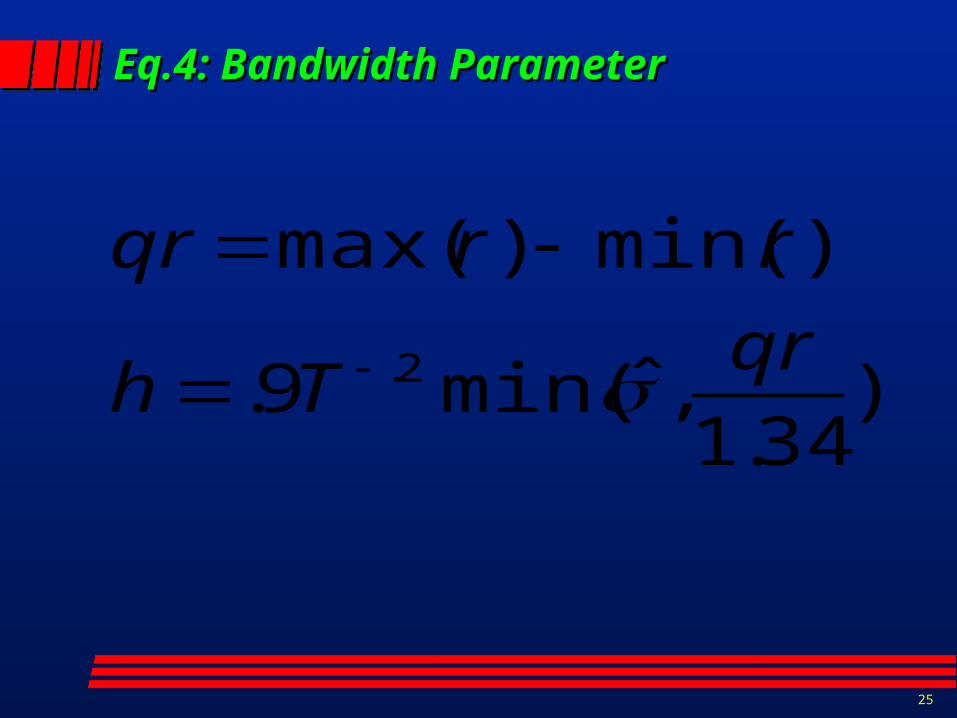
Eq.4: Bandwidth ParameterEq.4: Bandwidth Parameter
)34.1
,ˆmin(9.
)min()max(
2. qrTh
rrqr
26
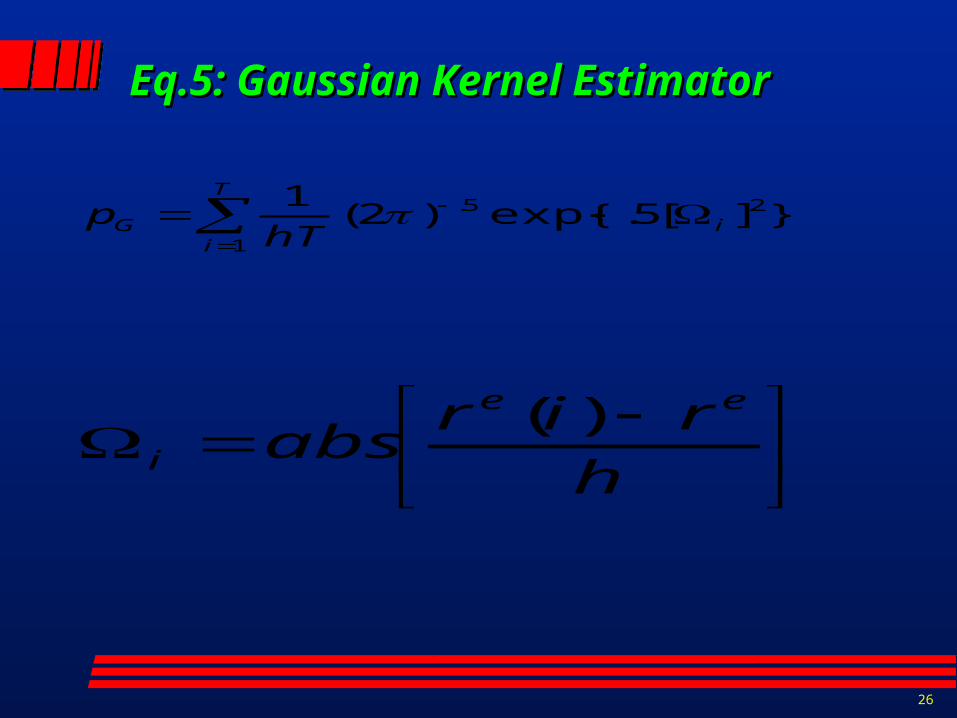
Eq.5: Gaussian Kernel EstimatorEq.5: Gaussian Kernel Estimator
}][5.exp{)2(1 2
1
5.i
T
iG hTp
h
rirabs
ee
i
)(
27
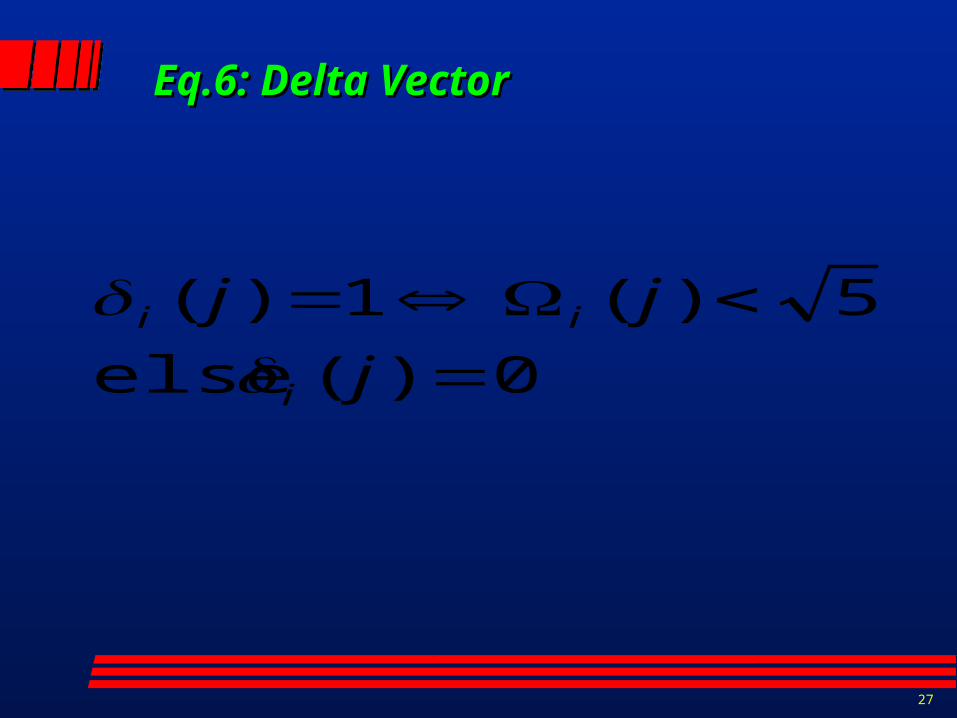
Eq.6: Delta VectorEq.6: Delta Vector
0)( else
5)(1)(
j
jj
i
ii
28
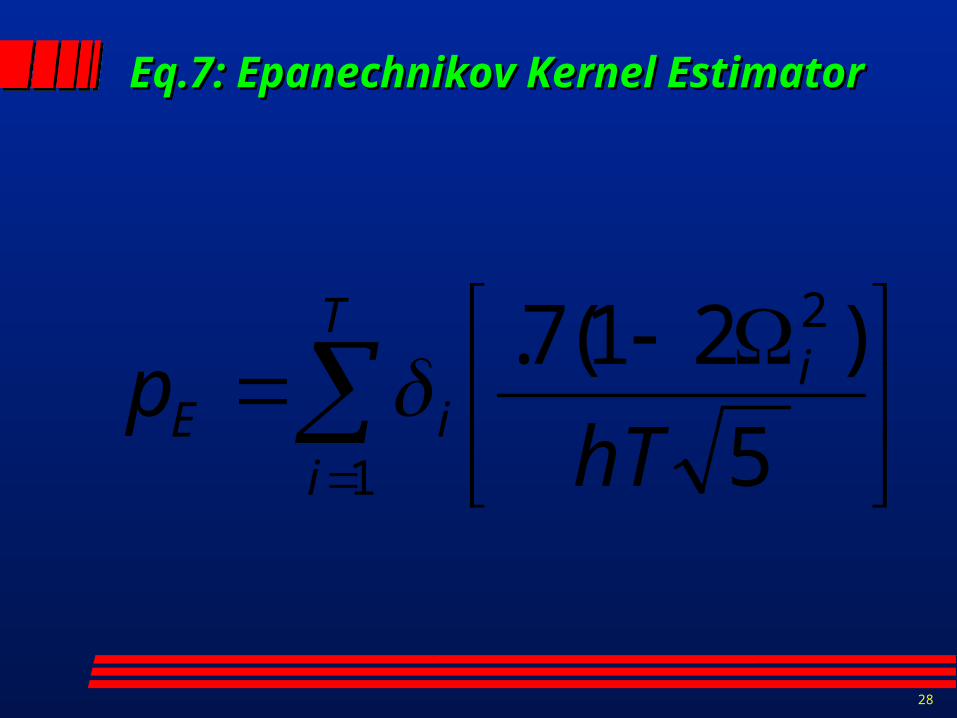
Eq.7: Epanechnikov Kernel EstimatorEq.7: Epanechnikov Kernel Estimator
5
)21(7. 2
1 hTp i
T
iiE
29
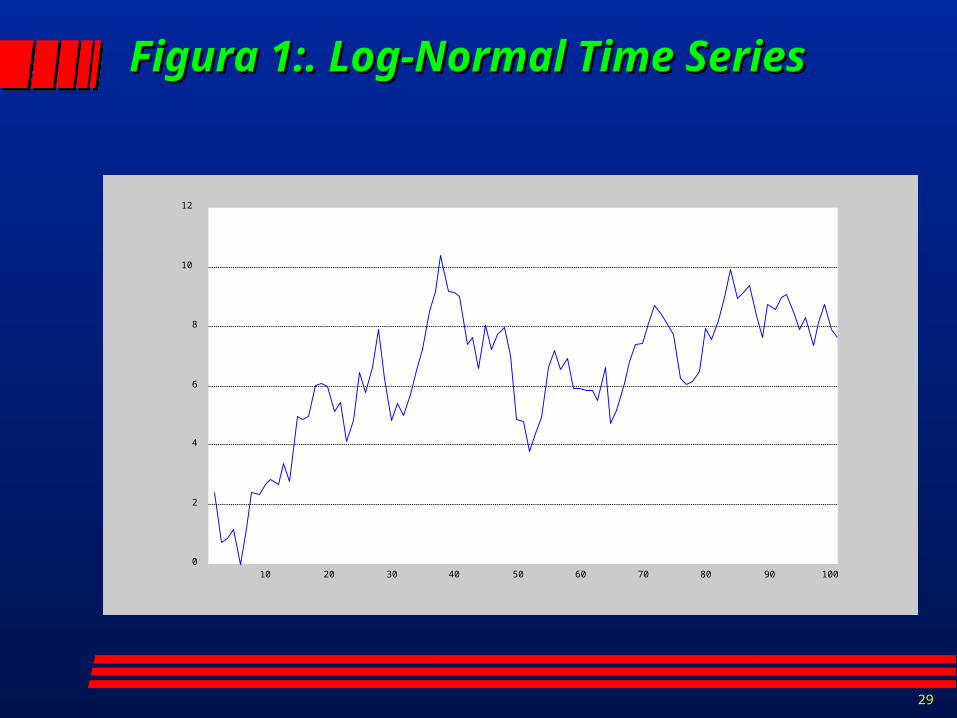
Figura 1:. Log-Normal Time SeriesFigura 1:. Log-Normal Time Series
10 20 30 40 50 60 70 80 90 1000
2
4
6
8
10
12
30
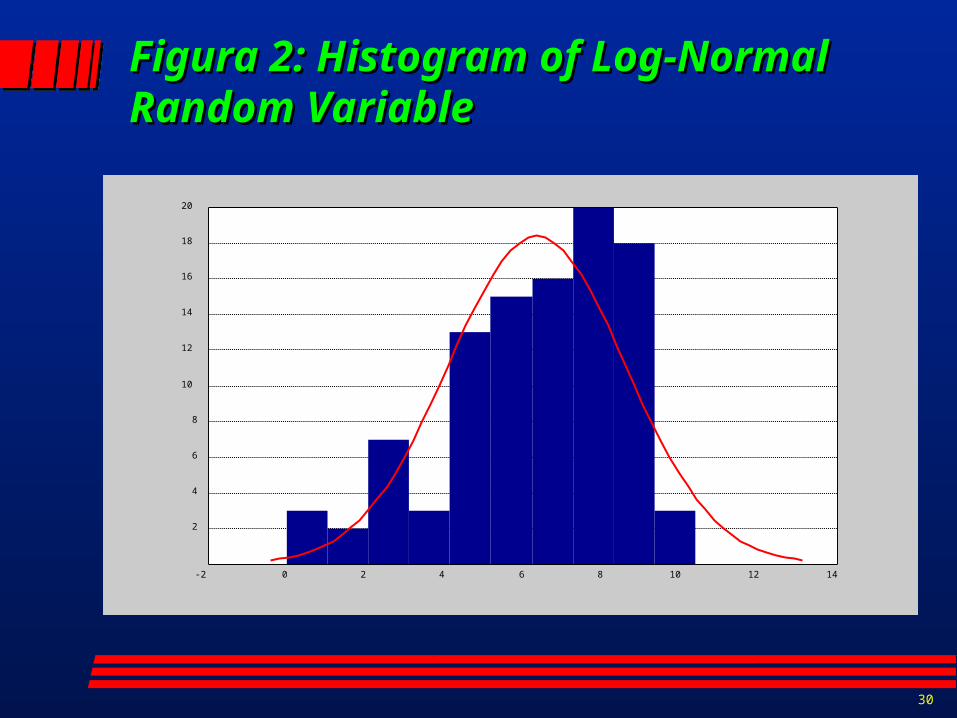
Figura 2: Histogram of Log-NormalFigura 2: Histogram of Log-NormalRandom VariableRandom Variable
-2 0 2 4 6 8 10 12 14
2
4
6
8
10
12
14
16
18
20
31
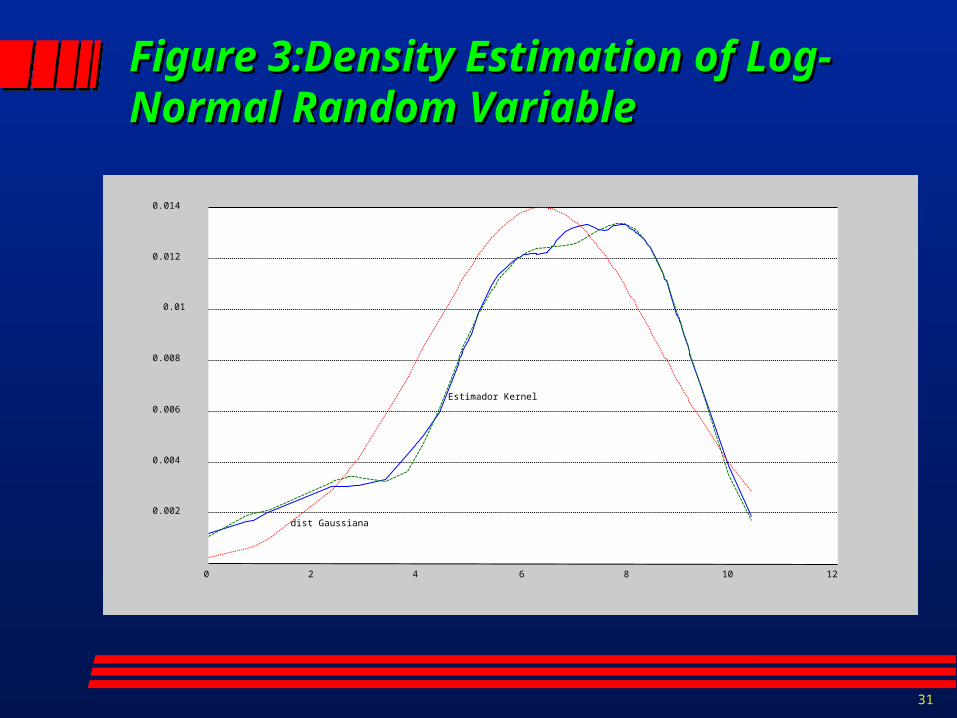
Figure 3:Density Estimation of Log-Figure 3:Density Estimation of Log-Normal Random VariableNormal Random Variable
0 2 4 6 8 10 12
0.002
0.004
0.006
0.008
0.01
0.012
0.014
dist Gaussiana
Estimador Kernel
32
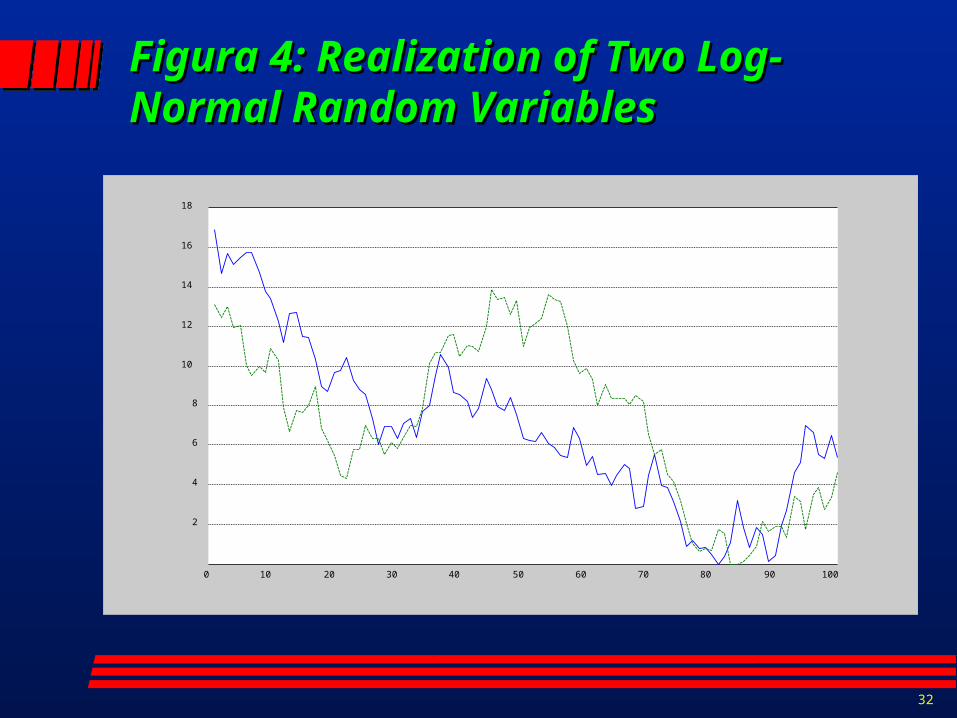
Figura 4: Realization of Two Log-Figura 4: Realization of Two Log-Normal Random Variables Normal Random Variables
0 10 20 30 40 50 60 70 80 90 100
2
4
6
8
10
12
14
16
18
33
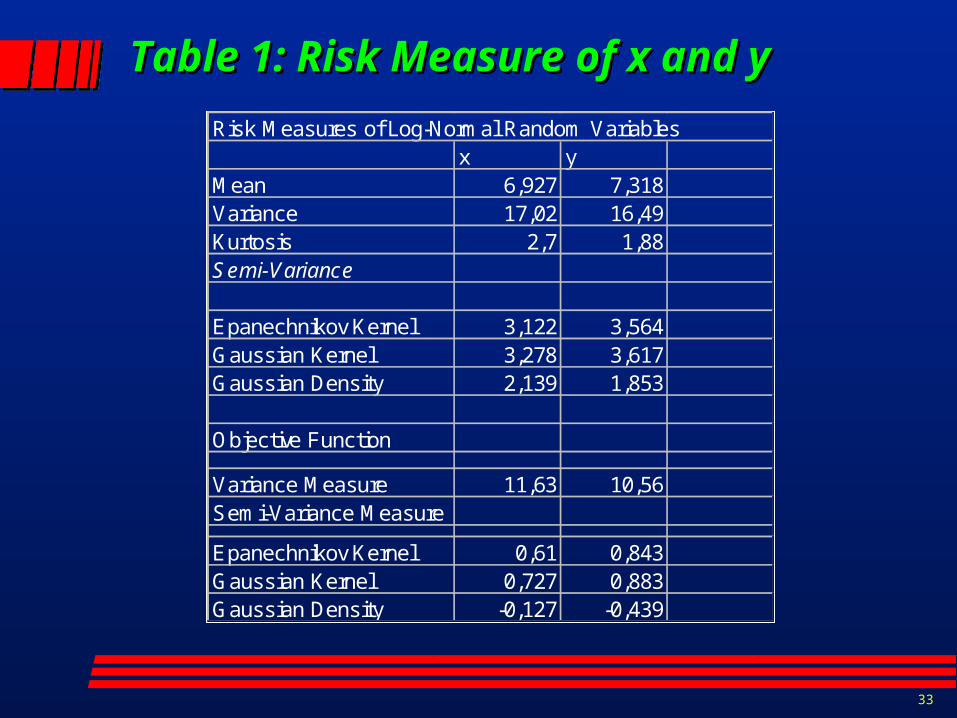
Table 1: Risk Measure of x and y Table 1: Risk Measure of x and y
Risk Measures of Log-Normal Random Variablesx y
Mean 6,927 7,318Variance 17,02 16,49Kurtosis 2,7 1,88Semi-Variance
Epanechnikov Kernel 3,122 3,564Gaussian Kernel 3,278 3,617Gaussian Density 2,139 1,853
Objective Function
Variance Measure 11,63 10,56Semi-Variance Measure
Epanechnikov Kernel 0,61 0,843Gaussian Kernel 0,727 0,883Gaussian Density -0,127 -0,439
34
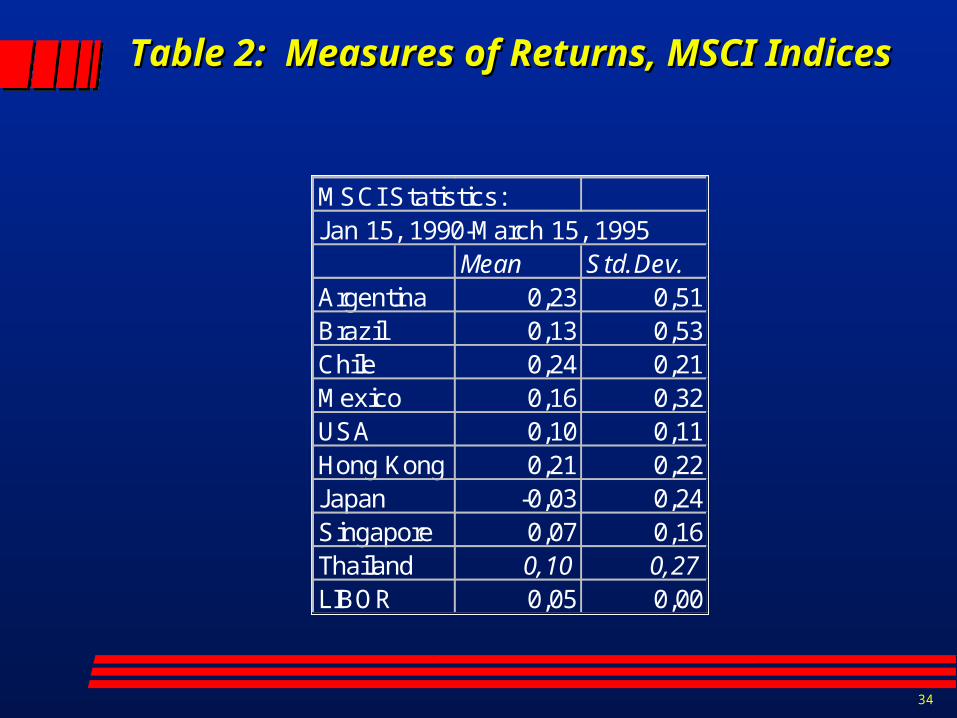
Table 2: Measures of Returns, MSCI Table 2: Measures of Returns, MSCI IndicesIndices
MSCI Statistics:Jan 15, 1990-March 15, 1995
Mean Std.Dev.Argentina 0,23 0,51Brazil 0,13 0,53Chile 0,24 0,21Mexico 0,16 0,32USA 0,10 0,11Hong Kong 0,21 0,22Japan -0,03 0,24Singapore 0,07 0,16Thailand 0,10 0,27LIBOR 0,05 0,00
35
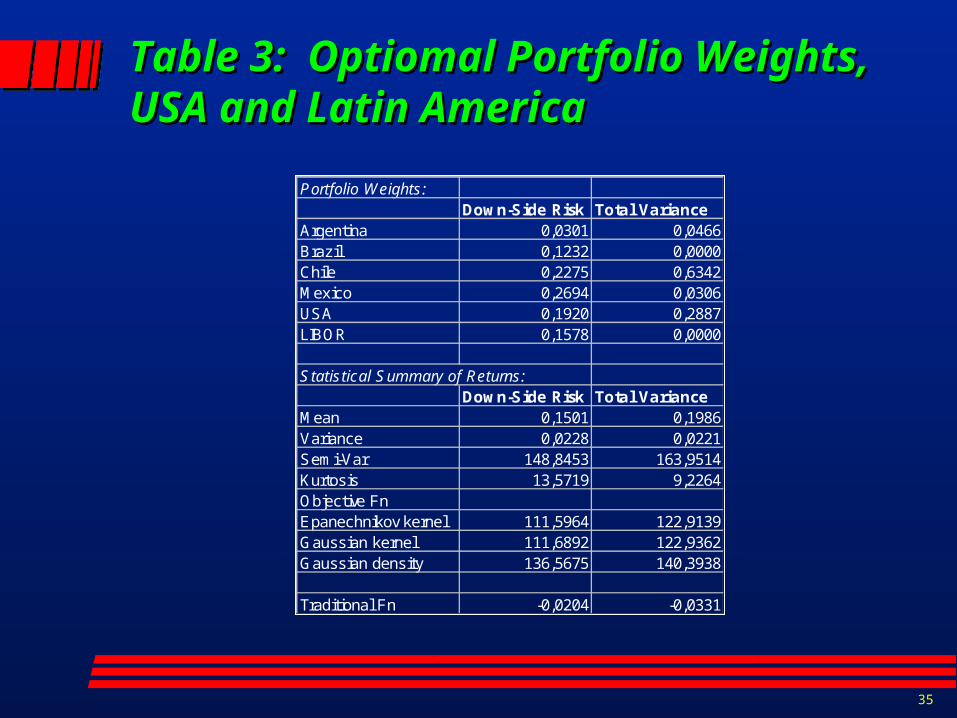
Table 3: Optiomal Portfolio Weights,Table 3: Optiomal Portfolio Weights,USA and Latin AmericaUSA and Latin America
Portfolio Weights:Down-Side Risk Total Variance
Argentina 0,0301 0,0466Brazil 0,1232 0,0000Chile 0,2275 0,6342Mexico 0,2694 0,0306USA 0,1920 0,2887LIBOR 0,1578 0,0000
Statistical Summary of Returns:Down-Side Risk Total Variance
Mean 0,1501 0,1986Variance 0,0228 0,0221Semi-Var 148,8453 163,9514Kurtosis 13,5719 9,2264Objective FnEpanechnikov kernel 111,5964 122,9139Gaussian kernel 111,6892 122,9362Gaussian density 136,5675 140,3938
Traditional Fn -0,0204 -0,0331
36
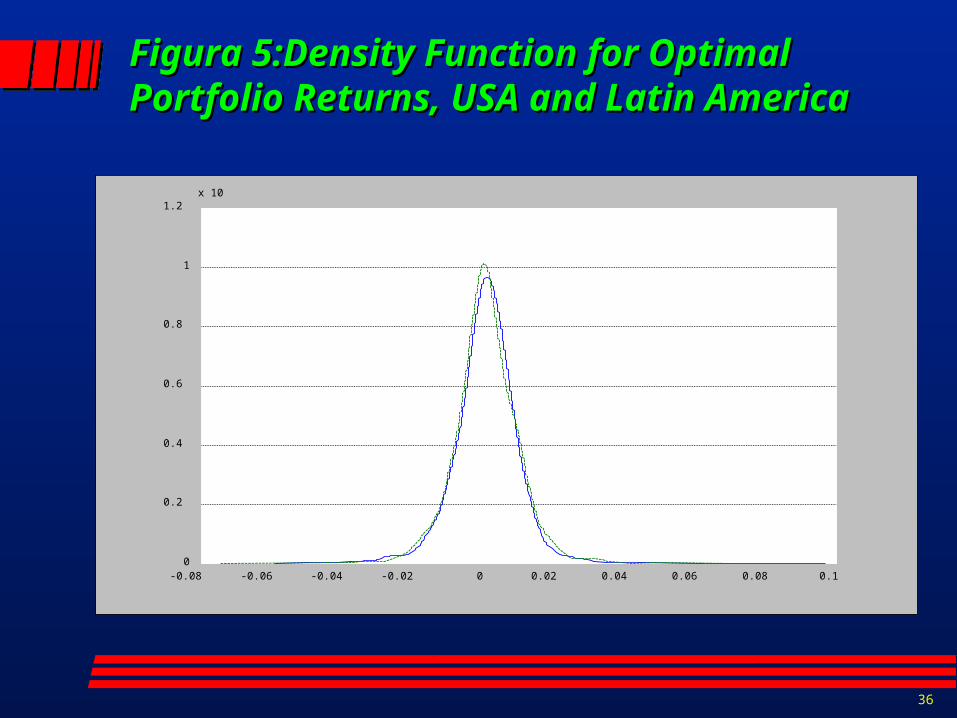
Figura 5:Density Function for Optimal Figura 5:Density Function for Optimal Portfolio Returns, USA and Latin AmericaPortfolio Returns, USA and Latin America
-0.08 -0.06 -0.04 -0.02 0 0.02 0.04 0.06 0.08 0.10
0.2
0.4
0.6
0.8
1
1.2x 10

37
Table 4: Optimal Portfolio Weights, Table 4: Optimal Portfolio Weights, USA and AsiaUSA and Asia
Down-Side Risk Total VariancePortfolio Weights:USA 0.2398 0.5219Hong Kong 0.0630 0.4781Japan 0.2027 0.0000Singapore 0.0501 0.0000Thailand 0.0245 0.0000LIBOR 0.4199 0.0000Statistical Summary of Returns:
Down-Side Risk Total VarianceMean 0.0585 0.1504Variance 0.0048 0.0160Semi-Var 87.4434 148.8226Kurtosis 8.5941 7.1702Objective FnEpanechnikov kernel 65.5679 111.5793Gaussian kernel 65.7250 111.7500Gaussian density 75.5250 123.3250
Traditional Fn -0.0110 -0.0256
38
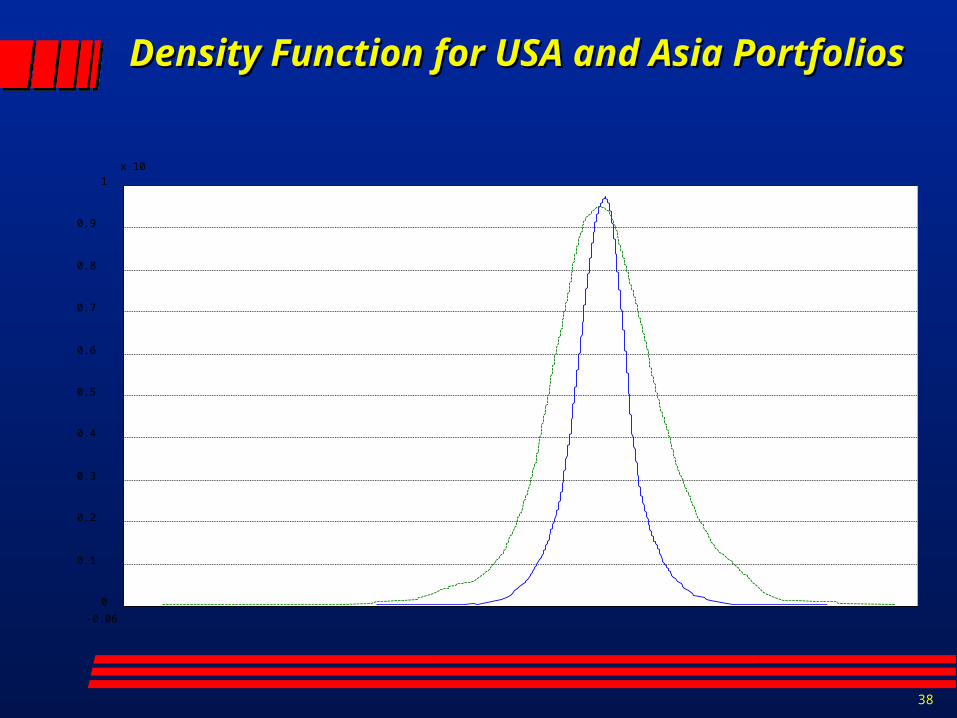
Density Function for USA and Asia Density Function for USA and Asia PortfoliosPortfolios
-0.06
0
0.1
0.2
0.3
0.4
0.5
0.6
0.7
0.8
0.9
1
x 10
39
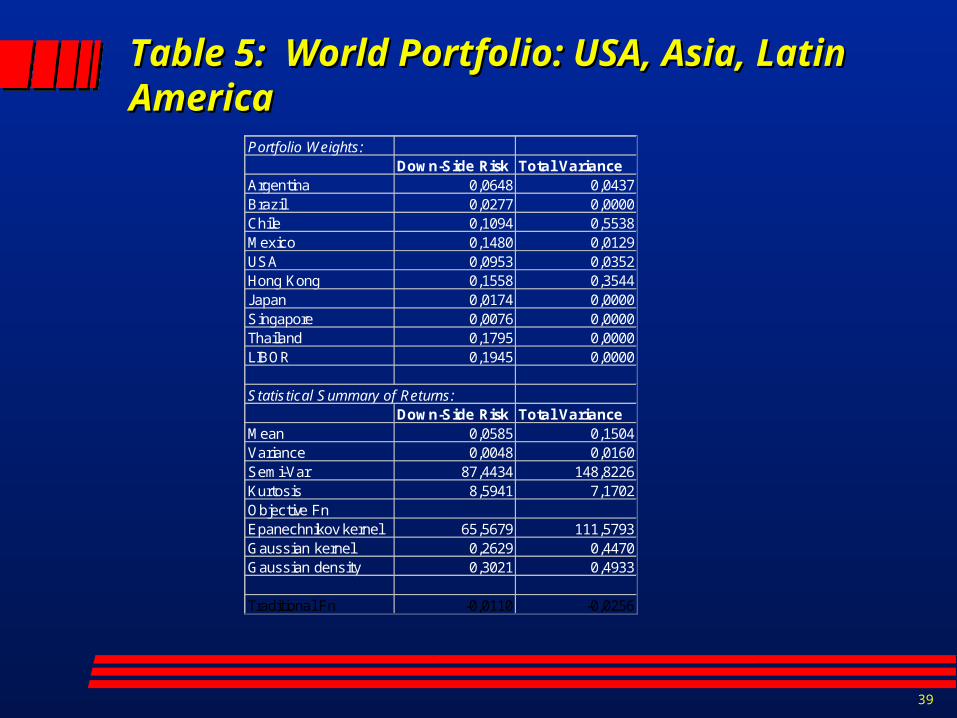
Table 5: World Portfolio: USA, Asia, Table 5: World Portfolio: USA, Asia, Latin AmericaLatin America
Portfolio Weights:Down-Side Risk Total Variance
Argentina 0,0648 0,0437Brazil 0,0277 0,0000Chile 0,1094 0,5538Mexico 0,1480 0,0129USA 0,0953 0,0352Hong Kong 0,1558 0,3544Japan 0,0174 0,0000Singapore 0,0076 0,0000Thailand 0,1795 0,0000LIBOR 0,1945 0,0000
Statistical Summary of Returns:Down-Side Risk Total Variance
Mean 0,0585 0,1504Variance 0,0048 0,0160Semi-Var 87,4434 148,8226Kurtosis 8,5941 7,1702Objective FnEpanechnikov kernel 65,5679 111,5793Gaussian kernel 0,2629 0,4470Gaussian density 0,3021 0,4933
Traditional Fn -0,0110 -0,0256

40
Figure 7: Density Function, USA-Figure 7: Density Function, USA-Asia-Latin AmericaAsia-Latin America
-0.08 -0.06 -0.04 -0.02 0 0.02 0.04 0.060
0.1
0.2
0.3
0.4
0.5
0.6
0.7
0.8
0.9
1x 10
-3

41
Chapter VIChapter VI
42
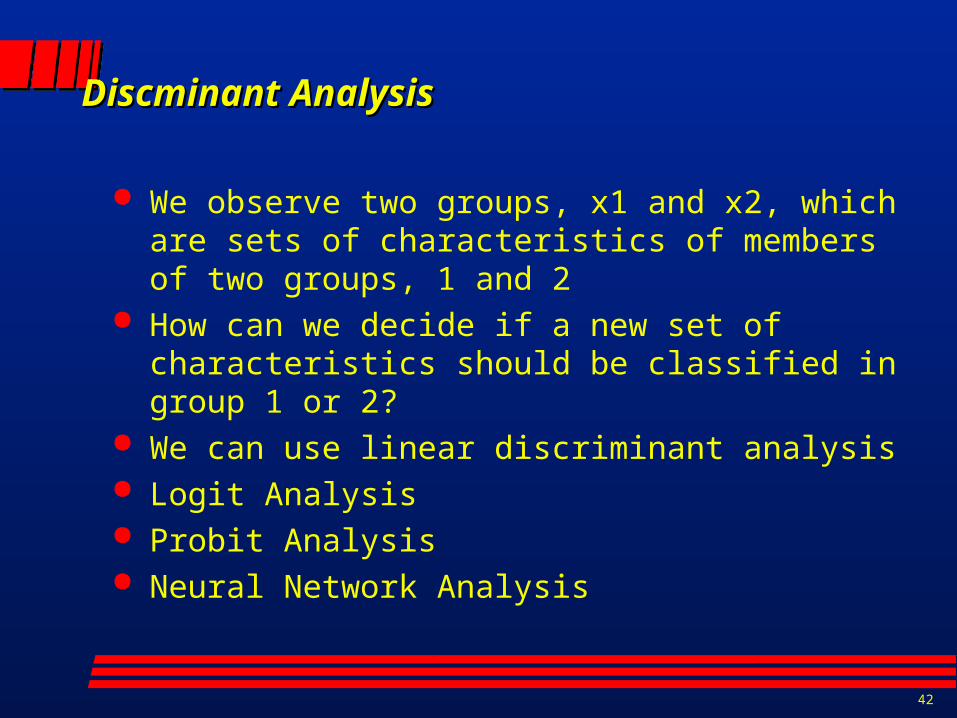
Discminant AnalysisDiscminant Analysis
We observe two groups, x1 and x2, which are sets of characteristics of members of two groups, 1 and 2
How can we decide if a new set of characteristics should be classified in group 1 or 2?
We can use linear discriminant analysis Logit Analysis Probit Analysis Neural Network Analysis
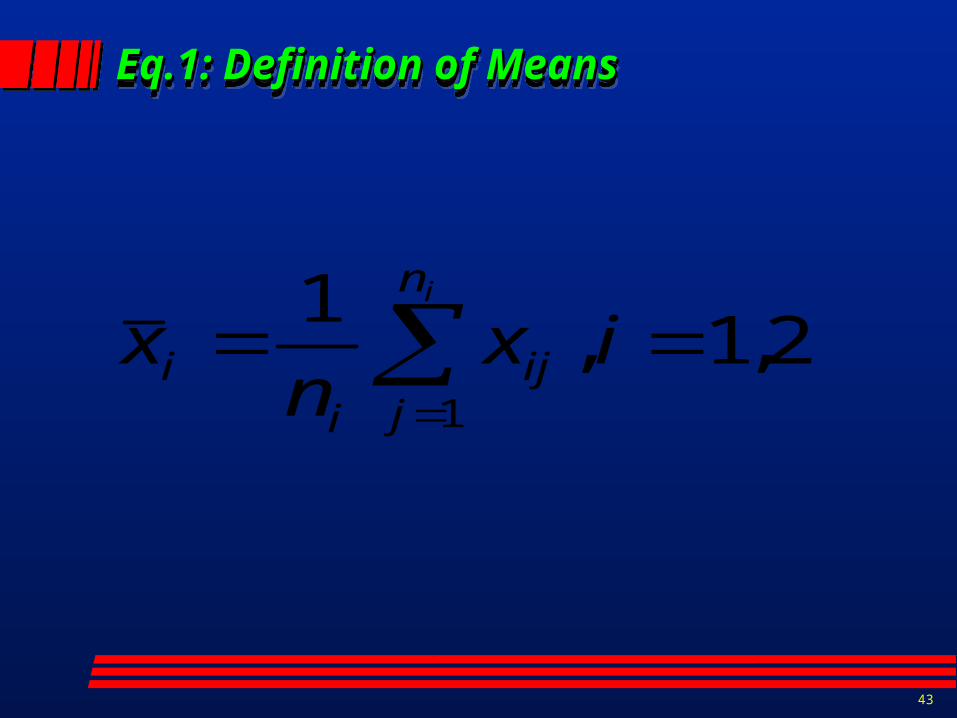
43
Eq.1: Definition of Means Eq.1: Definition of Means Eq.1: Definition of Means Eq.1: Definition of Means
2,1,1
1
ixn
xin
jij
ii
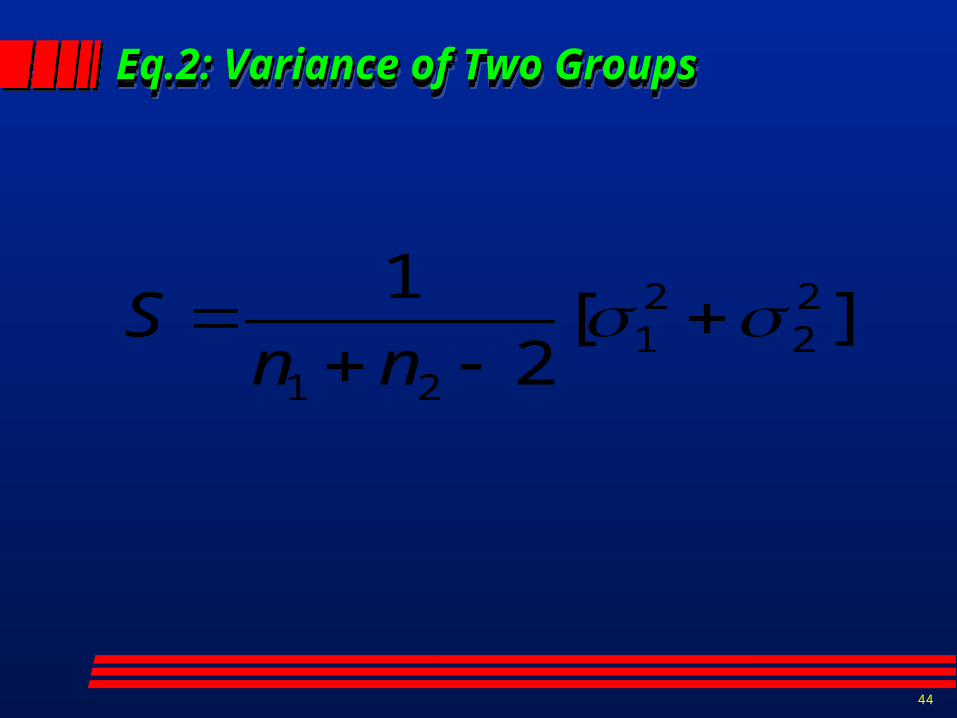
44
Eq.2: Variance of Two Groups Eq.2: Variance of Two Groups Eq.2: Variance of Two Groups Eq.2: Variance of Two Groups
][2
1 22
21
21
nn
S
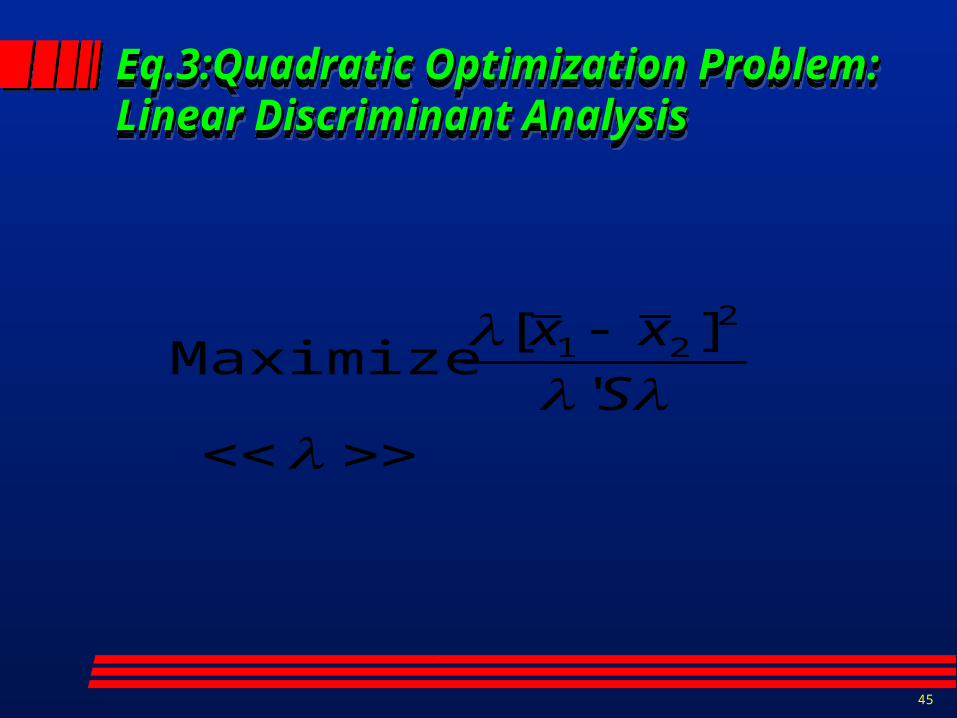
45
Eq.3:Quadratic Optimization Problem:Eq.3:Quadratic Optimization Problem:Linear Discriminant AnalysisLinear Discriminant AnalysisEq.3:Quadratic Optimization Problem:Eq.3:Quadratic Optimization Problem:Linear Discriminant AnalysisLinear Discriminant Analysis
'
][ Maximize
221
S
xx

46
Eq.4: Discriminant VectorEq.4: Discriminant VectorEq.4: Discriminant VectorEq.4: Discriminant Vector
][ˆ21
1 xxS
47
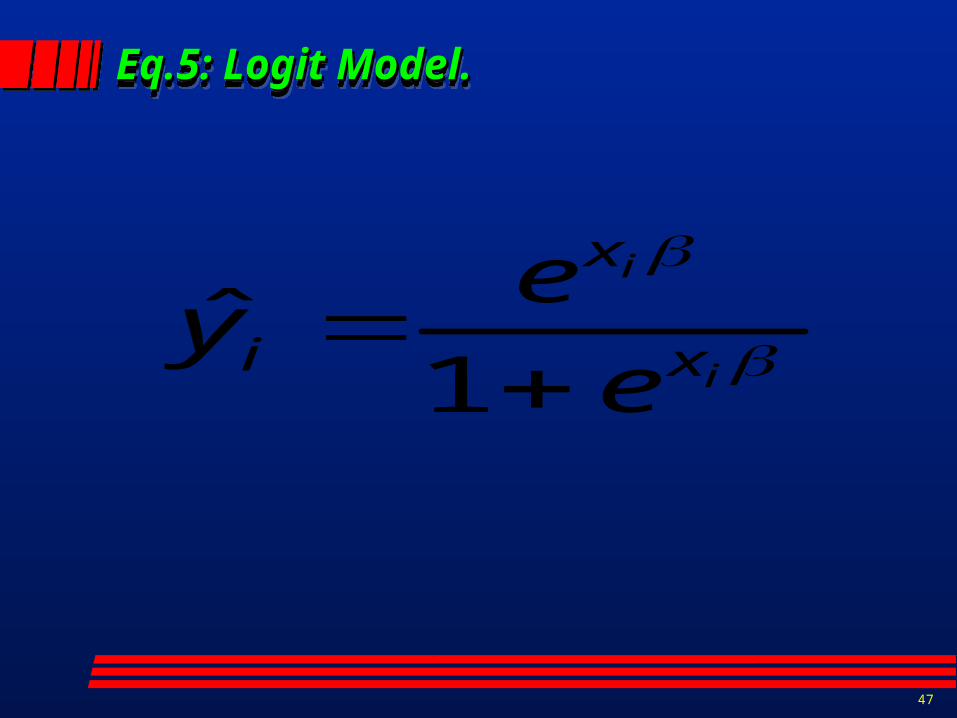
Eq.5: Logit Model.Eq.5: Logit Model.Eq.5: Logit Model.Eq.5: Logit Model.
i
i
x
x
i e
ey
1ˆ

48
Eq.6: Likelihood Function for Logit ModelEq.6: Likelihood Function for Logit ModelEq.6: Likelihood Function for Logit ModelEq.6: Likelihood Function for Logit Model
i
i
i
i
iy
x
y
x
x
i ee
elik
1
1
1
1
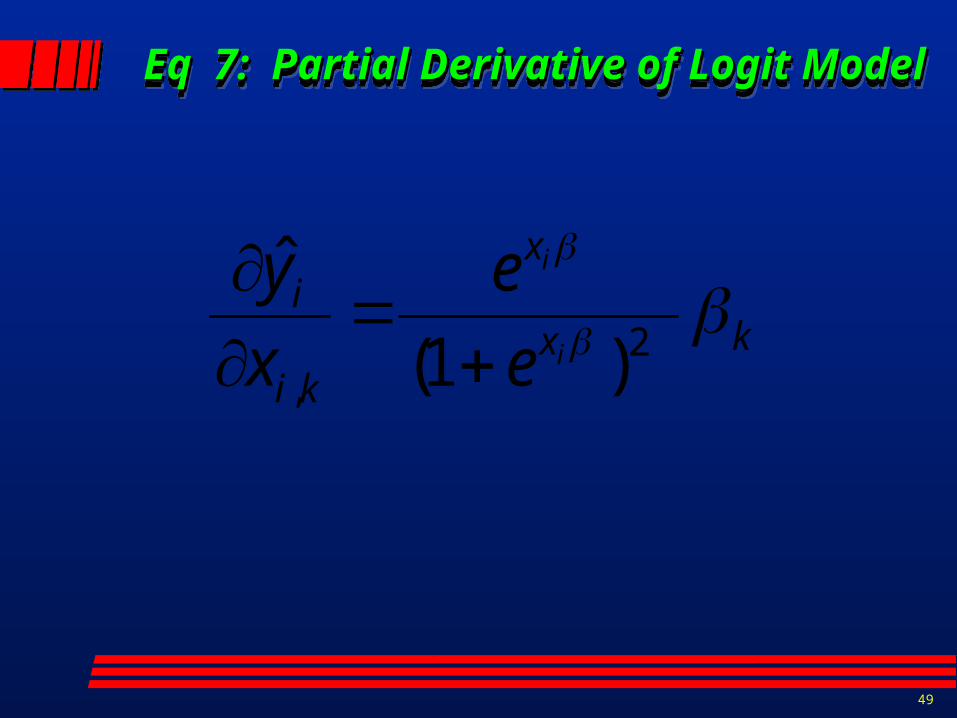
49
Eq 7: Partial Derivative of Logit ModelEq 7: Partial Derivative of Logit ModelEq 7: Partial Derivative of Logit ModelEq 7: Partial Derivative of Logit Model
kx
x
ki
i
i
i
e
e
x
y
2, )1(
ˆ

50
Eq 8 :Probit ModelEq 8 :Probit ModelEq 8 :Probit ModelEq 8 :Probit Model
i
i
xx
i
ii
ex
xy
2
1)(
)(ˆ

51
Eq 9: Likelihood Function for Probit Eq 9: Likelihood Function for Probit ModelModel
Eq 9: Likelihood Function for Probit Eq 9: Likelihood Function for Probit ModelModel
io yi
yii xNxNlik 1)(1)(
52
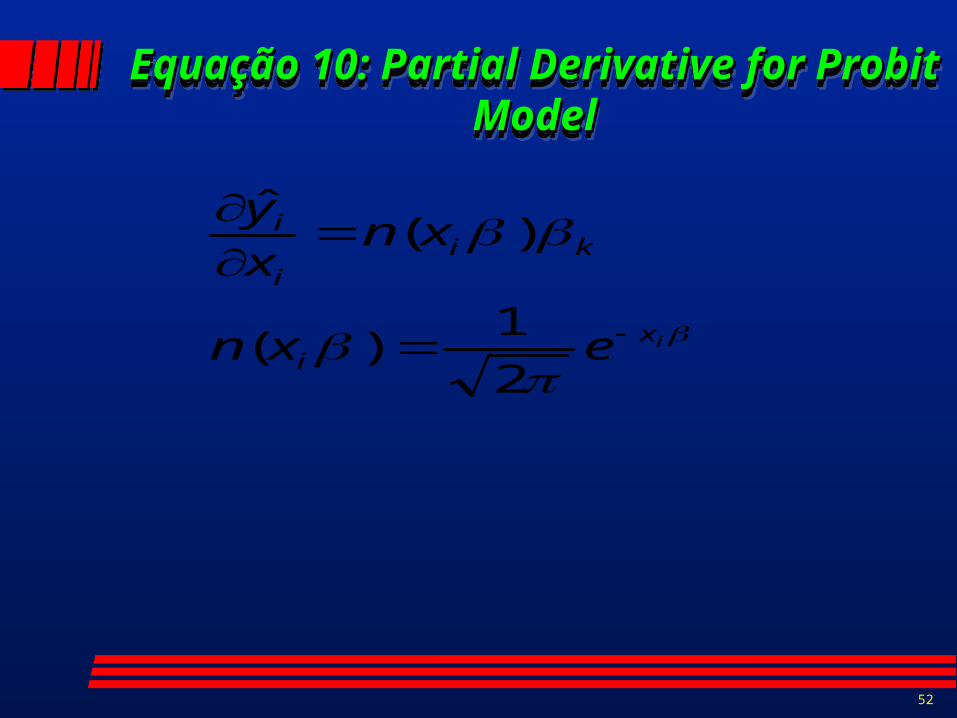
Equação 10: Partial Derivative for Probit Equação 10: Partial Derivative for Probit ModelModel
Equação 10: Partial Derivative for Probit Equação 10: Partial Derivative for Probit ModelModel
ixi
kii
i
exn
xnx
y
2
1)(
)(ˆ
53
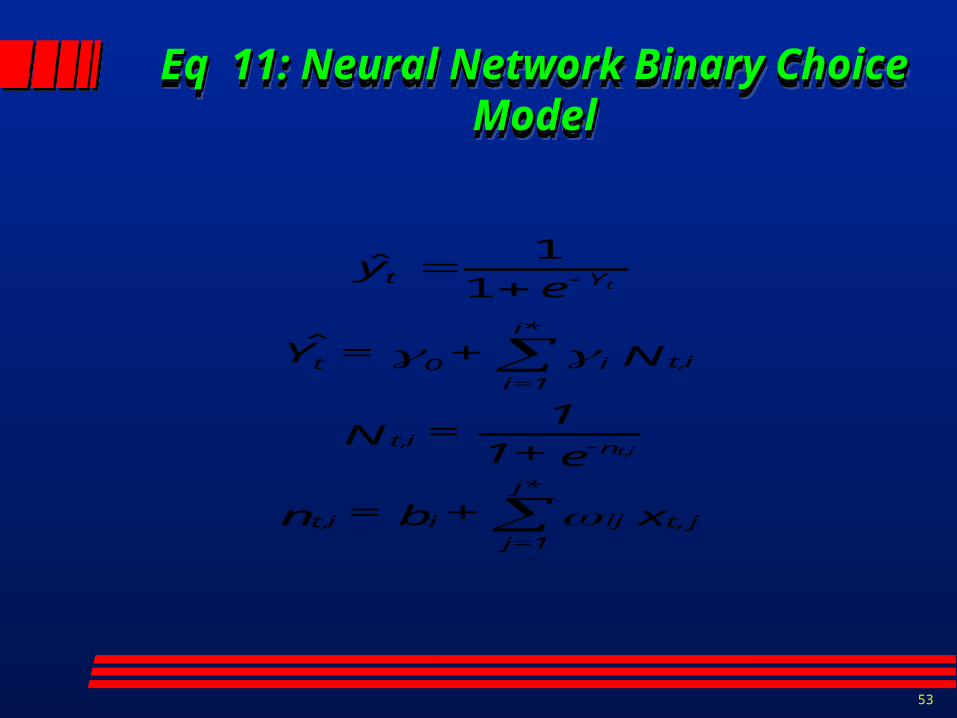
Eq 11: Neural Network Binary Choice Eq 11: Neural Network Binary Choice ModelModel
Eq 11: Neural Network Binary Choice Eq 11: Neural Network Binary Choice ModelModel
x+b=n
e+1
1=N
N+=Y
ey
jt,ij
*j
j=1iit,
n-it,
it,i
*i
=1i0t
Yt
it,
t
ˆ
1
1ˆ

54
Eq 12: Partial Derivative for Neural Eq 12: Partial Derivative for Neural Network ModelNetwork Model
Eq 12: Partial Derivative for Neural Eq 12: Partial Derivative for Neural Network ModelNetwork Model
kiitit
i
iitt
kt
it
Y
y=
x
y NNyyx
Ni
i it
t
kt
t
,,,
*
1,
,ˆˆˆ )1()ˆ1(ˆ
*
1,
55
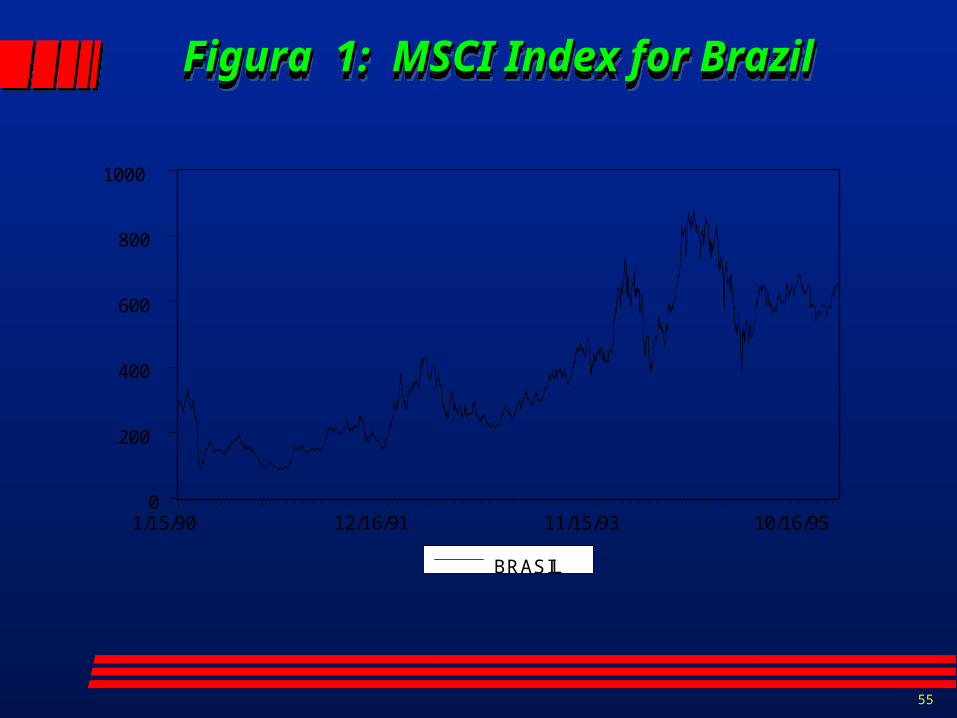
Figura 1: MSCI Index for BrazilFigura 1: MSCI Index for Brazil Figura 1: MSCI Index for BrazilFigura 1: MSCI Index for Brazil
0
200
400
600
800
1000
1/15/90 12/16/91 11/15/93 10/16/95
BRASIL

56
Table 1: Performance of Moving Table 1: Performance of Moving Average Trading RuleAverage Trading Rule
Table 1: Performance of Moving Table 1: Performance of Moving Average Trading RuleAverage Trading Rule
Error Percentages, Moverage Average Technical Trading RuleBrazilian MSCI Index, January 1990 - March 1996, Daily Data
Short Lag Long Lag Error Percenage1,00 50,00 0,491,00 150,00 0,495,00 150,00 0,49
57
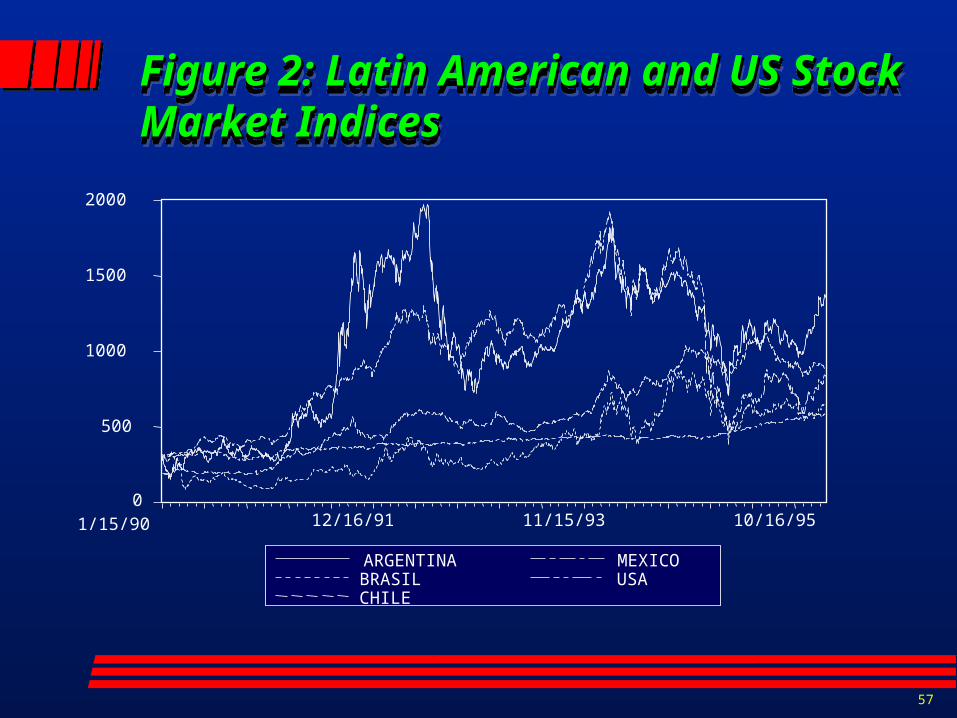
Figure 2: Latin American and US StockFigure 2: Latin American and US StockMarket IndicesMarket Indices
Figure 2: Latin American and US StockFigure 2: Latin American and US StockMarket IndicesMarket Indices
0
500
1000
1500
2000
1/15/90 12/16/91 11/15/93 10/16/95
ARGENTINABRASILCHILE
MEXICOUSA

58
Eq 13: Dependent Variable in Buy/Sell ModelEq 13: Dependent Variable in Buy/Sell Model
Eq 13: Dependent Variable in Buy/Sell ModelEq 13: Dependent Variable in Buy/Sell Model
0 if 1
0s if 0 t
Brasilt
Brasil
sy
59
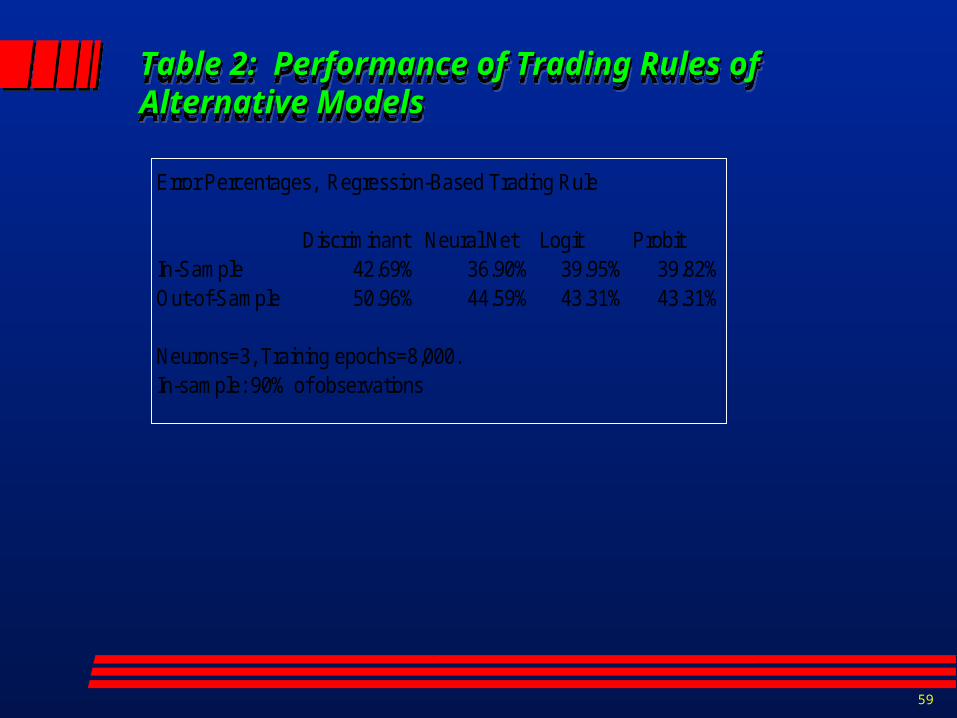
Table 2: Performance of Trading Rules of Table 2: Performance of Trading Rules of Alternative ModelsAlternative Models
Table 2: Performance of Trading Rules of Table 2: Performance of Trading Rules of Alternative ModelsAlternative Models
Error Percentages, Regression-Based Trading Rule
Discriminant Neural Net Logit ProbitIn-Sample 42.69% 36.90% 39.95% 39.82%Out-of-Sample 50.96% 44.59% 43.31% 43.31%
Neurons=3, Training epochs=8,000.In-sample: 90% of observations

60
Table 3: Consumer Credit Model: EstimatesTable 3: Consumer Credit Model: Estimates
Table 3: Consumer Credit Model: EstimatesTable 3: Consumer Credit Model: Estimates
Logit Probit Partial DerivativesArguments: T-Stat T-Stat Nnet Logit Probit1. vf: value of financing 0,922332 0,907302 1,516208 0,186084 0,1791512. vl: value of the loans 2,004208 2,136202 2,127752 0,47172 0,495383. ql: quantity of loans 1,226762 1,286233 0,140865 0,06816 0,0699794. s: sex: 0 for female, 1 for male -1,38524 -1,23087 -0,23418 -0,01916 -0,019585. cs: civil status: 0: single, 1 married -0,50722 -0,52628 -1,2796 -0,02171 -0,022166. h: housing, 0 rented, 1 owned 2,377774 2,498985 0,217371 0,085793 0,0871737. yh: years in current house 1,883083 1,814359 -0,59185 0,100217 0,0985458. yw: years in work -1,3286 -1,3864 0,465148 -0,03074 -0,029379. sal: salary 6,212102 6,311303 0,898023 0,349173 0,37085210. ck: check account, 0 for no, 1 for yes -2,0823 -2,06653 1,417352 -0,07555 -0,0760511. ccard: credit card, 0 for no, 1 for yes -2,41247 -2,2934 -2,60065 -0,10433 -0,0988812. tel: telephone, 0 for no, 1 for yes 0,676859 0,76529 -0,62618 0,024007 0,02577413. Constant term -8,34578 -8,641
Error Percentage Evaluation: .75 * False negative % + .25 False Positive %Discriminant Nnet Logit Probit
In-Sample 15,97% 7,26% 7,52% 7,54%Out-of-Sample 18,19% 14,09% 14,20% 14,22%
Value at Risk 26,52% 28,13% 28,06%
61
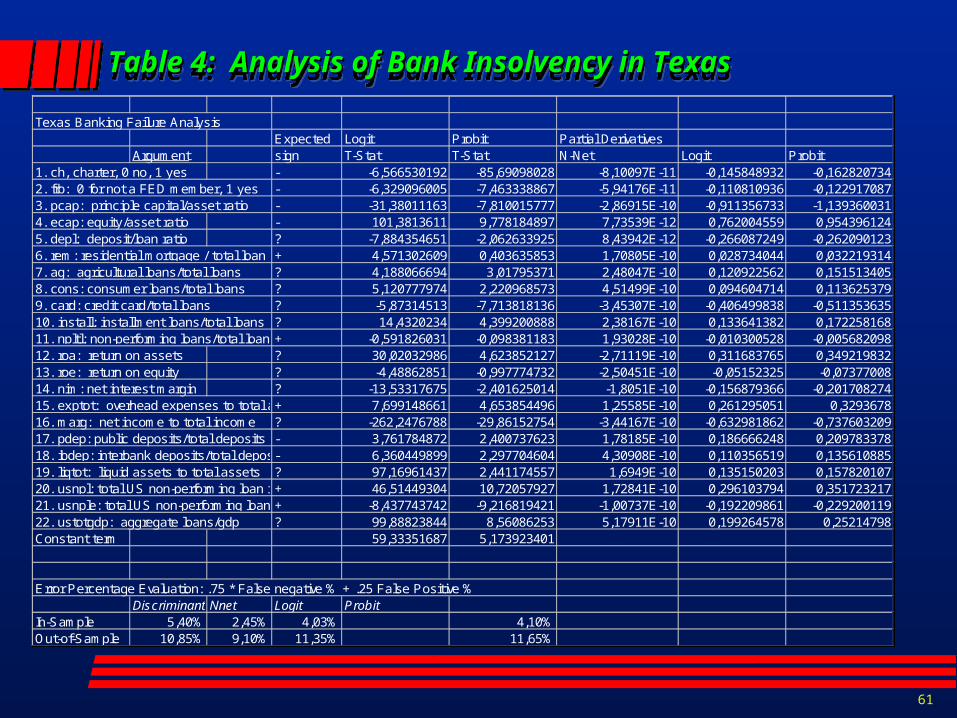
Table 4: Analysis of Bank Insolvency in TexasTable 4: Analysis of Bank Insolvency in Texas
Table 4: Analysis of Bank Insolvency in TexasTable 4: Analysis of Bank Insolvency in Texas
Texas Banking Failure AnalysisExpected Logit Probit Partial Derivatives
Argument sign T-Stat T-Stat N-Net Logit Probit1. ch, charter, 0 no, 1 yes - -6,566530192 -85,69098028 -8,10097E-11 -0,145848932 -0,1628207342. frb: 0 for not a FED member, 1 yes - -6,329096005 -7,463338867 -5,94176E-11 -0,110810936 -0,1229170873. pcap: principle capital/asset ratio - -31,38011163 -7,810015777 -2,86915E-10 -0,911356733 -1,1393600314. ecap: equity/asset ratio - 101,3813611 9,778184897 7,73539E-12 0,762004559 0,9543961245. depl: deposit/loan ratio ? -7,884354651 -2,062633925 8,43942E-12 -0,266087249 -0,2620901236. rem: residential mortgage / total loan ratio+ 4,571302609 0,403635853 1,70805E-10 0,028734044 0,0322193147. ag: agricultural loans/total loans ? 4,188066694 3,01795371 2,48047E-10 0,120922562 0,1515134058. cons: consumer loans/total loans ? 5,120777974 2,220968573 4,51499E-10 0,094604714 0,1136253799. card: credit card/total loans ? -5,87314513 -7,713818136 -3,45307E-10 -0,406499838 -0,51135363510. install: installment loans/total loans ? 14,4320234 4,399200888 2,38167E-10 0,133641382 0,17225816811. npltl: non-performing loans/total loans+ -0,591826031 -0,098381183 1,93028E-10 -0,010300528 -0,00568209812. roa: return on assets ? 30,02032986 4,623852127 -2,71119E-10 0,311683765 0,34921983213. roe: return on equity ? -4,48862851 -0,997774732 -2,50451E-10 -0,05152325 -0,0737700814. nim: net interest margin ? -13,53317675 -2,401625014 -1,8051E-10 -0,156879366 -0,20170827415. exptot: overhead expenses to total assets+ 7,699148661 4,653854496 1,25585E-10 0,261295051 0,329367816. marg: net income to total income ? -262,2476788 -29,86152754 -3,44167E-10 -0,632981862 -0,73760320917. pdep: public deposits/total deposits - 3,761784872 2,400737623 1,78185E-10 0,186666248 0,20978337818. ibdep: interbank deposits/total deposits- 6,360449899 2,297704604 4,30908E-10 0,110356519 0,13561088519. liqtot: liquid assets to total assets ? 97,16961437 2,441174557 1,6949E-10 0,135150203 0,15782010720. usnpl: total US non-performing loan ratio+ 46,51449304 10,72057927 1,72841E-10 0,296103794 0,35172321721. usnple: total US non-performing loans/total equity+ -8,437743742 -9,216819421 -1,00737E-10 -0,192209861 -0,22920011922. ustotgdp: aggregate loans/gdp ? 99,88823844 8,56086253 5,17911E-10 0,199264578 0,25214798Constant term 59,33351687 5,173923401
Error Percentage Evaluation: .75 * False negative % + .25 False Positive %Discriminant Nnet Logit Probit
In-Sample 5,40% 2,45% 4,03% 4,10%Out-of-Sample 10,85% 9,10% 11,35% 11,65%
62
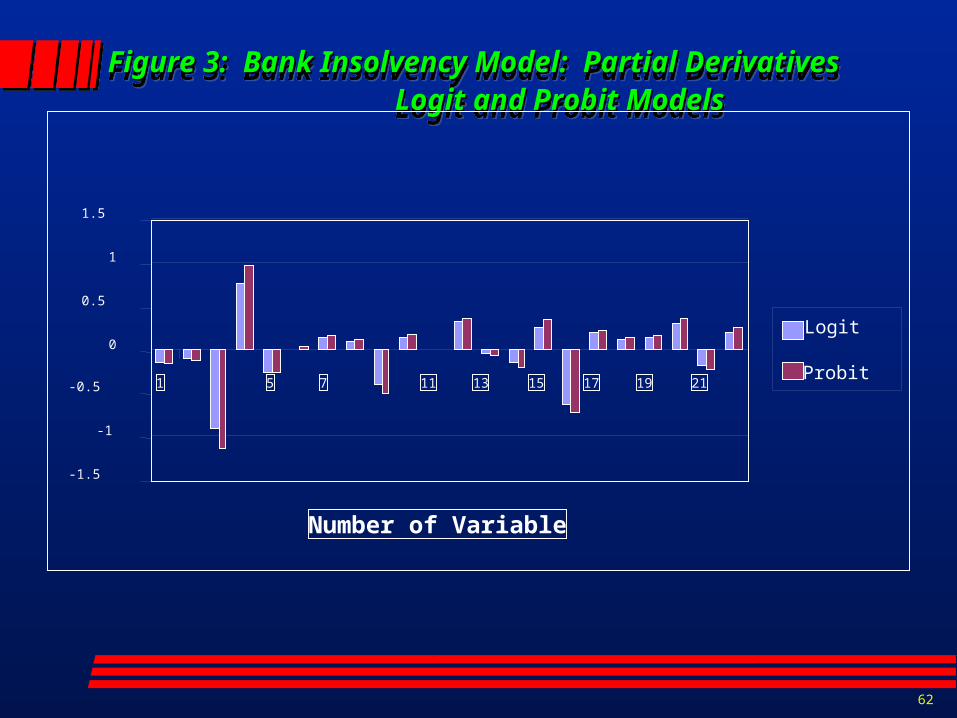
Figure 3: Bank Insolvency Model: Partial DerivativesFigure 3: Bank Insolvency Model: Partial Derivatives
Logit and Probit ModelsLogit and Probit Models
Figure 3: Bank Insolvency Model: Partial DerivativesFigure 3: Bank Insolvency Model: Partial Derivatives
Logit and Probit ModelsLogit and Probit Models
-1.5
-1
-0.5
0
0.5
1
1.5
1 5 7 11 13 15 17 19 21
Number of Variable
Logit
Probit
63
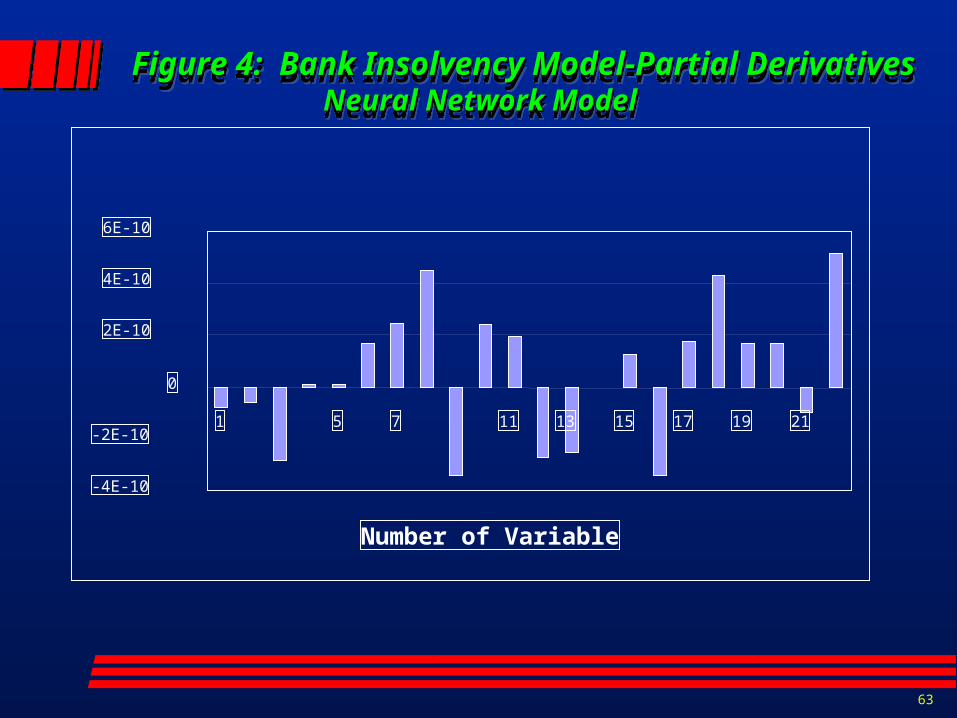
Figure 4: Bank Insolvency Model-Partial DerivativesFigure 4: Bank Insolvency Model-Partial Derivatives
Neural Network ModelNeural Network Model
Figure 4: Bank Insolvency Model-Partial DerivativesFigure 4: Bank Insolvency Model-Partial Derivatives
Neural Network ModelNeural Network Model
-4E-10
-2E-10
0
2E-10
4E-10
6E-10
1 5 7 11 13 15 17 19 21
Number of Variable