1 CHAPTER 3 Analysis of Financial Statements. 2 Topics in Chapter Ratio analysis Du Pont system...
67
1 CHAPTER 3 Analysis of Financial Statements
-
Upload
charlotte-daniels -
Category
Documents
-
view
239 -
download
2
Transcript of 1 CHAPTER 3 Analysis of Financial Statements. 2 Topics in Chapter Ratio analysis Du Pont system...

1
CHAPTER 3
Analysis of Financial Statements

2
Topics in Chapter
Ratio analysis Du Pont system Effects of improving ratios Limitations of ratio analysis Qualitative factors
3
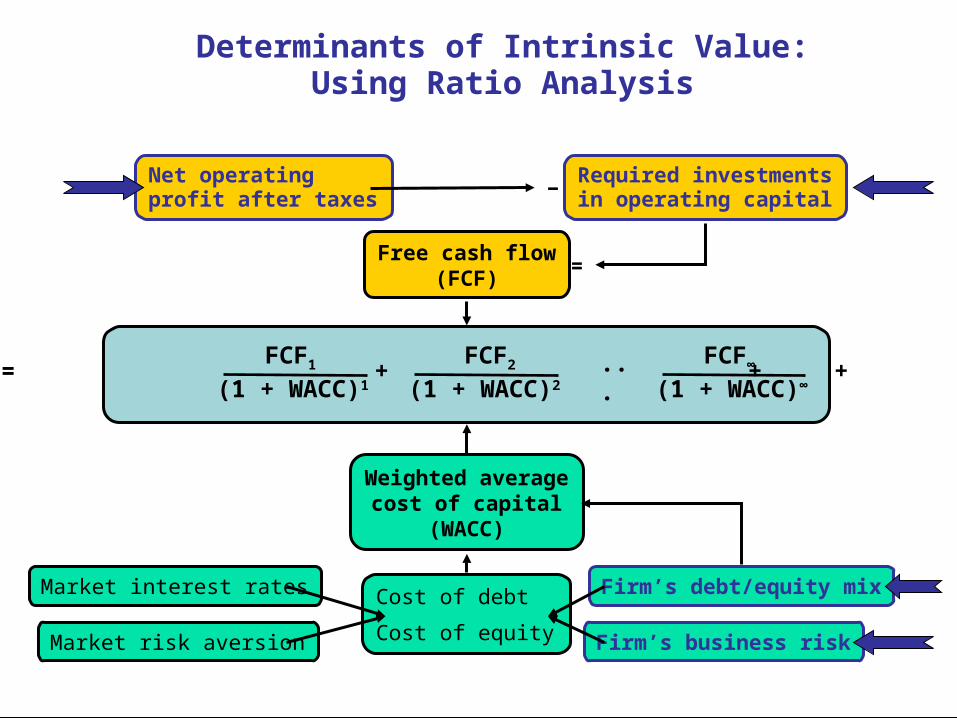
Value = + + +FCF1 FCF2 FCF∞
(1 + WACC)1 (1 + WACC)∞
(1 + WACC)2
Free cash flow(FCF)
Market interest rates
Firm’s business risk
Market risk aversion
Firm’s debt/equity mix
Cost of debt
Cost of equity
Weighted average
cost of capital(WACC)
Net operatingprofit after taxes
Required investmentsin operating capital
−
=
Determinants of Intrinsic Value:Using Ratio Analysis
...
4
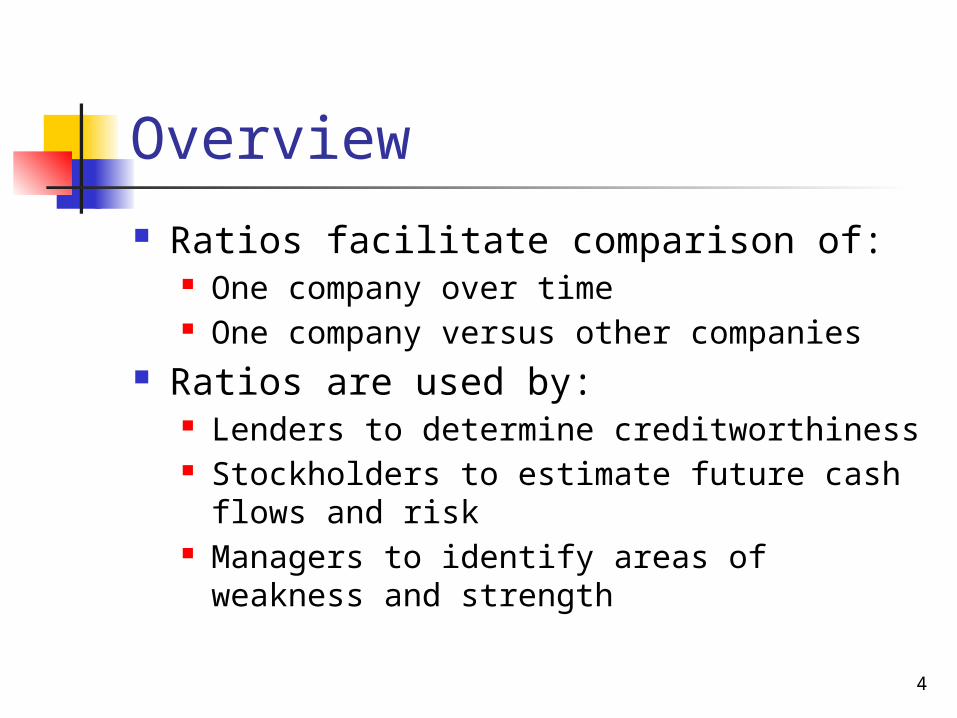
Overview Ratios facilitate comparison of:
One company over time One company versus other companies
Ratios are used by: Lenders to determine creditworthiness Stockholders to estimate future cash flows
and risk Managers to identify areas of weakness and
strength
5
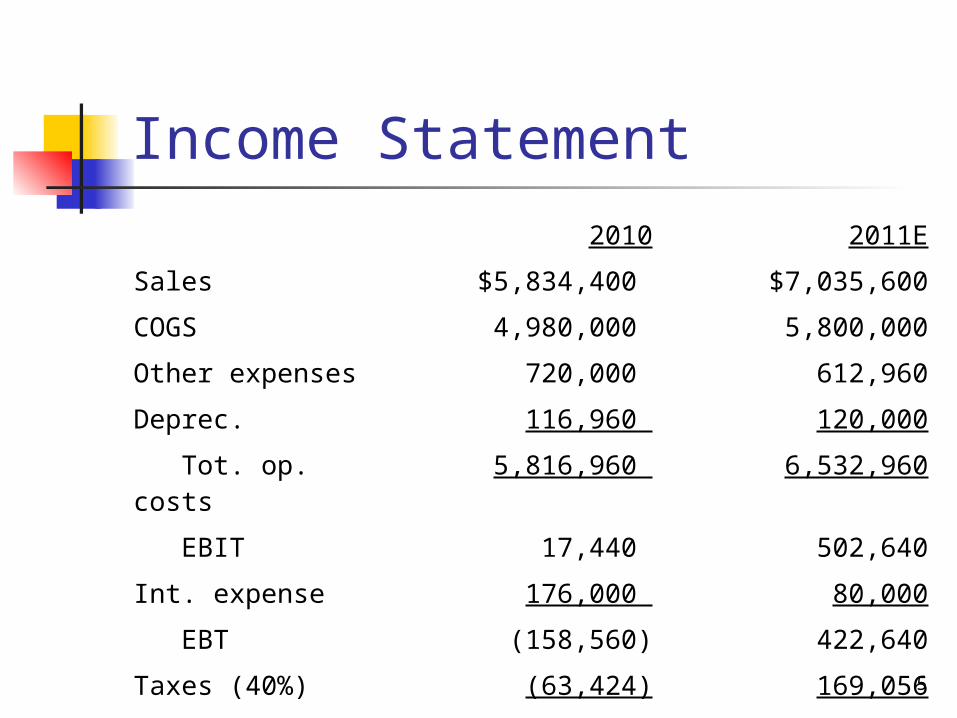
Income Statement2010 2011E
Sales $5,834,400 $7,035,600
COGS 4,980,000 5,800,000
Other expenses 720,000 612,960
Deprec. 116,960 120,000
Tot. op. costs 5,816,960 6,532,960
EBIT 17,440 502,640
Int. expense 176,000 80,000
EBT (158,560) 422,640
Taxes (40%) (63,424) 169,056
Net income ($ 95,136) $ 253,584

6
Balance Sheets: Assets
2010 2011E
Cash $ 7,282 $ 14,000
S-T invest. 20,000 71,632
AR 632,160 878,000
Inventories 1,287,360 1,716,480
Total CA 1,946,802 2,680,112
Net FA 939,790 836,840
Total assets $2,886,592 $3,516,952
7
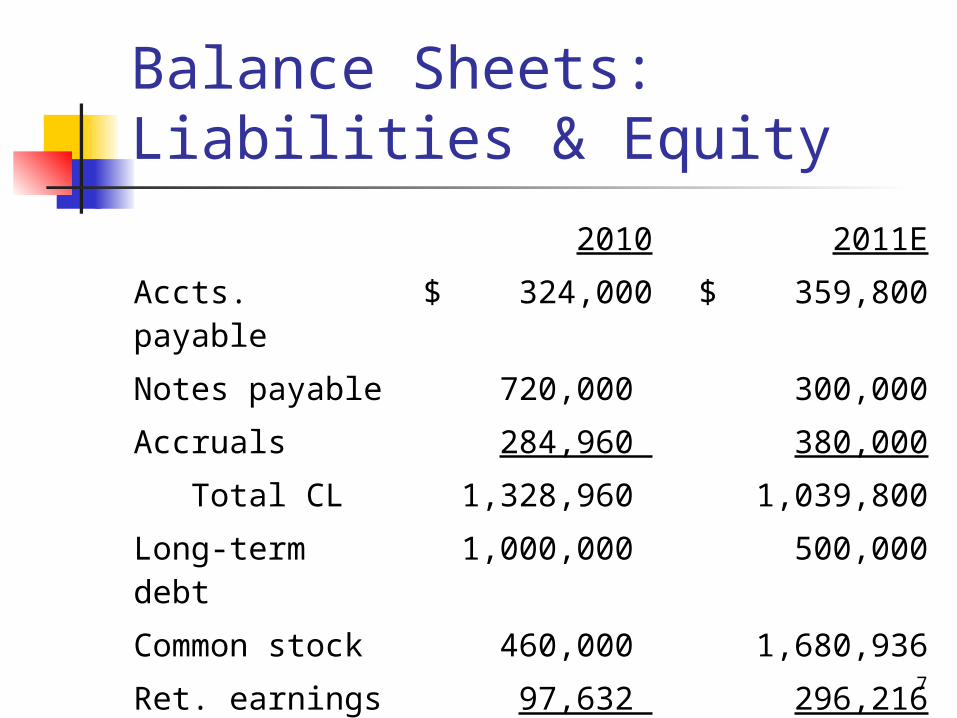
Balance Sheets: Liabilities & Equity
2010 2011E
Accts. payable $ 324,000 $ 359,800
Notes payable 720,000 300,000
Accruals 284,960 380,000
Total CL 1,328,960 1,039,800
Long-term debt 1,000,000 500,000
Common stock 460,000 1,680,936
Ret. earnings 97,632 296,216
Total equity 557,632 1,977,152
Total L&E $2,886,592 $3,516,952

8
Other Data
2010 2011E
Stock price $6.00 $12.17
# of shares 100,000 250,000
EPS -$0.95 $1.01
DPS $0.11 $0.22Book val. per sh. $5.58 $7.91
Lease payments $40,000 $40,000
Tax rate 0.4 0.4

Five Categories of Fin. Ratios
Liquidity Asset Mgmt Debt Mgmt Profitability Market Value
9

Five Categories of Fin. Ratios
Liquidity: Ability to meet current obligations
Asset Mgmt: Proper & effective use of assets Asset utilization (i.e., Total Asset Turnover
Ratio: TAT = Sales / T. Assets
Debt Mgmt: extent of debt & level of safety afforded creditors Debt utilization (i.e., Equity Multiplier:
EM = T. Assets / T. Eqty
10

Five Categories of Fin. Ratios
Profitability: reflects effects of liquidity, asset mgmt, & debt on operating results Expense Control: Profit Margin:
PM = Net Income / Sales
Market Value: indicators of what investors think of firm’s past results & future prospects
11

12
Liquidity Ratios
Can the company meet its short-term obligations using resources it currently has on hand?
13
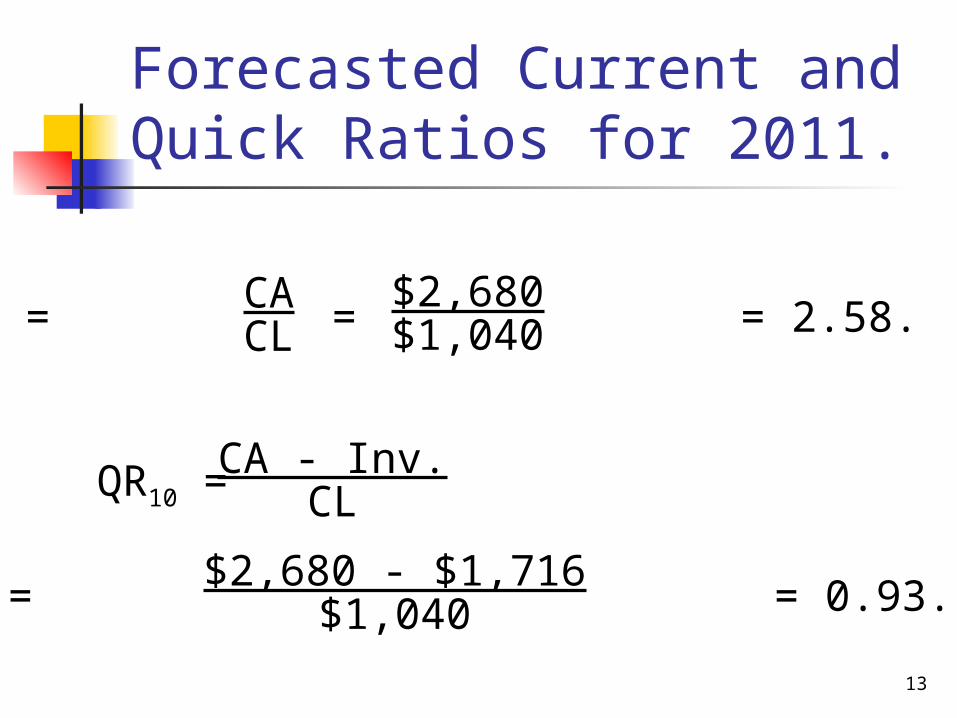
Forecasted Current and Quick Ratios for 2011.
CR10 = = = 2.58.
QR10 =
= = 0.93.
CACL
$2,680$1,040
$2,680 - $1,716$1,040
CA - Inv.CL
14
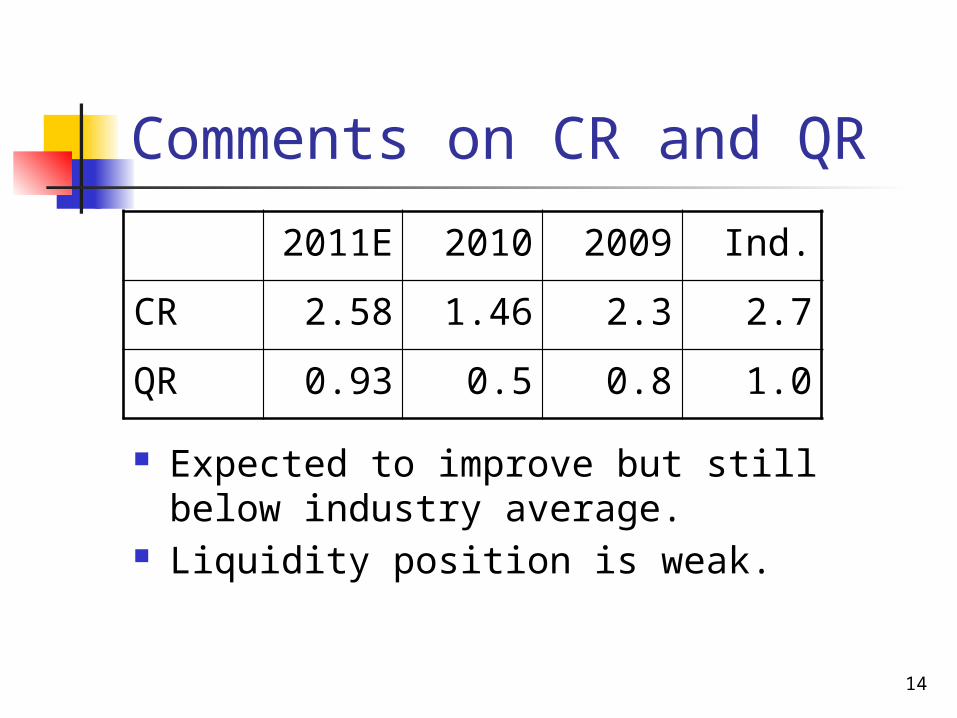
Comments on CR and QR
2011E 2010 2009 Ind.
CR 2.58 1.46 2.3 2.7
QR 0.93 0.5 0.8 1.0
Expected to improve but still below industry average.
Liquidity position is weak.
15
Asset Management Ratios
How efficiently does firm use its assets?
How much does firm have tied up in assets for each dollar of sales?

16
Inventory Turnover Ratio vs. Industry Average
Inv. turnover =
= = 4.10.
SalesInventories$7,036$1,716
2011E 2010 2009 Ind.
Inv. T. 4.1 4.5 4.8 6.1

17
Comments on Inventory Turnover
Inventory turnover: Firm might have old inventory, or
its control might be poor. No improvement is currently
forecasted.
Below industry average
18
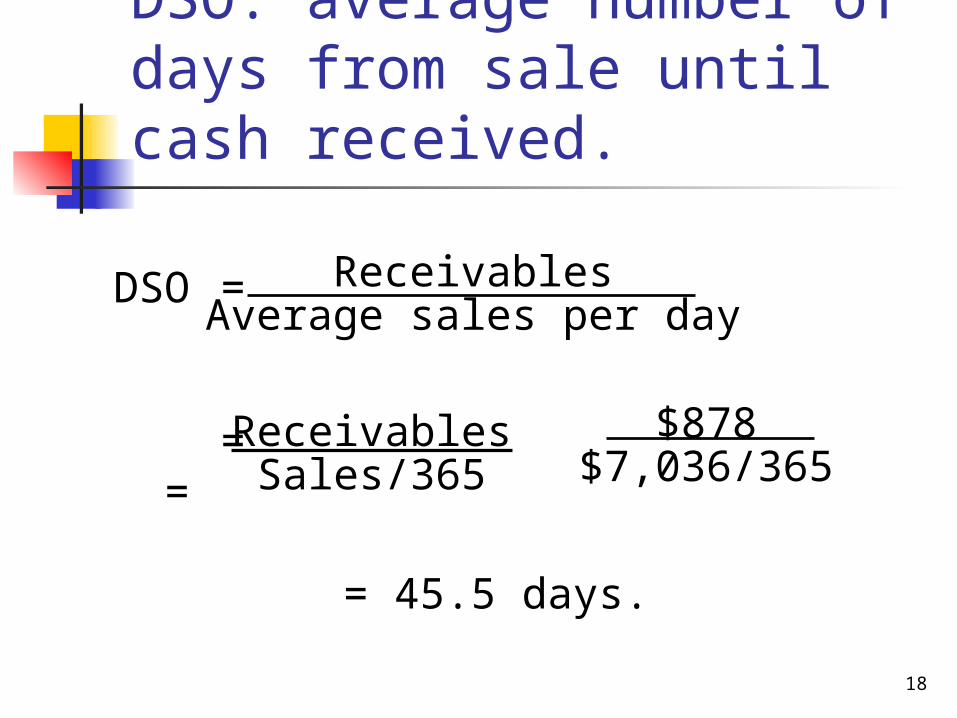
DSO =
= =
= 45.5 days.
ReceivablesAverage sales per day
$878$7,036/365
ReceivablesSales/365
DSO: average number of days from sale until cash received.

19
Appraisal of DSO
Firm collects too slowly, and situation is getting worse.
Poor credit policy.
2011 2010 2009 Ind.DSO 45.5 39.5 37.4 32.0

=
= = 8.41.
20
Total assetsturnover =
= = 2.00.
Sales Total assets$7,036$3,517
Fixed assetsturnover
Sales
Net fixed assets$7,036$837
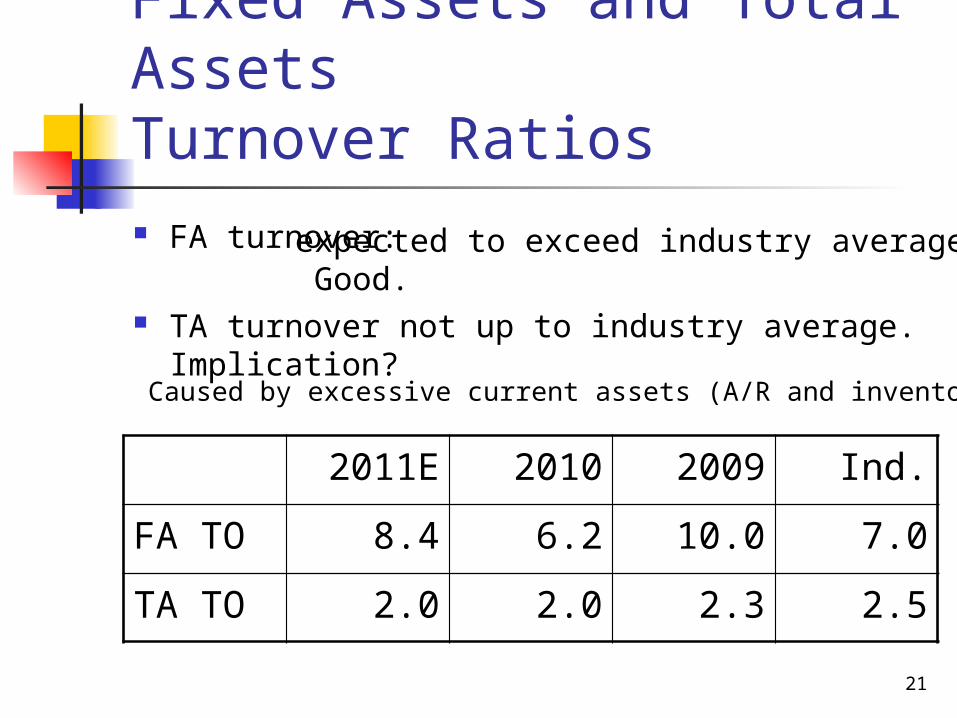
Fixed Assets and Total AssetsTurnover Ratios
21
Fixed Assets and Total AssetsTurnover Ratios FA turnover:
TA turnover not up to industry average. Implication?
2011E 2010 2009 Ind.
FA TO 8.4 6.2 10.0 7.0
TA TO 2.0 2.0 2.3 2.5
expected to exceed industry average. Good.
Caused by excessive current assets (A/R and inventory).
22
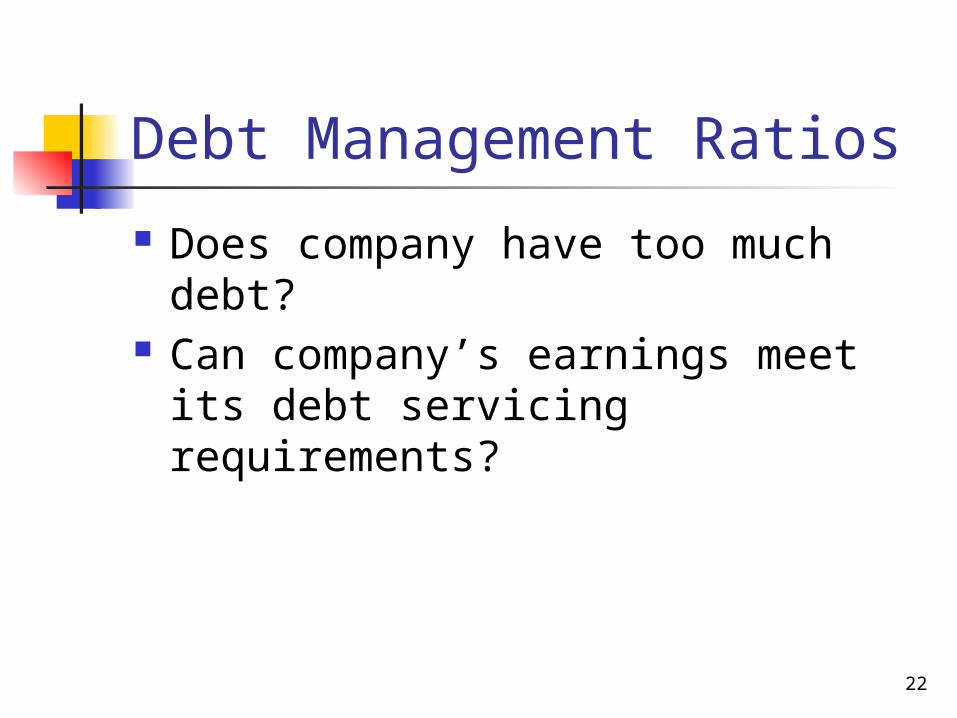
Debt Management Ratios
Does company have too much debt?
Can company’s earnings meet its debt servicing requirements?
23
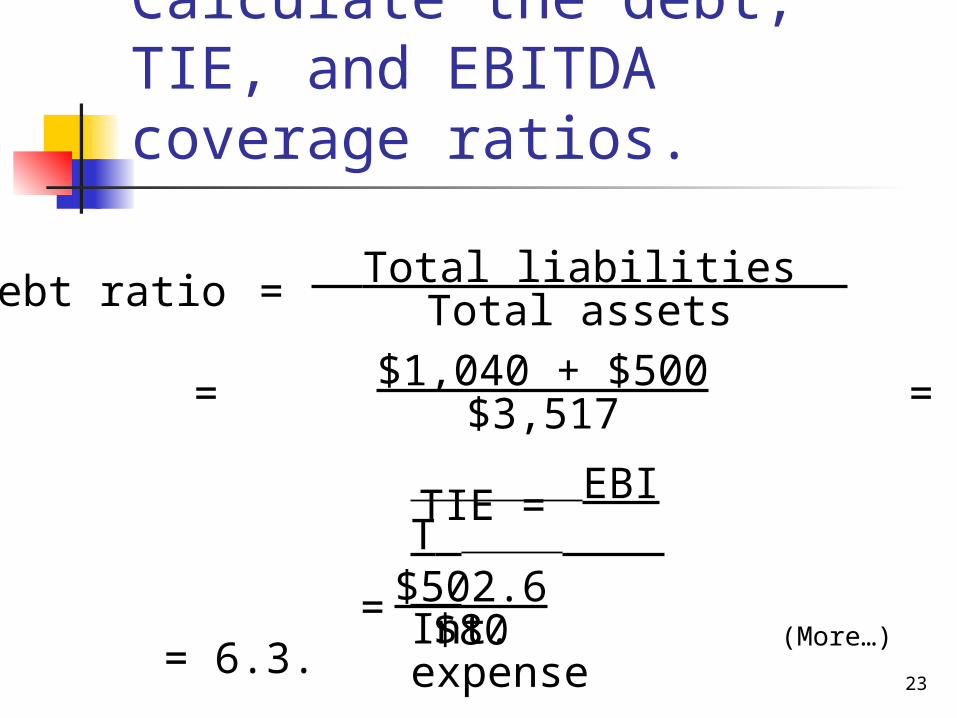
Total liabilities Total assetsDebt ratio =
= = 43.8%.$1,040 + $500$3,517
EBIT Int. expense
TIE =
= = 6.3.
$502.6$80 (More…)
Calculate the debt, TIE, and EBITDA coverage ratios.
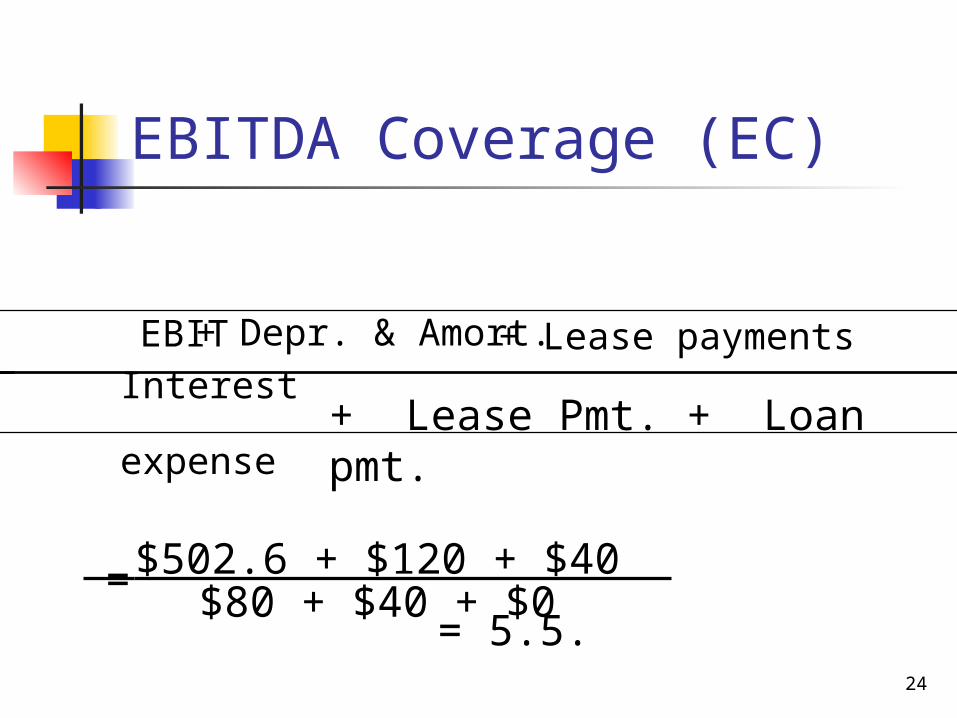
24
= = 5.5.
_________ + Lease Pmt. + Loan
pmt.
$502.6 + $120 + $40 $80 + $40 + $0
EBITDA Coverage (EC)
EBIT+ Depr. & Amort. + Lease payments Interest expense
25
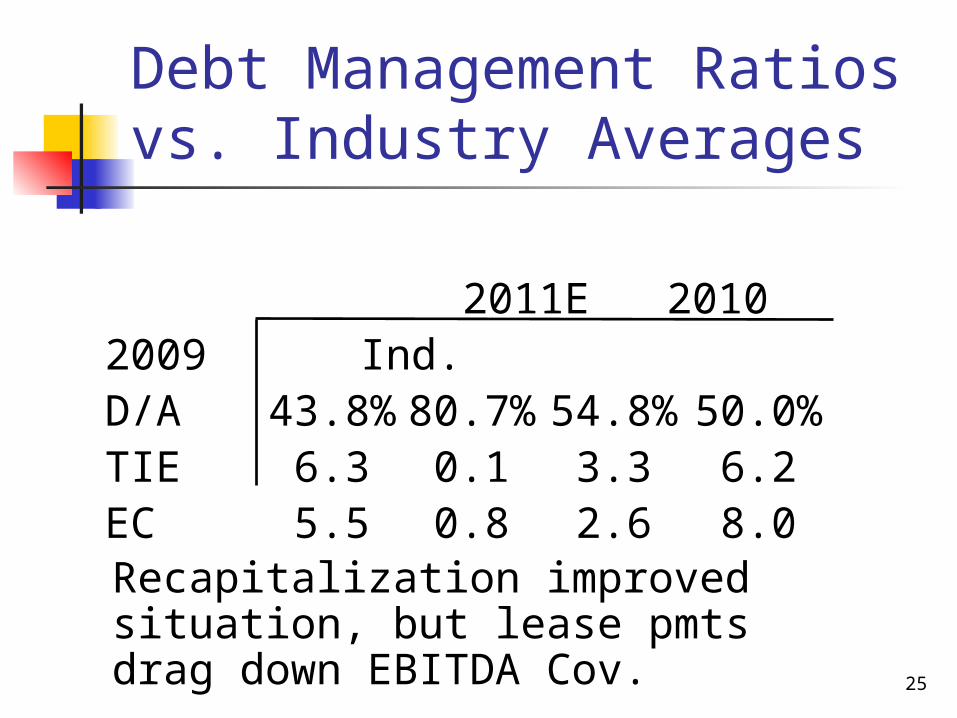
Recapitalization improved situation, but lease pmts drag down EBITDA Cov.
2011E 2010 2009 Ind.D/A 43.8%80.7% 54.8% 50.0%TIE 6.3 0.1 3.3 6.2EC 5.5 0.8 2.6 8.0
Debt Management Ratios vs. Industry Averages
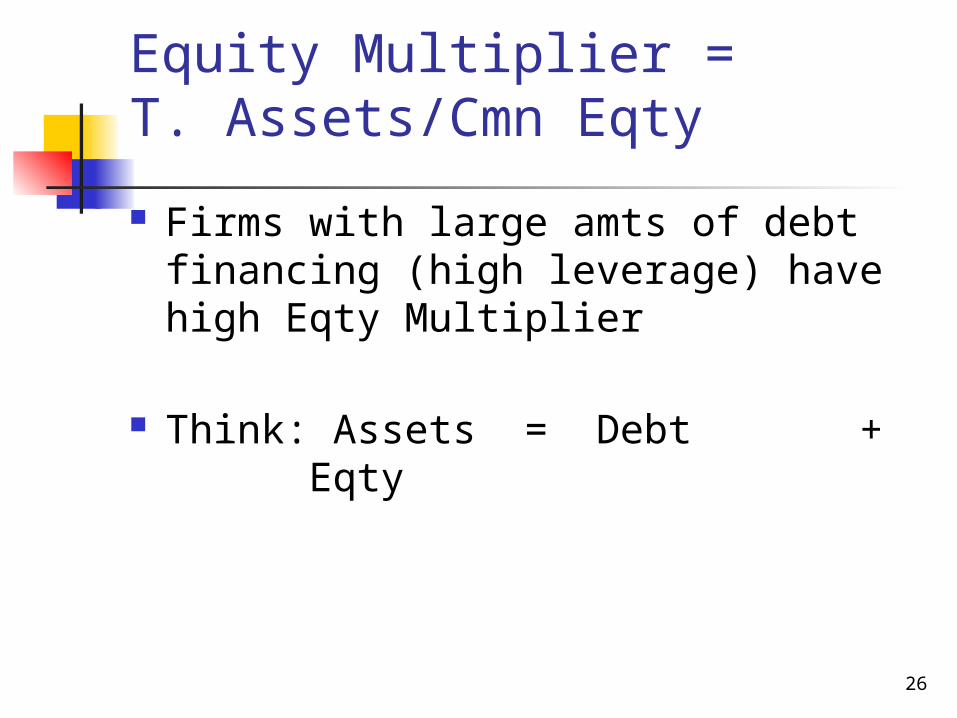
Equity Multiplier = T. Assets/Cmn Eqty
Firms with large amts of debt financing (high leverage) have high Eqty Multiplier
Think: Assets = Debt + Eqty
26
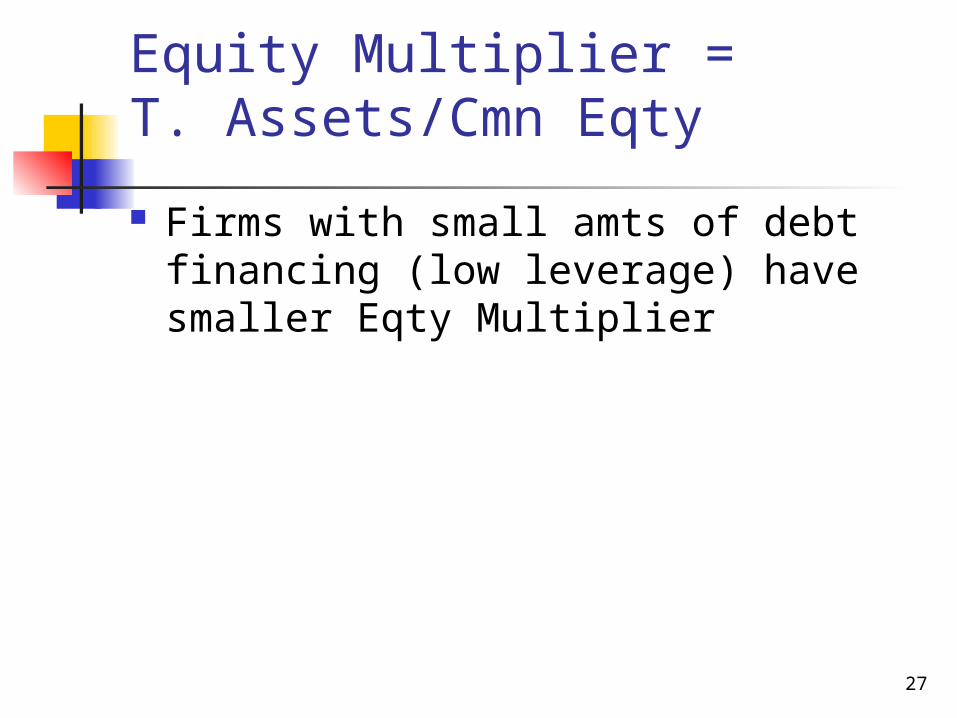
Equity Multiplier = T. Assets/Cmn Eqty
Firms with small amts of debt financing (low leverage) have smaller Eqty Multiplier
27

28
Profitability Ratios
What is company’s rate of return on: Sales? Assets?
29
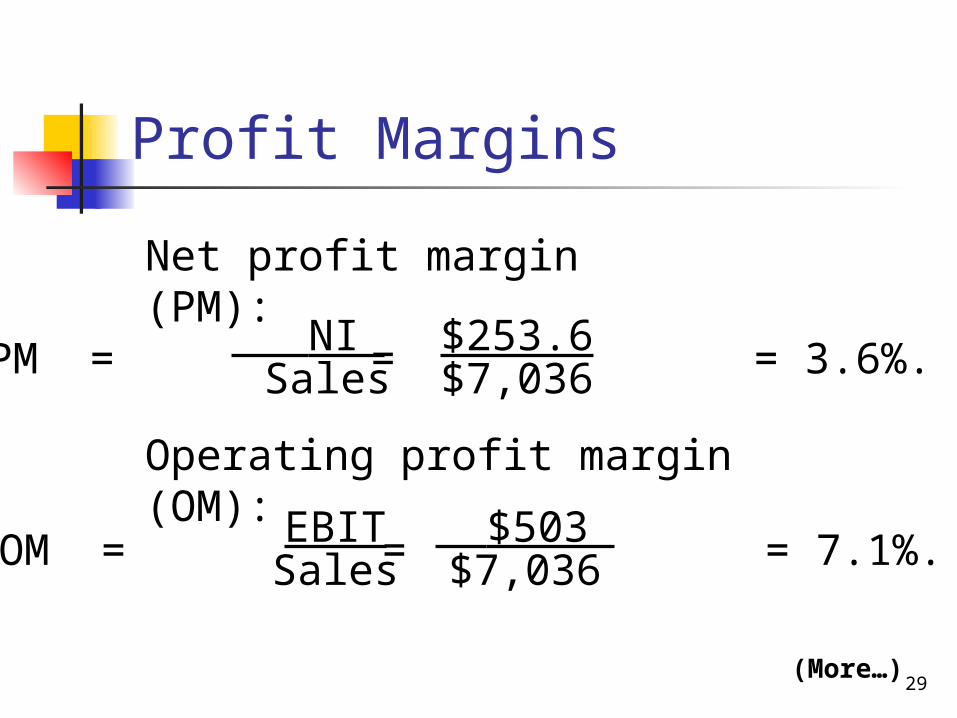
Profit Margins
PM = = = 3.6%. NI Sales
$253.6$7,036
OM = = = 7.1%.EBITSales
$503 $7,036
Net profit margin (PM):
Operating profit margin (OM):
(More…)

30
Sales − COGS Sales
Profit Margins (Continued)
GPM = =
GPM = = 17.6%. $1,236 $7,036
Gross profit margin (GPM):
$7,036 − $5,800 $7,036
31
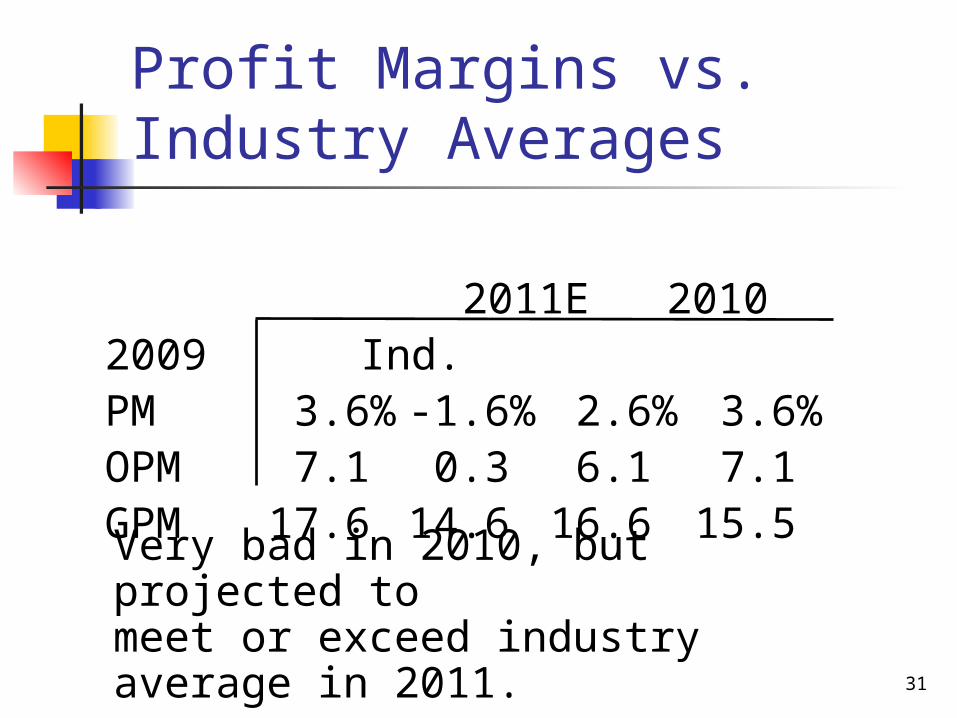
Very bad in 2010, but projected to meet or exceed industry average in 2011.
2011E 2010 2009 Ind.PM 3.6% -1.6% 2.6% 3.6%OPM 7.1 0.3 6.1 7.1GPM 17.6 14.6 16.6 15.5
Profit Margins vs. Industry Averages
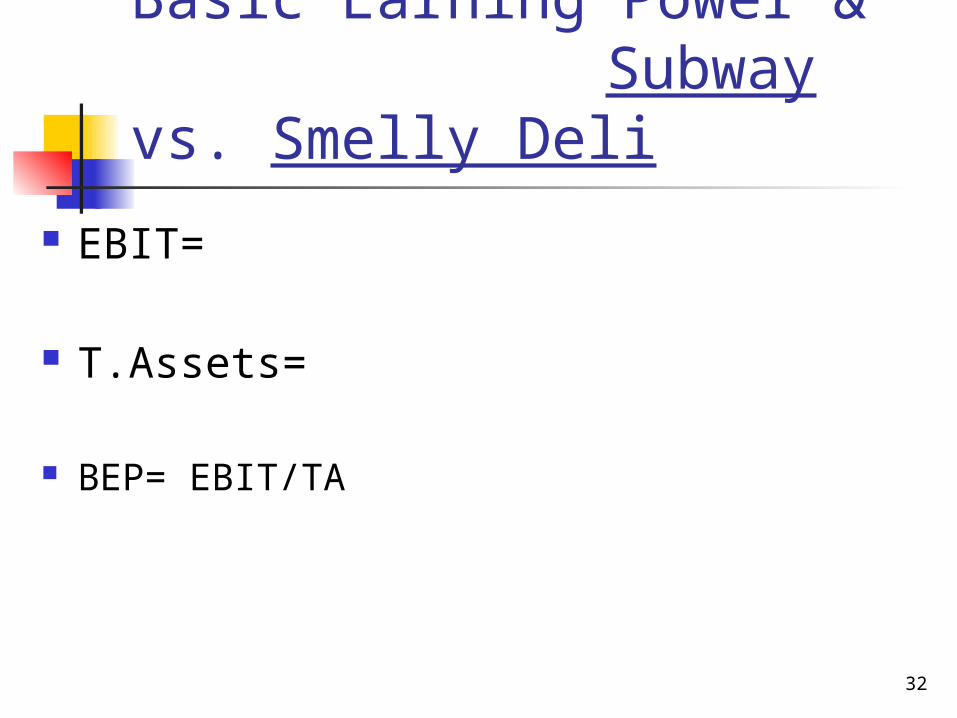
Basic Earning Power & Subway vs. Smelly Deli
EBIT=
T.Assets=
BEP= EBIT/TA
32
33
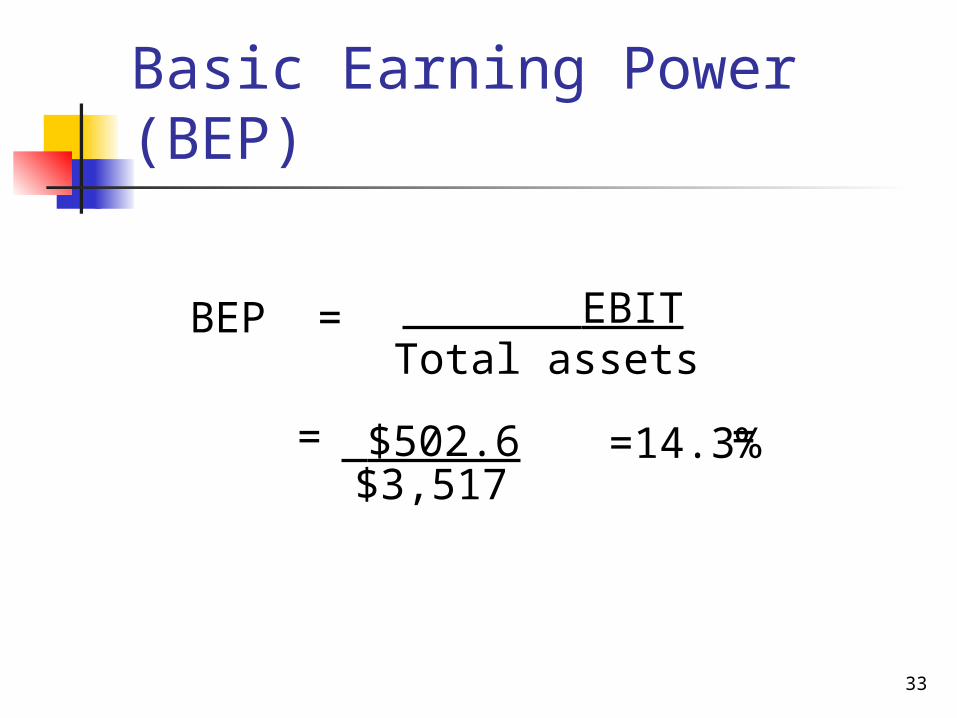
BEP =
= =
EBITTotal assets
$502.6 $3,517
Basic Earning Power (BEP)
=14.3%
34
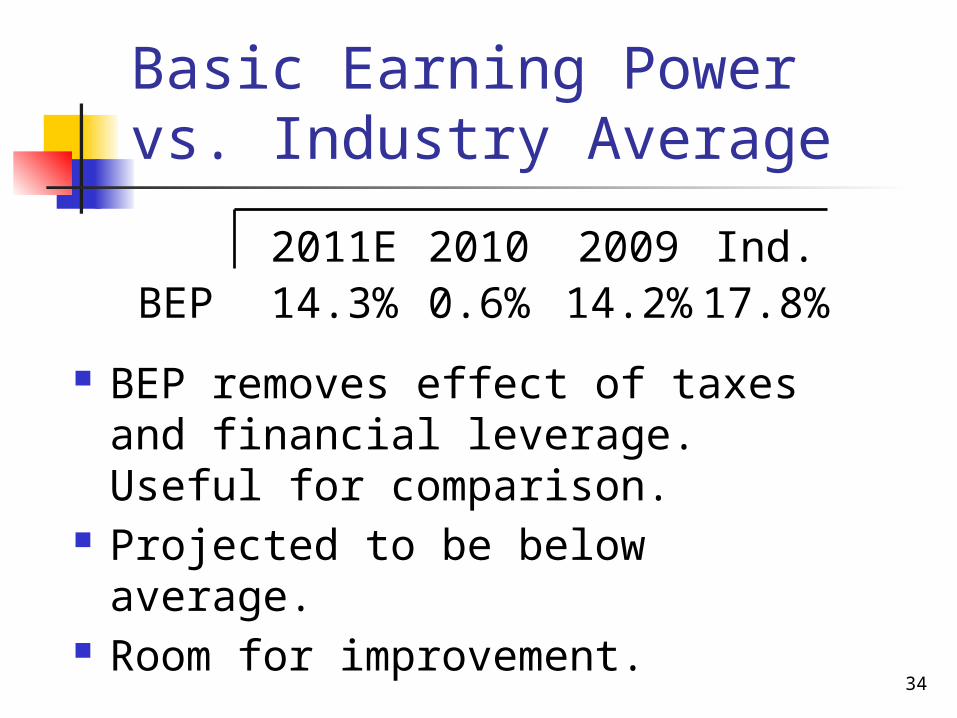
Basic Earning Power vs. Industry Average
BEP removes effect of taxes and financial leverage. Useful for comparison.
Projected to be below average. Room for improvement.
2011E 2010 2009 Ind.BEP 14.3% 0.6% 14.2%17.8%
35
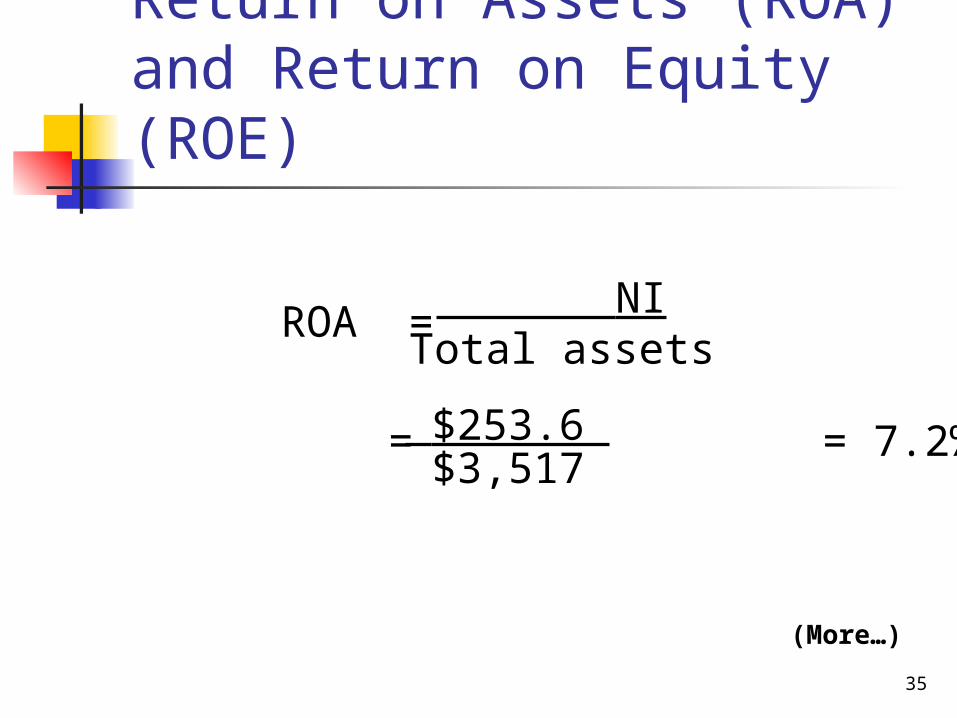
ROA =
= = 7.2%.
NITotal assets
$253.6 $3,517
(More…)
Return on Assets (ROA)and Return on Equity (ROE)

36
ROE =
= = 12.8%.
NICommon Equity
$253.6 $1,977
(More…)
Return on Assets (ROA)and Return on Equity (ROE)

37
2011E 2010 2009 Ind.ROA 7.2% -3.3% 6.0% 9.0%ROE 12.8% -17.1%13.3% 18.0%
Both below average but improving.
ROA and ROE vs. Industry Averages
Effects of Debt on ROA & ROE
No Debt (unlevered) vs. Debt (levered)
38
39
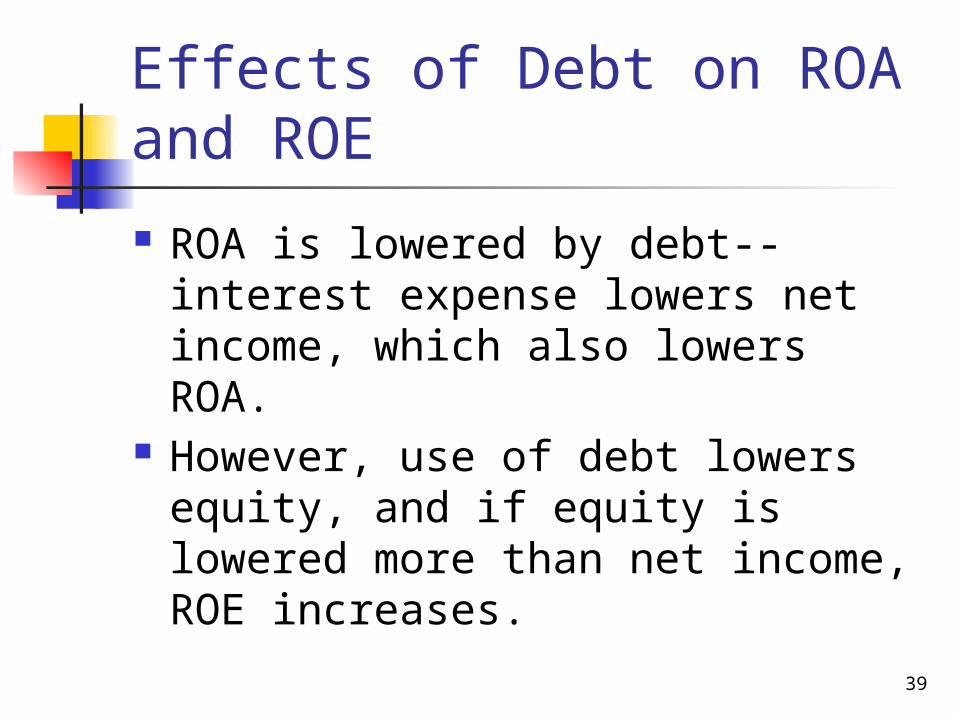
Effects of Debt on ROA and ROE
ROA is lowered by debt--interest expense lowers net income, which also lowers ROA.
However, use of debt lowers equity, and if equity is lowered more than net income, ROE increases.
40
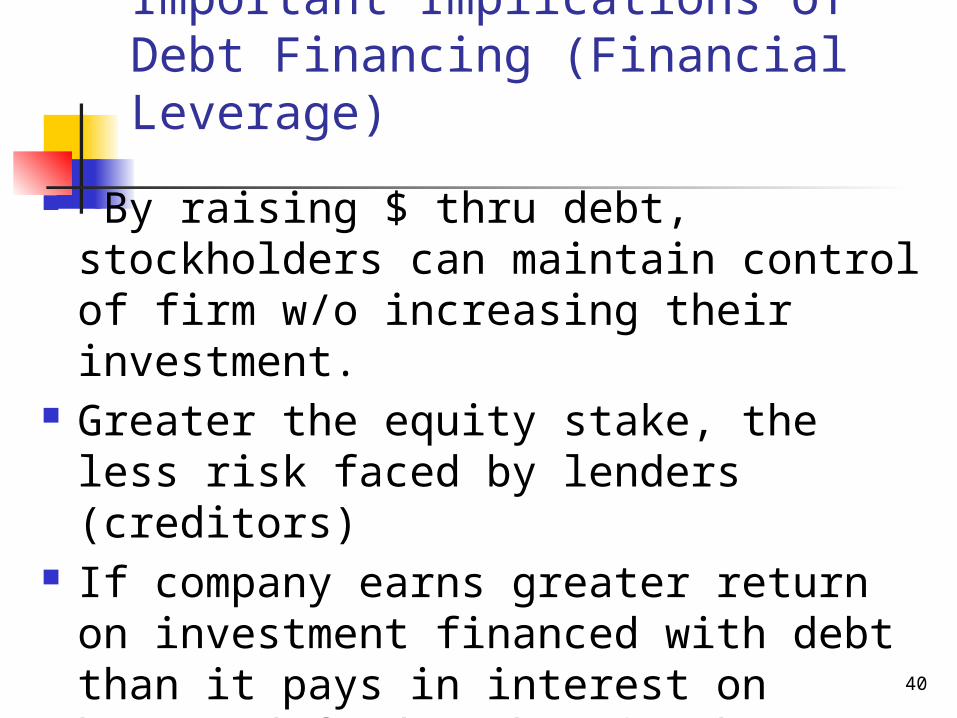
Important Implications of Debt Financing (Financial Leverage)
By raising $ thru debt, stockholders can maintain control of firm w/o increasing their investment.
Greater the equity stake, the less risk faced by lenders (creditors)
If company earns greater return on investment financed with debt than it pays in interest on borrowed funds, then it the return on owners equity is magnified, or leveraged.
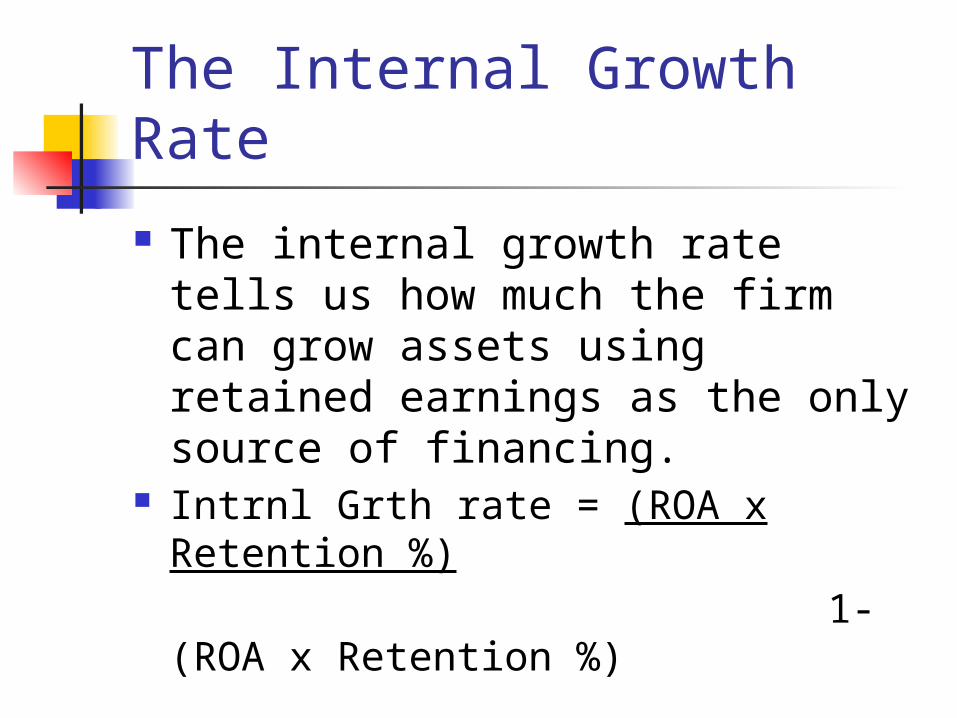
The Internal Growth Rate
The internal growth rate tells us how much the firm can grow assets using retained earnings as the only source of financing.
Intrnl Grth rate = (ROA x Retention %)
1- (ROA x Retention %)
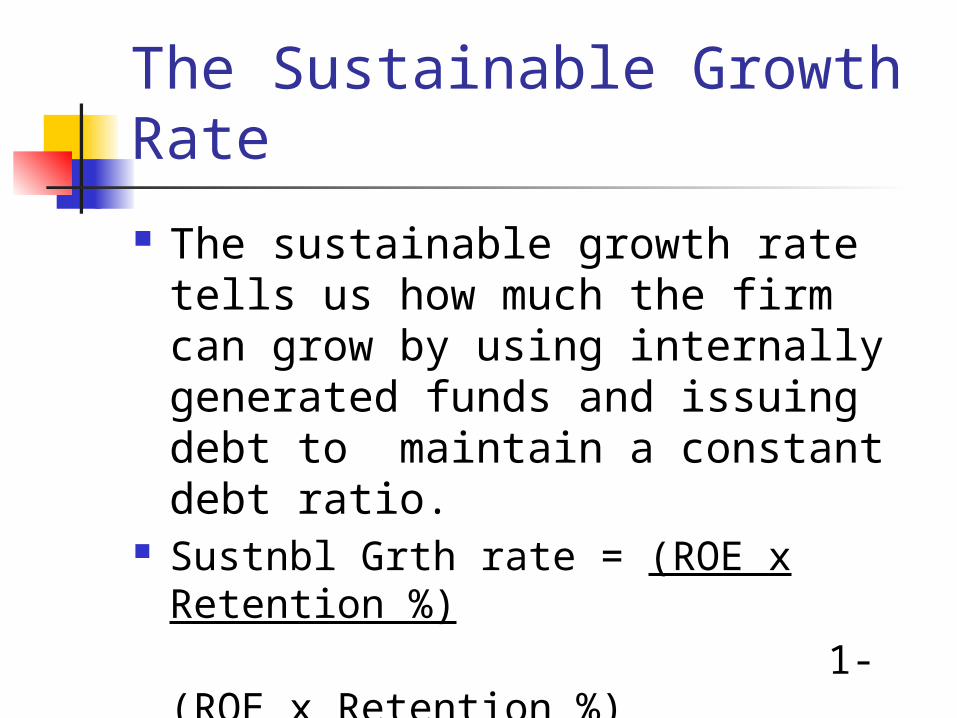
The Sustainable Growth Rate
The sustainable growth rate tells us how much the firm can grow by using internally generated funds and issuing debt to maintain a constant debt ratio.
Sustnbl Grth rate = (ROE x Retention %)
1- (ROE x Retention %)

43
Market Value Ratios
Market value ratios: gives mgmt indication of what investors think of co.’s past performance & future prospects
44
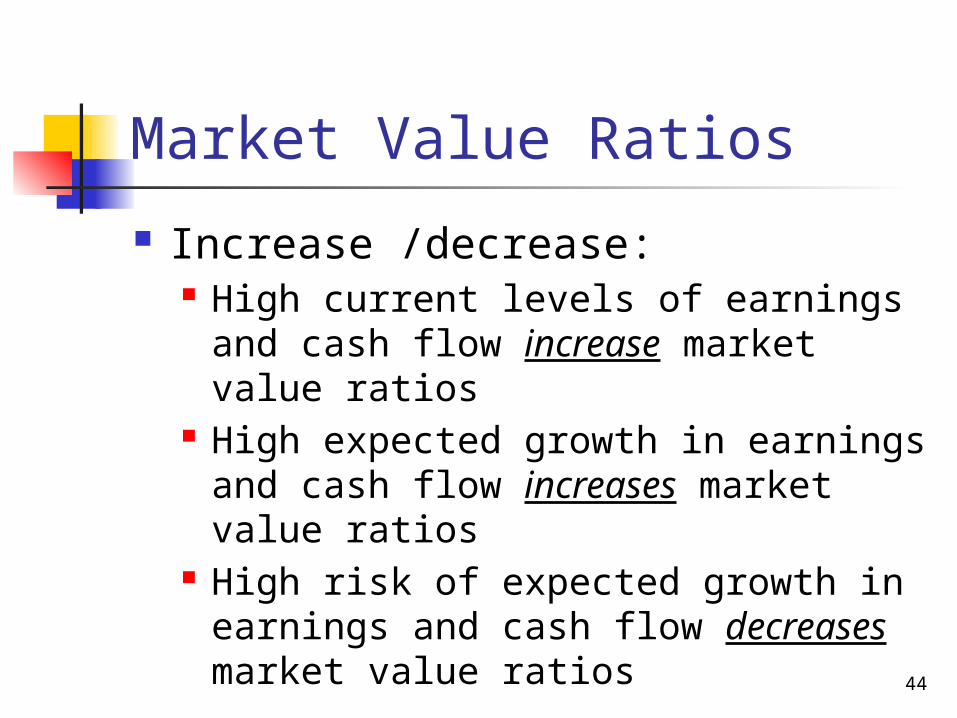
Market Value Ratios
Increase /decrease: High current levels of earnings and
cash flow increase market value ratios
High expected growth in earnings and cash flow increases market value ratios
High risk of expected growth in earnings and cash flow decreases market value ratios
45
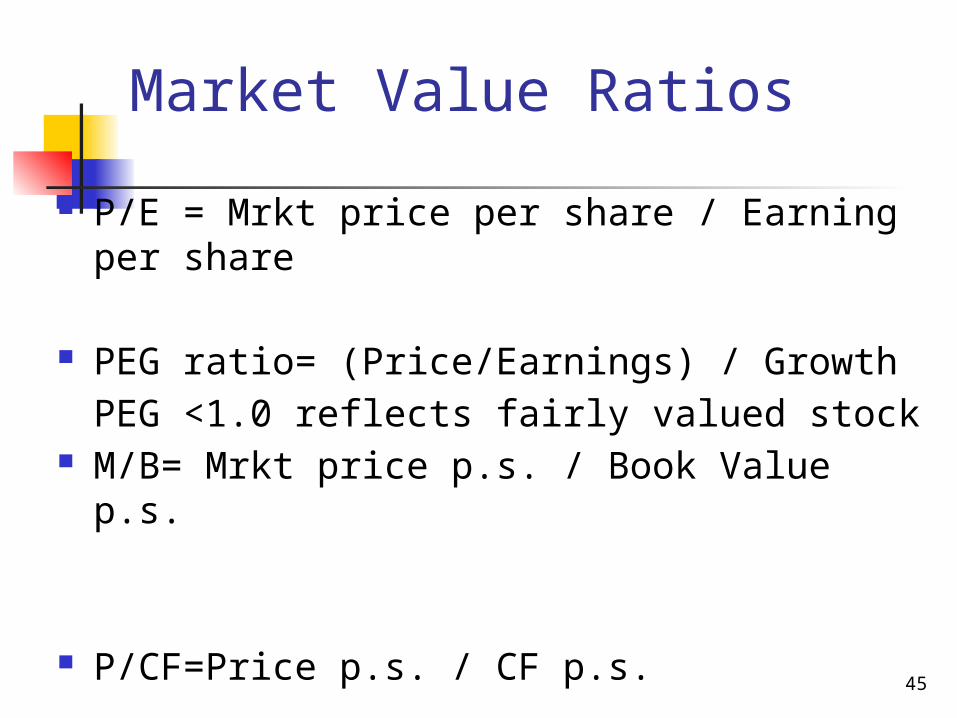
Market Value Ratios
P/E = Mrkt price per share / Earning per share
PEG ratio= (Price/Earnings) / GrowthPEG <1.0 reflects fairly valued stock
M/B= Mrkt price p.s. / Book Value p.s.
P/CF=Price p.s. / CF p.s.
46
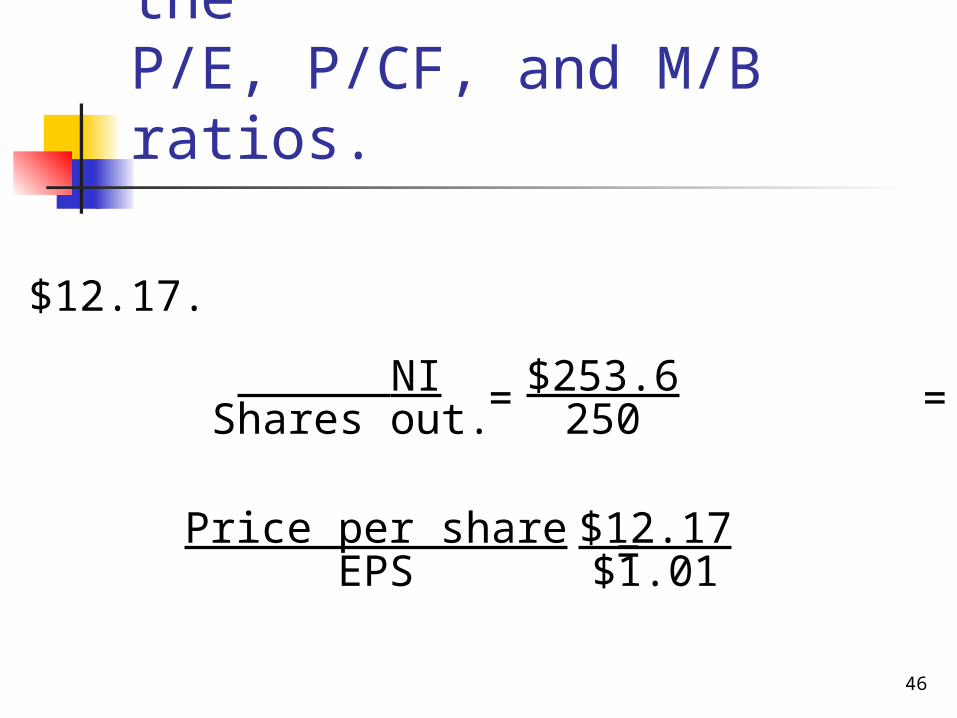
Price = $12.17.
EPS = = = $1.01.
P/E = = = 12.
NIShares out.
$253.6250
Price per shareEPS
$12.17$1.01
Calculate and appraise theP/E, P/CF, and M/B ratios.

47
NI + Depr. Shares out.
CF per share =
= = $1.49.$253.6 + $120.0250
Price per share Cash flow per share P/CF =
= = 8.2.$12.17$1.49
Market Based Ratios
48
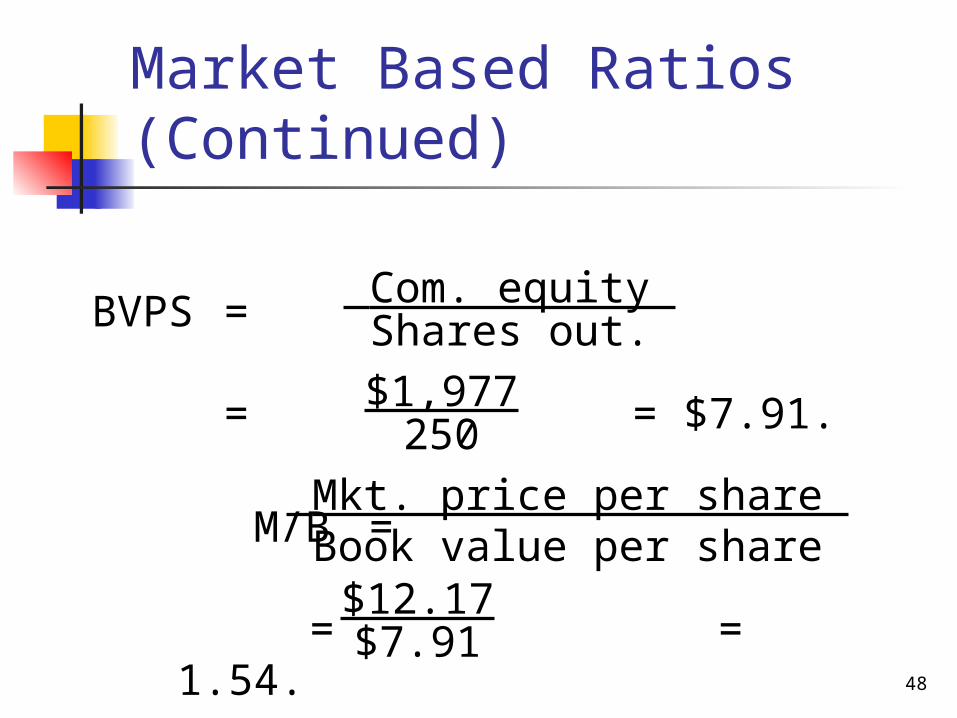
Com. equity Shares out.BVPS =
= = $7.91.$1,977250
Mkt. price per share Book value per share M/B =
= = 1.54.$12.17$7.91
Market Based Ratios (Continued)
49
Interpreting Market Based Ratios
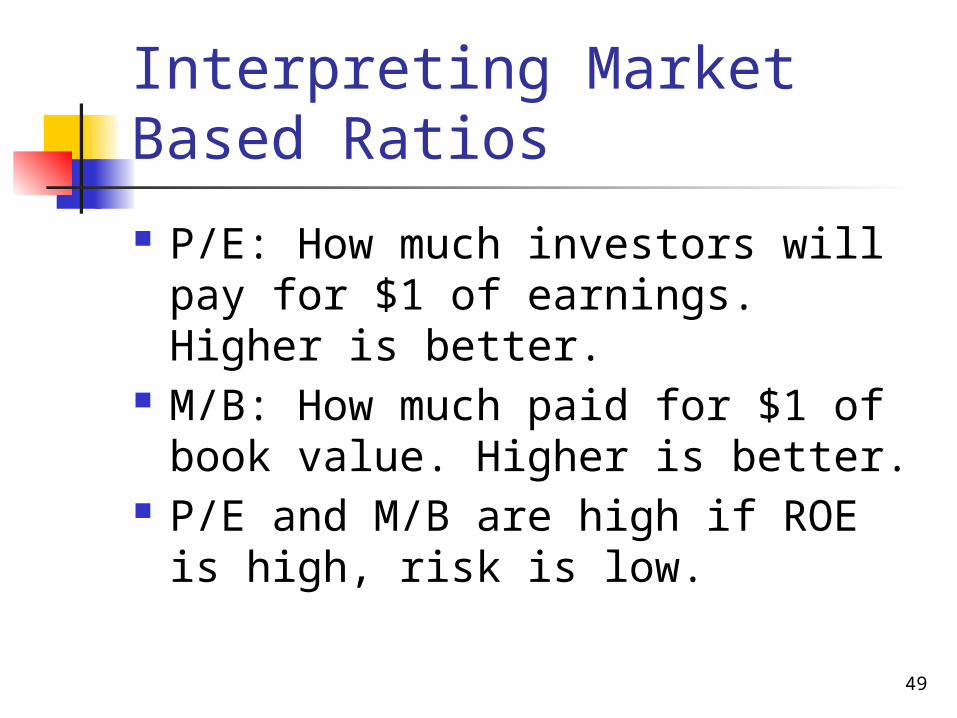
P/E: How much investors will pay for $1 of earnings. Higher is better.
M/B: How much paid for $1 of book value. Higher is better.
P/E and M/B are high if ROE is high, risk is low.
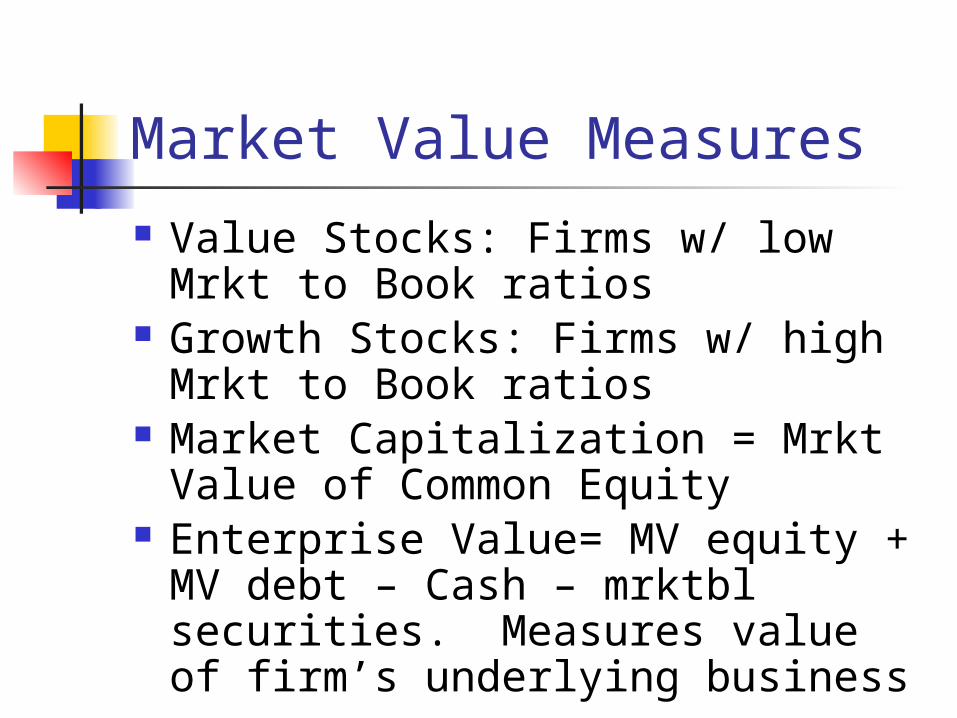
Market Value Measures Value Stocks: Firms w/ low Mrkt to
Book ratios Growth Stocks: Firms w/ high Mrkt
to Book ratios Market Capitalization = Mrkt Value
of Common Equity Enterprise Value= MV equity + MV
debt – Cash – mrktbl securities. Measures value of firm’s underlying business
51
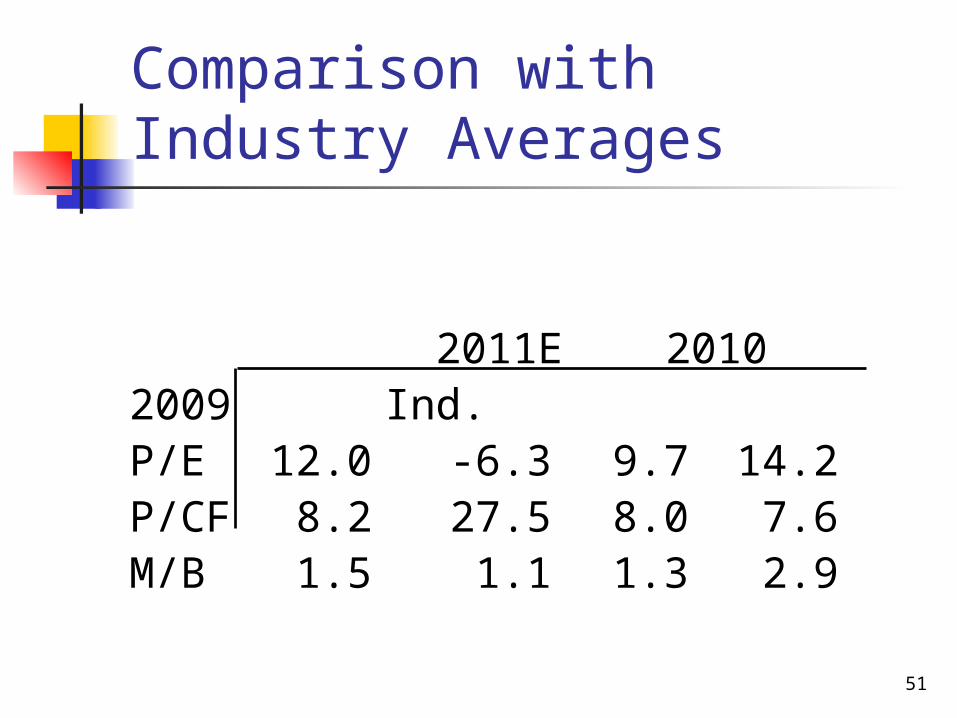
2011E 2010 2009 Ind.P/E 12.0 -6.3 9.7 14.2P/CF 8.2 27.5 8.0 7.6M/B 1.5 1.1 1.3 2.9
Comparison with Industry Averages
52
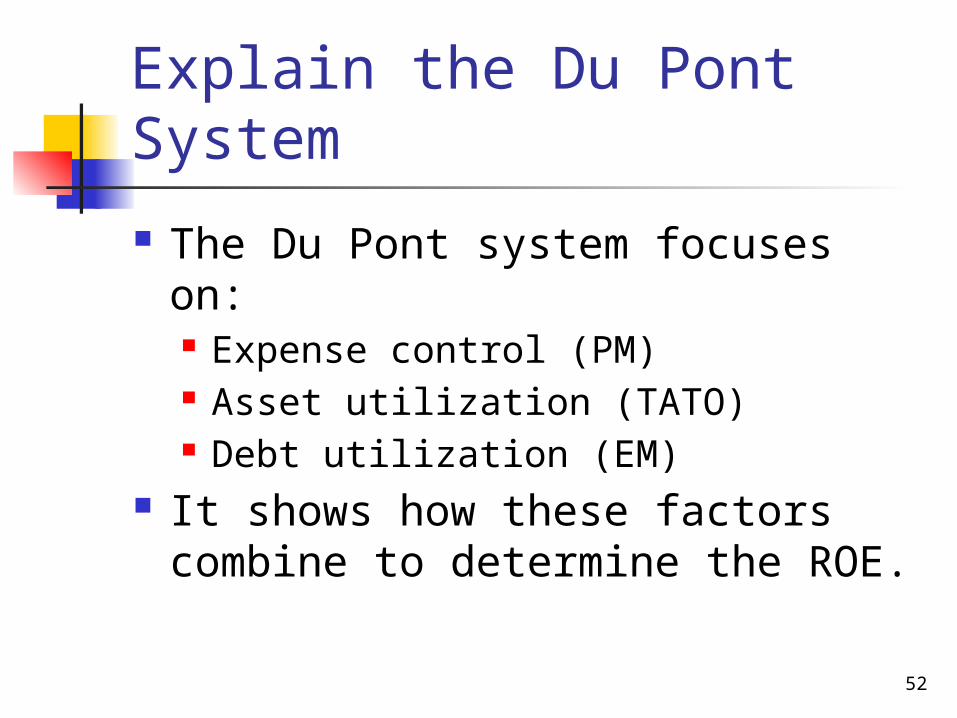
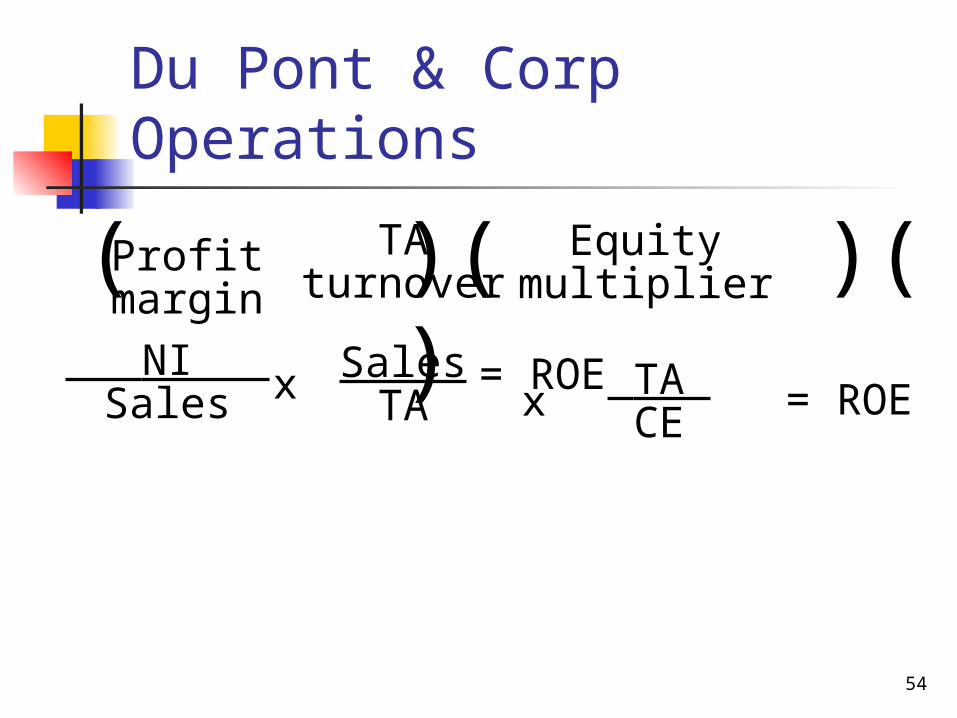
Explain the Du Pont System
The Du Pont system focuses on: Expense control (PM) Asset utilization (TATO) Debt utilization (EM)
It shows how these factors combine to determine the ROE.
53
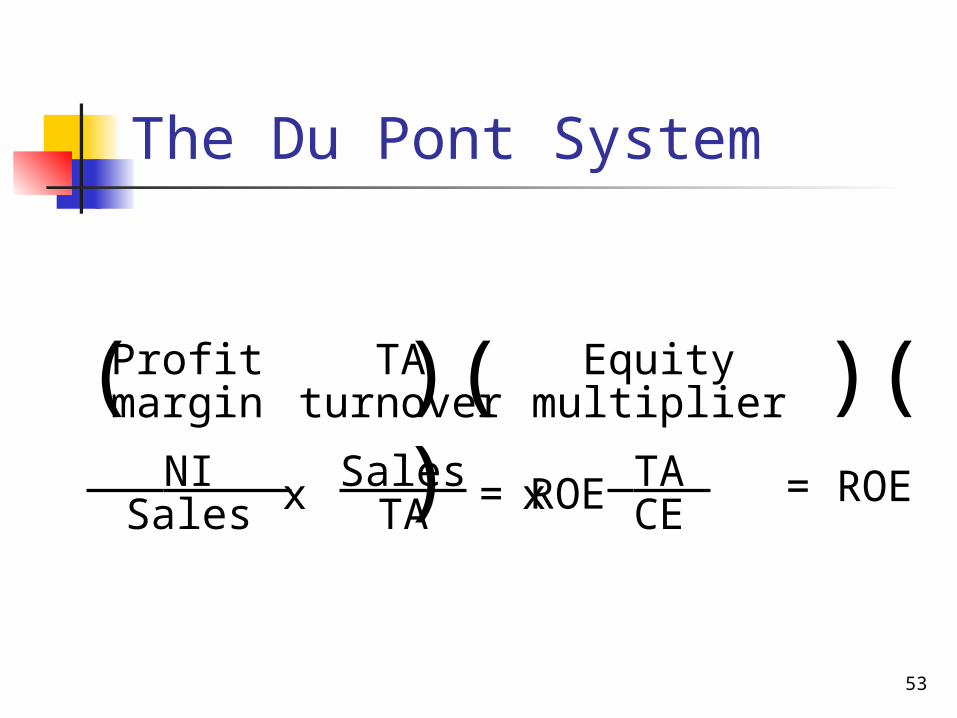
( )( )( ) = ROE
Profitmargin
TAturnover
Equitymultiplier
NI Sales
SalesTA
TA CEx x = ROE
The Du Pont System
54
( )( )( ) = ROE
Profitmargin
TAturnover
Equitymultiplier
NI Sales
SalesTA
TA CE
x x = ROE
Du Pont & Corp Operations
55
2008: 2.6% x 2.3 x 2.2 = 13.2%2009:-1.6% x 2.0 x 5.2 = -16.6%2010: 3.6% x 2.0 x 1.8 = 13.0%Ind.: 3.6% x 2.5 x 2.0 = 18.0%
NI Sales
SalesTA
TA CEx x = ROE
The Du Pont System

56
Common Size Balance Sheets:Divide all items by Total Assets
Assets 2009 2010 2011E Ind.
Cash 0.6% 0.3% 0.4% 0.3%
ST Inv. 3.3% 0.7% 2.0% 0.3%
AR 23.9% 21.9% 25.0% 22.4%
Invent. 48.7% 44.6% 48.8% 41.2%
Total CA
76.5% 67.4% 76.2% 64.1%
Net FA 23.5% 32.6% 23.8% 35.9%
TA 100.0%
100.0% 100.0% 100.0%
57
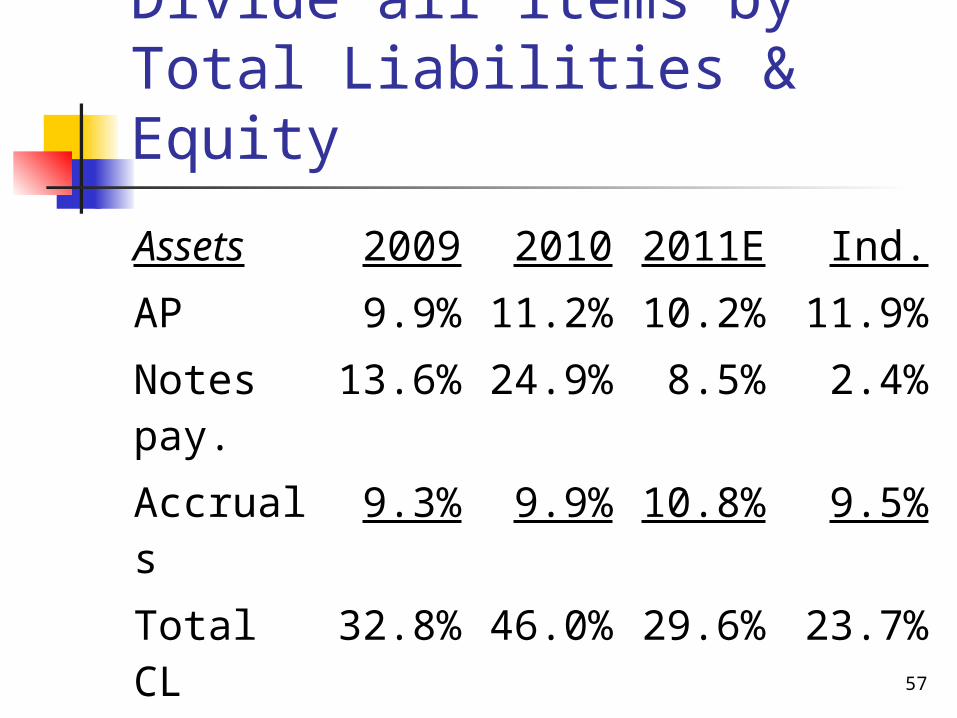
Divide all items by Total Liabilities & Equity
Assets 2009 2010 2011E Ind.AP 9.9% 11.2% 10.2% 11.9%Notes pay.
13.6% 24.9% 8.5% 2.4%
Accruals 9.3% 9.9% 10.8% 9.5%Total CL 32.8% 46.0% 29.6% 23.7%LT Debt 22.0% 34.6% 14.2% 26.3%Total eq. 45.2% 19.3% 56.2% 50.0%Total L&E
100.0%
100.0%
100.0%
100.0%

58
Analysis of Common Size Balance Sheets Computron has higher proportion
of inventory and current assets than Industry.
Computron now has more equity (which means LESS debt) than Industry.
Computron has more short-term debt than industry, but less long-term debt than industry.
59
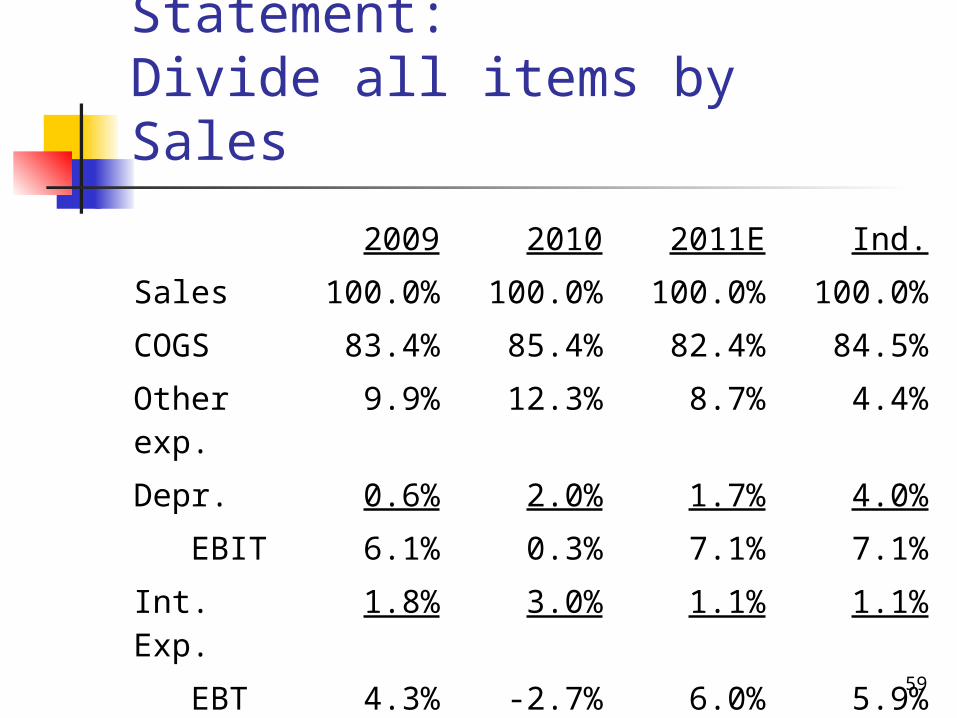
Common Size Income Statement:Divide all items by Sales
2009 2010 2011E Ind.
Sales 100.0% 100.0% 100.0% 100.0%
COGS 83.4% 85.4% 82.4% 84.5%
Other exp.
9.9% 12.3% 8.7% 4.4%
Depr. 0.6% 2.0% 1.7% 4.0%
EBIT 6.1% 0.3% 7.1% 7.1%
Int. Exp. 1.8% 3.0% 1.1% 1.1%
EBT 4.3% -2.7% 6.0% 5.9%
Taxes 1.7% -1.1% 2.4% 2.4%
NI 2.6% -1.6% 3.6% 3.6%

60
Analysis of Common Size Income Statements
Computron has lower COGS (86.7) than industry (84.5), but higher other expenses. Result is that Computron has similar EBIT (7.1) as industry.

61
Percentage Change Analysis: % Change from First Year (2009)
Income St. 2009 2010 2011E
Sales 0.0% 70.0% 105.0%
COGS 0.0% 73.9% 102.5%
Other exp. 0.0% 111.8% 80.3%
Depr. 0.0% 518.8% 534.9%
EBIT 0.0% -91.7% 140.4%
Int. Exp. 0.0% 181.6% 28.0%
EBT 0.0% -208.2% 188.3%
Taxes 0.0% -208.2% 188.3%
NI 0.0% -208.2% 188.3%
62
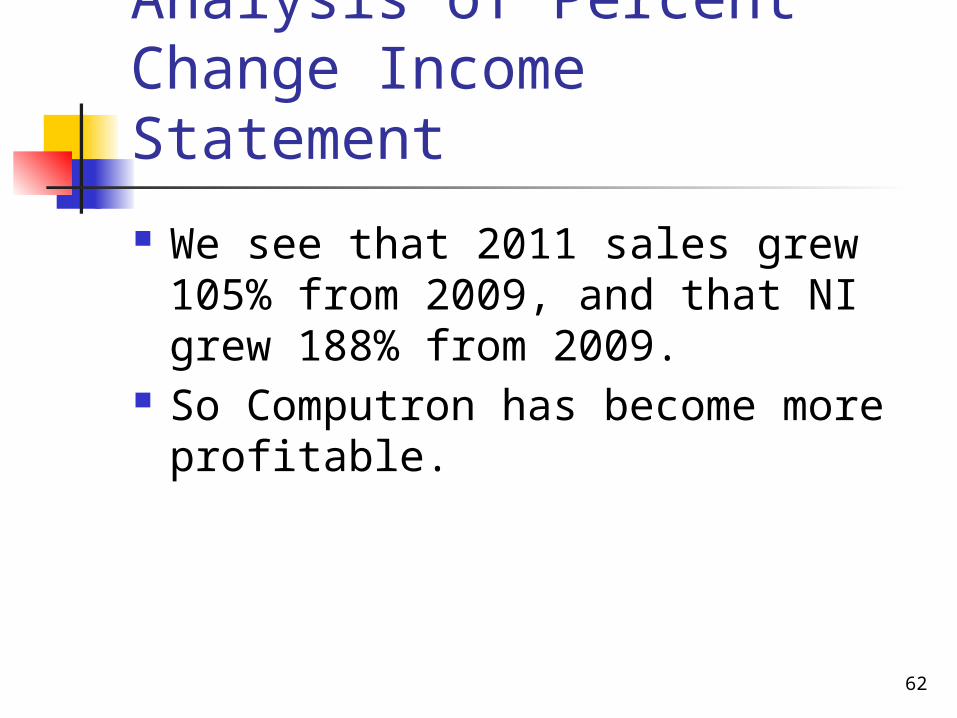
Analysis of Percent Change Income Statement
We see that 2011 sales grew 105% from 2009, and that NI grew 188% from 2009.
So Computron has become more profitable.
63
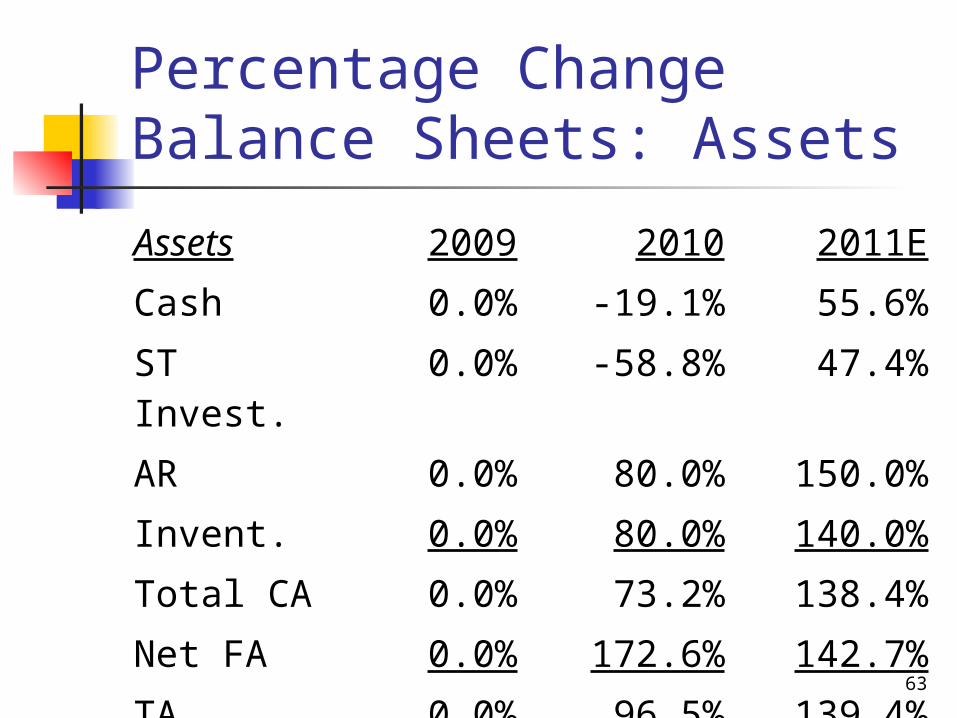
Percentage Change Balance Sheets: Assets
Assets 2009 2010 2011E
Cash 0.0% -19.1% 55.6%
ST Invest. 0.0% -58.8% 47.4%
AR 0.0% 80.0% 150.0%
Invent. 0.0% 80.0% 140.0%
Total CA 0.0% 73.2% 138.4%
Net FA 0.0% 172.6% 142.7%
TA 0.0% 96.5% 139.4%

64
Percentage Change Balance Sheets: Liabilities & Equity
Liab. & Eq.
2009 2010 2011E
AP 0.0% 122.5% 147.1%
Notes pay.
0.0% 260.0% 50.0%
Accruals 0.0% 109.5% 179.4%
Total CL 0.0% 175.9% 115.9%
LT Debt 0.0% 209.2% 54.6%
Total eq. 0.0% -16.0% 197.9%
Total L&E 0.0% 96.5% 139.4%
65
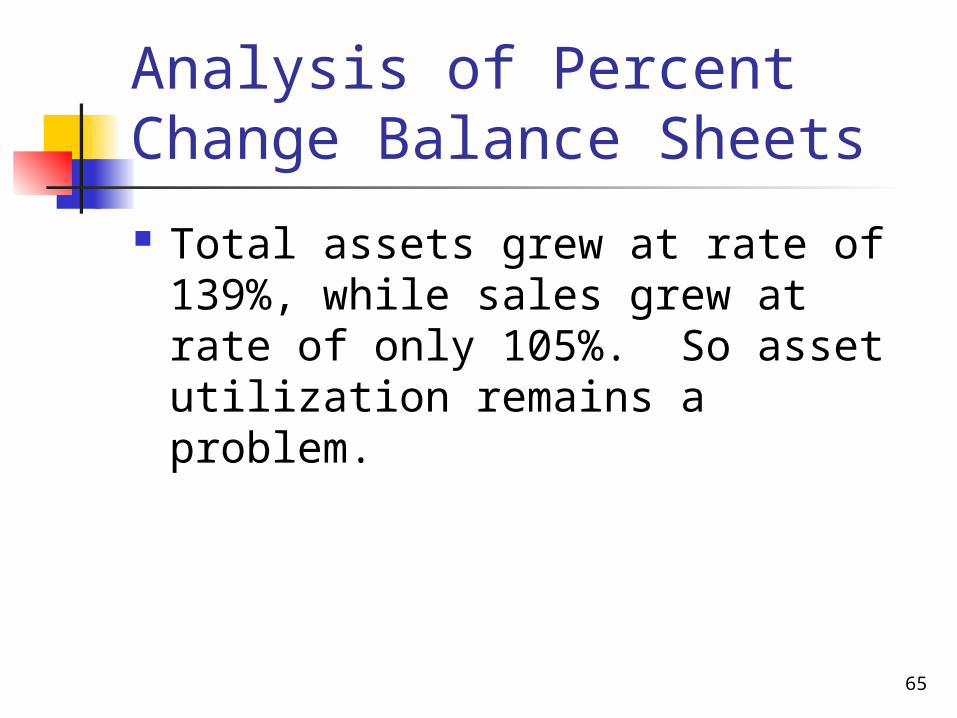
Analysis of Percent Change Balance Sheets
Total assets grew at rate of 139%, while sales grew at rate of only 105%. So asset utilization remains a problem.
66
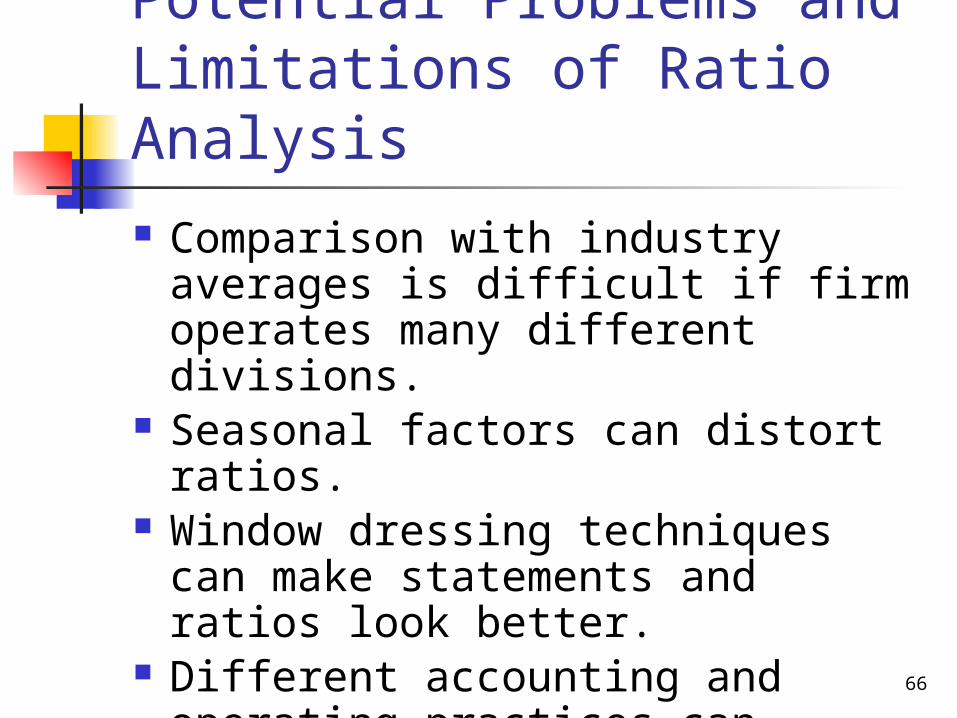
Potential Problems and Limitations of Ratio Analysis Comparison with industry averages
is difficult if firm operates many different divisions.
Seasonal factors can distort ratios. Window dressing techniques can
make statements and ratios look better.
Different accounting and operating practices can distort comparisons.

67
Qualitative Factors There is greater risk if:
revenues tied to a single customer revenues tied to a single product reliance on a single supplier? High percentage of business is generated
overseas? What is competitive situation? What products are in pipeline? What are legal and regulatory issues?