1 Chapter 2.3 GRAPHICAL ANALYSIS OF MOTION. Describe the following motion.
21
1 Chapter 2.3 GRAPHICAL ANALYSIS OF MOTION
-
Upload
alyson-mccoy -
Category
Documents
-
view
217 -
download
3
Transcript of 1 Chapter 2.3 GRAPHICAL ANALYSIS OF MOTION. Describe the following motion.
1
Chapter 2.3
GRAPHICAL ANALYSIS OF MOTION

• Describe the following motion

3
In Kinematic, when you work on a graph analysis problem you must translate:
-from the graph to an actual motion and -from an actual motion to its representation on a graph.

4
Objective
• Solve “slope of a curve” with unit a graph. • Identify direction of motion from a graph• Transfer a position vs. time graph to
velocity vs. time graph.• Solve “area under a curve” with right unit • Solve displacement and distance from
speed vs. time graph.
4

5
“slope of a curve” Students don’t recognize that a slope has units or how to determine those units.
Example: a line drawn at 45° always has a slope of 1 (no units),
Position vs. time graph, slope is a velocity and unit is [m/s]

6
When the velocity is constant, the average velocity is equal to the instantaneous velocity at any time.

7
xa.
b.
t
x
t
Object starts at the origin and moves in the positive direction with constant velocity.
Object starts to the right of the origin and moves in the negative direction with constant velocity ending at the origin.

A qualitative description of the motion depicted in the following v-versus-t graphs:
va.
b.v
t
t
Object moving to the right at a fast constant speed.
Object moving to the left at a slow constant speed.

9
xc.
d.
t
x
t
Object starts to the right of the origin and moves in the positive direction with constant velocity.
Object starts to the left of the origin and moves in the positive direction with constant velocity ending at the origin.

10
xe.
f.
t
x
t
Object starts to the left of the origin and moves in the negative direction with constant velocity.
Object starts to the right of the origin and moves in the negative direction with constant velocity.

v
t
Object starts at R of origin.Moves R at constant v, stands still then moves L at faster constant v.

12
x
t
Object moves L at constant v, thenmoves R at constant v but slower, then stands still.

13
Area under a curve
• Students don’t recognize that an “area under the curve” has units or how the units of an “area” can be something other than area units.
The area under the v-versus-t curve is displacement. But distance is a length?
How can a length equal an area?

14
The students should be able to calculate the area under the v-t curve and understand that the value obtained is the displacement

15
v
t
Object starts at R of origin.Moves L at constant v, stands still then moves L again at constant v but faster.

16
x
t
v
Object is at rest.Moves R at constant v, then moves L at constant v but slower.

Practice: find displacement
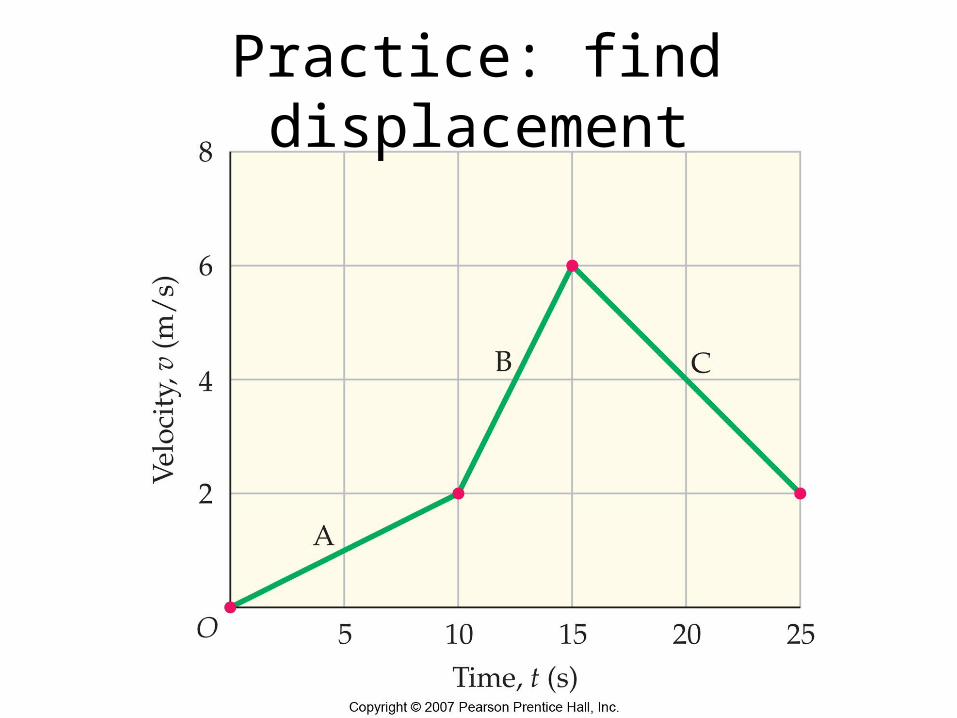
Practice: find displacement

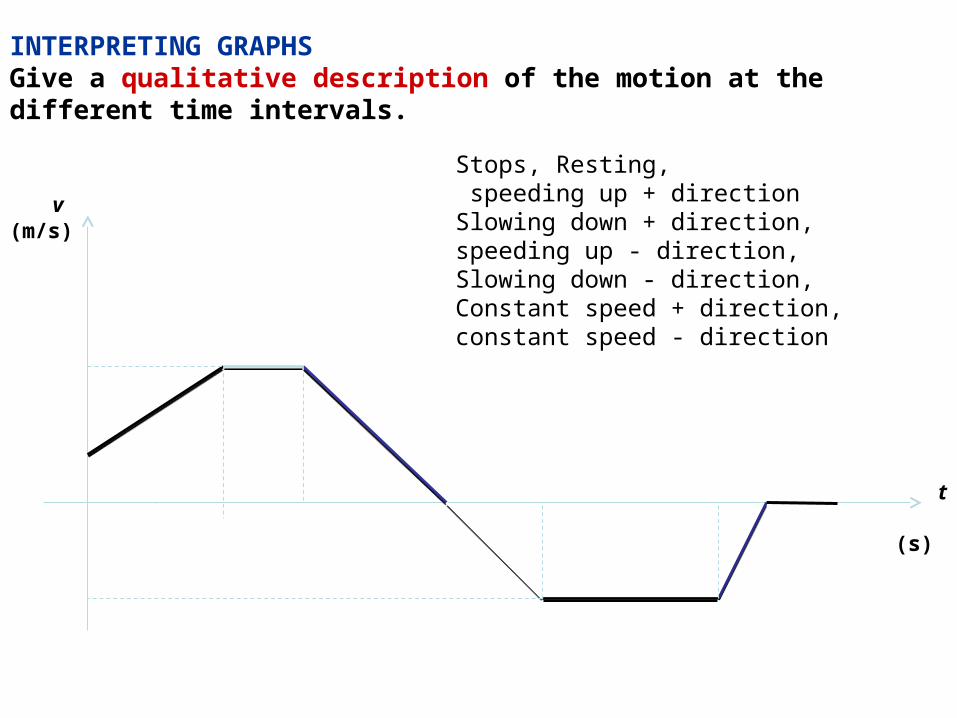
INTERPRETING GRAPHS
Give a qualitative description of the motion at the different time intervals.
v (m/s)
t (s)
INTERPRETING GRAPHSGive a qualitative description of the motion at the different time intervals.
v (m/s)
t (s)
Stops, Resting, speeding up + directionSlowing down + direction, speeding up - direction, Slowing down - direction, Constant speed + direction, constant speed - direction

Motion diagram and Position vs, Time graph
• Look at the following motion diagram• Transfer this motion into position vs. time
graph. • What is mathematical equation of this graph?