1 Capital Investment Decision. 2 Revision Purpose Methods.
45
1 Capital Investment Decision
-
Upload
jaden-shelton -
Category
Documents
-
view
234 -
download
0
Transcript of 1 Capital Investment Decision. 2 Revision Purpose Methods.

1
Capital Investment Decision

2
Capital Investment Decision
Revision
• Purpose
• Methods

3
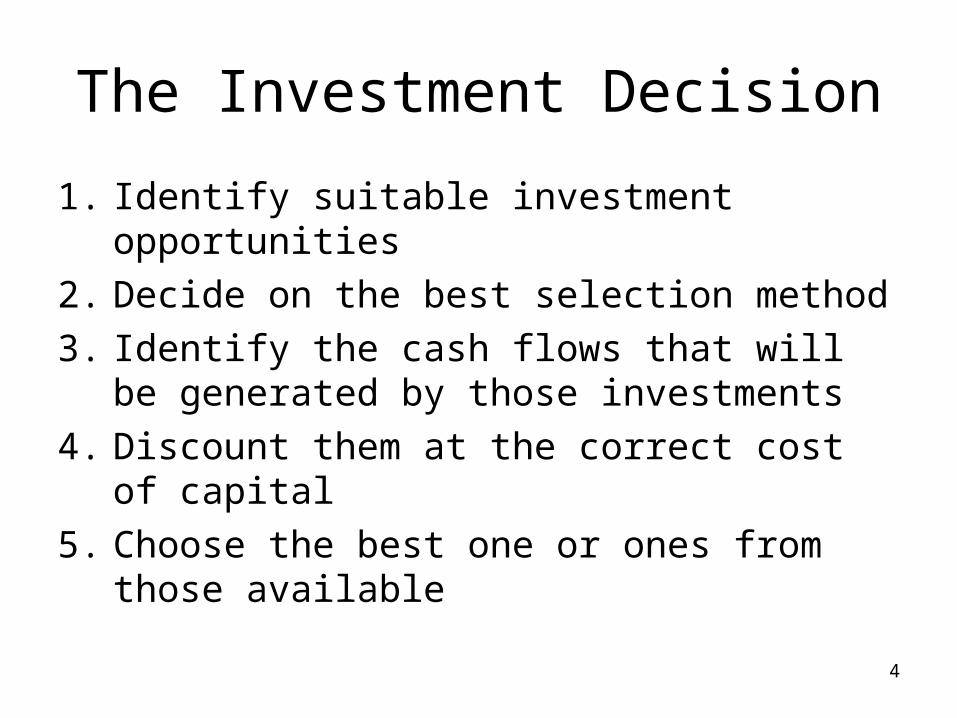
The Investment Decision
• The objective of the corporation is to Maximise Shareholders Wealth
• To do this we need to invest in those projects that will give the correct rate of return for the risk involved
• To do this we need to be able to
4
The Investment Decision
1. Identify suitable investment opportunities
2. Decide on the best selection method
3. Identify the cash flows that will be generated by those investments
4. Discount them at the correct cost of capital
5. Choose the best one or ones from those available

5
Capital Investment Decision
The ideal selection method will• Select the project that maximises
shareholders wealth• Consider all cash flows• Discount the cash flows at the appropriate
market determined opportunity cost of capital
• Will allow managers to consider each project independently from all others

6
Capital Investment Decision
Methods for evaluating projects• Payback• ARR, Accounting Rate of Return• IRR. Internal rate of return is the discount rate
that will give a Net Present Value of 0.• NPV is the Net Present Value of a stream of
cash flows discounted at the correct cost of capital for the degree of risk inherent in realising those cash flows
• NPV is best but what do companies use and why?

7
The graph shows the NPV as a function of the discount rate. The NPV is positive only for discount rates that are less than 14%, the internal rate of return (IRR). Given the cost of
capital of 10%, the project has a positive NPV of $100 million.
Capital Investment Decision
Figure 6.1 NPV of FFF’s New Project

8
Capital Investment Decision
• We know that the NPV is the best method because;
• The reinvestment rate assumption
• Value additivity
• Differences in scale
• Multiple IRRs
9ACFL1 9
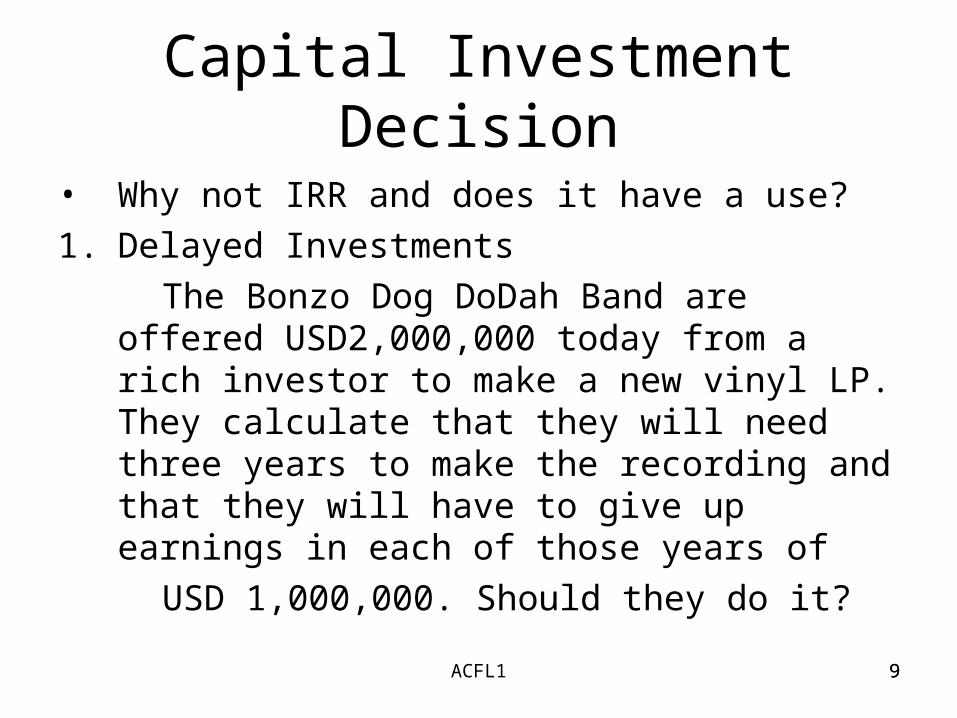
Capital Investment Decision
• Why not IRR and does it have a use?
1. Delayed Investments
The Bonzo Dog DoDah Band are offered USD2,000,000 today from a rich investor to make a new vinyl LP. They calculate that they will need three years to make the recording and that they will have to give up earnings in each of those years of
USD 1,000,000. Should they do it?

10ACFL1 10
Capital Investment Decision
• 1st question. What is the opportunity cost of capital? Say 6%
• 2nd question. What is the IRR?
With a wild stabbing guess say 23.38% +2,000,000 – 1,000,000 – 1,000,000 – 1,000,000
1.2338 (1.2338)2 (1.2338)3
- 1,999,855 = -810,504 - 656,917 - 532,434
That’s close enough

11ACFL1 11
Capital Investment Decision
• But using 6% as the cost of capital + 2,000,000 – 1,000,000 – 1,000,000 -1,000,000
(1.06) (1.06)2 (1.06)3
-2,673,022 = -943,396 - 889,996 - 839,630
So what should they do?
Can we explain what is going on here?

12
Capital Investment Decision
• Value Additivity
Try working out the NPV for the following - 1,000,000 + 350,000 +650,000 +650,000 +650,000
- 1,000,000 + 650,000 +650,000 +650,000 + 350,000
At 10%
and now combine them. What is the combined NPV?
Answer = 787,686 and 855,509 = 1,643,195
As combined flows = 1,643,193
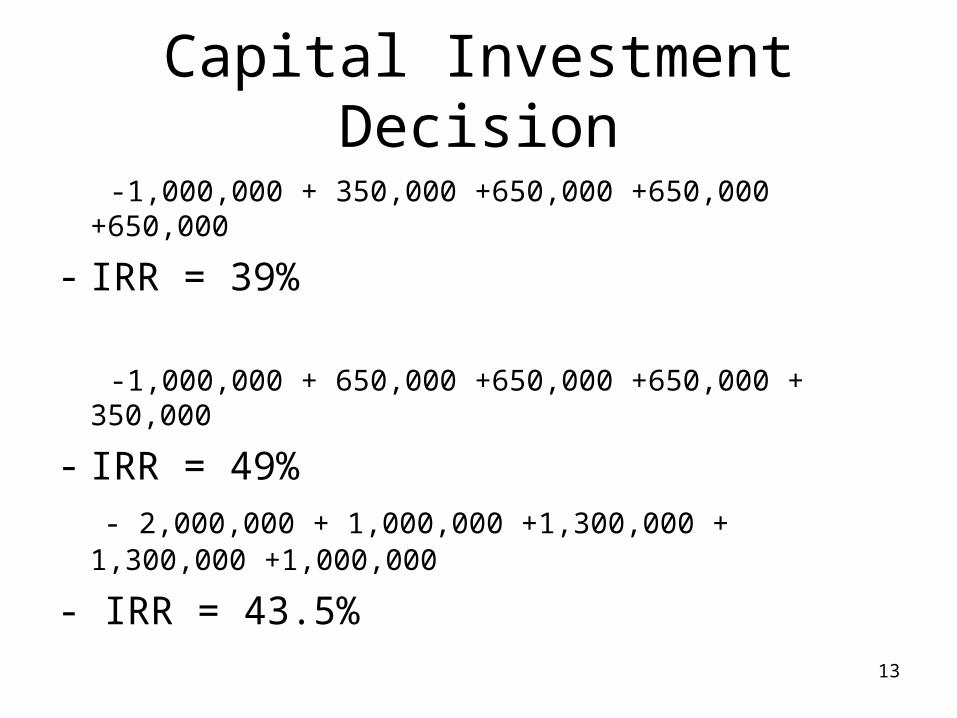
13
Capital Investment Decision
-1,000,000 + 350,000 +650,000 +650,000 +650,000
- IRR = 39%
-1,000,000 + 650,000 +650,000 +650,000 + 350,000
- IRR = 49% - 2,000,000 + 1,000,000 +1,300,000 + 1,300,000
+1,000,000
- IRR = 43.5%

14
Capital Investment Decision
• Issues of scale• What would you prefer A return of 50 % or one of 20% ? an NPV of 50 or an NPV of 500?
Depends for the IRR but you would prefer the higher NPV

15ACFL1 15
Advanced Corporate Finance
• Project A with IRR of 12%
-1201 + 500 + 500 + 500
PVF 1.1200 1.2544 1.4049
PV +1201 446 399 356
Double the scale IRR still 12%
-2402 +1000 +1000 +1000
PV +2402 893 797 712

16
Capital Investment Decision Figure 6.4 B&DeM
In this case, there is more than one IRR, invalidating the IRR rule. If the opportunity cost of capital is either below 4.723% or above 19.619%, Star should make the investment.

17
Capital Investment Decision
• So, its NPV But……….• Some Reasons for usage of wrong techniques.• Managers prefer % figures => IRR, ARR• Managers don’t understand NPV/ Complicated
Calculations.• Payback simple to calculate.• Short-term compensation schemes => Payback (Levy
200 –203, Pike 1985 pg 49).• Behavioural Factors (see later section on Behavioural
Finance!!)• Increase in Usage of correct DCF techniques:• Computers.• Management Education.

18ACFL1 18
Capital Investment Decision
• How do we decide when resources are constrained? We need to maximise NPV which may mean not going for the project with the highest NPV, rather the combination of projects that gives the highest total NPV.
• Why would resources be constrained?
This could be due to Capital Rationing

19ACFL1 19
Capital Investment Decision
• 150million to invest• Three projects
Project NPV Investment PI*
A 100 125 .80
B 80 75 1.07
C 70 75 .93
*PI = Profitability Index = Value Created
Resource Consumed

20
Capital investment Decision
• What about other scarce resources?
• E.g. bright Bath Students
There are never enough
21
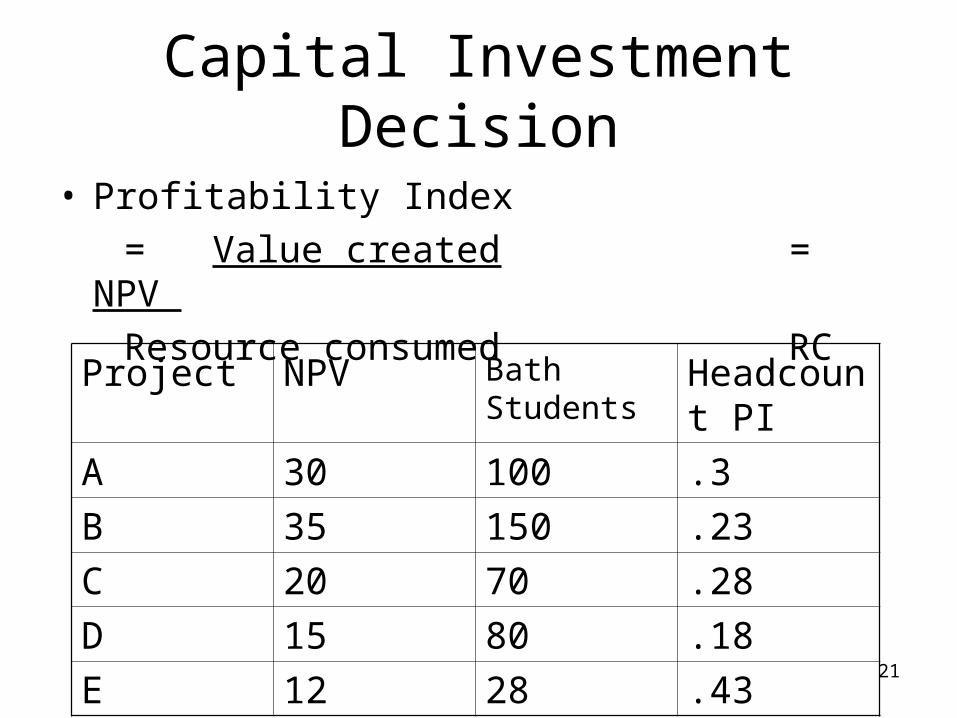
Capital Investment Decision
• Profitability Index
= Value created = NPV
Resource consumed RC
Project NPV Bath Students
Headcount PI
A 30 100 .3
B 35 150 .23
C 20 70 .28
D 15 80 .18
E 12 28 .43
22
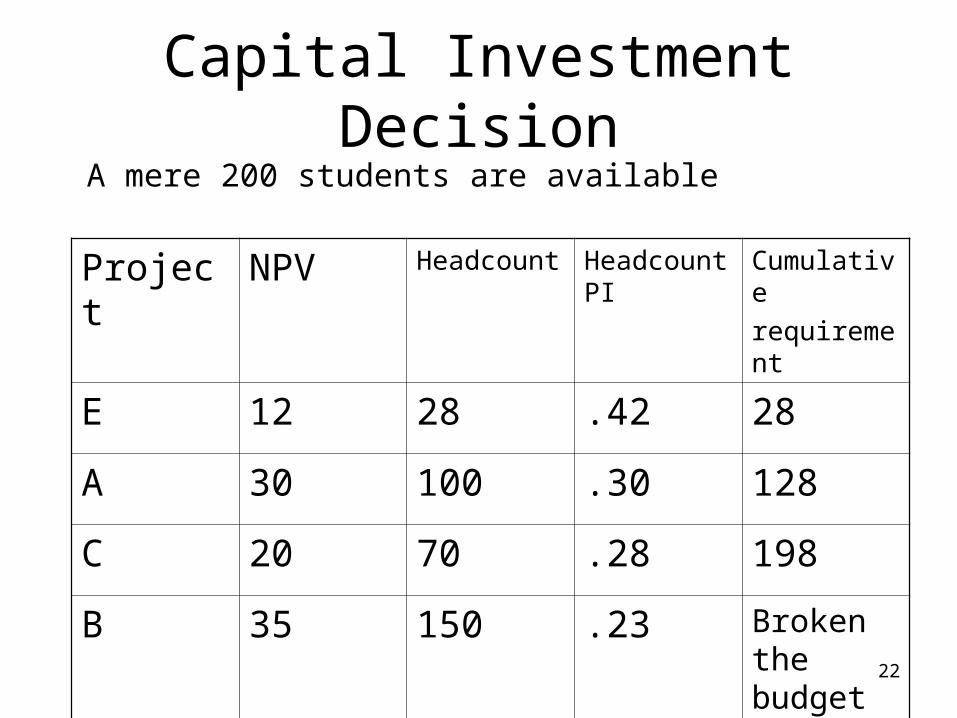
Capital Investment Decision
Project NPV Headcount Headcount PI
Cumulative
requirement
E 12 28 .42 28
A 30 100 .30 128
C 20 70 .28 198
B 35 150 .23 Broken the budget
D 15 80 .18
A mere 200 students are available

23
Capital Investment Decision
• Try this one
380 tonnes of scarce material
Project NPV Mats Usage Mats PI
A 50 180
B 20 70
C 45 120
D 15 75
E 35 100

24
Capital Investment Decision
• What do you notice?
• So?
Now Moving on
25
Capital Investment Decision
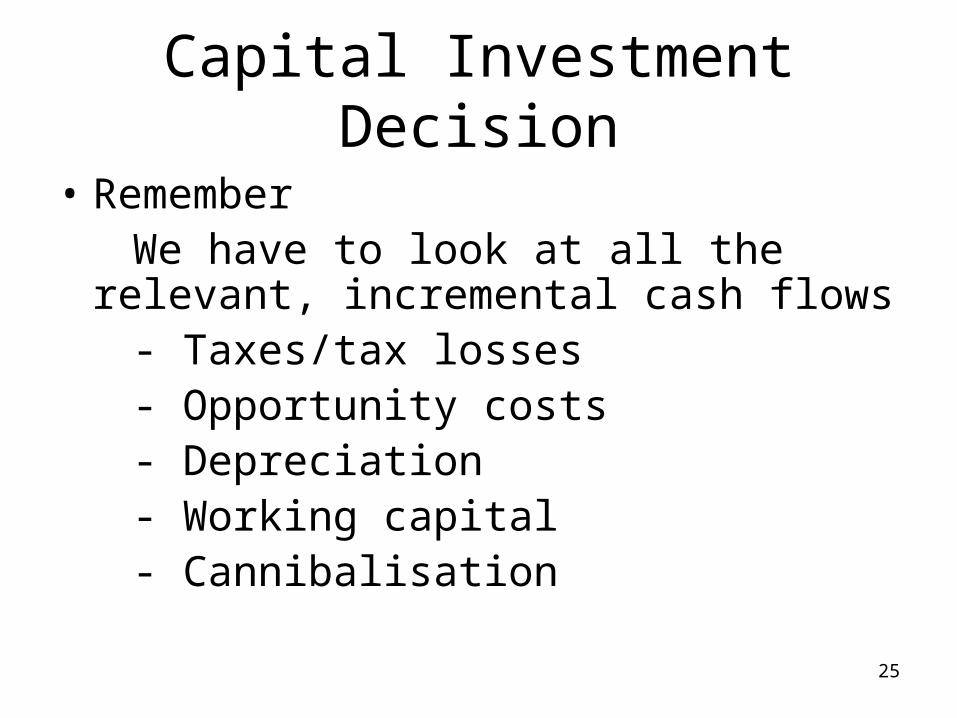
• Remember We have to look at all the relevant,
incremental cash flows - Taxes/tax losses - Opportunity costs - Depreciation - Working capital - Cannibalisation

26
Capital Investment Decision
Illustrations using examples from B&DeM• New project, units 100,000 pa at 260 per unit =
26 million• Cost of production is 110 per unit = 11M• Gross profit 15 million pa• Operating expenses = 2.8 million pa• 5 million to be spent on design and engineering• 10 million on software• 7.5 million equipment depreciated over 5 years
on straight line basis

27
Capital Investment DecisionTable 7.1 HomeNet’s Incremental Earnings Forecast
(Spreadsheet)

28
Capital Investment Decision
• Points to make so far
1 Tax losses
2 Depreciation
3 Interest cost
Now
Opportunity cost

29
Capital Investment Decision
• New lab will be housed in existing space. What should the cost be?
• Well what are the alternative uses?
• Suppose could rent for 200,000 pa for years 1 to 4 then this is a foregone income of 200,000 x (1-.4)

30
Capital Investment Decision
• Cannibalisation
25 % of the sales of the new product will come from existing sales of a similar product. How do we account for this?
Lost revenue at price of 100 per unit
100,000 x .25 x 100 = 2,500,000
But there will be lower cost of sales
100,000 x .25 x 60 (cost per unit) = 1.5 m

31
Capital Investment Decision
• Table 7.2 HomeNet’s Incremental Earnings Forecast Including Cannibalization and Lost Rent
32
Capital Investment Decision
• Need to work out the Free Cash Flow
i.e. the effect of the project on the company’s cash.
• So far looked at sales and costs just need to add a couple of things in.
1. Depreciation (which you are already familiar with
2. Net working capital

33
Capital investment Decision
Table 7.3 Calculation of HomeNet’s Free Cash Flow (Including Cannibalization and Lost Rent)

34
Capital Investment Decision
Table 7.5 Computing HomeNet’s NPV (Spreadsheet)

35
Capital Investment Decision
• Anything else?
• Timing of cash flows
• Liquidation/salvage value
• Terminal Value
- multiple
- constant growth

36
Capital Investment DecisionTerminal value
• Constant Growth 1) Year 5 free cash flow is 3,000,000. If cost of capital is 10% then PV at end year 5 of future
cash flows is 3,000,000 = 30,000,000 .10
2) Suppose expect to grow at 3% pa thereafterThen PV at end year five of future cash flows is 3,000,000 = 42,857,143 .10 - .03

37
Capital Investment Decision
• Break even analysis
Using the IRR to give a feel for the ‘margin of safety’ ref the cost of capital
• Sensitivity analysis
• Scenario analysis

38
Capital Investment DecisionSensitivity Analysis
Table 7.9 Best- and Worst-Case Parameter Assumptions for HomeNet

39
Capital Investment DecisionFigure 7.1 HomeNet’s NPV Under Best- and Worst-Case Parameter
Assumptions
Green bars show the change in NPV under the best-case assumption for each parameter; red bars show the change under the worst-case assumption. Also shown are the break-even levels for each parameter. Under the initial assumptions, HomeNet’s NPV is $5.0 million.

40
Capital Investment DecisionScenario Analysis
Table 7.10 Scenario Analysis of Alternative Pricing Strategies
41
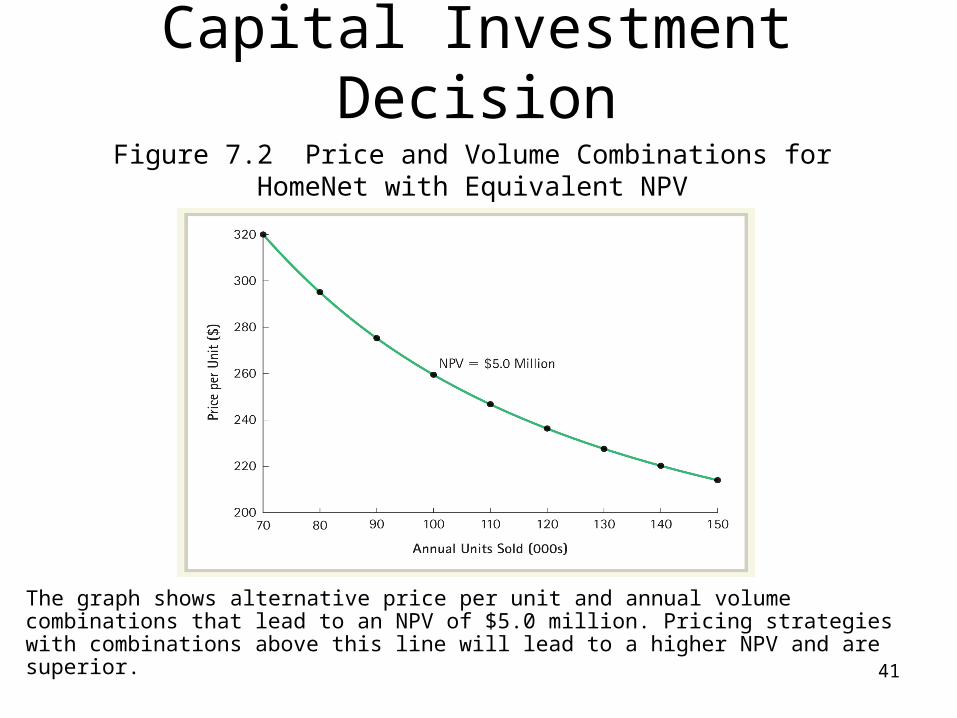
Figure 7.2 Price and Volume Combinations for HomeNet with Equivalent NPV
Capital Investment Decision
The graph shows alternative price per unit and annual volume combinations that lead to an NPV of $5.0 million. Pricing strategies with combinations above this line will lead to a higher NPV and are superior.

42
Capital Investment Decision
• Summary
• Investments should add to shareholder wealth
• NPV is the correct method
• Incremental free cash flows
• Forecasting cash flows

43ACFL1 43
Advanced Corporate Finance
• Before moving on to other aspects of using the NPV approach we should consider EVA or Economic Value Added.
‘The cash flows of a project less a capital charge that reflects the opportunity cost of the capital invested as well as any capital consumed’
How does it differ from NPV?

44ACFL1 44
Advanced Corporate Finance
• Basically NPV gives the return of a project over a period of time while EVA focuses more on the individual time segments within the overall period but will give the same result

45
Capital Investment Decision
Project NPV Mats PI(NPV per T)
Tonnes Used
Cumulative tonnes used
C 45 .375 120 120
E 35 .35 100 220
B 20 .286 70 290
A 50 .277 180 470
D 15 .200 75 -