1 Business Plan Financial Year 2013/14. 1. Shared Services Budget Agenda 2 1. Shared Services Total...
39
1 Business Plan Financial Year 2013/14
-
Upload
derek-fisher -
Category
Documents
-
view
214 -
download
1
Transcript of 1 Business Plan Financial Year 2013/14. 1. Shared Services Budget Agenda 2 1. Shared Services Total...

1
Business PlanFinancial Year 2013/14

1. Shared Services Budget Agenda
2
1. Shared Services Total
2. People Services, Marketing Services & Analytics, Financial Services & Facilities (PAFF)
Business Plan
3. ICT Business Plan
Contents

Shared ServicesTotal
3

Historical Scorecard KPIs
4
Financial Sustainability
FY12 (Actual
FY13(Budget)
FY13(Forecast)
Status (Red /
Amber / Green )
Comment
ICTDirect Expenses
$16.3m $18.6m $19.1m Variance to be Explained in ICT Presentation
PAFFDirect Expenses
$6.8m $7.6m $7.6m Variation in FY13 Budget to FY13 forecast• FY13 Forecast is expected to be close to budget
Movement between FY12 Actual and FY13 budget• CPI $0.3M• Savings against FY12 budget by PAFF $0.5m
Total Shared Services
$23.1m $26.2m $26.7m
26.7
0.1
0.5
26.2
25.0
26.0
27.0
FY13 (Budget) PAFF Movement ICT Movement FY13 (Forecast)
$Mill
ions
FY13 (b) to FY13 (f)
5
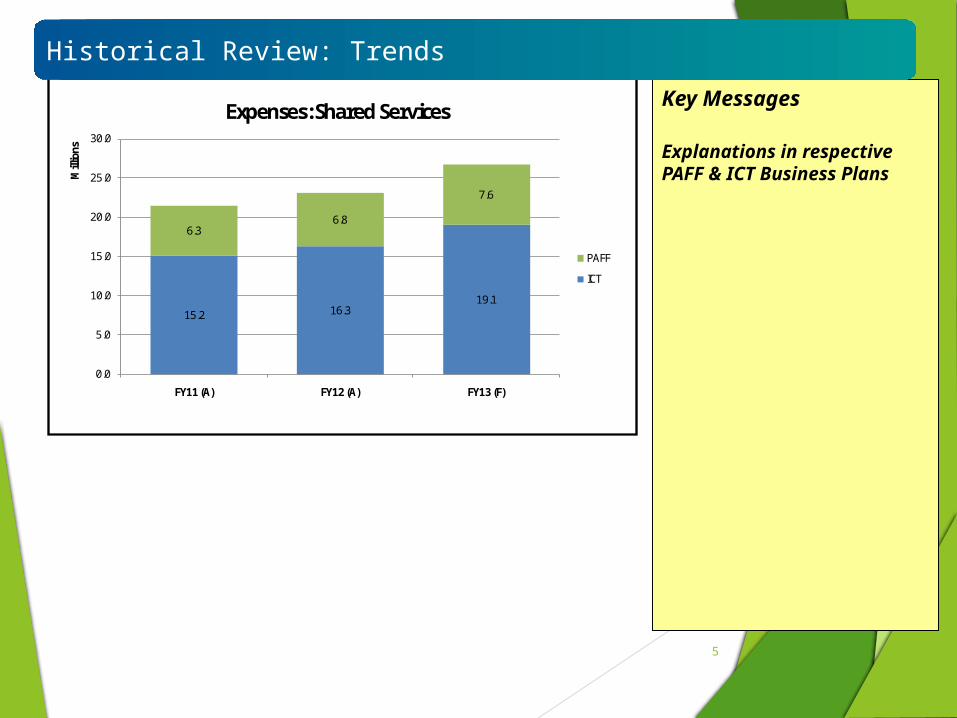
Key Messages
Explanations in respective PAFF & ICT Business Plans
Historical Review: Trends
15.2 16.319.1
6.36.8
7.6
0.0
5.0
10.0
15.0
20.0
25.0
30.0
FY11 (A) FY12 (A) FY13 (F)
Mill
ions
Expenses: Shared Services
PAFF
ICT

Shared Services Budget P&L
6

Financial Sustainability
FY12 (Actual
FY13(Forecast)
FY14(Target)
FY 15 (Target)
FY16(Target)
FY17 (Target)
FY18 (Target)
Costs - SS (Ms)
People Commitment FY12 (Actual
FY13(Forecast)
FY14 (Target)
FY 15 (Target)
FY16 (Target)
FY17 (Target
)
FY18 (Target)
Health and Safety
Maintain Work safe Gold accreditation
GOLD GOLD GOLD GOLD GOLD GOLD GOLD
Employee Engagement
Employee Engagement Score
71 BEZ BEZ BEZ BEZ BEZ BEZ
Employee Turnover 13.8 21 19 17 16 15 15
Sick Leave 2.5 3.0 2.8 2.6 2.5 2.5 2.5
Membership Excellence
FY12 (Actual
FY13 (Forecast)
FY14 (Target) FY 15 (Target)
FY16 (Target)
FY17 (Target)
FY18 (Target)
Customer Satisfaction 3.8 3.9 4.0 4.0 4.0 4.0 4.0
Scorecard Key Performance Indicators
7

P&L
FY13 FY14 FY15 FY16 FY17 FY18
$'000 $'000 $'000 $'000 $'000 $'000
PROFIT & LOSS
Product Revenue 0 0 0 0 0 0 Internal Revenue 29,664 35,975 36,952 38,207 39,343 40,653 Other Revenue 62 0 0 0 0 0
Revenue 29,727 35,975 36,952 38,207 39,343 40,653
Direct Expenses (24,106) (29,322) (29,719) (30,940) (31,795) (32,732) Indirect Expenses (3,037) (3,420) (3,424) (3,524) (3,613) (3,757)
Operating Expenses (27,143) (32,741) (33,143) (34,465) (35,408) (36,490)
Operating Investment 0 0 0 0 0 0
Operating Profit 2,583 3,234 3,809 3,742 3,936 4,163
Depreciation & Amortisation (Expense) (2,441) (3,234) (3,809) (3,742) (3,936) (4,163)
Non Operating Investments (Revenue) 0 0 0 0 0 0
Profit Before Acquisition Amort & Tax 143 0 0 0 0 0
Acquisition Amortisation 0 0 0 0 0 0
Profit / (Loss) Before Tax 143 0 0 0 0 0
Taxation 0 0 0 0 0 0
Profit / (Loss) After Tax 143 0 0 0 0 0
Shared Services DivisionProfit & Loss Summary, Rolling (5 Year View)
Server: PROD_PL App: RAC1 Database: PLReport Location: /A) RAC Group/1) P&L Reports
Report Name: 101f P&L Summary - 5 YearRun by user: Yum0p at: 9:34 AM on 18 Mar 13
Page 1 of 1
Note: Breakdown in PAFF and ICT Business Plan

SS Var. Review – FY13 to FY17 total (v previous plan)
9
ICT
Note: Details in PAFF and ICT Business Plan
140.9
1.0
1.7
2.8
137.4
135.0
136.0
137.0
138.0
139.0
140.0
141.0
142.0
FY13
B - 5
yrs
ICT
Mov
emen
t
ICT
- Ora
cle
Busi
ness
Lead
(Off
set)
PAFF
Mov
emen
t
FY14
B - 5
yrs
$Mill
ions

PAFFBusiness PlanFinancial Year 2013/14
10

Section Slide Number
1. Requirements and Context 13
2. FY13 Historical Performance 19
3. FY14 Business Plan 26
4. Risk Assessment 36
5. Sensitivity Analysis / Stress Testing 38
Appendix 1 – copies of P&L, Balance Sheet and Cash flow (from Hyperion or similar)
40
11
Contents
This output document template has been provided to you by Corporate to use during Divisional Business Planning process. Hyperion is required to be updated by Shared Services by 28/2/13, Distribution by 1/3/13 and other businesses (which includes Corporate and Member Services) by 14/3/13. This template is to be submitted no later than 22 March 2013.

1.0 Business Planning and BudgetingRequirements and Context
© XXXWA 2010

PAFF2.0 FY 13 Historical Performance
13

2. Historical Review: FY13 vs. Budget
14
PAFF Highlights• Health & Safety 5 year strategy developed• Recruitment savings (direct XXX advertising) across SS/Corp $300K (YTD) • Radiator produced in house by Design Team• Handover of corporate segmentation to analytics team• Increase in the use of Member Panel for research• January 2013 customer satisfaction rating of MSA 4.2 and Payroll 4.1 (v target of 4). Total
PAFF is 3.9.
PAFF Key Challenges & Risks• Variations in understanding of group alignment vs. business autonomy. This misalignment
makes delivering a Shared Service extremely challenging.• Stakeholder Turnover• Lack of Insurance data for analysis – and still no clear direction as to the future warehouse
solution• Resourcing – especially in Design Services (small teams)
Summary

2. Historical Review: FY13 Initiatives Update (PAFF)
15
Initiatives
FY13 Initiative Status (Red / Amber /
Green /Complete)
Comment s
Support the business in major initiatives in Project Springboard, OXXXle R12 Upgrade and Auto Services Expansion
• Support provided in the scoping of OXXXle R12 upgrade. This project has been delayed to FY14/FY15
• Support provided in Project Springboard. Project is now focussed solely on Motoring
• Auto Services expansion now delayed to late FY14
Building internal capability to enable more effective response to business demand
• LMS capability is being developed and will be transferred to People Services by June 2013
Completion of the Shared Services Leadership Program
• Selected leaders will complete the program by June 2013

2. Historical Scorecard KPIs
16
Financial Sustainability
FY12 (Actual
FY13(Budget)
FY13(Forecast)
Status (Red /
Amber / Green )
Comment
PAFFDirect Expenses
$6.8m $7.6m $7.6m Variation in FY13 Budget to FY13 forecast• FY13 Forecast is expected to be close to budget
Movement between FY12 Actual and FY13 budget• CPI $0.3M• Savings against FY12 budget by PAFF $0.5m
6.87.6 7.6
0.0
1.0
2.0
3.0
4.0
5.0
6.0
7.0
8.0
9.0
FY12 (A) FY13(B) FY13(F)
Mill
ions
Total PAFF Costs

17
Key Messages
Movement between FY12 Actual and FY13 Budget
PAFF• CPI $0.3M• Savings against FY12 budget
$0.5m
2. Historical Review: Trends
6.36.8
7.6
0.0
1.0
2.0
3.0
4.0
5.0
6.0
7.0
8.0
9.0
FY11 (A) FY12 (A) FY13 (F)
Mill
ions
Expenses: PAFF

Financial Sustainability
FY11(Actual)
FY 12 (Actual)
FY13(Forecast)
Costs - PAFF(Ms) 6.5 6.8 7.6
People Commitment FY11(Actual)
FY 12 (Actual)
FY13(Forecast)
Health and Safety
Maintain Work safe Gold accreditation
GOLD GOLD GOLD
Employee Engagement
Employee Engagement Score
60 71 BEZ
Employee Turnover 20.5 13.8 21
Sick Leave 2.1 2.5 3.0
Membership Excellence
FY11(Actual)
FY 12 (Actual)
FY13(Forecast)
Customer Satisfaction 3.8 3.8 3.9
2. Scorecard PAFF Key Performance Indicators
18

PAFF3.0 FY14 Business Plan
19

OUR PURPOSE:The XXX exists to protect and enhance the lifestyle of its shareholders
20
OUR VISION:By 2020, Western Australians rate the XXX as their most-valued organisation.
RONA& NPS*
Integral to achieving our Vision
Shared ServicesStrategic Issues
PAFFInitiatives
Group Strategic Issues
Financial Sustainability
2013 Strategic Plan
PAFF Aligning the group strategic direction
HoldingsPurpose: To provide financial
return and brand enhancement
People Commitment
Relationship Excellence
Key Result Areas
Competition and Substitution of Services
Performance of XXX
Division
Growth & Sustainability ofFinancial Engine
Disruptive Technology and
Enabling Technology
AttXXXting, Retaining and
Enabling the talent
Complex Systems and inefficient processes
Capacity & Capability constraints
Customer relationship
Shared Services Culture
The Service Delivery Model is not fit for
purpose
IncreaseCapabilities
Integrate withthe businesses
Share insightand knowledge
Focus onSystems
ContinuousImprovement
Building StrongRelationships

PAFF Growth Path
21
Time Horizon
Time
Value
2012/2013>> >>2015 >>2020
Where we are now?
Where we want to be?
Horizon 1‘NORMING’• Businesses understand the
services that are provided.• Services are delivered to a good
standard.• Teams understand the needs of
their customers, and have developed good relationships with stakeholders
• Internal processes have improved, but there are still areas than can addressed.
Horizon 2CONTINUOUS IMPROVEMENT• All repeatable processes are performed
to their optimal efficiency• Service catalogue is constantly
evolving as businesses are becoming more reliant on PAFF.
• Value add is transparent, and measureable
• Teams are truly integrated into the XXX Businesses, and are pro-actively seeking ways to add more value.
• Skills with PAFF teams are constantly being developed, with XXX Businesses recognising PAFF as true experts in their areas.
Horizon 3‘PERFORMING’• XXX Businesses trust PAFF to
provide expert services efficiently• PAFF teams working as self-
managed teams, constantly looking for new ways to add value.
• Businesses recognise the value of consolidating activities within PAFF

3. PAFF FY14 Business Plan Overview
Divisional OAS Statement
Shared Services exists for the benefit of the XXX businesses. Our overall aim is to provide efficient transactional services, plus services, specialist advice and insights that will add value.
We will measure the efficiency of our repeatable processes, and areas of added value, but our overall success will be determined by how well Shared Services can contribute to the businesses achieving their strategic objectives
Highlights of the 5 year Strategic Plan• Process enhancement – developing the ‘how’ and not just the ‘what’• Capability improvement – technology and skill set alignment to business requirements• Improving the relationship with the businesses, through successful and transparent delivery of
requirements• Leadership development • Career Development and skills enhancement• Understanding engagement, and developing initiatives to address issues.

3. PAFF FY14 Business Plan Overview
Key Priorities / Initiatives
Across Shared Services • Facilitate cross group process improvement for Shared Services provided functions
Marketing Services and Analytics• Implement new Market Research survey tool to create reporting efficiencies• Develop new processes of insight development and report writing by having UNITS in the EDW.• Add photography to the Design Services catalogue after training in FY13• Make the business case for an additional Designer, and employ
Financial Services • OXXXle R12 Implementation
Review current OXXXle E-Business system, and redesign, optimise and improve module configuration
Streamline workflow processes in OXXXle, including manual Shared Services processes• Service and Capability Improvement
People Services • People administration process reengineering• Research, investigate and develop a recommendation for an automated on boarding system

3. Divisional FY14 Business Plan Overview
Key Challenges & Risks
• Delivering internal Shared Services initiatives, while still delivering BAU with sub optimal systems and processes while keeping costs at an acceptable level
• Loss of key staff
• Turnover of business stakeholders

25
Key Assumptions
• PAFF includes $1m (5 years) transfer of the OXXXle Business Lead transferred from ICT to Financial Services (offset in ICT)
3. Divisional Forecast Performance – PBT, Net Assets, RONA
0.0
1.0
2.0
3.0
4.0
5.0
6.0
7.0
8.0
9.0
10.0
FY13 FY14 FY15 FY16 FY17
Mill
ions
Expenses: PAFF
Expenses : PY Expenses : CY

3. PAFF - FY13B FY14 to FY14B FY14 Bridge
26
Commentary• OXXXle Business Lead transferred into Financial Services (savings offset in ICT)
8.5
0.2 0.1 0.1 0.10.1 0.1
0.2
7.7
6.0
6.5
7.0
7.5
8.0
8.5
9.0
FY13
B - F
Y14
FS- O
racl
e Bu
sine
ss L
ead
(Off
set i
n IC
T)
FS -
Fina
ncia
l & C
omm
ICT
Supp
ort r
ole
PS -
RAC
Gro
up H
SIn
itiati
ve
PS -
LMS
Reso
urce
PS -
Auto
mat
e Pe
ople
Form
s
PS/F
S - R
enta
l
Oth
er
FY14
B - F
Y14
Budg
et
$Mill
ions

3. Summary of FY14 Budget Initiatives
27
Initiative Revenue ($’000)
Expenses ($’000)
PBT ($’000)
KPI / Volume
Capex($’000)
Cash flow($’000)
XXX Group HS Initiative 120

Financial Sustainability
FY12 (Actual
FY13(Forecast)
FY14(Target)
FY 15 (Target)
FY16(Target)
FY17 (Target)
FY18 (Target)
Costs - PAFF(Ms) 6.8 7.6 8.5 8.4 8.7 8.9 9.1
People Commitment FY12 (Actual
FY13(Forecast)
FY14 (Target)
FY 15 (Target)
FY16 (Target)
FY17 (Target
)
FY18 (Target)
Health and Safety
Maintain Work safe Gold accreditation
GOLD GOLD GOLD GOLD GOLD GOLD GOLD
Employee Engagement
Employee Engagement Score
71 BEZ BEZ BEZ BEZ BEZ BEZ
Employee Turnover 13.8 21 19 17 16 15 15
Sick Leave 2.5 3.0 2.8 2.6 2.5 2.5 2.5
Membership Excellence
FY12 (Actual
FY13 (Forecast)
FY14 (Target) FY 15 (Target)
FY16 (Target)
FY17 (Target)
FY18 (Target)
Customer Satisfaction 3.8 3.9 4.0 4.0 4.0 4.0 4.0
3. Scorecard Key Performance Indicators
28

3. PAFF Headcount & FTE
29
Description FY13 (Budget)
FY13 (Forecast)
FY14 (Forecast)
FY 15 (Forecast)
FY16 (Forecast)
FY17 (Forecast)
FY18 (Forecast)
Headcount 61
FTE – Actual Alesco 55.8 58.5
Current Vacancies – FTE
2.2
Costed FTE – Total Planned
53.6 56.3 55.4 51.7 51.7 49.7 48.7

PAFFFY14 Business Plan 4.0 Risk Assessment
30

4. Risk Assessment
31
Risk Description
Residual Risk Rating
(H/M/L)
Risk Mitigation Strategy / Actions
Loss of key staff and special skills M Key HR strategies in place for succession management, career development, workforce planning , training and building of leadership capability.
Managing demand and supply in the short to medium term
M Continue to communicate and engage business through Focus Groups and Stakeholder meetings.Initiate strategies that meets business demand and needs.
Delivering BAU activities in an effective and timely manner
M
Ability to measure and benchmark success M Continue to perform periodic surveys on Customer Satisfaction. Identify new measures that improve the transparency of PAFF activities with business and its cost effectiveness.

PAFFFY14 Business Plan 5.0 Sensitivity Analysis / Stress Testing
32

5. Sensitivity Analysis / Stress Testing
33
StressTested – impact on PBT
FY14 (Target)
FY 15 (Target)
FY16 (Target)
FY17 (Target)
FY18 (Target)
PBT impact PBT impact PBT impact PBT impact PBT impact
5% increase in wage costs(PAFF)
$0.3m $0.3m $0.3m $0.3m $0.3m

PAFFFY14 Business Plan Appendix 1 – P&L
34

Appendix 1: P&L
FY13 FY14 FY15 FY16 FY17 FY18
$'000 $'000 $'000 $'000 $'000 $'000
PROFIT & LOSS
Product Revenue 0 0 0 0 0 0 Internal Revenue 8,853 9,939 9,851 10,167 10,337 10,605 Other Revenue 62 0 0 0 0 0
Revenue 8,916 9,939 9,851 10,167 10,337 10,605
Direct Expenses (7,538) (8,492) (8,399) (8,670) (8,817) (9,049) Indirect Expenses (1,223) (1,403) (1,406) (1,451) (1,488) (1,539)
Operating Expenses (8,761) (9,893) (9,806) (10,122) (10,305) (10,590)
Operating Investment 0 0 0 0 0 0
Operating Profit 154 45 46 45 34 15
Depreciation & Amortisation (Expense) (33) (45) (46) (45) (34) (15)
Non Operating Investments (Revenue) 0 0 0 0 0 0
Profit Before Acquisition Amort & Tax 122 0 0 0 0 0
Acquisition Amortisation 0 0 0 0 0 0
Profit / (Loss) Before Tax 122 0 0 0 0 0
Taxation 0 0 0 0 0 0
Profit / (Loss) After Tax 122 0 0 0 0 0
PAFFProfit & Loss Summary, Rolling (5 Year View)
Server: PROD_PL App: RAC1 Database: PLReport Location: /A) RAC Group/1) P&L Reports
Report Name: 101f P&L Summary - 5 YearRun by user: Yum0p at: 9:36 AM on 18 Mar 13
Page 1 of 1
Note: Total costs includes internal charges from other Shared Services (including PAFF and ICT)

Appendix 2 – PAFF Variance – FY13 to FY17 total (v previous plan)
36
Notes:• FS – Financial Services• PS – People Services
42.2
1.0 0.1 0.2 0.10.4 0.2 0.1 0.1
0.40.3
39.4
38.0
39.0
40.0
41.0
42.0
43.0
FY13
B - 5
yrs
FS- O
racl
e Bu
sine
ss L
ead
(Off
set i
n IC
T)
FS -
Fina
ncia
l & C
omm
ICT
Supp
ort r
ole
FS -
Team
Reor
gani
satio
n
FS -
Staff
Ince
ntive
s
PS -
RAC
Gro
up H
SIn
itiati
ve
PS -
Annu
al A
lesc
oU
pgra
des
PS -
LMS
Reso
urce
PS -
Auto
mat
e Pe
ople
Form
s
PS/F
S - R
enta
l
Oth
er
FY14
B - 5
yrs
$Mill
ions

Appendix 3 – PAFF Issues, Strategies and Initiatives
37
Strategic Issue Shared Services Strategies PAFF Initiatives
1.Complex systems and inefficient processes
1.2 Optimise Shared Services processes to eliminate
inefficiencies reducing the cost per transactional service
1.2.1 Breakthrough1.2.2 Process re-engineering
2.Capacity and capability constraints
2.2 Continue to develop capability across all of Shared Services
2.2.1 Continuous improvement2.2.1 Increase Capabilities
3.Service Delivery Model is not fit for purpose
3.1 Revisit all elements of the Service Delivery Model to ensure that it is appropriate to the needs of our Business customers (Transparency, understanding)
3.1.1 Oversight Model Review3.1.2 Service catalogue review3.1.3 Cost allocation review
4.Customer Relationship
4.1 Proactively support businesses in delivering on their business objectives
4.1.1 Potential synergies with Insurance4.1.2 Actively support Divisions in achieving their objectives4.1.3 Develop BPI measure link to businesses4.1.4 Improve the engagement mechanism between Shared Services & the Businesses
5.Shared Services Culture
5.1 Develop a culture of confidence, performance and collaboration
5.1.1 Training, coaching and mentoring in people management disciplines5.1.2 SS Leadership development 5.1.3 Understand and improve Shared Services Employee Engagement
38
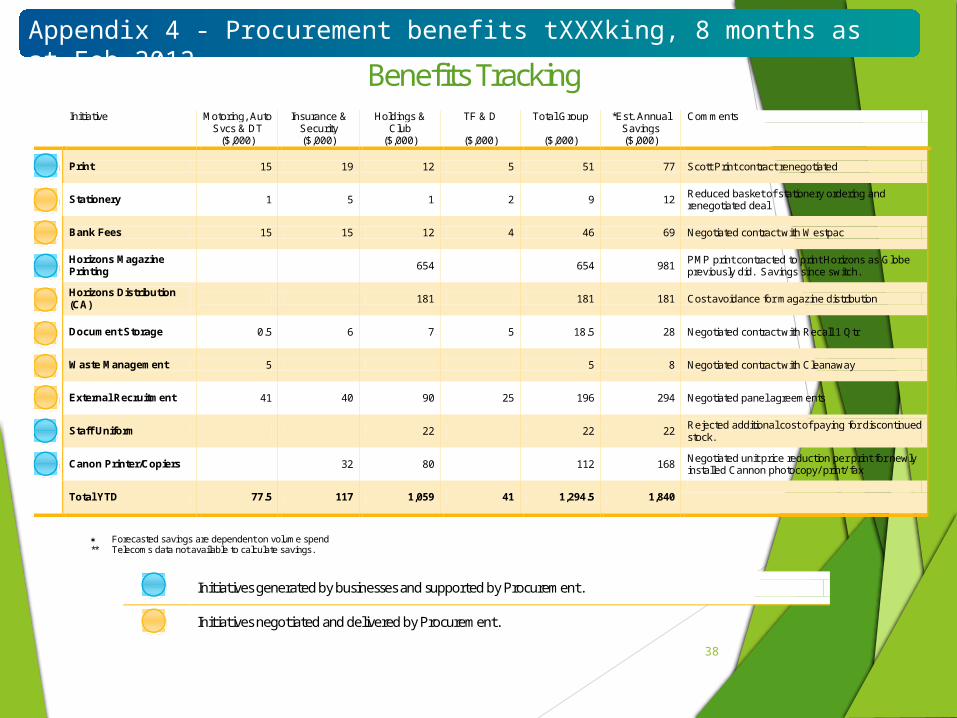
Appendix 4 - Procurement benefits tXXXking, 8 months as at Feb 2012 Benefits Tracking
Initiative Motoring, Auto
Svcs & DT ($,000)
Insurance & Security ($,000)
Holdings & Club
($,000)
TF & D
($,000)
Total Group
($,000)
*Est. Annual Savings ($,000)
Comments
Print 15 19 12 5 51 77 Scott Print contract renegotiated
Stationery 1 5 1 2 9 12
Reduced basket of stationery ordering and renegotiated deal
Bank Fees 15 15 12 4 46 69 Negotiated contract with Westpac
Horizons Magazine Printing 654 654 981
PMP print contracted to print Horizons as Globe previously did. Savings since switch.
Horizons Distribution (CA) 181 181 181 Cost avoidance for magazine distribution
Document Storage 0.5 6 7 5 18.5 28 Negotiated contract with Recall 1 Qtr
Waste Management 5 5 8 Negotiated contract with Cleanaway
External Recruitment 41 40 90 25 196 294 Negotiated panel agreements
Staff Uniform 22 22 22
Rejected additional cost of paying for discontinued stock.
Canon Printer/Copiers 32 80 112 168
Negotiated unit price reduction per print for newly installed Cannon photocopy/ print/ fax
Total YTD 77.5 117 1,059 41 1,294.5 1,840
Forecasted savings are dependent on volume spend ** Telecoms data not available to calculate savings.
Initiatives generated by businesses and supported by Procurement.
Initiatives negotiated and delivered by Procurement.
Feedback questionnaire – Improving Continuously
One of xxx core values is “Improving Continuously.” To this end please answer the following questions:
1. What worked well with the business planning process?
2. What could be improved?
3. Any other comments about the business planning process?
Thank you for your assistance.