1 BR 2 BR 3 BR 4 BR 5 BR ALAMEDA - treasurer.ca.gov · Ceilings That Elected with the Secretary of...
12
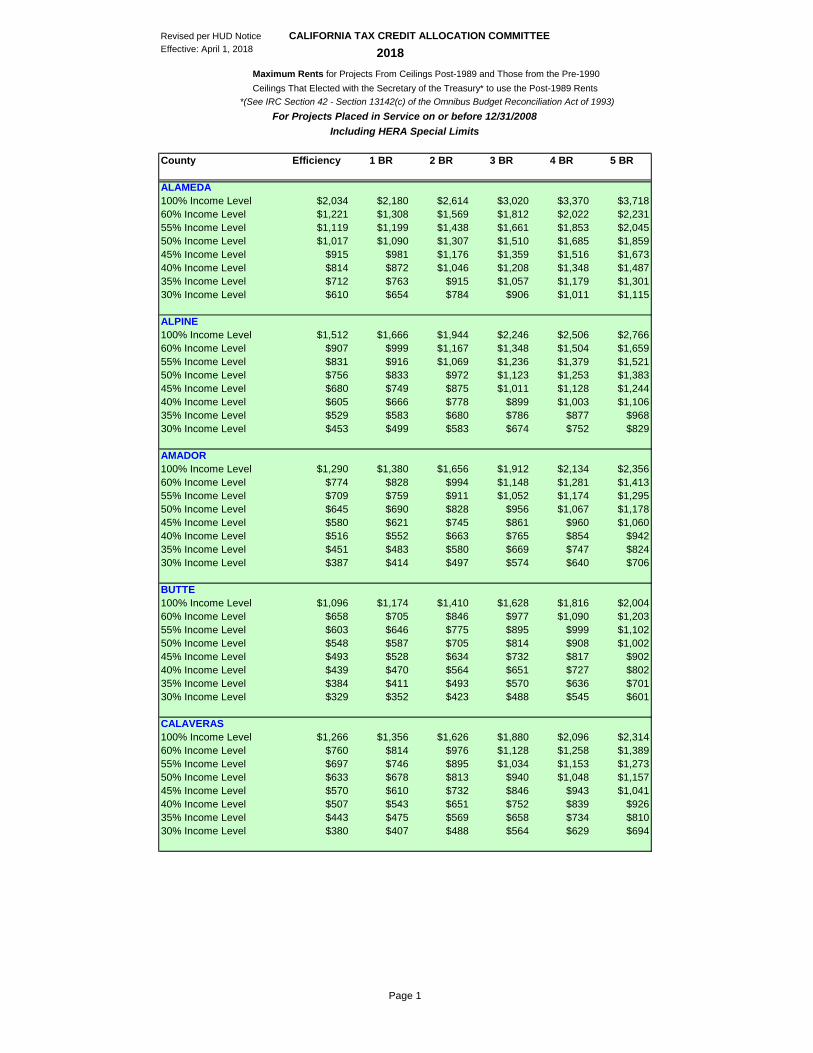
Page 1 Revised per HUD Notice CALIFORNIA TAX CREDIT ALLOCATION COMMITTEE Effective: April 1, 2018 2018 Maximum Rents for Projects From Ceilings Post-1989 and Those from the Pre-1990 Ceilings That Elected with the Secretary of the Treasury* to use the Post-1989 Rents *(See IRC Section 42 - Section 13142(c) of the Omnibus Budget Reconciliation Act of 1993) County Efficiency 1 BR 2 BR 3 BR 4 BR 5 BR ALAMEDA 100% Income Level $2,034 $2,180 $2,614 $3,020 $3,370 $3,718 60% Income Level $1,221 $1,308 $1,569 $1,812 $2,022 $2,231 55% Income Level $1,119 $1,199 $1,438 $1,661 $1,853 $2,045 50% Income Level $1,017 $1,090 $1,307 $1,510 $1,685 $1,859 45% Income Level $915 $981 $1,176 $1,359 $1,516 $1,673 40% Income Level $814 $872 $1,046 $1,208 $1,348 $1,487 35% Income Level $712 $763 $915 $1,057 $1,179 $1,301 30% Income Level $610 $654 $784 $906 $1,011 $1,115 ALPINE 100% Income Level $1,512 $1,666 $1,944 $2,246 $2,506 $2,766 60% Income Level $907 $999 $1,167 $1,348 $1,504 $1,659 55% Income Level $831 $916 $1,069 $1,236 $1,379 $1,521 50% Income Level $756 $833 $972 $1,123 $1,253 $1,383 45% Income Level $680 $749 $875 $1,011 $1,128 $1,244 40% Income Level $605 $666 $778 $899 $1,003 $1,106 35% Income Level $529 $583 $680 $786 $877 $968 30% Income Level $453 $499 $583 $674 $752 $829 AMADOR 100% Income Level $1,290 $1,380 $1,656 $1,912 $2,134 $2,356 60% Income Level $774 $828 $994 $1,148 $1,281 $1,413 55% Income Level $709 $759 $911 $1,052 $1,174 $1,295 50% Income Level $645 $690 $828 $956 $1,067 $1,178 45% Income Level $580 $621 $745 $861 $960 $1,060 40% Income Level $516 $552 $663 $765 $854 $942 35% Income Level $451 $483 $580 $669 $747 $824 30% Income Level $387 $414 $497 $574 $640 $706 BUTTE 100% Income Level $1,096 $1,174 $1,410 $1,628 $1,816 $2,004 60% Income Level $658 $705 $846 $977 $1,090 $1,203 55% Income Level $603 $646 $775 $895 $999 $1,102 50% Income Level $548 $587 $705 $814 $908 $1,002 45% Income Level $493 $528 $634 $732 $817 $902 40% Income Level $439 $470 $564 $651 $727 $802 35% Income Level $384 $411 $493 $570 $636 $701 30% Income Level $329 $352 $423 $488 $545 $601 CALAVERAS 100% Income Level $1,266 $1,356 $1,626 $1,880 $2,096 $2,314 60% Income Level $760 $814 $976 $1,128 $1,258 $1,389 55% Income Level $697 $746 $895 $1,034 $1,153 $1,273 50% Income Level $633 $678 $813 $940 $1,048 $1,157 45% Income Level $570 $610 $732 $846 $943 $1,041 40% Income Level $507 $543 $651 $752 $839 $926 35% Income Level $443 $475 $569 $658 $734 $810 30% Income Level $380 $407 $488 $564 $629 $694 For Projects Placed in Service on or before 12/31/2008 Including HERA Special Limits
-
Upload
nguyencong -
Category
Documents
-
view
217 -
download
0
Transcript of 1 BR 2 BR 3 BR 4 BR 5 BR ALAMEDA - treasurer.ca.gov · Ceilings That Elected with the Secretary of...
Page 1
Revised per HUD Notice CALIFORNIA TAX CREDIT ALLOCATION COMMITTEEEffective: April 1, 2018 2018 Maximum Rents for Projects From Ceilings Post-1989 and Those from the Pre-1990 Ceilings That Elected with the Secretary of the Treasury* to use the Post-1989 Rents *(See IRC Section 42 - Section 13142(c) of the Omnibus Budget Reconciliation Act of 1993)
County Efficiency 1 BR 2 BR 3 BR 4 BR 5 BR
ALAMEDA 100% Income Level $2,034 $2,180 $2,614 $3,020 $3,370 $3,71860% Income Level $1,221 $1,308 $1,569 $1,812 $2,022 $2,23155% Income Level $1,119 $1,199 $1,438 $1,661 $1,853 $2,04550% Income Level $1,017 $1,090 $1,307 $1,510 $1,685 $1,85945% Income Level $915 $981 $1,176 $1,359 $1,516 $1,67340% Income Level $814 $872 $1,046 $1,208 $1,348 $1,48735% Income Level $712 $763 $915 $1,057 $1,179 $1,30130% Income Level $610 $654 $784 $906 $1,011 $1,115
ALPINE100% Income Level $1,512 $1,666 $1,944 $2,246 $2,506 $2,76660% Income Level $907 $999 $1,167 $1,348 $1,504 $1,65955% Income Level $831 $916 $1,069 $1,236 $1,379 $1,52150% Income Level $756 $833 $972 $1,123 $1,253 $1,38345% Income Level $680 $749 $875 $1,011 $1,128 $1,24440% Income Level $605 $666 $778 $899 $1,003 $1,10635% Income Level $529 $583 $680 $786 $877 $96830% Income Level $453 $499 $583 $674 $752 $829
AMADOR100% Income Level $1,290 $1,380 $1,656 $1,912 $2,134 $2,35660% Income Level $774 $828 $994 $1,148 $1,281 $1,41355% Income Level $709 $759 $911 $1,052 $1,174 $1,29550% Income Level $645 $690 $828 $956 $1,067 $1,17845% Income Level $580 $621 $745 $861 $960 $1,06040% Income Level $516 $552 $663 $765 $854 $94235% Income Level $451 $483 $580 $669 $747 $82430% Income Level $387 $414 $497 $574 $640 $706
BUTTE100% Income Level $1,096 $1,174 $1,410 $1,628 $1,816 $2,00460% Income Level $658 $705 $846 $977 $1,090 $1,20355% Income Level $603 $646 $775 $895 $999 $1,10250% Income Level $548 $587 $705 $814 $908 $1,00245% Income Level $493 $528 $634 $732 $817 $90240% Income Level $439 $470 $564 $651 $727 $80235% Income Level $384 $411 $493 $570 $636 $70130% Income Level $329 $352 $423 $488 $545 $601
CALAVERAS100% Income Level $1,266 $1,356 $1,626 $1,880 $2,096 $2,31460% Income Level $760 $814 $976 $1,128 $1,258 $1,38955% Income Level $697 $746 $895 $1,034 $1,153 $1,27350% Income Level $633 $678 $813 $940 $1,048 $1,15745% Income Level $570 $610 $732 $846 $943 $1,04140% Income Level $507 $543 $651 $752 $839 $92635% Income Level $443 $475 $569 $658 $734 $81030% Income Level $380 $407 $488 $564 $629 $694
For Projects Placed in Service on or before 12/31/2008Including HERA Special Limits
Page 2
Revised per HUD Notice CALIFORNIA TAX CREDIT ALLOCATION COMMITTEEEffective: April 1, 2018 2018 Maximum Rents for Projects From Ceilings Post-1989 and Those from the Pre-1990 Ceilings That Elected with the Secretary of the Treasury* to use the Post-1989 Rents *(See IRC Section 42 - Section 13142(c) of the Omnibus Budget Reconciliation Act of 1993)
County Efficiency 1 BR 2 BR 3 BR 4 BR 5 BR
For Projects Placed in Service on or before 12/31/2008Including HERA Special Limits
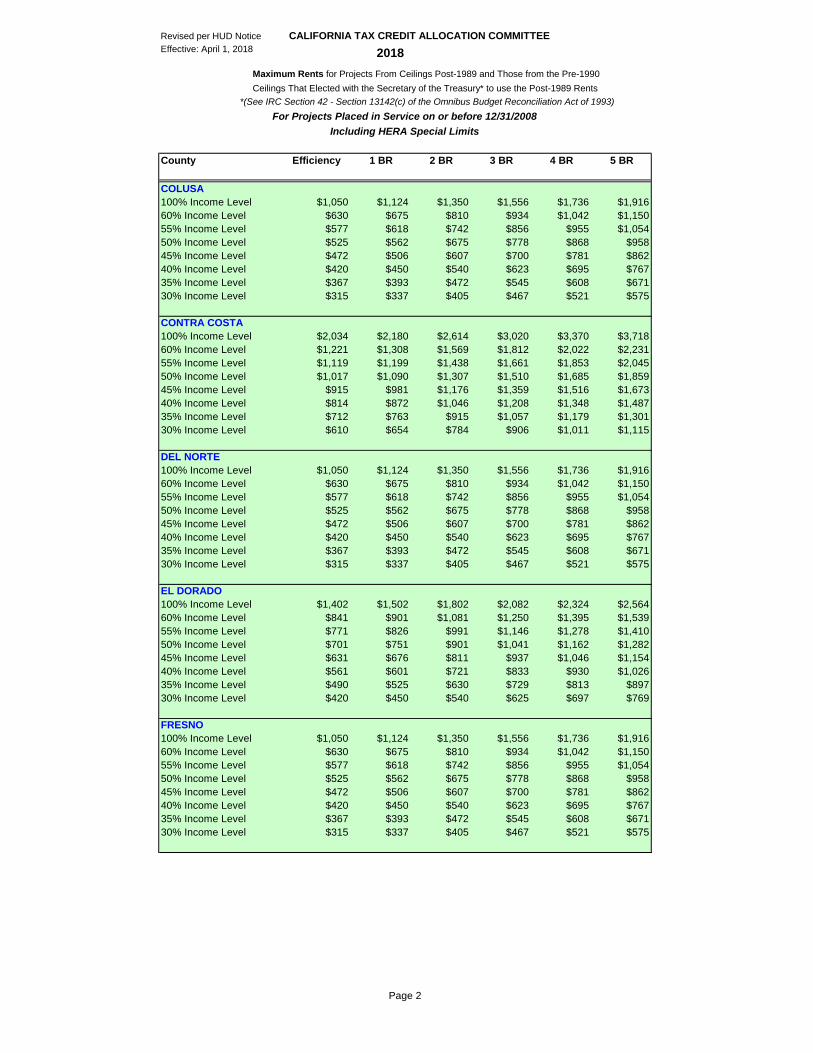
COLUSA100% Income Level $1,050 $1,124 $1,350 $1,556 $1,736 $1,91660% Income Level $630 $675 $810 $934 $1,042 $1,15055% Income Level $577 $618 $742 $856 $955 $1,05450% Income Level $525 $562 $675 $778 $868 $95845% Income Level $472 $506 $607 $700 $781 $86240% Income Level $420 $450 $540 $623 $695 $76735% Income Level $367 $393 $472 $545 $608 $67130% Income Level $315 $337 $405 $467 $521 $575
CONTRA COSTA 100% Income Level $2,034 $2,180 $2,614 $3,020 $3,370 $3,71860% Income Level $1,221 $1,308 $1,569 $1,812 $2,022 $2,23155% Income Level $1,119 $1,199 $1,438 $1,661 $1,853 $2,04550% Income Level $1,017 $1,090 $1,307 $1,510 $1,685 $1,85945% Income Level $915 $981 $1,176 $1,359 $1,516 $1,67340% Income Level $814 $872 $1,046 $1,208 $1,348 $1,48735% Income Level $712 $763 $915 $1,057 $1,179 $1,30130% Income Level $610 $654 $784 $906 $1,011 $1,115
DEL NORTE100% Income Level $1,050 $1,124 $1,350 $1,556 $1,736 $1,91660% Income Level $630 $675 $810 $934 $1,042 $1,15055% Income Level $577 $618 $742 $856 $955 $1,05450% Income Level $525 $562 $675 $778 $868 $95845% Income Level $472 $506 $607 $700 $781 $86240% Income Level $420 $450 $540 $623 $695 $76735% Income Level $367 $393 $472 $545 $608 $67130% Income Level $315 $337 $405 $467 $521 $575
EL DORADO100% Income Level $1,402 $1,502 $1,802 $2,082 $2,324 $2,56460% Income Level $841 $901 $1,081 $1,250 $1,395 $1,53955% Income Level $771 $826 $991 $1,146 $1,278 $1,41050% Income Level $701 $751 $901 $1,041 $1,162 $1,28245% Income Level $631 $676 $811 $937 $1,046 $1,15440% Income Level $561 $601 $721 $833 $930 $1,02635% Income Level $490 $525 $630 $729 $813 $89730% Income Level $420 $450 $540 $625 $697 $769
FRESNO100% Income Level $1,050 $1,124 $1,350 $1,556 $1,736 $1,91660% Income Level $630 $675 $810 $934 $1,042 $1,15055% Income Level $577 $618 $742 $856 $955 $1,05450% Income Level $525 $562 $675 $778 $868 $95845% Income Level $472 $506 $607 $700 $781 $86240% Income Level $420 $450 $540 $623 $695 $76735% Income Level $367 $393 $472 $545 $608 $67130% Income Level $315 $337 $405 $467 $521 $575
Page 3
Revised per HUD Notice CALIFORNIA TAX CREDIT ALLOCATION COMMITTEEEffective: April 1, 2018 2018 Maximum Rents for Projects From Ceilings Post-1989 and Those from the Pre-1990 Ceilings That Elected with the Secretary of the Treasury* to use the Post-1989 Rents *(See IRC Section 42 - Section 13142(c) of the Omnibus Budget Reconciliation Act of 1993)
County Efficiency 1 BR 2 BR 3 BR 4 BR 5 BR
For Projects Placed in Service on or before 12/31/2008Including HERA Special Limits
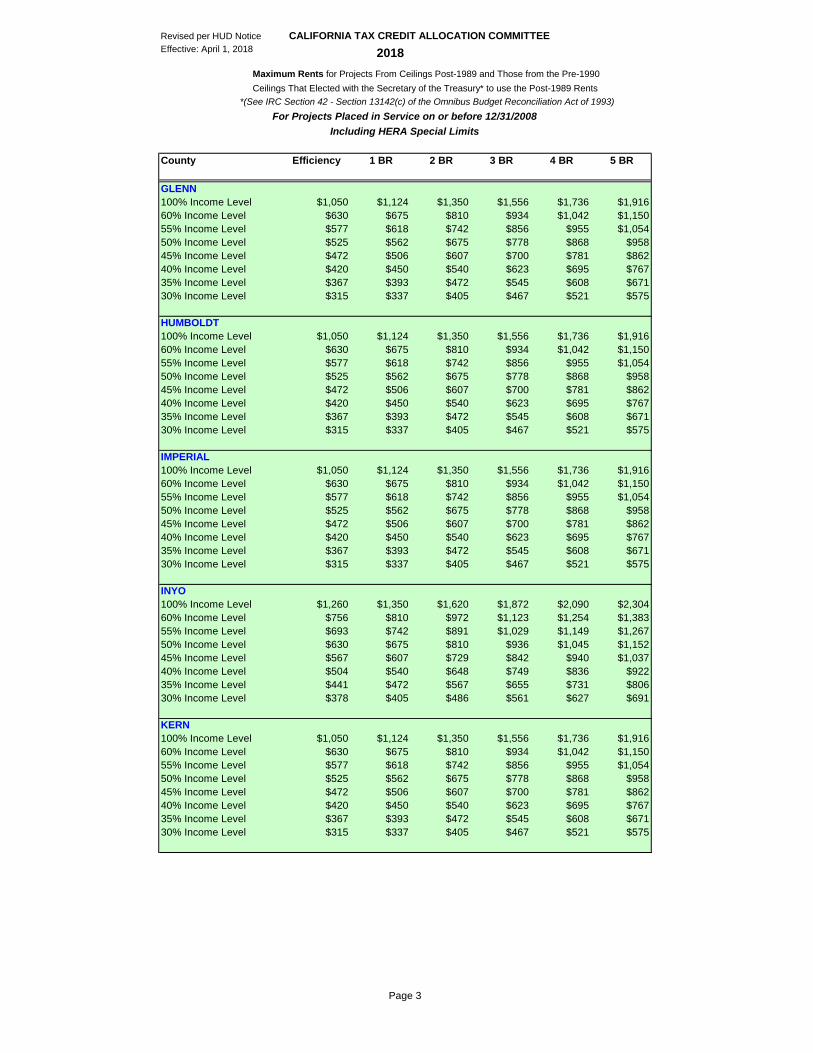
GLENN100% Income Level $1,050 $1,124 $1,350 $1,556 $1,736 $1,91660% Income Level $630 $675 $810 $934 $1,042 $1,15055% Income Level $577 $618 $742 $856 $955 $1,05450% Income Level $525 $562 $675 $778 $868 $95845% Income Level $472 $506 $607 $700 $781 $86240% Income Level $420 $450 $540 $623 $695 $76735% Income Level $367 $393 $472 $545 $608 $67130% Income Level $315 $337 $405 $467 $521 $575
HUMBOLDT100% Income Level $1,050 $1,124 $1,350 $1,556 $1,736 $1,91660% Income Level $630 $675 $810 $934 $1,042 $1,15055% Income Level $577 $618 $742 $856 $955 $1,05450% Income Level $525 $562 $675 $778 $868 $95845% Income Level $472 $506 $607 $700 $781 $86240% Income Level $420 $450 $540 $623 $695 $76735% Income Level $367 $393 $472 $545 $608 $67130% Income Level $315 $337 $405 $467 $521 $575
IMPERIAL100% Income Level $1,050 $1,124 $1,350 $1,556 $1,736 $1,91660% Income Level $630 $675 $810 $934 $1,042 $1,15055% Income Level $577 $618 $742 $856 $955 $1,05450% Income Level $525 $562 $675 $778 $868 $95845% Income Level $472 $506 $607 $700 $781 $86240% Income Level $420 $450 $540 $623 $695 $76735% Income Level $367 $393 $472 $545 $608 $67130% Income Level $315 $337 $405 $467 $521 $575
INYO100% Income Level $1,260 $1,350 $1,620 $1,872 $2,090 $2,30460% Income Level $756 $810 $972 $1,123 $1,254 $1,38355% Income Level $693 $742 $891 $1,029 $1,149 $1,26750% Income Level $630 $675 $810 $936 $1,045 $1,15245% Income Level $567 $607 $729 $842 $940 $1,03740% Income Level $504 $540 $648 $749 $836 $92235% Income Level $441 $472 $567 $655 $731 $80630% Income Level $378 $405 $486 $561 $627 $691
KERN100% Income Level $1,050 $1,124 $1,350 $1,556 $1,736 $1,91660% Income Level $630 $675 $810 $934 $1,042 $1,15055% Income Level $577 $618 $742 $856 $955 $1,05450% Income Level $525 $562 $675 $778 $868 $95845% Income Level $472 $506 $607 $700 $781 $86240% Income Level $420 $450 $540 $623 $695 $76735% Income Level $367 $393 $472 $545 $608 $67130% Income Level $315 $337 $405 $467 $521 $575
Page 4
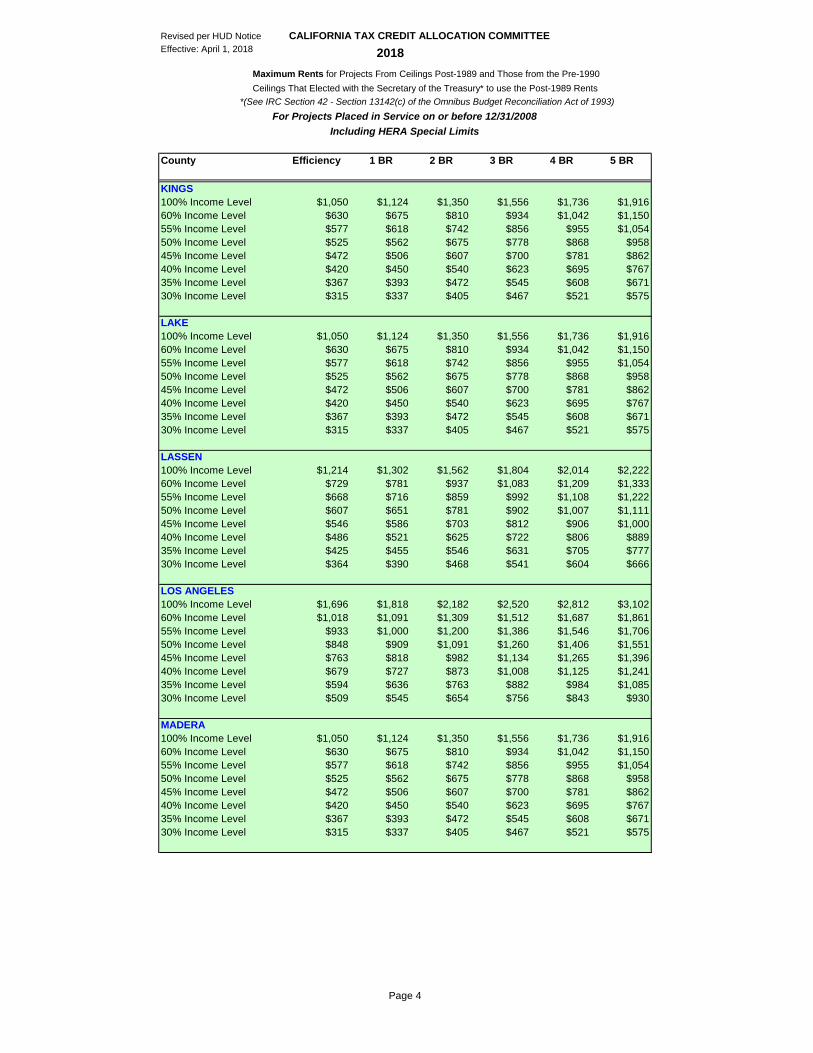
Revised per HUD Notice CALIFORNIA TAX CREDIT ALLOCATION COMMITTEEEffective: April 1, 2018 2018 Maximum Rents for Projects From Ceilings Post-1989 and Those from the Pre-1990 Ceilings That Elected with the Secretary of the Treasury* to use the Post-1989 Rents *(See IRC Section 42 - Section 13142(c) of the Omnibus Budget Reconciliation Act of 1993)
County Efficiency 1 BR 2 BR 3 BR 4 BR 5 BR
For Projects Placed in Service on or before 12/31/2008Including HERA Special Limits
KINGS100% Income Level $1,050 $1,124 $1,350 $1,556 $1,736 $1,91660% Income Level $630 $675 $810 $934 $1,042 $1,15055% Income Level $577 $618 $742 $856 $955 $1,05450% Income Level $525 $562 $675 $778 $868 $95845% Income Level $472 $506 $607 $700 $781 $86240% Income Level $420 $450 $540 $623 $695 $76735% Income Level $367 $393 $472 $545 $608 $67130% Income Level $315 $337 $405 $467 $521 $575
LAKE100% Income Level $1,050 $1,124 $1,350 $1,556 $1,736 $1,91660% Income Level $630 $675 $810 $934 $1,042 $1,15055% Income Level $577 $618 $742 $856 $955 $1,05450% Income Level $525 $562 $675 $778 $868 $95845% Income Level $472 $506 $607 $700 $781 $86240% Income Level $420 $450 $540 $623 $695 $76735% Income Level $367 $393 $472 $545 $608 $67130% Income Level $315 $337 $405 $467 $521 $575
LASSEN100% Income Level $1,214 $1,302 $1,562 $1,804 $2,014 $2,22260% Income Level $729 $781 $937 $1,083 $1,209 $1,33355% Income Level $668 $716 $859 $992 $1,108 $1,22250% Income Level $607 $651 $781 $902 $1,007 $1,11145% Income Level $546 $586 $703 $812 $906 $1,00040% Income Level $486 $521 $625 $722 $806 $88935% Income Level $425 $455 $546 $631 $705 $77730% Income Level $364 $390 $468 $541 $604 $666
LOS ANGELES100% Income Level $1,696 $1,818 $2,182 $2,520 $2,812 $3,10260% Income Level $1,018 $1,091 $1,309 $1,512 $1,687 $1,86155% Income Level $933 $1,000 $1,200 $1,386 $1,546 $1,70650% Income Level $848 $909 $1,091 $1,260 $1,406 $1,55145% Income Level $763 $818 $982 $1,134 $1,265 $1,39640% Income Level $679 $727 $873 $1,008 $1,125 $1,24135% Income Level $594 $636 $763 $882 $984 $1,08530% Income Level $509 $545 $654 $756 $843 $930
MADERA100% Income Level $1,050 $1,124 $1,350 $1,556 $1,736 $1,91660% Income Level $630 $675 $810 $934 $1,042 $1,15055% Income Level $577 $618 $742 $856 $955 $1,05450% Income Level $525 $562 $675 $778 $868 $95845% Income Level $472 $506 $607 $700 $781 $86240% Income Level $420 $450 $540 $623 $695 $76735% Income Level $367 $393 $472 $545 $608 $67130% Income Level $315 $337 $405 $467 $521 $575
Page 5
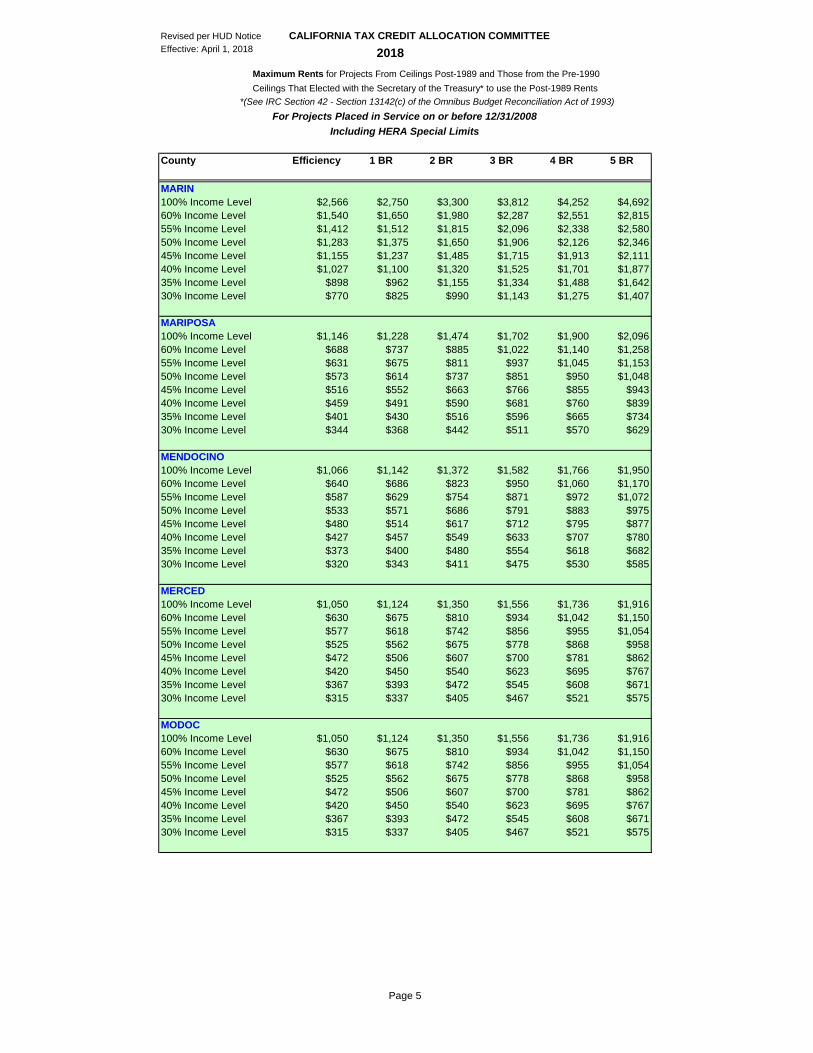
Revised per HUD Notice CALIFORNIA TAX CREDIT ALLOCATION COMMITTEEEffective: April 1, 2018 2018 Maximum Rents for Projects From Ceilings Post-1989 and Those from the Pre-1990 Ceilings That Elected with the Secretary of the Treasury* to use the Post-1989 Rents *(See IRC Section 42 - Section 13142(c) of the Omnibus Budget Reconciliation Act of 1993)
County Efficiency 1 BR 2 BR 3 BR 4 BR 5 BR
For Projects Placed in Service on or before 12/31/2008Including HERA Special Limits
MARIN 100% Income Level $2,566 $2,750 $3,300 $3,812 $4,252 $4,69260% Income Level $1,540 $1,650 $1,980 $2,287 $2,551 $2,81555% Income Level $1,412 $1,512 $1,815 $2,096 $2,338 $2,58050% Income Level $1,283 $1,375 $1,650 $1,906 $2,126 $2,34645% Income Level $1,155 $1,237 $1,485 $1,715 $1,913 $2,11140% Income Level $1,027 $1,100 $1,320 $1,525 $1,701 $1,87735% Income Level $898 $962 $1,155 $1,334 $1,488 $1,64230% Income Level $770 $825 $990 $1,143 $1,275 $1,407
MARIPOSA100% Income Level $1,146 $1,228 $1,474 $1,702 $1,900 $2,09660% Income Level $688 $737 $885 $1,022 $1,140 $1,25855% Income Level $631 $675 $811 $937 $1,045 $1,15350% Income Level $573 $614 $737 $851 $950 $1,04845% Income Level $516 $552 $663 $766 $855 $94340% Income Level $459 $491 $590 $681 $760 $83935% Income Level $401 $430 $516 $596 $665 $73430% Income Level $344 $368 $442 $511 $570 $629
MENDOCINO100% Income Level $1,066 $1,142 $1,372 $1,582 $1,766 $1,95060% Income Level $640 $686 $823 $950 $1,060 $1,17055% Income Level $587 $629 $754 $871 $972 $1,07250% Income Level $533 $571 $686 $791 $883 $97545% Income Level $480 $514 $617 $712 $795 $87740% Income Level $427 $457 $549 $633 $707 $78035% Income Level $373 $400 $480 $554 $618 $68230% Income Level $320 $343 $411 $475 $530 $585
MERCED100% Income Level $1,050 $1,124 $1,350 $1,556 $1,736 $1,91660% Income Level $630 $675 $810 $934 $1,042 $1,15055% Income Level $577 $618 $742 $856 $955 $1,05450% Income Level $525 $562 $675 $778 $868 $95845% Income Level $472 $506 $607 $700 $781 $86240% Income Level $420 $450 $540 $623 $695 $76735% Income Level $367 $393 $472 $545 $608 $67130% Income Level $315 $337 $405 $467 $521 $575
MODOC100% Income Level $1,050 $1,124 $1,350 $1,556 $1,736 $1,91660% Income Level $630 $675 $810 $934 $1,042 $1,15055% Income Level $577 $618 $742 $856 $955 $1,05450% Income Level $525 $562 $675 $778 $868 $95845% Income Level $472 $506 $607 $700 $781 $86240% Income Level $420 $450 $540 $623 $695 $76735% Income Level $367 $393 $472 $545 $608 $67130% Income Level $315 $337 $405 $467 $521 $575
Page 6
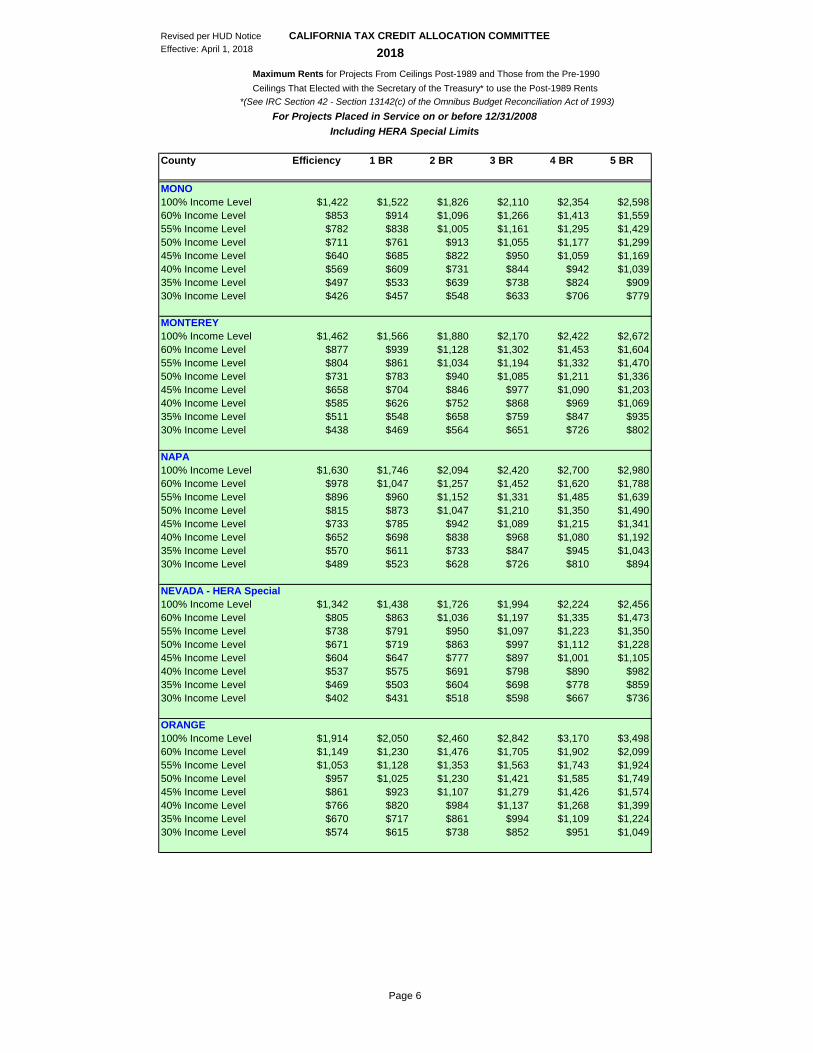
Revised per HUD Notice CALIFORNIA TAX CREDIT ALLOCATION COMMITTEEEffective: April 1, 2018 2018 Maximum Rents for Projects From Ceilings Post-1989 and Those from the Pre-1990 Ceilings That Elected with the Secretary of the Treasury* to use the Post-1989 Rents *(See IRC Section 42 - Section 13142(c) of the Omnibus Budget Reconciliation Act of 1993)
County Efficiency 1 BR 2 BR 3 BR 4 BR 5 BR
For Projects Placed in Service on or before 12/31/2008Including HERA Special Limits
MONO100% Income Level $1,422 $1,522 $1,826 $2,110 $2,354 $2,59860% Income Level $853 $914 $1,096 $1,266 $1,413 $1,55955% Income Level $782 $838 $1,005 $1,161 $1,295 $1,42950% Income Level $711 $761 $913 $1,055 $1,177 $1,29945% Income Level $640 $685 $822 $950 $1,059 $1,16940% Income Level $569 $609 $731 $844 $942 $1,03935% Income Level $497 $533 $639 $738 $824 $90930% Income Level $426 $457 $548 $633 $706 $779
MONTEREY100% Income Level $1,462 $1,566 $1,880 $2,170 $2,422 $2,67260% Income Level $877 $939 $1,128 $1,302 $1,453 $1,60455% Income Level $804 $861 $1,034 $1,194 $1,332 $1,47050% Income Level $731 $783 $940 $1,085 $1,211 $1,33645% Income Level $658 $704 $846 $977 $1,090 $1,20340% Income Level $585 $626 $752 $868 $969 $1,06935% Income Level $511 $548 $658 $759 $847 $93530% Income Level $438 $469 $564 $651 $726 $802
NAPA100% Income Level $1,630 $1,746 $2,094 $2,420 $2,700 $2,98060% Income Level $978 $1,047 $1,257 $1,452 $1,620 $1,78855% Income Level $896 $960 $1,152 $1,331 $1,485 $1,63950% Income Level $815 $873 $1,047 $1,210 $1,350 $1,49045% Income Level $733 $785 $942 $1,089 $1,215 $1,34140% Income Level $652 $698 $838 $968 $1,080 $1,19235% Income Level $570 $611 $733 $847 $945 $1,04330% Income Level $489 $523 $628 $726 $810 $894
NEVADA - HERA Special100% Income Level $1,342 $1,438 $1,726 $1,994 $2,224 $2,45660% Income Level $805 $863 $1,036 $1,197 $1,335 $1,47355% Income Level $738 $791 $950 $1,097 $1,223 $1,35050% Income Level $671 $719 $863 $997 $1,112 $1,22845% Income Level $604 $647 $777 $897 $1,001 $1,10540% Income Level $537 $575 $691 $798 $890 $98235% Income Level $469 $503 $604 $698 $778 $85930% Income Level $402 $431 $518 $598 $667 $736
ORANGE100% Income Level $1,914 $2,050 $2,460 $2,842 $3,170 $3,49860% Income Level $1,149 $1,230 $1,476 $1,705 $1,902 $2,09955% Income Level $1,053 $1,128 $1,353 $1,563 $1,743 $1,92450% Income Level $957 $1,025 $1,230 $1,421 $1,585 $1,74945% Income Level $861 $923 $1,107 $1,279 $1,426 $1,57440% Income Level $766 $820 $984 $1,137 $1,268 $1,39935% Income Level $670 $717 $861 $994 $1,109 $1,22430% Income Level $574 $615 $738 $852 $951 $1,049
Page 7
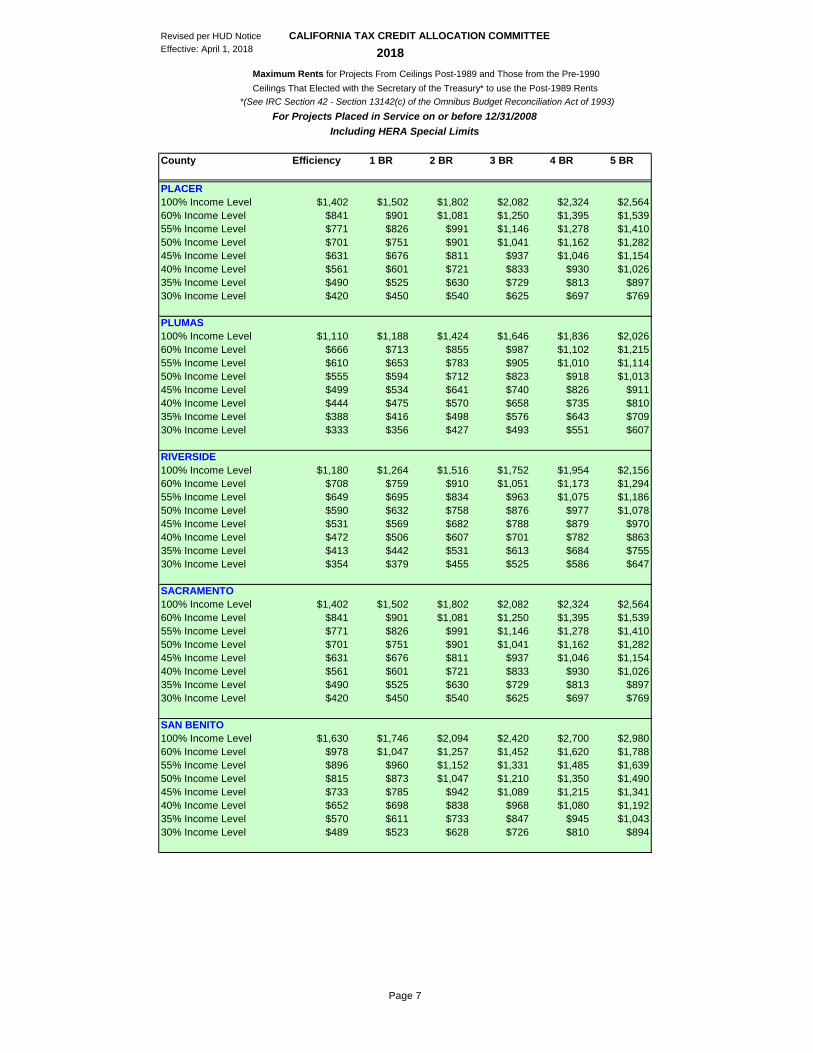
Revised per HUD Notice CALIFORNIA TAX CREDIT ALLOCATION COMMITTEEEffective: April 1, 2018 2018 Maximum Rents for Projects From Ceilings Post-1989 and Those from the Pre-1990 Ceilings That Elected with the Secretary of the Treasury* to use the Post-1989 Rents *(See IRC Section 42 - Section 13142(c) of the Omnibus Budget Reconciliation Act of 1993)
County Efficiency 1 BR 2 BR 3 BR 4 BR 5 BR
For Projects Placed in Service on or before 12/31/2008Including HERA Special Limits
PLACER100% Income Level $1,402 $1,502 $1,802 $2,082 $2,324 $2,56460% Income Level $841 $901 $1,081 $1,250 $1,395 $1,53955% Income Level $771 $826 $991 $1,146 $1,278 $1,41050% Income Level $701 $751 $901 $1,041 $1,162 $1,28245% Income Level $631 $676 $811 $937 $1,046 $1,15440% Income Level $561 $601 $721 $833 $930 $1,02635% Income Level $490 $525 $630 $729 $813 $89730% Income Level $420 $450 $540 $625 $697 $769
PLUMAS100% Income Level $1,110 $1,188 $1,424 $1,646 $1,836 $2,02660% Income Level $666 $713 $855 $987 $1,102 $1,21555% Income Level $610 $653 $783 $905 $1,010 $1,11450% Income Level $555 $594 $712 $823 $918 $1,01345% Income Level $499 $534 $641 $740 $826 $91140% Income Level $444 $475 $570 $658 $735 $81035% Income Level $388 $416 $498 $576 $643 $70930% Income Level $333 $356 $427 $493 $551 $607
RIVERSIDE100% Income Level $1,180 $1,264 $1,516 $1,752 $1,954 $2,15660% Income Level $708 $759 $910 $1,051 $1,173 $1,29455% Income Level $649 $695 $834 $963 $1,075 $1,18650% Income Level $590 $632 $758 $876 $977 $1,07845% Income Level $531 $569 $682 $788 $879 $97040% Income Level $472 $506 $607 $701 $782 $86335% Income Level $413 $442 $531 $613 $684 $75530% Income Level $354 $379 $455 $525 $586 $647
SACRAMENTO100% Income Level $1,402 $1,502 $1,802 $2,082 $2,324 $2,56460% Income Level $841 $901 $1,081 $1,250 $1,395 $1,53955% Income Level $771 $826 $991 $1,146 $1,278 $1,41050% Income Level $701 $751 $901 $1,041 $1,162 $1,28245% Income Level $631 $676 $811 $937 $1,046 $1,15440% Income Level $561 $601 $721 $833 $930 $1,02635% Income Level $490 $525 $630 $729 $813 $89730% Income Level $420 $450 $540 $625 $697 $769
SAN BENITO100% Income Level $1,630 $1,746 $2,094 $2,420 $2,700 $2,98060% Income Level $978 $1,047 $1,257 $1,452 $1,620 $1,78855% Income Level $896 $960 $1,152 $1,331 $1,485 $1,63950% Income Level $815 $873 $1,047 $1,210 $1,350 $1,49045% Income Level $733 $785 $942 $1,089 $1,215 $1,34140% Income Level $652 $698 $838 $968 $1,080 $1,19235% Income Level $570 $611 $733 $847 $945 $1,04330% Income Level $489 $523 $628 $726 $810 $894
Page 8
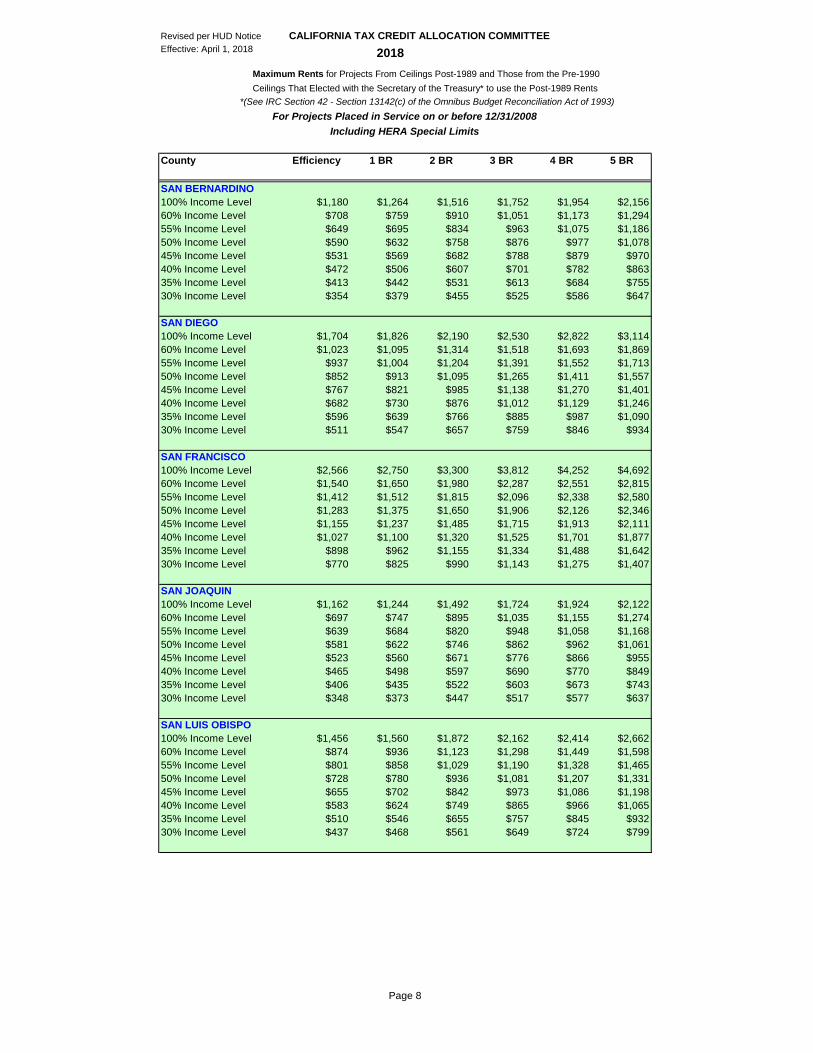
Revised per HUD Notice CALIFORNIA TAX CREDIT ALLOCATION COMMITTEEEffective: April 1, 2018 2018 Maximum Rents for Projects From Ceilings Post-1989 and Those from the Pre-1990 Ceilings That Elected with the Secretary of the Treasury* to use the Post-1989 Rents *(See IRC Section 42 - Section 13142(c) of the Omnibus Budget Reconciliation Act of 1993)
County Efficiency 1 BR 2 BR 3 BR 4 BR 5 BR
For Projects Placed in Service on or before 12/31/2008Including HERA Special Limits
SAN BERNARDINO100% Income Level $1,180 $1,264 $1,516 $1,752 $1,954 $2,15660% Income Level $708 $759 $910 $1,051 $1,173 $1,29455% Income Level $649 $695 $834 $963 $1,075 $1,18650% Income Level $590 $632 $758 $876 $977 $1,07845% Income Level $531 $569 $682 $788 $879 $97040% Income Level $472 $506 $607 $701 $782 $86335% Income Level $413 $442 $531 $613 $684 $75530% Income Level $354 $379 $455 $525 $586 $647
SAN DIEGO100% Income Level $1,704 $1,826 $2,190 $2,530 $2,822 $3,11460% Income Level $1,023 $1,095 $1,314 $1,518 $1,693 $1,86955% Income Level $937 $1,004 $1,204 $1,391 $1,552 $1,71350% Income Level $852 $913 $1,095 $1,265 $1,411 $1,55745% Income Level $767 $821 $985 $1,138 $1,270 $1,40140% Income Level $682 $730 $876 $1,012 $1,129 $1,24635% Income Level $596 $639 $766 $885 $987 $1,09030% Income Level $511 $547 $657 $759 $846 $934
SAN FRANCISCO 100% Income Level $2,566 $2,750 $3,300 $3,812 $4,252 $4,69260% Income Level $1,540 $1,650 $1,980 $2,287 $2,551 $2,81555% Income Level $1,412 $1,512 $1,815 $2,096 $2,338 $2,58050% Income Level $1,283 $1,375 $1,650 $1,906 $2,126 $2,34645% Income Level $1,155 $1,237 $1,485 $1,715 $1,913 $2,11140% Income Level $1,027 $1,100 $1,320 $1,525 $1,701 $1,87735% Income Level $898 $962 $1,155 $1,334 $1,488 $1,64230% Income Level $770 $825 $990 $1,143 $1,275 $1,407
SAN JOAQUIN100% Income Level $1,162 $1,244 $1,492 $1,724 $1,924 $2,12260% Income Level $697 $747 $895 $1,035 $1,155 $1,27455% Income Level $639 $684 $820 $948 $1,058 $1,16850% Income Level $581 $622 $746 $862 $962 $1,06145% Income Level $523 $560 $671 $776 $866 $95540% Income Level $465 $498 $597 $690 $770 $84935% Income Level $406 $435 $522 $603 $673 $74330% Income Level $348 $373 $447 $517 $577 $637
SAN LUIS OBISPO100% Income Level $1,456 $1,560 $1,872 $2,162 $2,414 $2,66260% Income Level $874 $936 $1,123 $1,298 $1,449 $1,59855% Income Level $801 $858 $1,029 $1,190 $1,328 $1,46550% Income Level $728 $780 $936 $1,081 $1,207 $1,33145% Income Level $655 $702 $842 $973 $1,086 $1,19840% Income Level $583 $624 $749 $865 $966 $1,06535% Income Level $510 $546 $655 $757 $845 $93230% Income Level $437 $468 $561 $649 $724 $799
Page 9
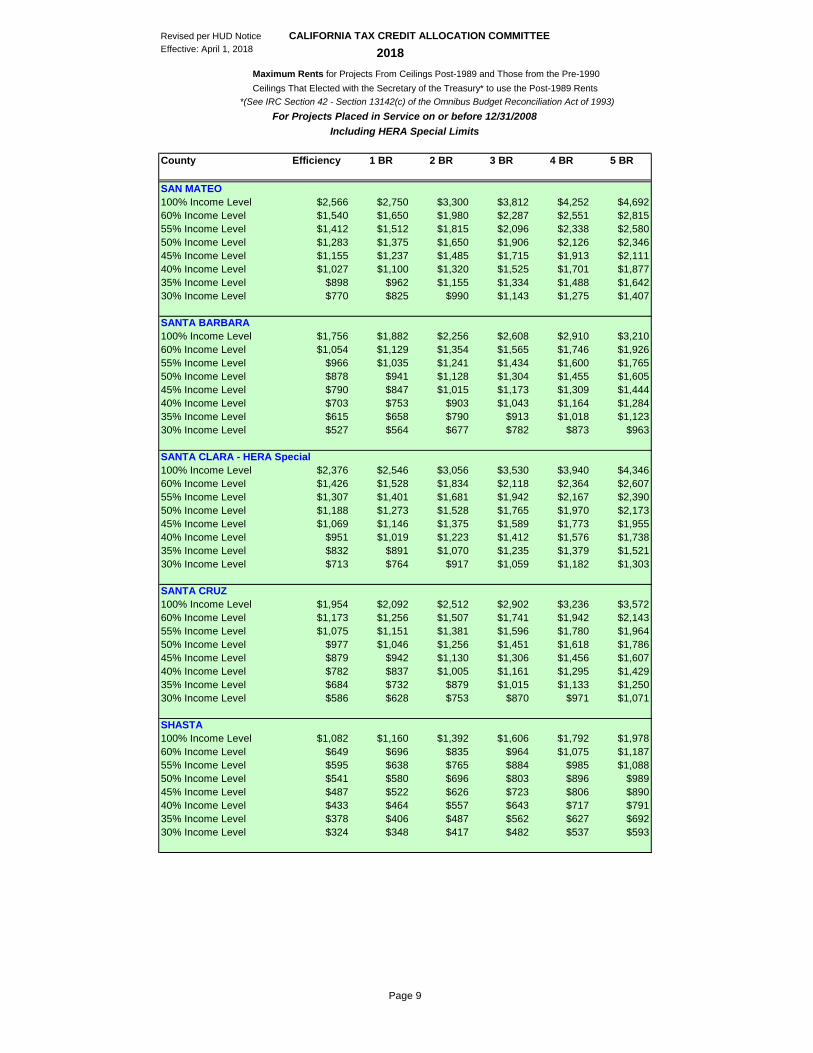
Revised per HUD Notice CALIFORNIA TAX CREDIT ALLOCATION COMMITTEEEffective: April 1, 2018 2018 Maximum Rents for Projects From Ceilings Post-1989 and Those from the Pre-1990 Ceilings That Elected with the Secretary of the Treasury* to use the Post-1989 Rents *(See IRC Section 42 - Section 13142(c) of the Omnibus Budget Reconciliation Act of 1993)
County Efficiency 1 BR 2 BR 3 BR 4 BR 5 BR
For Projects Placed in Service on or before 12/31/2008Including HERA Special Limits
SAN MATEO 100% Income Level $2,566 $2,750 $3,300 $3,812 $4,252 $4,69260% Income Level $1,540 $1,650 $1,980 $2,287 $2,551 $2,81555% Income Level $1,412 $1,512 $1,815 $2,096 $2,338 $2,58050% Income Level $1,283 $1,375 $1,650 $1,906 $2,126 $2,34645% Income Level $1,155 $1,237 $1,485 $1,715 $1,913 $2,11140% Income Level $1,027 $1,100 $1,320 $1,525 $1,701 $1,87735% Income Level $898 $962 $1,155 $1,334 $1,488 $1,64230% Income Level $770 $825 $990 $1,143 $1,275 $1,407
SANTA BARBARA100% Income Level $1,756 $1,882 $2,256 $2,608 $2,910 $3,21060% Income Level $1,054 $1,129 $1,354 $1,565 $1,746 $1,92655% Income Level $966 $1,035 $1,241 $1,434 $1,600 $1,76550% Income Level $878 $941 $1,128 $1,304 $1,455 $1,60545% Income Level $790 $847 $1,015 $1,173 $1,309 $1,44440% Income Level $703 $753 $903 $1,043 $1,164 $1,28435% Income Level $615 $658 $790 $913 $1,018 $1,12330% Income Level $527 $564 $677 $782 $873 $963
SANTA CLARA - HERA Special100% Income Level $2,376 $2,546 $3,056 $3,530 $3,940 $4,34660% Income Level $1,426 $1,528 $1,834 $2,118 $2,364 $2,60755% Income Level $1,307 $1,401 $1,681 $1,942 $2,167 $2,39050% Income Level $1,188 $1,273 $1,528 $1,765 $1,970 $2,17345% Income Level $1,069 $1,146 $1,375 $1,589 $1,773 $1,95540% Income Level $951 $1,019 $1,223 $1,412 $1,576 $1,73835% Income Level $832 $891 $1,070 $1,235 $1,379 $1,52130% Income Level $713 $764 $917 $1,059 $1,182 $1,303
SANTA CRUZ100% Income Level $1,954 $2,092 $2,512 $2,902 $3,236 $3,57260% Income Level $1,173 $1,256 $1,507 $1,741 $1,942 $2,14355% Income Level $1,075 $1,151 $1,381 $1,596 $1,780 $1,96450% Income Level $977 $1,046 $1,256 $1,451 $1,618 $1,78645% Income Level $879 $942 $1,130 $1,306 $1,456 $1,60740% Income Level $782 $837 $1,005 $1,161 $1,295 $1,42935% Income Level $684 $732 $879 $1,015 $1,133 $1,25030% Income Level $586 $628 $753 $870 $971 $1,071
SHASTA100% Income Level $1,082 $1,160 $1,392 $1,606 $1,792 $1,97860% Income Level $649 $696 $835 $964 $1,075 $1,18755% Income Level $595 $638 $765 $884 $985 $1,08850% Income Level $541 $580 $696 $803 $896 $98945% Income Level $487 $522 $626 $723 $806 $89040% Income Level $433 $464 $557 $643 $717 $79135% Income Level $378 $406 $487 $562 $627 $69230% Income Level $324 $348 $417 $482 $537 $593
Page 10
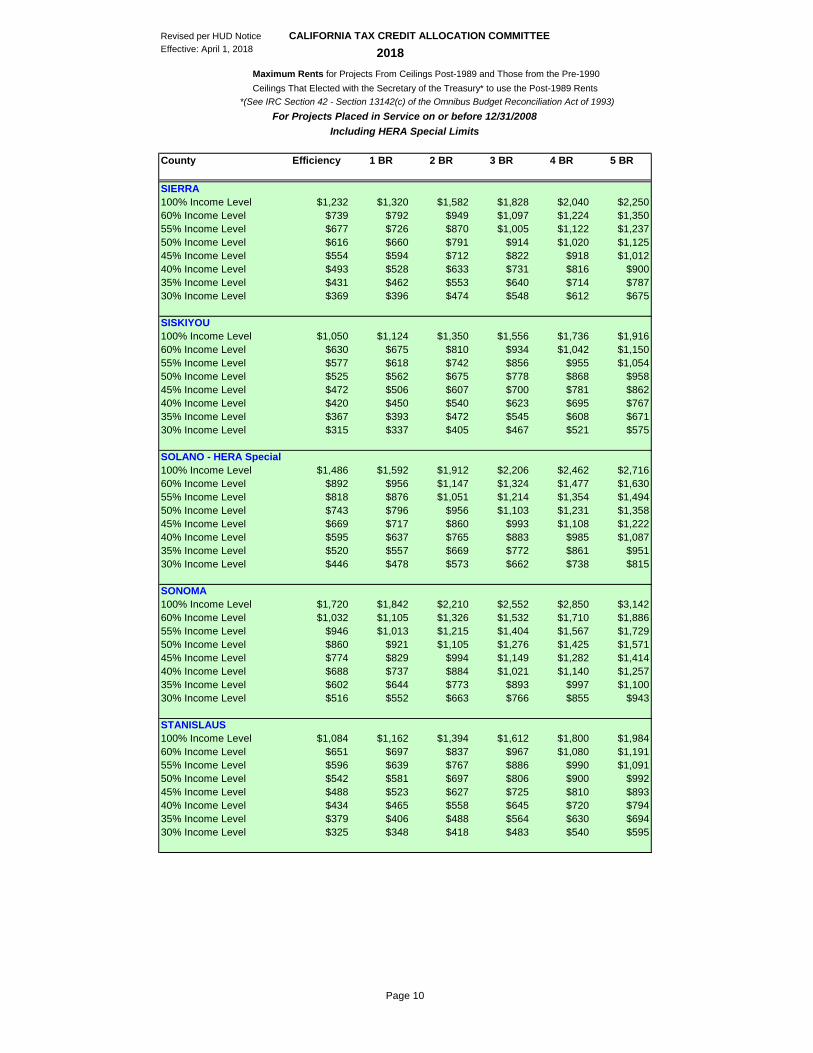
Revised per HUD Notice CALIFORNIA TAX CREDIT ALLOCATION COMMITTEEEffective: April 1, 2018 2018 Maximum Rents for Projects From Ceilings Post-1989 and Those from the Pre-1990 Ceilings That Elected with the Secretary of the Treasury* to use the Post-1989 Rents *(See IRC Section 42 - Section 13142(c) of the Omnibus Budget Reconciliation Act of 1993)
County Efficiency 1 BR 2 BR 3 BR 4 BR 5 BR
For Projects Placed in Service on or before 12/31/2008Including HERA Special Limits
SIERRA100% Income Level $1,232 $1,320 $1,582 $1,828 $2,040 $2,25060% Income Level $739 $792 $949 $1,097 $1,224 $1,35055% Income Level $677 $726 $870 $1,005 $1,122 $1,23750% Income Level $616 $660 $791 $914 $1,020 $1,12545% Income Level $554 $594 $712 $822 $918 $1,01240% Income Level $493 $528 $633 $731 $816 $90035% Income Level $431 $462 $553 $640 $714 $78730% Income Level $369 $396 $474 $548 $612 $675
SISKIYOU100% Income Level $1,050 $1,124 $1,350 $1,556 $1,736 $1,91660% Income Level $630 $675 $810 $934 $1,042 $1,15055% Income Level $577 $618 $742 $856 $955 $1,05450% Income Level $525 $562 $675 $778 $868 $95845% Income Level $472 $506 $607 $700 $781 $86240% Income Level $420 $450 $540 $623 $695 $76735% Income Level $367 $393 $472 $545 $608 $67130% Income Level $315 $337 $405 $467 $521 $575
SOLANO - HERA Special100% Income Level $1,486 $1,592 $1,912 $2,206 $2,462 $2,71660% Income Level $892 $956 $1,147 $1,324 $1,477 $1,63055% Income Level $818 $876 $1,051 $1,214 $1,354 $1,49450% Income Level $743 $796 $956 $1,103 $1,231 $1,35845% Income Level $669 $717 $860 $993 $1,108 $1,22240% Income Level $595 $637 $765 $883 $985 $1,08735% Income Level $520 $557 $669 $772 $861 $95130% Income Level $446 $478 $573 $662 $738 $815
SONOMA 100% Income Level $1,720 $1,842 $2,210 $2,552 $2,850 $3,14260% Income Level $1,032 $1,105 $1,326 $1,532 $1,710 $1,88655% Income Level $946 $1,013 $1,215 $1,404 $1,567 $1,72950% Income Level $860 $921 $1,105 $1,276 $1,425 $1,57145% Income Level $774 $829 $994 $1,149 $1,282 $1,41440% Income Level $688 $737 $884 $1,021 $1,140 $1,25735% Income Level $602 $644 $773 $893 $997 $1,10030% Income Level $516 $552 $663 $766 $855 $943
STANISLAUS100% Income Level $1,084 $1,162 $1,394 $1,612 $1,800 $1,98460% Income Level $651 $697 $837 $967 $1,080 $1,19155% Income Level $596 $639 $767 $886 $990 $1,09150% Income Level $542 $581 $697 $806 $900 $99245% Income Level $488 $523 $627 $725 $810 $89340% Income Level $434 $465 $558 $645 $720 $79435% Income Level $379 $406 $488 $564 $630 $69430% Income Level $325 $348 $418 $483 $540 $595
Page 11
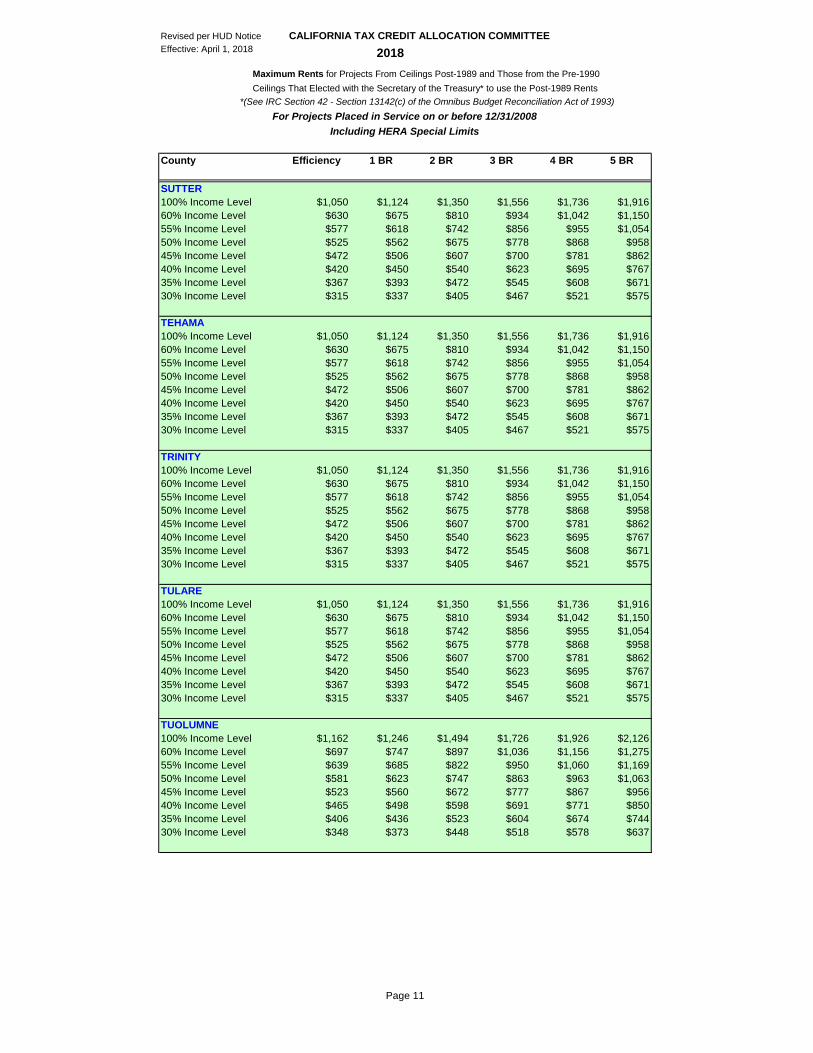
Revised per HUD Notice CALIFORNIA TAX CREDIT ALLOCATION COMMITTEEEffective: April 1, 2018 2018 Maximum Rents for Projects From Ceilings Post-1989 and Those from the Pre-1990 Ceilings That Elected with the Secretary of the Treasury* to use the Post-1989 Rents *(See IRC Section 42 - Section 13142(c) of the Omnibus Budget Reconciliation Act of 1993)
County Efficiency 1 BR 2 BR 3 BR 4 BR 5 BR
For Projects Placed in Service on or before 12/31/2008Including HERA Special Limits
SUTTER100% Income Level $1,050 $1,124 $1,350 $1,556 $1,736 $1,91660% Income Level $630 $675 $810 $934 $1,042 $1,15055% Income Level $577 $618 $742 $856 $955 $1,05450% Income Level $525 $562 $675 $778 $868 $95845% Income Level $472 $506 $607 $700 $781 $86240% Income Level $420 $450 $540 $623 $695 $76735% Income Level $367 $393 $472 $545 $608 $67130% Income Level $315 $337 $405 $467 $521 $575
TEHAMA100% Income Level $1,050 $1,124 $1,350 $1,556 $1,736 $1,91660% Income Level $630 $675 $810 $934 $1,042 $1,15055% Income Level $577 $618 $742 $856 $955 $1,05450% Income Level $525 $562 $675 $778 $868 $95845% Income Level $472 $506 $607 $700 $781 $86240% Income Level $420 $450 $540 $623 $695 $76735% Income Level $367 $393 $472 $545 $608 $67130% Income Level $315 $337 $405 $467 $521 $575
TRINITY100% Income Level $1,050 $1,124 $1,350 $1,556 $1,736 $1,91660% Income Level $630 $675 $810 $934 $1,042 $1,15055% Income Level $577 $618 $742 $856 $955 $1,05450% Income Level $525 $562 $675 $778 $868 $95845% Income Level $472 $506 $607 $700 $781 $86240% Income Level $420 $450 $540 $623 $695 $76735% Income Level $367 $393 $472 $545 $608 $67130% Income Level $315 $337 $405 $467 $521 $575
TULARE100% Income Level $1,050 $1,124 $1,350 $1,556 $1,736 $1,91660% Income Level $630 $675 $810 $934 $1,042 $1,15055% Income Level $577 $618 $742 $856 $955 $1,05450% Income Level $525 $562 $675 $778 $868 $95845% Income Level $472 $506 $607 $700 $781 $86240% Income Level $420 $450 $540 $623 $695 $76735% Income Level $367 $393 $472 $545 $608 $67130% Income Level $315 $337 $405 $467 $521 $575
TUOLUMNE100% Income Level $1,162 $1,246 $1,494 $1,726 $1,926 $2,12660% Income Level $697 $747 $897 $1,036 $1,156 $1,27555% Income Level $639 $685 $822 $950 $1,060 $1,16950% Income Level $581 $623 $747 $863 $963 $1,06345% Income Level $523 $560 $672 $777 $867 $95640% Income Level $465 $498 $598 $691 $771 $85035% Income Level $406 $436 $523 $604 $674 $74430% Income Level $348 $373 $448 $518 $578 $637
Page 12
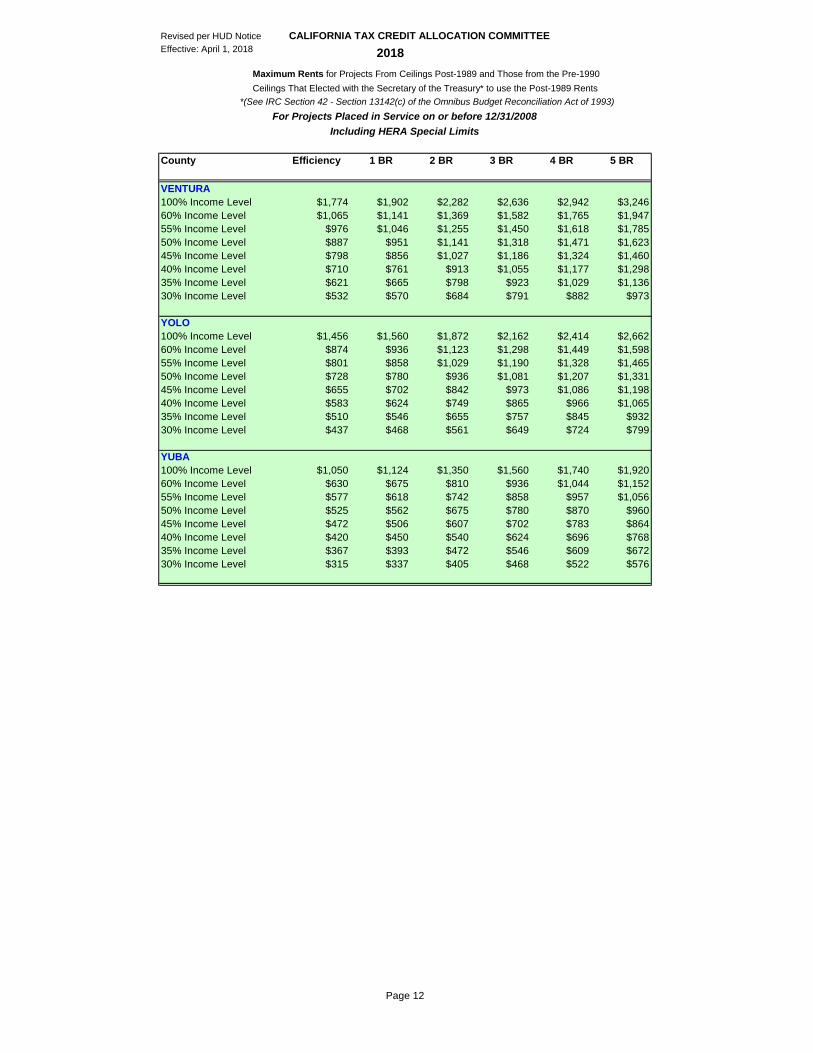
Revised per HUD Notice CALIFORNIA TAX CREDIT ALLOCATION COMMITTEEEffective: April 1, 2018 2018 Maximum Rents for Projects From Ceilings Post-1989 and Those from the Pre-1990 Ceilings That Elected with the Secretary of the Treasury* to use the Post-1989 Rents *(See IRC Section 42 - Section 13142(c) of the Omnibus Budget Reconciliation Act of 1993)
County Efficiency 1 BR 2 BR 3 BR 4 BR 5 BR
For Projects Placed in Service on or before 12/31/2008Including HERA Special Limits
VENTURA 100% Income Level $1,774 $1,902 $2,282 $2,636 $2,942 $3,24660% Income Level $1,065 $1,141 $1,369 $1,582 $1,765 $1,94755% Income Level $976 $1,046 $1,255 $1,450 $1,618 $1,78550% Income Level $887 $951 $1,141 $1,318 $1,471 $1,62345% Income Level $798 $856 $1,027 $1,186 $1,324 $1,46040% Income Level $710 $761 $913 $1,055 $1,177 $1,29835% Income Level $621 $665 $798 $923 $1,029 $1,13630% Income Level $532 $570 $684 $791 $882 $973
YOLO100% Income Level $1,456 $1,560 $1,872 $2,162 $2,414 $2,66260% Income Level $874 $936 $1,123 $1,298 $1,449 $1,59855% Income Level $801 $858 $1,029 $1,190 $1,328 $1,46550% Income Level $728 $780 $936 $1,081 $1,207 $1,33145% Income Level $655 $702 $842 $973 $1,086 $1,19840% Income Level $583 $624 $749 $865 $966 $1,06535% Income Level $510 $546 $655 $757 $845 $93230% Income Level $437 $468 $561 $649 $724 $799
YUBA100% Income Level $1,050 $1,124 $1,350 $1,560 $1,740 $1,92060% Income Level $630 $675 $810 $936 $1,044 $1,15255% Income Level $577 $618 $742 $858 $957 $1,05650% Income Level $525 $562 $675 $780 $870 $96045% Income Level $472 $506 $607 $702 $783 $86440% Income Level $420 $450 $540 $624 $696 $76835% Income Level $367 $393 $472 $546 $609 $67230% Income Level $315 $337 $405 $468 $522 $576