1 | Bioenergy Technologies Office
23
1 | Bioenergy Technologies Office eere.energy.gov 2013 DOE Bioenergy Technologies Office (BETO) Project Peer Review 2.6.1.2 Analysis for Production - Technical & Market May 20, 2013 Technology Area Review: Biochemical Conversion Sue Jones, Aye Meyer Organization: Pacific Northwest National Laboratory PNNL-SA-95160 This presentation does not contain any proprietary, confidential, or otherwise restricted information
Transcript of 1 | Bioenergy Technologies Office

1 | Bioenergy Technologies Office eere.energy.gov
2013 DOE Bioenergy Technologies Office
(BETO) Project Peer Review
2.6.1.2 Analysis for Production
- Technical & Market
May 20, 2013
Technology Area Review: Biochemical Conversion
Sue Jones, Aye Meyer
Organization: Pacific Northwest National Laboratory PNNL-SA-95160
This presentation does not contain any proprietary, confidential, or otherwise restricted information

2 | Bioenergy Technologies Office eere.energy.gov
Goal Statement
• Support the DOE Bioenergy Technologies Office’s goal to reduce the estimated mature technology processing cost for converting cellulosic feedstocks to hydrocarbon fuels via biochemical and catalytic means by developing analysis tools and techno-economics to identify pathways with the potential to meet the $3/gallon gasoline equivalent target
• Perform analysis as requested by the Biochemical and Catalytic Conversion Technology Area

3 | Bioenergy Technologies Office eere.energy.gov
Quad Chart Overview
• Project start date: FY03
• Project end date: FY15
• FY11-FY12 100% complete, FY13 50% complete
• At-A. Lack of Comparable, Transparent, and Reproducible Analysis
• Bt-J. Catalyst Development
• Bt-K. Biochemical Conversion Process Integration
• Funding for FY11: $250k
• Funding for FY12: $270k
• Funding for FY13: $190k
• 11 years funding at an average
of $328k/year
Timeline
Budget
Barriers
• INL for modeled feedstock costs
• NREL for consistent modeling assumptions and work on Tech Memos
• Project management – communication as needed with other labs, and DOE
Partners

4 | Bioenergy Technologies Office eere.energy.gov
Project Overview
History
• FY03-07: Products focus -“Top 10” products from biomass report, Products from lignin report, Co-products analysis in a biorefinery
• FY08-11: Economics of ethanol production via fungal organisms
• FY10-12: Economics of co-products, economics of microbial production of hydrocarbon compatible fuels
• FY13: Preliminary metabolic modeling of oleaginous organisms to support understanding of hydrocarbon production
Context
• BETO’s portfolio has expanded to include hydrocarbon fuels
• Need for preliminary analysis of candidate technology pathways
Objective
Focusing on fungal processing, the objective is to provide economics and gap analysis in support of the BETO goals to enable the production of renewable transportation fuels, particularly, gasoline, diesel and jet blendstocks

5 | Bioenergy Technologies Office eere.energy.gov
Approach
TECHNICAL APPROACH • Quick screening, then detailed
analysis
• Iterative process
• Sensitivity analysis to understand variance & significant impact areas
• Results used to measure progress towards research goals
MANAGEMENT APPROACH Develop project management plans
• Statement of work and how it relates to DOE goals
• Quarterly milestones to minimize project slippage
• Go/No Go decision point
Frequent project communications
• Telecons with platform leads and labs – share information, use consistent assumptions
• Quarterly formal reporting to HQ
Input from
researchers,
clients, literature
Metabolic & Process Modeling
Economics & sustainability
Excel, Chemcad,
Aspen
quick analysis for Go/No Go
GOAL
Guide
Research
NEW PROCESS,
FUEL, PRODUCT

6 | Bioenergy Technologies Office eere.energy.gov
This project has three separate analysis tasks:
• Task 1: Screening economics for production of co-products in an ethanol biorefinery (FY11&12)
• Potential chemical candidates
• Avoidance of chemical market saturation
• Task 2: Screening economics for hydrocarbon production through an oleaginous organism and determination of maximum practical yield (FY12 &13)
• Preliminary economic model
• Metabolic modeling coupled with experimental work (from a separate project) to inform the economic model
• Task 3: This project also partially funded the analysis and document preparation for the BETO pathways analysis for sugars conversion (FY13)
Technical Accomplishments / Progress / Results

7 | Bioenergy Technologies Office eere.energy.gov
TASK 1: Co-Products in an Ethanol Refinery
Enzymatic hydrolyzate slipstream (10-20%) used for co-product production. Four non-food, non-pharmaceutical organic acids produced.
Acids produced in blocked continuous fashion. Equipment added for chemical production and storage.
Basis: 2011 Biochemical Ethanol Report (Humbird et al) and organic acid conversion data from literature. Analysis in 2007$.
On-site Enzyme
Production
Enzyme Hydrolysis
Ethanol Fermentation
Distillation+ Mol. Sieves
+ Solid Separation
Steam and Electricity
Generation
Wastewater Pretreatment
Feed HandlingDilute Acid
Pretreatment and Conditioning
Biogas
Crude Enzyme
Process Steam
Electricity
Corn Stover2000 mtpd
Seed cultivation
Inoculum
Process water
Steam
Sulfuric acid
Ammonia
Glucose
Nutrients
Pretreated corn stover
Organic Acid Fermentation
and Purification
Slipstream
Organic acid co-products
Ethanol
Solid slurry (cell mass+lignin)
Nutrients
Nutrients
Nutrients
Wastewater Wastewater
Solid slurry (lignin+cell mass+syrup)
A700Product and Feed Chemical Storage
A900
Utilities
A100A200
A400
A300
A1000
A800
A600
A500
Technical Accomplishments Task 1

8 | Bioenergy Technologies Office eere.energy.gov
Acids chosen as examples of good match between market size and productivities
Technical Accomplishments Task 1 - Results
Ethanol production 52 mm gal/yr
Ethanol Yield per feedstock 67 gal/dry ton
Total co-product production 77 mm lb/year
Citric acid: 20.1 106 lb/yr Itaconic acid: 13.5 x 10⁶ lb/yr
Lactic acid: 18.8 106 lb/yr Succinic acid: 24.6 x 10⁶ lb/yr
Key Outcomes:
10-20% hydrolysate slipstream diverted to chemicals production has potential to reduce ethanol costs by $0.15-0.45/gal
Additional capital offset by co-product value
Multiple co-products prevent market saturation

9 | Bioenergy Technologies Office eere.energy.gov
Basis: 2011 NREL Biochem Ethanol Report. 2011$
Yields and product recovery from literature:
Base case lipid yield = 0.17 g oil/g sugar produces 25 gallons of hydrocarbon/dry short ton of biomass
Technical Accomplishments Task 2
Task 2: Hydrocarbons from Oleaginous Yeast
Relevance:
1st look at oleaginous yeast pathway
Model will be updated in FY13 with experimental results

10 | Bioenergy Technologies Office eere.energy.gov
Improvements needed to reach $5/gal: • Improve lipid yield
• Increase tolerance to inhibitors (such as substrates, intermediates and products)
• Reduce aeration & nutrients
• Reduce fermentation time
• Auto-release triglyceride
• Produce products in middle distillate range, e.g. C14
Lignin usage for fuel or products needed to reach $3/gal
Literature Based Screening Economics
Technical Accomplishments Task 2 - Results
HT = hydrotreating, WHSV=HT weight hourly space velocity
Conclusions: yield and carbon usage dominate costs – FY13 modeling and experimental work will provide directions for improvement
11 | Bioenergy Technologies Office eere.energy.gov
101
840
AREA 100
Feed Handling
M104 - M105
201
104
2201
2232
232
P-201
T-201
5516Vent
2203
2217
203
T-20 3
M-203
215
105
M-206
202
QM-204
M-207 207
204
T-204
2209
T-209
273
A-2 0 1
2011
2012
224
213
222
P2 03 - P2 08
223
209
228
275
254 227
217
225
2013
12
252H-244
255
CWS
CWR
1244
1245
2252
253
AREA 200 Pretreatment and Conditioning
2215
710
Acid P r etr eatm ent
Conditioning
St i rred tankSt i rred tank
T-310
310
P-306
306
T-306
CSL
DAP
301
P301-P302
312
311
3304
AREA 300 Fermentation and Oil Separation
S acchar ification
S eed cultivation
Fer m entation
H-301
211212
203
214
307
23Air450 454
NH3
SO2
CSL
401
F-401
P-401
4401
407
408
453
F-400400
T-405
405
401
Glucose
Process H2O
27
4402
402
409
406
405
404
435 VENT
Cellulase P r oduction
Cellulase S eed Pr od.
AREA 400 Cellulase Product Fermentation
P-40 5
4405
443
440
CSL
CNUTR
T-406
400
P-406
406
4406
4164416
410
442
441
SO2
NH3
302
P-31 0
3310
H-310
3306
306
H-300
1304
1305
3000
13011300
420
Filt ration
AREA 500 Hydrotreating and Product Separation
403
4421
6602
903
Wel l water
45
260
To WWT
606
T-606
CIP
6606
603
604 605
6602
Anaerobic
S611-Fi l ter
611
B-60 6
6061
T-608 608
Biomass prod
44609
611
6608
VENT
630
632
Caustic
631
621
617
Aerobic
13
16
622
Air
Biomass prod
630
609
625
6609
P-609
Fi l ter R-609620
6616
P-616
6620
624
6610
613
602
AREA 600 Wastewater Treatment2260
8821
6624
S-610 6100
B-14
6282
6281
B-1 3
6629
RO629
B-106010B-12
640
614
B-4A
6007
628
6008
B-821
606
6005
B-3A
6003
M -64 0C
640
6012
6015
627Brine6007
6607
EVAP
HC from SCO fermentation
Front End as in Biochem 2011 Design Case
2,000 metric ton/day corn stover
Sludge
Area 800 Combustor and Steam Turbine
T 114 C
P 62.2 atm
W 340000 kg/h
T 277
P 13.0
T 27
P 1.0
T 28
P 1.0
T 165
P 60.5
T 165
P 60.5
To S 216To S 215
T 246 C
P 9.5 atm
W 104 kg/ h
804
803
815
820
830
831
835
806
811
863
861851
852
853
868
828
65 67
68
69
70
8817
8823
8812 815
8816
872
849
39
25
615
B iogas
8022
623To M -803
WWT Sludge
Lignin
600
T 117
P 13.0
H-801
H-811
8818 T 277
P 60.5 31
821 T 2 7 7
P 6 1
806
8049
30
T 5 5 7
P 1
805 T 870
P 1.0
814888
778216
8215
8814
S team user8811
P-811
8152
8151
863
T804
P-804
8161
H-812
8812
T-826
P-826
826
8826 8130
812
BFW
T 8 2 4
P 1
T-828
8211
8212
From S8211
62
8813
8150
T 113
P 62
W 340000
T 33
P 5
W 34600
822
8811
8805
8806
8807
216
218
83
250
2218
2812 H-812
862
251
W 7735 kg/ h
W 772 050 kg/ h
3100
3060
1310
1312
CWS
CWR
W 6 0 2 3 9 2 k g / h
W 220 603 kg/ h
M-401
451 452
1401 CWS
1402
CWR W 134 579 kg/ h
HP steam
HP steam
5501
M-811 cond
865
8153
816
1811
1812
CWS
CWR
304
F-300 coi ls
8803
8043
8044
6623
T 192
P 1.0
92
To S904
626
904
9944
Process H2O
Process H2O
NH3
CWS
CWR
301
F-301 coi ls
3011
1320 1321
1322
4420
Chi l led H2O
310195
Chi l led H2O
1330
1331
1332
T-310 Coi ls
3310
974400
44014400 4403
F400,F401 coi ls
98
VENT
423
4423
Chilled H2 O
W 155 8484 1 kg / h
LP STEAM USED FOR EVAP.
6640
To 6640
From 640
To S8821
BFW MU
811
4000
274
To part icul ate removal
AIR
309
CSL
303
DAP 3301310
60
F-301
F-300
550
H 2581 582
583
5800 5801 5802 5803
551
584
5804
T 40 8
P 7
T 15 0
P 7
T 31 9
P 19
T 15 0
P 19
Guard Bed
51 09
51 02
H ydrotreat ing
11 1
63AIR
30 0
30 0
33 00
33 17
31 5
Fe rm enting glucose
Fe rm enting xy los e
33 0111 3
33 0233 0333 04
Fe rm enting minor s ugars and suga r poly m ers
VENT
31 51
31 5231 5331 54
31 55
31 5633 05
33 6
33 06 33 0833 0731 57 31 59
Ga la ctose
M annoseArabinose
13 03
Glu Olig .
Xy lo Ol ig. Ga la c Olig . M ann Olig . Arabi Olig .
LP STM
560
TO W W T
5530535
572
P-530
To Combusto
121TO B U R N ER
H-201
H-201
H 2SO4 Sol.
80
AIR
78
79
70
571
Lignin+Bioma
81
82
86
501
Solvent Extraction
Solvent Evapolat ion
83
89
LP STEAM
585 T 36 2
P 59
5100
340
343
345
348 349
823
3350
350
351
3351
351
352
Hexane Recyc led
M U HEXANE
560
17
3501
3502
3505
35573558
3507
3559
5800
599
Air
Biogas
8021
804
5560
6615
596
597
5599
D iesel
99% of theoretical maximum
FROM HT
5571
813
318
319320321322
325
33093311331233133314324
Ce llu loseXy la nGa la ctoseM annoseArabinose
W 385000
BFW
20601
P-602
C-502C-501
P-209+239
31
8040
T 436 C
P 1.0 atm
W 497484 kg/h
M -804 FAN
T 139
P 3
305
570
549551
553
550
T 323
P 59
T 380
P 59
T 523
P 59
T 140
P 58
T 294
P 59
W 8823.11
552
541
14
540
593
TO WWT
552
From Str 94
T 464
P 59
580
32 36
92 7
Air for
Fermenta tion and Seed Culv ita tion
5100
P-610
33
544 15
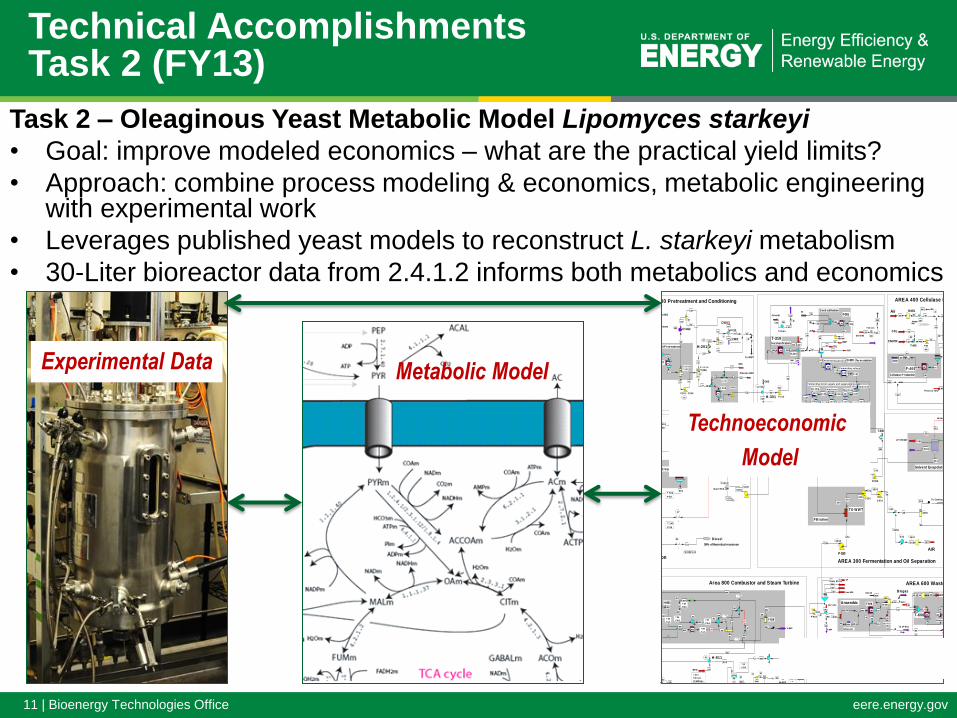
Technical Accomplishments Task 2 (FY13)
Task 2 – Oleaginous Yeast Metabolic Model Lipomyces starkeyi
• Goal: improve modeled economics – what are the practical yield limits?
• Approach: combine process modeling & economics, metabolic engineering with experimental work
• Leverages published yeast models to reconstruct L. starkeyi metabolism
• 30-Liter bioreactor data from 2.4.1.2 informs both metabolics and economics
Experimental Data Metabolic Model
Technoeconomic
Model

12 | Bioenergy Technologies Office eere.energy.gov
Network Reactions and Genes Stoichiometric matrix
Technical Accomplishments Task 2 (FY13)
Metabolic Network Modeling Methods
• Constraint-based reconstruction and analysis (COBRA) approach is being used.
• COBRA integrates metabolic network stoichiometry into a system of linear equations.
• The COBRA Toolbox provides a MATLAB-based simulation environment for predicting
optimal distributions of mass fluxes within the metabolic network that maximize an
objective function (typically, cell growth and/or specific metabolite production).
• The stoichiometric matrix and constraints on nutrients and excreted metabolites (from
experimental data) determine the flux predictions (such as for lipid accumulation).
• Becker SA, Feist AM, Mo ML, Hannum G, Palsson BØ, Herrgard MJ. Nature Protocols 2007;2(3):727-38.
• Schellenberger J, Que R, et al., Nature Protocols. 2011 Aug 4;6(9):1290-307.
Reactions
Me
tab
oli
tes
atp[c] + D-glucose[c] -> h[c] + g6p[c] + adp[c]
(YALI0B22308g or YALI0E15488g or
YALI0E20207g)
g6p[c] <=> f6p[c]
YALI0F07711g
atp[c] + f6p[c] -> h[c] + fdp[c] + adp[c]
YALI0D16357g
fdp[c] <=> g3p[c] + dhap[c]
YALI0E26004g

13 | Bioenergy Technologies Office eere.energy.gov
Technical Accomplishments Task 2 (FY13)
Pathway Tools DB for metabolic network curation
L. starkeyi Metabolic Modeling Progress to Date
• Developed Pathway Tools database:
organizes L. starkeyi genes, enzymes, reactions, and metabolites for metabolic network curation
• Leveraged published models: Orthologous Markov Clustering matched L. starkeyi enzymes with enzymatic reactions within previously published COBRA models for the yeasts: Y. lipolytica, S. cerevisiae, S. stipitis, and P. pastoris
Next Steps: Finish integration of preliminary metabolic network and new experimental into full COBRA model for L. starkeyi to
• Predict optimal carbon yield
• Guide metabolic engineering
Key Project Outcome: Enable timely progress towards solving the complex problem of maximizing carbon yield to fuels

14 | Bioenergy Technologies Office eere.energy.gov
Task 3 Pathways Analysis
• FY12 NREL and PNNL
collaboration to perform analysis
for hydrocarbon biofuels pathways
• Integrated efforts with INL for
feedstock interface and costs
• Vetted assumptions and basis with
researchers and scientist for
pathways
• DOE BETO selected 2 sugars
based pathways for further
development; published as Tech
Memos
Technical Accomplishments Task 3

15 | Bioenergy Technologies Office eere.energy.gov
Milestones/Metrics and Progress
Title/Description Due Date Completed
Complete Screening for co-product routes that meet the 2012 Reference Case
target of $2/gal of Ethanol
31 Dec 2011
Completed model for fungal base co-products production with goals to meet the
2012 target of $2/gal Ethanol
31 Mar 2012
Complete model for hydrocarbon production via biochemical route to assess
potential for meeting the 2017 target of $3/gal gasoline
30 Jun 2012
Complete sensitivity analysis for both cases to identify research needs which
meet reference case targets
30 Sep 2012
Complete the generation of a pathway-genome database for L. starkeyi,
comparative analysis with other members of the Saccharomycotina fungi, and
draft metabolic network reconstruction
31 Dec 2012
Complete refinement of L. starkeyi central metabolism pathways 31 Mar 2013
Complete refinement of L. starkeyi fatty acid synthesis pathways 30 Jun 2013 On schedule
Complete preliminary TEA for L. starkeyi based process and improvements
leading to $3/gal gasoline equivalent
30 Sep 2013 On schedule
Complete analysis reports and models, create draft manuscript 30 Sep 2013 On schedule

16 | Bioenergy Technologies Office eere.energy.gov
Relevance
• Directly supports the Bioenergy Technologies Office development of new pathways and technical targets for the 2017 to 2022 timeframe
• Helps DOE and industry understand critical issues related to hydrocarbon production
• Enables the Biochemical Conversion Area’s strategic goal “to develop commercially viable technologies for converting biomass feedstocks via biochemical routes into energy dense, fungible liquid transportation fuels, as well as bioproducts or chemical intermediates, and bioenergy.”

17 | Bioenergy Technologies Office eere.energy.gov
Critical Success Factors
Hydrocarbon fuel production from biological processes requires a combination of tools to successfully direct and accelerate future research and ultimately reduce costs
To be successful, our metabolic model for the
oleaginous yeast L. starkeyi must be able to:
– Integrate the best available data to predict the
maximum metabolically feasible lipid yield from the
wild-type strain
– Identify targets for modifying the metabolism of the
wild type strain that raise the lipid yield nearer to the
theoretical maximum of 33%, thus reducing the cost
of cellulosic diesel towards the BETO goal of
$3/gallon gasoline equivalent

18 | Bioenergy Technologies Office eere.energy.gov
Future Work
Overall:
• Continue collaboration with experimentalists to refine metabolic and economic
models and model outcomes
• Develop understanding of yield limits on glucose and eventually, complex
substrates
• Develop strategies to control unwanted side reactions (e.g. secreted
exopolysaccharides that increase broth viscosity)
ML, DL or
Go/No Go
Description FY13
Q3
FY13
Q4
FY14
Q1
FY14
Q2
FY14
Q3
FY14
Q4
M.1.ML.3
Theoretical Yield Estimates & Economics: Refine fatty acid
synthesis pathways
M.1.ML.4
Theoretical Yield Estimates & Economics: Complete updated
TEA for L starkeyi
M.1.DL.1 Theoretical Yield Estimates & Economics: Final Report
N.1.ML.1
Theoretical Yield Estimates & Economics: exercise models to
direct next research steps
N.1.ML.2
Theoretical Yield Estimates & Economics: assess experimental
results for model use
N.1.ML.3 Theoretical Yield Estimates & Economics: refine models
N.1.DL.4 Theoretical Yield Estimates & Economics: Final Report
N.1.GN.1 Go-no go decision

19 | Bioenergy Technologies Office eere.energy.gov
Summary
Approach: Combine multiple strengths: economics, metabolics, experimental
Technical accomplishments:
• Completed economic analysis of a co-product scheme
• Completed literature based process model for hydrocarbon production
• Developing metabolic model for L. starkeyi
• Published (with NREL) 2 Tech Memos for sugars conversion
Relevance: Supports BETO goal of economic hydrocarbon fuels from sugar
Critical Success factors and challenges:
• Obtaining sufficient experimental data for metabolic & economic
models
• Deployment of metabolic & economic model to influence research
directions
Future Work:
• Leverage L. starkeyi experimental work to improve models
• Exercise metabolic and process models to suggest research directions
Technology transfer: Publication of results
20 | Bioenergy Technologies Office eere.energy.gov
Acknowledgements
Bioenergy Technologies Office – Leslie Pezzullo, Joyce Yang, Bryna
Berendzen, Katy Christiansen
PNNL Team – Aye Meyer, Iva Tews, Jim Collett
NREL – Mary Biddy

21 | Bioenergy Technologies Office eere.energy.gov
Additional Slides
22 | Bioenergy Technologies Office eere.energy.gov
Responses to Previous Reviewers’ Comments
2011 Reviewer Comments • The analysis provides a useful decision making and analysis tool to assist researchers. For the long term planning [2012-
2017] the assumptions the models are based upon a most likely highly speculative since little experimental information exists
on many of these. Rigid adherence to these could lead to the adoption of wrong research paths to pursue as well as
elimination of potentially promising avenues of investigation.
• This type of project reminds me of the chicken or egg controversy - of which came first. The project seems necessary in
order to determine which avenues are feasible and worth further consideration, i.e. funding to generate more data. On the
other hand, it is difficult to make realistic determinations of "feasibility" when the data available on a given topic is
sparse. Hence, I see the project as important but the focus must be on systems/processes for which there is considerable
data upon which to make judgments
• The researcher may want to avail them self of work done in other institutions such as Stanford Research Institute which may
be very beneficial. With this I believe the bioinformatics would be more firmly based.
Response to review comments The reviewers generally recognize the need to establish some criteria for determining research goals and measuring progress
towards goals, but regretted the lack of experimental data and reliance upon sparse literature information. To remedy this, the
economic analysis for hydrocarbon production is beginning to be supplemented with the development of metabolic modeling and
experimental results aimed at informing both the economic and the metabolic models.
As per the reviewers’ suggestion, we have employed the Pathway Tools bioinformatics software package from SRI (Stanford
Research Institute) to integrate genomic sequence data and biochemical literature information into highly curated metabolic
pathways. We are assembling these pathways into a process model of the stoichiometric reaction network within the oleaginous
yeast Lipomyces starkeyi to inform techno-economic analysis and to identify metabolic engineering strategies that will reduce the
cost of cellulosic hydrocarbon fuels toward the BETO goal of $3/gallon.

23 | Bioenergy Technologies Office eere.energy.gov
Publications, Presentations, and Commercialization
Publications: FY13: PA Meyer, IJ Tews, JK Magnuson, SA Karagiosis and SB Jones, “Techno-economic analysis of corn stover
fungal fermentation to ethanol”. Accepted for publication by Applied Energy
FY13: Biological Conversion of Sugars to Hydrocarbons Technology Pathway
http://www.nrel.gov/docs/fy13osti/58054.pdf
http://www.pnl.gov/main/publications/external/technical_reports/PNNL-22318.pdf
FY13: Catalytic Upgrading of Sugars to Hydrocarbons Technology Pathway
http://www.nrel.gov/docs/fy13osti/58055.pdf
http://www.pnl.gov/main/publications/external/technical_reports/PNNL-22319.pdf
Presentations: FY11: A poster entitled “Novel Microbial Conversion of Biomass to Hydrocarbon-Compatible Fuels: A Survey” was
presented at the 33rd Symposium on Biotechnology for Fuels and Chemicals in early May.
FY12: Iva Tews presented a summary of the PNNL analysis work on Biochemical Pathways to Fuels at the Recent
Advances in Fermentation Technology (RAFT IX) Conference entitled “A Techno-economic Assessment of Cellulosic
Bio-Conversion Routes: Ethanol and Beyond.” November 2011
FY12: Pimphan (Aye) Meyer ACS National Spring Meeting March 2012, San Diego CA. "A Techno-economic Analysis
for Ethanol Production from Corn Stover by Fungal Fermentation".