1. Background About 1 in 40 (n = 224,000) Australian women physically assaulted in the last 12...
24
1
-
Upload
gisselle-turrill -
Category
Documents
-
view
212 -
download
0
Transcript of 1. Background About 1 in 40 (n = 224,000) Australian women physically assaulted in the last 12...

1
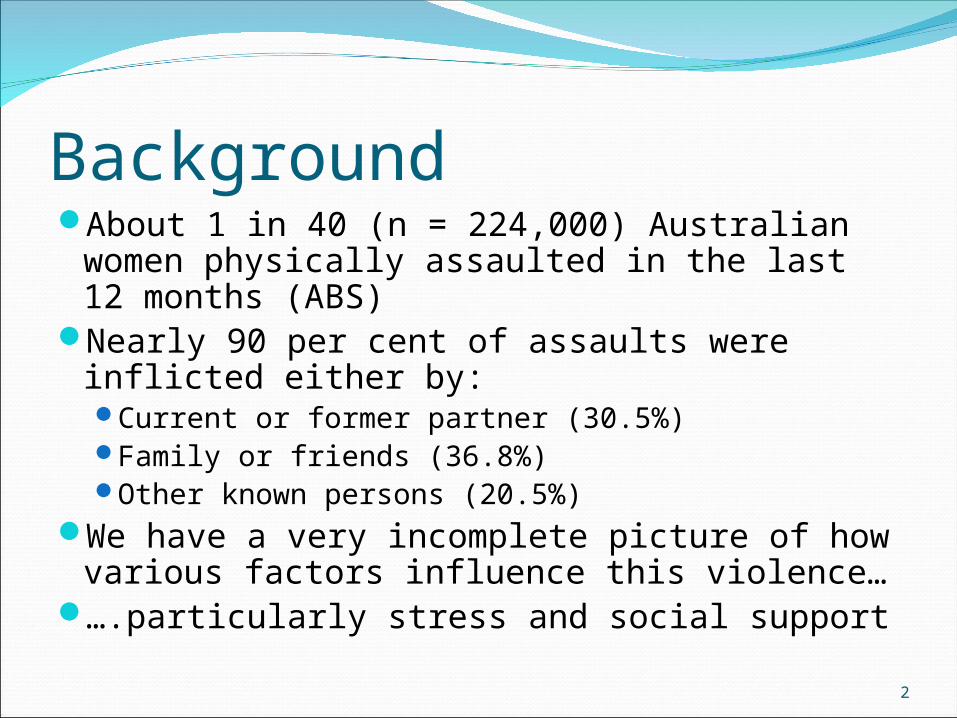
BackgroundAbout 1 in 40 (n = 224,000) Australian women
physically assaulted in the last 12 months (ABS) Nearly 90 per cent of assaults were inflicted
either by:Current or former partner (30.5%)Family or friends (36.8%)Other known persons (20.5%)
We have a very incomplete picture of how various factors influence this violence…
….particularly stress and social support
2

Past researchEvidence linking financial stress to IPV
MacMillan & Gartner (1999); Cunradi et al. (2002); Wyk et al. (2003); Benson et al. (2003); Lauritsen & Schaum (2004); Weatherburn (2011)
But see: Johnson (2008); Julian & McKendry (1993); Mouzos & Makkai (2004)
Evidence linking personal stress to IPV Straus & Gelles (1990); Julian and McKendry (1993) But see: Cano and Vivian (2003)
Evidence linking social support to IPV Van Wyk et al. (2003); Goodman et al. (2005); Weatherburn (2011) But see: Carlson et al. (2002)
3
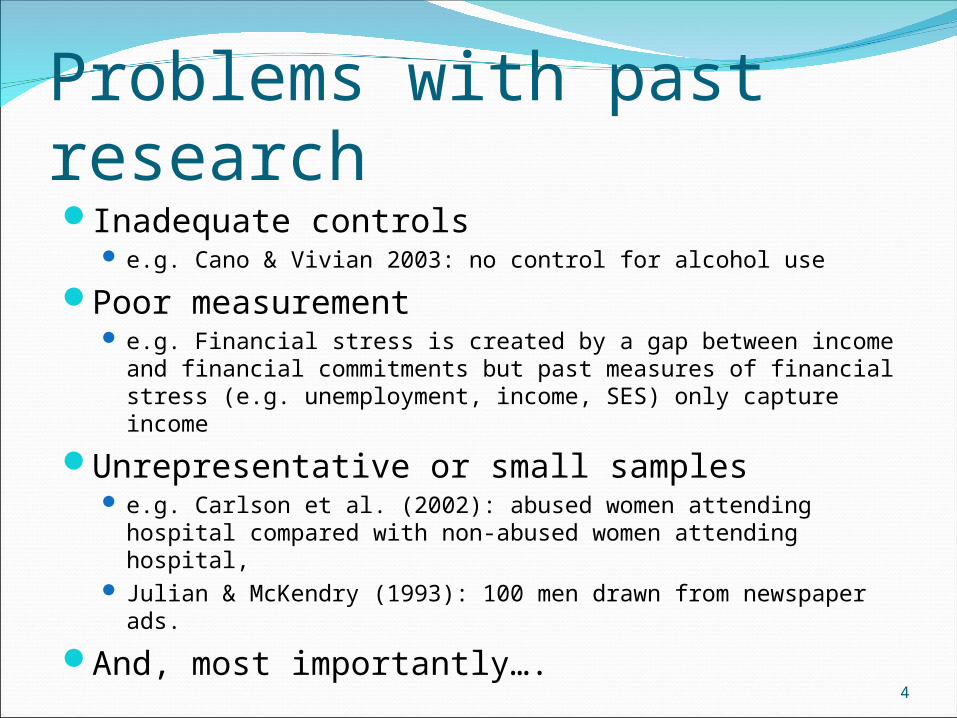
Problems with past researchInadequate controls
e.g. Cano & Vivian 2003: no control for alcohol use
Poor measurement e.g. Financial stress is created by a gap between income and financial
commitments but past measures of financial stress (e.g. unemployment, income, SES) only capture income
Unrepresentative or small samples e.g. Carlson et al. (2002): abused women attending hospital compared
with non-abused women attending hospital, Julian & McKendry (1993): 100 men drawn from newspaper ads.
And, most importantly….
4

Use of cross-sectional surveysThe majority of previous studies were based on
cross-sectional surveysHave you experienced financial stress in the past 12 months?Have you been the victim of assault in the past 12 months?
Can’t tell cause (stress?) from effect (violence?)
Need a longitudinal survey
5

Aim of the current studyExamine the longitudinal relationships between
violence against women and personal stressfinancial stresssocial support
using the Household Income and Labour Dynamics in Australia (HILDA) survey
6
7
A
B
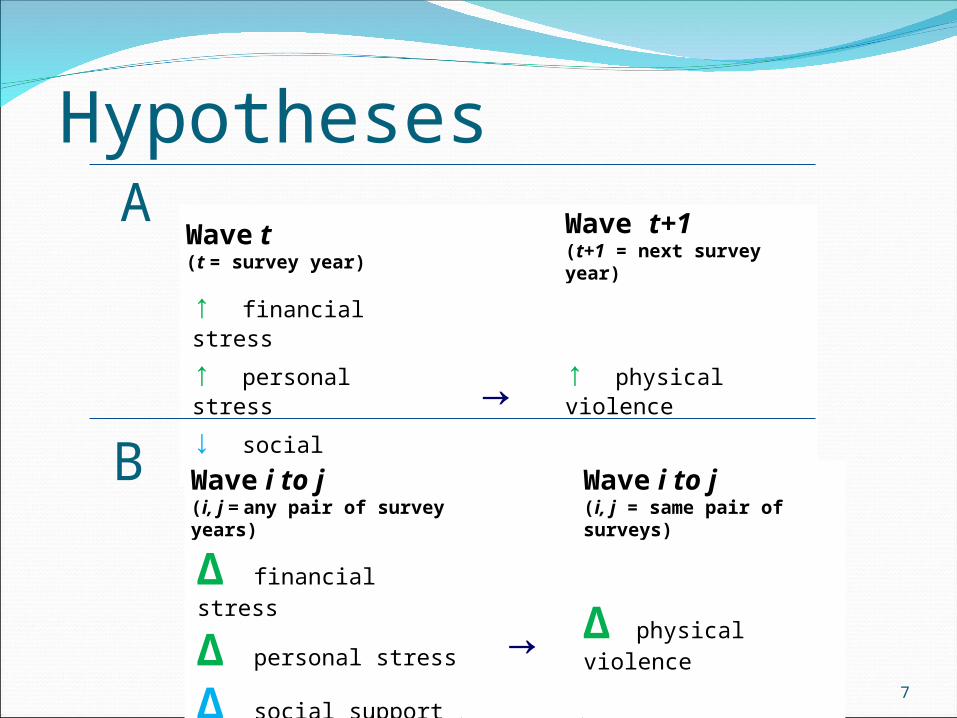
Wave t(t = survey year)
Wave t+1(t+1 = next survey year)
↑ financial stress
→ ↑ physical violence↑ personal stress
↓ social support
Wave i to j(i, j = any pair of survey years)
Wave i to j(i, j = same pair of surveys)
Δ financial stress
→ Δ physical violenceΔ personal stress
Δ social support
Hypotheses

HILDABroad social and economic longitudinal (panel) study of
Australian householdsItems on physical violence, stress, social support
Commenced in 2001 and is ongoing (2013 = survey wave 13)
Yearly data collection at household and person level
Face-to-face interviews and self-completion surveys
8

Current study samples
9

Different wording to other Australian studiese.g. Crime Victimisation Survey, Personal Safety Survey
Did any of these happen to you in the past 12 months? Yes/no
– Victim of physical violence (e.g., assault)
A. Next survey year [wave t+1 = 2003 to 2010]
B. Survey year [wave t = 2002 to 2009]
10
Dependent variable

Independent variables (1 of 2)
Number of financial stressors (7) [since Jan in survey year]
e.g. Went without meals
Number of personal stressors (9) [12 months prior to survey]
e.g. Serious injury/illness of a friend/relative
Social network mean score (10) [time of survey]
e.g. I often need help from other people but can’t get it
(7-point scale: strongly disagree to strongly agree)
11

Independent variables (2 of 2)
Alcoholic drinks per week [time of survey]
Marital status [time of survey]
Age [June 30 in survey year]
Pregnant/partner pregnant [12 months prior to survey]
12

Model A
Logistic Generalised Estimating Equations (GEE) modelControls for multiple records per person
[unstructured covariance matrix, robust standard errors]
Sample42,030 records from 7,950 women with next year violence data
[subset of 48,368 records from 9,393 women]
13
Wave t(t = survey year)
Wave t+1(t+1 = next survey year)
↑ financial stress
→ ↑ physical violence↑ personal stress
↓ social support

Model A - characteristics Percent of 42,030 records with characteristic [record not woman level]
Financial stressors 0 76%3+ 6%
Personal stressors 0 48%4+ 1%
Poor social networks mean ≥ 4 9%
Alcoholic drinks per week 12+ 10%
Marital status married 51%separated 3%
Age 15-24 years 16%25-54 years 55%
Pregnant/partner pregnant 5%
14
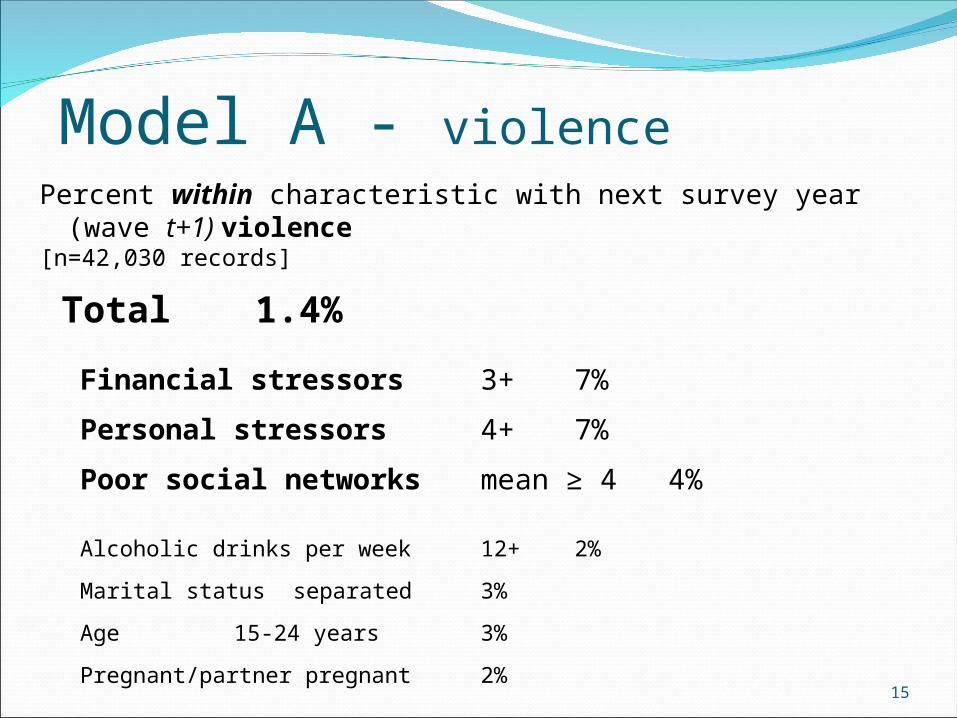
Model A - violence Percent within characteristic with next survey year (wave t+1) violence[n=42,030 records]
Total 1.4%
Financial stressors 3+ 7%
Personal stressors 4+ 7%
Poor social networks mean ≥ 4 4%
Alcoholic drinks per week 12+ 2%
Marital status separated 3%
Age 15-24 years 3%
Pregnant/partner pregnant 2%
15

Model A - adjusted results 1 of 2
16
1.51.7
3.5
1.31.5
1.8
2.9
1.51.6
2.7
0.00.51.01.52.02.53.03.54.04.55.0
1 2 3+ 1 2 3 4+ 2 3 4
Financial stressors (vs 0)
Personal stressors (vs 0)
Mean social network (vs 1)
Reference line
Adjusted odds ratio (95% confidence interval)

Model A - adjusted results 2 of 2
17
1.41.3
2.1 2.1
1.7 1.7
1.0
0.8
0.4 0.2
1.1
0.00.51.01.52.02.53.03.54.04.55.0
12+ 0 Sep Never De f Div Wid 25-54 55-64 65+ Preg
Alc drinks (vs <12)
Marital status (vs married)
Age (vs 15-24) (vs not)
Adjusted odds ratio (95% confidence interval)

Model B
Logistic fixed effects model Includes only persons who change over timeFocus on within person changeControls for all factors that do not change over time (e.g. child abuse)
18
Wave i to j(i, j = any pair of surveys)
Wave i to j(i, j = same pair of surveys)
Δ financial stress
→ Δ physical violenceΔ personal stress
Δ social support

Total sample 9,363 women [48,368 records]
No change = never violence 1-8 waves (8 for 34%) 94%
No change = always violence 1-5 waves (1 for 81%) 1%
Change = some violence 2-8 waves (8 for 35%) 5%
Model B – violence over time
19
506 women with 3,069 records - Model B sample
• 1 wave violence (up to 7 no) 71%
• 2 waves violence (up to 6 no) 19%
• 3 waves violence (up to 5 no) 7%
• etc ….
Model B - examples of change
20
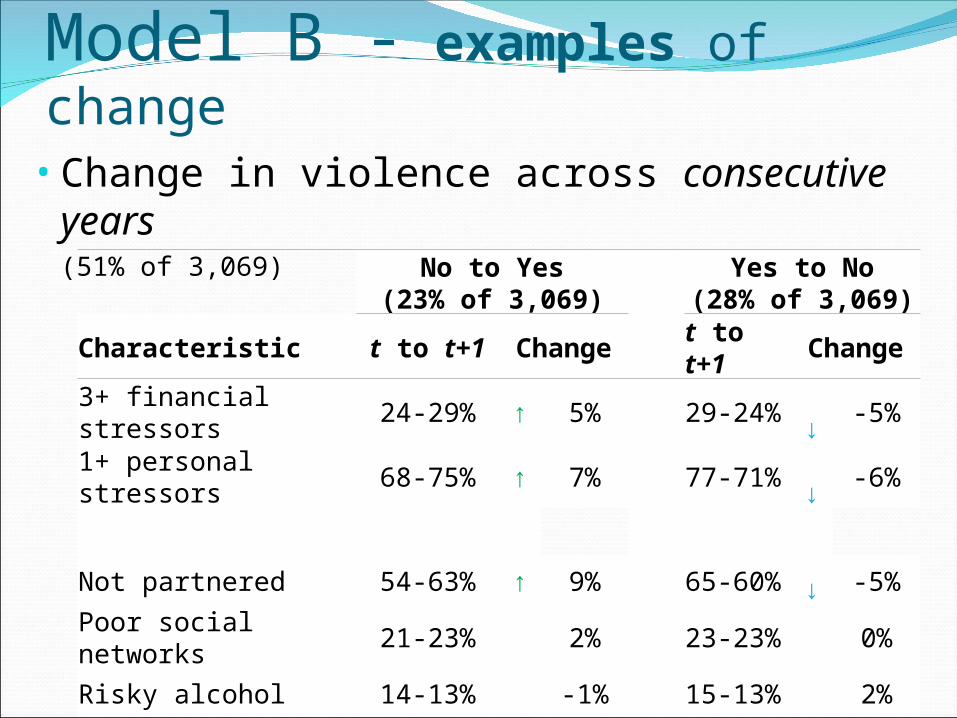
• Change in violence across consecutive years(51% of 3,069)
No to Yes
(23% of 3,069) Yes to No
(28% of 3,069)
Characteristic t to t+1 Change t to t+1 Change
3+ financial stressors 24-29% ↑ 5% 29-24% ↓ -5%
1+ personal stressors 68-75% ↑ 7% 77-71% ↓ -6%
Not partnered 54-63% ↑ 9% 65-60% ↓ -5%
Poor social networks 21-23% 2% 23-23% 0%
Risky alcohol 14-13% -1% 15-13% 2%

Model B - adjusted results
21
1.1 1.1
1.7
1.5
1.9
2.4
2.7
1.0
1.3 1.31.0 0.9
2.3
0.00.51.01.52.02.53.03.54.04.55.0
1 2 3+ 1 2 3 4+ 2 3 4 12+ 0 No
Financial stressors (vs 0)
Personal stressors (vs 0)
Mean social netwrk(vs 1)
Alc drinks (vs <12)
Partr (v y)
Adjusted odds ratio (95% confidence interval)

Tentative conclusions
22
Wave t(survey year)
Wave t+1(next survey year)
↑ financial stress
→ ↑ physical violence↑ personal stress
↓ social support
Wave i to j(any pair of surveys)
Wave i to j(same pair of surveys)
Δ financial stress
→ Δ physical violenceΔ personal stress
social supportΔ
Concluding remarksLow violence prevalence and weak alcohol effect
likely to be measurement issues
Weak social support effect in Model B may be a power issue
Need to understand how financial and personal stress are influencing violence
Need more information on victim-offender relationship and on offenders
23

24