1. Available data battery market Batteries put on market: Detailed figures members Eucobat 2011-2014...
16
-
Upload
steven-carter -
Category
Documents
-
view
217 -
download
0
Transcript of 1. Available data battery market Batteries put on market: Detailed figures members Eucobat 2011-2014...

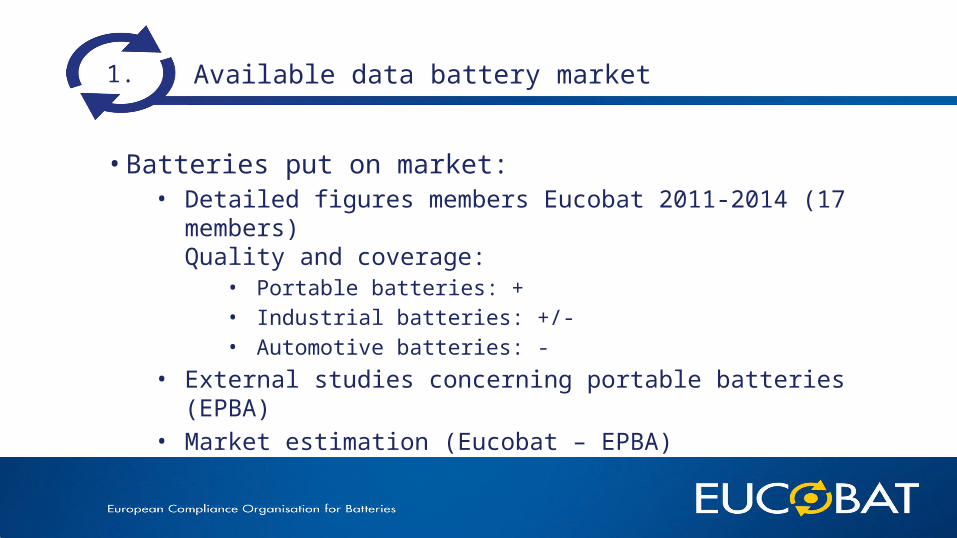
1. Available data battery market
• Batteries put on market:• Detailed figures members Eucobat 2011-2014 (17 members)
Quality and coverage:• Portable batteries: +• Industrial batteries: +/-• Automotive batteries: -
• External studies concerning portable batteries (EPBA)• Market estimation (Eucobat – EPBA)

2. Available data battery possession
• Hoarding studies in 3 countries:• Belgium• France• Netherlands

3. Available data waste batteries
• Detailed figures members Eucobat 2011-2014 (17 members)Quality and coverage:
• Portable batteries: +• Industrial batteries: +/-• Automotive batteries: -
• External studies concerning portable batteries (EPBA)• MSW analysis in several countries
(not harmonised methodology)• Eucobat study on battery lifespan/lifecycle in 5 countries
(Belgium-France-Netherlands-Romania-Spain): See presentation for Bebat (Belgium)
5 Business Consulting. Grondig Anders.
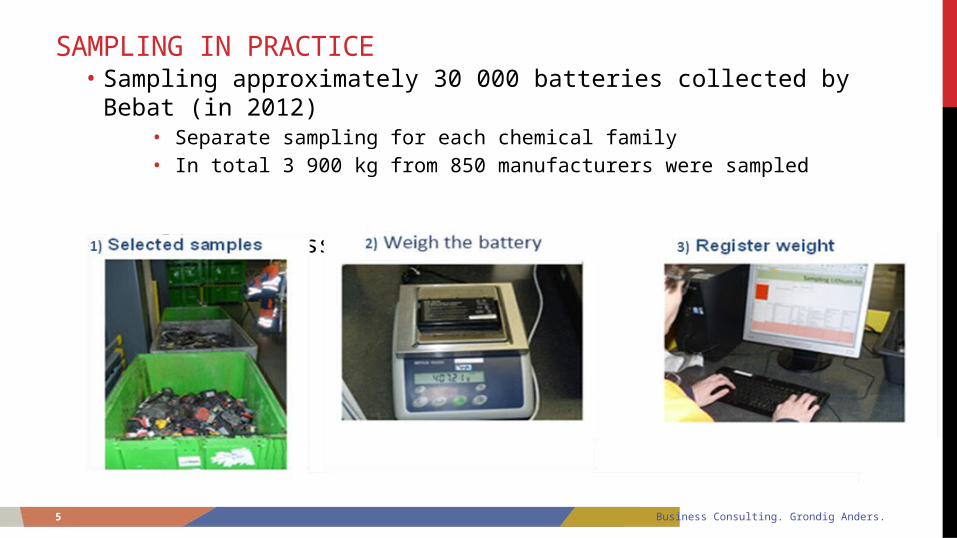
SAMPLING IN PRACTICE• Sampling approximately 30 000 batteries collected by Bebat (in 2012)
• Separate sampling for each chemical family• In total 3 900 kg from 850 manufacturers were sampled
• Sampling process
6 Business Consulting. Grondig Anders.
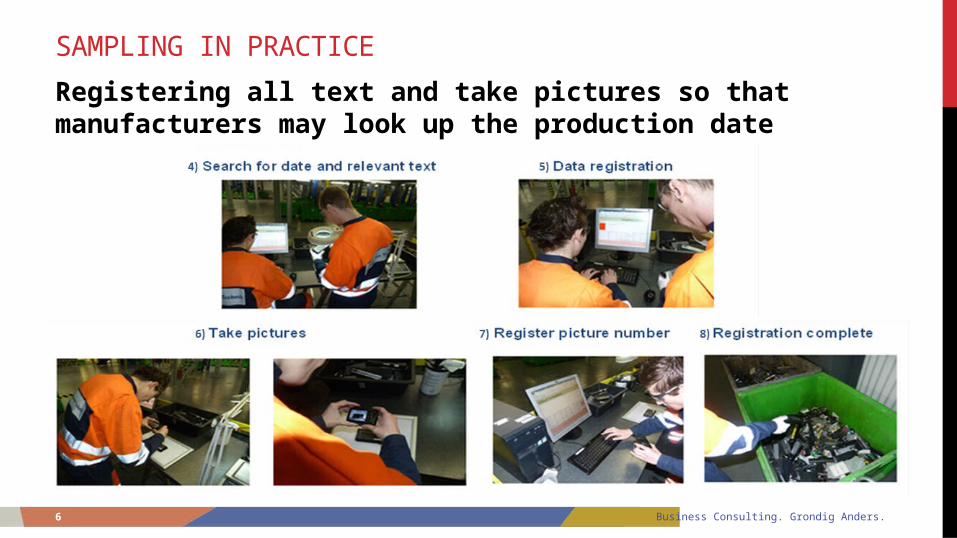
SAMPLING IN PRACTICE
Registering all text and take pictures so that manufacturers may look up the production date

7 Business Consulting. Grondig Anders.
EXTENSIVE DATASET
Production date was asked to the manufacturers• 17 000 batteries with a known production date (2 000 kg)
Chemical family Number of batteries Weight in kgAlkaline 11 598 405Zinc 1 791 38 Lithium primary 1 449 24 NiCd 707 286 NiMh 588 279 Lead 515 895 Lithium rechargeable 415 79 Total 17 063 2 006

8 Business Consulting. Grondig Anders.
THE AVERAGE USAGE AND HOARDING TERM IS MUCH LONGER THAN 3 YEARS!
Confidence level = 95%
* Due to a change in technology in recent years, the results for primary lithium should be interpreted with care

9 Business Consulting. Grondig Anders.
AVERAGE USAGE AND HOARDING TERM OF PACKS
Significant difference between• Tools (shortest lifecycle)• Computers (longest lifecycle)• Cameras and Mobile phones (average lifecycle)

10 Business Consulting. Grondig Anders.
EVOLUTION OF BATTERY COLLECTION IN THE YEARS FOLLOWING PRODUCTION
Average age

11 Business Consulting. Grondig Anders.
EVOLUTION OF BATTERY COLLECTION IN THE YEARS FOLLOWING PRODUCTION
Average age

12 Business Consulting. Grondig Anders.
WHAT PERCENTAGE OF BATTERIES IS COLLECTED WITHIN THE FIRST 3 YEARS?
Chemical family At most …%*
alkaline 29,01%
zinc 24,21%
primary lithium** 45,41%
nickel cadmium 34,68%
nickel metalhydride batteries 47,37%
lead 12,92%
lithium rechargeable 19,16%
* Confidence level = 95%** Due to a change in technology in recent years, the results for primary lithium should be interpreted with care

13 Business Consulting. Grondig Anders.
HOW LONG UNTIL 80% OF THE BATTERIES HAVE BEEN DISCARDED?
Chemical family At least … years *
alkaline 8 years
zinc 9 years
primary lithium** 9 years
nickel cadmium >15 years
nickel metalhydride batteries 7 years
lead 7 years
lithium rechargeable 10 years
* Confidence level = 95%** Due to a change in technology in recent years, the results for primary lithium should be interpreted with care

14 Business Consulting. Grondig Anders.
IMPACT OF LIFECYCLE ON COLLECTION PERFORMANCE - STABLE POM
The EU target and the ‘life cycle target’ are very similar
2000 2002 2004 2006 2008 2010 20120
500
1,000
1,500
2,000
2,500 Alkaline
POM (Put On Market) portable batteries 3 year average of POMEU target (45% of 3 year average of POM) Available for Collection (based on lifecycle)
YearsTo
ns
of
po
rtab
le b
atte
ries
15 Business Consulting. Grondig Anders.
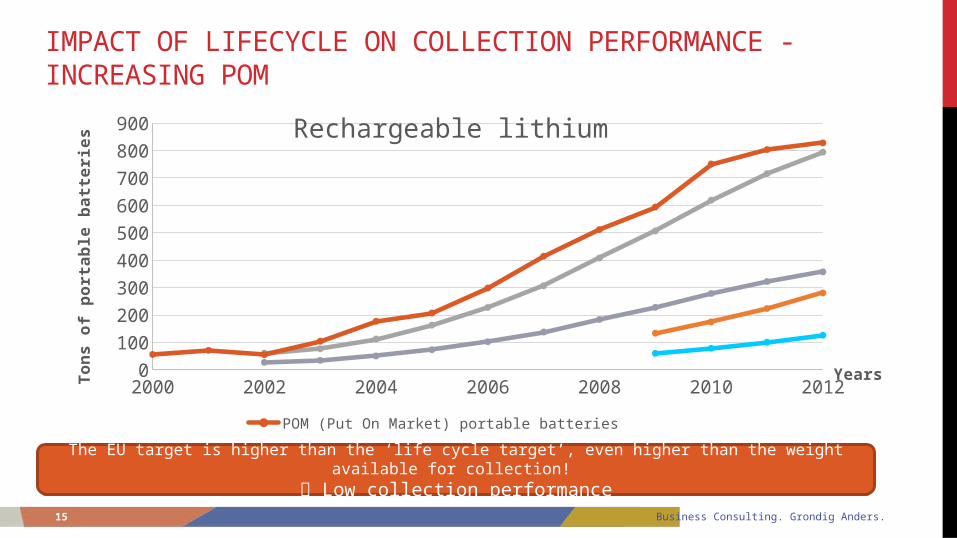
IMPACT OF LIFECYCLE ON COLLECTION PERFORMANCE - INCREASING POM
The EU target is higher than the ‘life cycle target’, even higher than the weight available for collection! Low collection performance
2000 2002 2004 2006 2008 2010 20120
100
200
300
400
500
600
700
800
900 Rechargeable lithium
POM (Put On Market) portable batteries 3 year average of POM
Years
To
ns
of
po
rta
ble
ba
tte
rie
s

16 Business Consulting. Grondig Anders.
CONCLUSION
Stable put on market
• EU target and ‘lifecycle target’ yield similar results
Decreasing put on market
• EU target is lower than the ‘lifecycle target’
• Decreasing importance of these chemical families in the overall collection performance
Increasing put on market
• EU target is higher than the ‘lifecycle target’
• If the weight put on market increases very fast or if the lifecycle is very long, the weight
available for collection falls below the EU target
• Increasing importance of these product families in the overall collection performance