1 Automatic Image Registration of Multi-Modal …jmmza/Papers/TGRS_2015.pdf1 Automatic Image...
47
1 Automatic Image Registration of Multi-Modal Remotely Sensed Data with Global Shearlet Features James M. Murphy a , Jacqueline Le Moigne b , and David J. Harding b a University of Maryland: Norbert Wiener Center For Harmonic Analysis and Applications, College Park, MD b NASA Goddard Space Flight Center, Greenbelt, MD Abstract Automatic image registration is the process of aligning two or more images of approximately the same scene with minimal human assistance. Wavelet-based automatic registration methods are standard, but sometimes are not robust to the choice of initial conditions. That is, if the images to be registered are too far apart relative to the initial guess of the algorithm, the registration algorithm does not converge or has poor accuracy, and is thus not robust. These problems occur because wavelet techniques primarily identify isotropic textural features and are less effective at identifying linear and curvilinear edge features. We integrate the recently developed mathematical construction of shearlets, which is more effective at identifying sparse anisotropic edges, with an existing automatic wavelet- based registration algorithm. Our shearlet features algorithm produces more distinct features than wavelet features algorithms; the separation of edges from textures is even stronger than with wavelets. Our algorithm computes shearlet and wavelet features for the images to be registered, then performs least squares minimization on these features to compute a registration transformation. Our algorithm is two-staged and multiresolution in nature. First, a cascade of shearlet features is used to provide a robust, though approximate, registration. This is then refined by registering with a cascade of wavelet features. Experiments across a variety of image classes show an improved robustness to initial conditions, when compared to wavelet features alone. I. I NTRODUCTION The process of image registration seeks to align two or more images of approximately the same scene, acquired at different times or with different sensors [1]. A variety of scientific fields make use of image registration, including
-
Upload
truongtuyen -
Category
Documents
-
view
221 -
download
3
Transcript of 1 Automatic Image Registration of Multi-Modal …jmmza/Papers/TGRS_2015.pdf1 Automatic Image...

1
Automatic Image Registration of Multi-Modal
Remotely Sensed Data with Global Shearlet
Features
James M. Murphya, Jacqueline Le Moigneb, and David J. Hardingb
aUniversity of Maryland: Norbert Wiener Center For Harmonic Analysis and Applications, College
Park, MDbNASA Goddard Space Flight Center, Greenbelt, MD
Abstract
Automatic image registration is the process of aligning two or more images of approximately the same scene
with minimal human assistance. Wavelet-based automatic registration methods are standard, but sometimes are not
robust to the choice of initial conditions. That is, if the images to be registered are too far apart relative to the initial
guess of the algorithm, the registration algorithm does not converge or has poor accuracy, and is thus not robust.
These problems occur because wavelet techniques primarily identify isotropic textural features and are less effective
at identifying linear and curvilinear edge features. We integrate the recently developed mathematical construction
of shearlets, which is more effective at identifying sparse anisotropic edges, with an existing automatic wavelet-
based registration algorithm. Our shearlet features algorithm produces more distinct features than wavelet features
algorithms; the separation of edges from textures is even stronger than with wavelets.
Our algorithm computes shearlet and wavelet features for the images to be registered, then performs least
squares minimization on these features to compute a registration transformation. Our algorithm is two-staged and
multiresolution in nature. First, a cascade of shearlet features is used to provide a robust, though approximate,
registration. This is then refined by registering with a cascade of wavelet features. Experiments across a variety of
image classes show an improved robustness to initial conditions, when compared to wavelet features alone.
I. INTRODUCTION
The process of image registration seeks to align two or more images of approximately the same scene, acquired at
different times or with different sensors [1]. A variety of scientific fields make use of image registration, including
2
biomedical imaging [2], microscopy [3], and remote sensing [4]. The purpose of studying image registration in all
of these disciplines is to develop robust, accurate, and computationally efficient algorithms to align the relevant
images. Image registration can be performed as an end in itself, or as an intermediate step in an application. An
example of the latter use of image registration is in image fusion, many techniques for which require images to be
registered. In particular, fusion methods based on wavelets [5] and wavelet packets [6] require registered images.
Image registration is fraught with complications. Given the broad class of variations between types of images, degree
of noise present in images, and initial knowledge of misregistration, an image registration technique could perform
admirably in one set of circumstances and poorly in another. As such, a highly flexible, robust algorithm is valuable
to the communities that rely on image registration. A variety of approaches to automatic image registration have
been developed. These include ground control point (GCP)-based methods, such as SIFT [7], [8] and its variants
[9], [10], or weighted total least squares (WTLS) [11]. Another class of automatic image registration algorithms
considers all pixels in the image, and makes a global comparison using a global metric, such as mutual information
[12] or correlation [13]. Yet another class of algorithms involves transforming the images to be registered into a
new domain, where global features are more prominent, then applying global similarity metrics such as mutual
information or correlation. Chief among these are transforms that are known to yield important information in
images, such as the harmonic analysis methods of the Fourier transform and the wavelet transform [14]. These
methods have the advantage of isolating significant features in images that make computing the correct registration
transformation easier. Moreover, these methods use all pixels in an image instead of just a small subset, as in the
case of GCP-based methods. The use of only a small subset of the pixels in GCP-based methods makes the impact
of bad pixel pairs potentially significant; this is not typically a problem for transform-based methods. The use of
concentrated, global features makes false-matched pairs less of an issue, since the global geometry is accounted
for. This means small-scale mismatches are insignificant, when compared to how the global structures align. Even
if the image to be registered has many similar features, the global arrangement of these features will be aligned
under our method. This means outliers are not as significant for our method, because these are generally small in
number compared to the total number of pixels used for matching.
An automatic image registration technique was developed by the second named author and her collaborators [15],
[16], based on wavelets and wavelet-like pyramids. This algorithm proved effective on a variety of remotely sensed
image data, but sometimes failed to be robust to the initial registration guess. More precisely, if the initial guess
for registration is very far from the truth registration, the algorithm could fail to converge to the correct registration
transformation. This often happens if the images are severely misregistered to begin. Indeed, most registration
techniques employ an optimization algorithm that requires an initial guess value; the optimization technique aligns
the images by searching for a global minimizer to a non-linear least squares problem, using the initial guess as a
starting value. If this initial guess is too far from the global minimizer, the algorithm could converge to a local
minimizer, rather than the global minimizer. This is a common issue with fitting algorithms to non-linear least
Pending approval of NASA Goddard Space Flight Center
3
squares problems [17]. It is important to have an image registration algorithm that is robust to initial guess, since
many geophysical applications that require image registration have moderately to severely misregistered images.
Providing distinct, sparse features for the optimization algorithm to use is a natural way to increase robustness of
a registration algorithm.
In the years since this wavelet-based registration technique was developed, the mathematical discipline of harmonic
analysis experienced a renaissance. The wavelet transform has been generalized to a growing family of transforms
emphasizing different aspects of a signal. In particular, the shearlet transform generalizes the wavelet transform by
providing increased directional sensitivity [18], [19]. Edge-like features such as roads, rivers, mountain ridges, and
land-cover boundaries are very well-emphasized by the shearlet transform, both theoretically and in practice.
Our goal was to improve the wavelet automatic registration algorithm by registering images according to their
shearlet features. Given the distinct features this mathematical technique produces, our expectation was the robustness
of the algorithm would be improved. Theoretically, these sparse, well-defined features should allow a poorer initial
guess, and still provide accurate convergence, even in the case of severe misregistration. We justify this heuristic in
Section III. Our algorithm exploits this theoretical property by first registering with shearlet features, then refining
the registration by registering with wavelet features. This two-stage algorithm provides strong robustness, from the
shearlet stage, and strong precision, from the wavelet stage. Indeed, the first stage shearlet registration provides
a robust approximate registration based on the anisotropic, edge-like features in an image; the shearlet features
were hypothesized to work even if the initial guess is poor with respect to the truth registration. This approximate
registration is then refined with wavelet-based registration, taking advantage of subtle textural features to allow for
accuracy improvement based on fine details in the images.
The structure of this article is as follows. Background on image registration and harmonic analysis are presented in
Sections II and III, respectively. Our registration algorithms are described in Section IV. In Section V, we perform
experiments on synthetically generated input data for which we had perfect knowledge of the distortions between
the images. These experiments are useful, but somewhat unrealistic, because of the limited variety in feature size,
shape and contrast. Thus, in Section VI, we experiment on real, multimodal data with various sizes, resolution
differences, and information content. We conclude and discuss future work in Section VII.
II. BACKGROUND ON IMAGE REGISTRATION
The process of image registration aligns two images, called an input image and reference image. The reference
image is understood to be fixed, and the input image is transformed to match the reference image. Image registration
may be viewed as the combination of four separate sub-processes [1]:
Pending approval of NASA Goddard Space Flight Center

4
1) Selecting an appropriate search space of admissible transformations. This will depend on whether the images
are at the same resolution, and what type of transformations will carry the input image to the reference image,
i.e. rotation-scale-translation (RST), polynomial warping, or a non-rigid transformation.
2) Extracting relevant features to be used for matching. These could be individual pixels or groups of pixels
that are known to be in correspondence between the two images, or could be global structures in the images,
corresponding to roads, buildings, rivers, and textural regions.
3) Selecting a similarity metric, in order to decide if a transformed input image closely matches the reference
image. This metric should make use of the features which are extracted from the image, be they specific
pixels or global structures.
4) Selecting a search strategy, which is used to match the images based on maximizing or minimizing the
similarity metric.
Perhaps the most straightforward, yet inefficient, approach to image registration is manual registration. This involves
a human examining the images to be registered and selecting pixel matches between the two images. That is, one
selects a pixel or group of pixels in each image that are in correspondence, based on the features they represent
and their location relative to other pixels. In remotely sensed images, these matching pixel pairs are called ground
control points (GCPs). Once a suitable number of GCPs have been selected, a transformation can be found between
the images by minimizing the least squares distance between GCPs. There are commercial software products, such
as ENVI, that compute a registration based on user-selected GCPs. Unfortunately, manual registration has many
drawbacks. It requires human resources and is time-consuming. Moreover, in the case of two images with vastly
different information content, it may be very difficult to identify GCPs that correspond exactly to one another; this
shall be investigated in greater detail in Section VI.
In distinction to manual registration is automatic registration: registration that requires no human selection of GCPs
or features. Types of automatic registration can be broken into two classes: GCP-based and global feature-based.
GCP-based automatic registration techniques are similar to manual registration, in that individual pixels or small
groups of pixels are selected to compute the image registration. In this case, however, the GCPs are selected based
on an algorithm; the scale invariant feature transform (SIFT)-algorithm and its variants [7], [9], [10] are popular
in this regard. While speed is less of an issue with GCP-based automatic registration, the difficulties of registering
multimodal images remain. In particular, if there are no obvious pixels in the input image to match with ones in
the reference image, this scheme will suffer. We will examine a lidar-to-optical image experiment in Section VI in
which this problem is manifest.
A second class of automatic image registration algorithms is those that take into account the entire image, not just
prioritized GCPs. This can be done by a direction comparison between the two images, using a global metric like
Pending approval of NASA Goddard Space Flight Center
5
correlation [13] or mutual information [12]. A more involved approach using global features is to apply a feature-
extraction algorithm to the input and reference image, that ideally isolates multi-pixel features common to both
images. These features are then matched with an optimization scheme. Wavelet features and wavelet-like features,
such as Simoncelli pyramids [20], have proven effective for this type of image registration [12], [15], [21], [22].
However, wavelets often fail to find the most robust features in an image. Roads, rivers, and other edge-like features
are not well-captured by wavelet algorithms. This is because wavelets are essentially isotropic, meaning they are
the same in all directions. Consequently, textural rather than directional features are emphasized by wavelets [23].
This lack of directional sensitivity leads to inadequate robustness in the corresponding registration algorithms: the
feature space is too homogenous for the optimization scheme to avoid local minimizers near the global minimizer.
To counter this, we have developed a feature extraction algorithm that has a strong directional emphasis, yielding
a more robust registration solution.
We summarize our image registration algorithm in terms of the four components described in [1]:
1) Search Space: In general, we consider the search space of rotations, scales, and translations (RST). Many of
our experiments feature images at the same scale, so in these case, we effectively chose the search space to
be restricted to the space of compositions of rotations and translations (RT).
2) Features: Wavelet image features only in one case, shearlet image features only in another case, and shearlet
image features coupled with wavelet image features in the case of our hybrid algorithms.
3) Similarity Metric: Unconstrained least squares. More precisely, let FR and FI denote the reference and
input features and N the number of relevant pixels. In our case, the number of relevant pixels is equal to
all pixels in an image feature; for example, if we are considering image features of size 256 × 256, then
N = 256 × 256 = 65536. If the image feature is of size 1024 × 1024, then N = 1024 × 1024 = 1048576.
Let (xi, yi) and (x′i, y′i) be the integer coordinates of the ith pixel in FR and FI , respectively, and Tp the
transformation associated to parameters p. Our registration transformation is computed by minimizing the
similarity metric given by:
χ2(p) =1
N
N∑i=1
(FR(xi, yi)− FI(Tp(x′i, y′i)))
2. (1)
In (1), the transformation Tp is applied to the input features, though the problem could be solved equivalently
by applying the transformation to the reference features.
4) Search Strategy: Modified Marquadt-Levenberg method of solving non-linear least squares problems [24],
[21].
In this article, we consider image registration on Level 1B data [14]. This means our image data has been
radiometrically and geometrically calibrated, as well as height and geo-corrected. By geo-corrected, we mean
Pending approval of NASA Goddard Space Flight Center
6
that the spatial coordinates of the image data have been computed with a systematic correction using ancillary and
ephemeris data from the spacecraft of origin. In short, by determining where the satellite is pointing while acquiring
an image, the image can be given approximate ground coordinates. The image registration algorithms presented in
this article are typically considered as precision correction. Indeed, the navigation model aboard the sensing device
may have systematic or random errors, and it may not report where the satellite is pointing within the desired
accuracy. Precision correction addresses these errors by registering an image to known ground features, such as a
specific road, river, or land cover boundary [14]. In other words, while systematic correction is model-based, image
registration is feature-based. Depending on the age and the type of remote sensing systems, the accuracy of the
systematic correction can be as good as within a few pixels and as poor as off by a few tens of pixels. Errors
in precision can usually be modeled with an RST or affine transformation, in contrast to airborne data for which
these transformations are insufficient to model the registration error. Therefore, the scope of the present algorithm
is limited to RST and affine transformations.
III. BACKGROUND ON HARMONIC ANALYSIS
A. Background on Wavelets
The mathematical field of harmonic analysis has had considerable impact in image processing [25]. In particular,
wavelets and related methods have been widely used in applications such as image compression [26], image de-
noising [27], image fusion [5], [6], and image registration [15]. The value of wavelet techniques is their ability to
decompose an image into sub-images that in some sense represent coarse and fine aspects of the original image
[28].
Mathematically, a discrete wavelet transform decomposes a signal according to scale and translation. Indeed, for a
signal f ∈ L2(R2) and an appropriately chosen wavelet function ψ, f may be decomposed as:
f =∑m∈Z
∑n∈Z2
〈f, ψm,n〉ψm,n, (2)
where:
ψm,n(x) := |detA|m2 ψ(Amx− n), (3)
A ∈ GL2(R) := {2× 2 real matrices | det(A) 6= 0}. (4)
Pending approval of NASA Goddard Space Flight Center

7
A typical choice for A is the dyadic isotropic matrix
A =
2 0
0 2
. (5)
The wavelet coefficients
{〈f, ψm,n〉}m∈Z,n∈Z2 (6)
describe the behavior of f at different scales; m >> 0 gives information at local scales, m << 0 gives global
information. More precisely, the information contained in a coefficient 〈f, ψm,n〉 is very local to a specific region
of the signal f if m is a large positive integer, while it is global if m is a large negative integer. In the context of
image analysis, this separation of local and global information is often understood as separating fine and coarse
details. For example, subtle textures are often captured by the fine scale coefficients, while edge-like features and
large boundaries are often captured by the coarse scale coefficients. Harmonic analytic methods of this type, which
decompose an image into fine and coarse details based on scale, are called multiresolution methods.
There are a variety of ways to design efficient computational algorithms based on (2). Such a numerical wavelet
algorithm has three principle benefits for image registration. First, it extracts features that are easier to match than
the initial images, making search algorithms more accurate and robust. Second, wavelet and wavelet-like algorithms
often contain an iterative decimation step, which reduces the number of pixels in the images to be matched. This
allows for faster computation time, when compared to methods without decimation [15]. Finally, wavelet algorithms
represent textures very well, which can be useful features for accurate image registration.
While wavelets and wavelet-like algorithms have had success in automatic image registration [15], they are lacking
in certain regards. As mentioned, the features they produce are often textural in nature [29]. Instead of producing
sparse, distinct edges, wavelets produce regions of soft, somewhat noisy looking features. In particular, wavelets
are known to be suboptimal for representing edge-like features [30]; see Theorem 3.2 below. Consequently, image
registration techniques based on wavelets often suffer from a lack of robustness to initial transformation, since the
lack of sharp features means there will be many local minimizers to the optimization algorithm. This problem is
related to the isotropic nature of wavelets. These problems have been well-documented [31] [30], and led to the
burgeoning sub-discipline of harmonic analysis known as geometric multi-resolution analysis.
Pending approval of NASA Goddard Space Flight Center
8
B. Background on Shearlets
The idea of generalizing wavelets to be anisotropic has yielded several representation systems with rich theory, for
example the contourlets of Do and Vetterli, [32], the curvelets of Donoho and Candes [33], and the shearlets of Labate
et al. [19]. Shearlets have begun to be applied in the field of image processing, including image denoising [34],
SIFT-based image registration [35], image inpainting [36], and image fusion [37]. The relatively simple numerical
implementation of shearlets suggests their use over other anisotropic systems, which suffer from more complicated
implementations. Here we shall demonstrate the value of shearlets for global-feature automatic image registration.
Initial results using our approach for the registration of multitemporal images appears in [38]. In this conference
proceedings, an early prototype of the present algorithm was deployed to register a single pair of multitemporal
images. The algorithm in this case suggested improved robustness using shearlets. For this paper, the algorithm
was refined, in part by integrating shearlets and wavelets together into a two-stage hybrid registration algorithm,
and tested on a different and wide range of remotely sensed images. The results of these experiments for synthetic
and multimodal images shall be analyzed in Sections V and VI.
Shearlets generalize wavelets by decomposing with respect not just to scale and translation, but also direction.
Mathematically, given a signal f ∈ L2(R2) and an appropriate base function ψ, we may decompose f as
f =∑m∈Z
∑k∈Z
∑n∈Z2
〈f, ψm,k,n〉ψm,k,n, (7)
where:
ψm,k,n(x) := 23m4 ψ(SkA2mx− n), Aa :=
a 0
0 a12
, Sk :=
1 k
0 1
. (8)
Note that A has been replaced with Aa, which is no longer isotropic, hence it will allow our new analyzing functions
to be more pronounced in a particular direction. The new matrix Sk, a shearing matrix, lets us select the direction
to be emphasized. As a becomes larger, the direction selected by Sk will be emphasized to a greater and greater
degree. Details for this construction are found in [18] and [19]. We note that this shearlet construction is a particular
instance of the broader class of composite wavelets [39], [40].
The shearlet construction adds a new parameter of decomposition to classical wavelet methods: direction. This
means that shearlet coefficients
Pending approval of NASA Goddard Space Flight Center
9
{〈f, ψm,k,n〉}m∈Z,k∈Z,n∈Z2 (9)
will contain information about a signal’s behavior in different directions, which is not present in wavelet coefficients.
Indeed, one of the major mathematical achievements of shearlets is their ability to represent anisotropic signals in
an optimally sparse manner. Heuristically, this means that a signal with strong directional content is most optimally
represented by shearlet bases, and in particular, is more optimally represented by shearlets than by wavelets. This
notion of optimality can be made mathematically rigorous in the following manner [30], [41]:
Definition 3.1: The set of cartoon-like images in R2 is
E := {f | f = f0 + χBf1, fi ∈ C2([0, 1]2), ‖fi‖C2 ≤ 1, B ⊂ [0, 1]2, ∂B ∈ C2([0, 1])}. (10)
The space of cartoon-like images is a quantitative definition of signals that represent images. That is, although images
are discrete, if we are to consider only continuous signals, then E represents the class of signals corresponding to
images. Intuitively, signals in E are smooth except along boundaries of smooth curves.
Theorem 3.2: Let f ∈ E , and let fWN , fSN be the best N -term approximations to f in a wavelet system and shearlet
system, respectively. Then these approximations satisfy the following sharp bounds, for some fixed constant C > 0:
‖f − fwN‖22 ≤ CN−1 (11)
‖f − fsN‖22 ≤ CN−2(log(N))3. (12)
Intuitively, this means shearlet approximations converge more quickly than traditional wavelet approximations to the
true signal, meaning fewer shearlet coefficients are required to produce a good approximation. For the purposes of
image processing, this suggests that shearlets capture the information in a cartoon-like image much more efficiently
than wavelets. For example, disregarding the logarithmic factor, the above theorem implies approximately 100
wavelet coefficients would be needed to capture the information contained in just 10 shearlet coefficients. This
improved efficiency suggests shearlets’ role in image registration. Indeed, the sparser, more information-dense,
features produced by shearlets make it easier for an optimization algorithm to converge to the global minimizer,
and not get stuck on local minimizers.
Pending approval of NASA Goddard Space Flight Center
10
C. Numerical Implementations of Wavelets and Shearlets
Wavelets have been numerically implemented in a variety of ways, and are a widespread computational tool in
image processing. The wavelet features used in our algorithm are computed in C, but could just as easily have been
computed in MATLAB or another high level programming language. The major difference between computing
the features in C, as opposed to MATLAB, is speed; C is much faster. The shearlet features for our algorithm
are computed in MATLAB. The algorithm that produces these features for a given image makes use of a recent
MATLAB library [42], modified for computational purposes pertaining to optimization search strategies. For a
given image, the toolbox in [42] is used to compute shearlet features in a variety of directions and scales. These are
then thresholded and combined at each scale, to provide distinct features to be used in our optimization algorithm.
Details of the precise construction are in Section IV.
As a demonstration of how wavelet and shearlet features differ, consider Figure 1, which features a 256 × 256
optical image of Washington state; the image contains many features which could be used for matching by an
automatic image registration algorithm, such as textures from vegetation and edges from land-cover boundaries. To
illustrate the directional character of discrete shearlet algorithms, and its utility for image registration, we show in
Figure 2 the images produced by a MATLAB discrete wavelet algorithm using the ‘db2’ wavelet, and the shearlet
feature algorithm we have developed.
The features produced by the isotropic wavelet transform are composed of diffuse speckle, and edge features are
almost totally absent. By contrast, the features produced by our shearlet algorithm highlight the distinct, linear
and curvilinear features oriented in all directions. We shall exploit this this to develop a robust automatic image
registration algorithm.
IV. ALGORITHMS TO BE TESTED
We conducted experiments with seven algorithms. We considered the three algorithms used in [15], namely image
registration based on feature-matching with spline wavelets, Simoncelli low-pass pyramids, and Simoncelli band-
pass pyramids. We note that the Simoncelli features are derived from rotation-invariant and translation-invariant
filters [20], and all three of these wavelet methods have the advantage of being translation-invariant. This means if
an image I has wavelet features WI , then the image Tx0,y0(I) has wavelet features Tx0,y0
(WI), where Tx0,y0is a
translation in the x direction by x0 and in the y direction by y0. Intuitively, if an image is shifted, then translation-
invariant wavelet features will shift in exactly the same manner. Translation invariance is a very useful property
for getting precise registration, but does not contribute to robustness. The construction of these wavelet features
is beyond the scope of this article; we refer to [20], [43], and [15] for details. These three classical algorithms
Pending approval of NASA Goddard Space Flight Center
11
are collectively referred to as wavelets-only registration algorithms. We compare these algorithms with registration
based on using only shearlet features, denoted shearlets-only, and also a two-stage hybrid registration algorithm.
For the two-stage registration algorithm, first, register with shearlet features to acquire a registration transformation.
Then, set this registration as the initial guess and run the optimization algorithm again with one of the three
wavelet techniques. These three two-stage techniques shall be collectively referred to as hybrid shearlets+wavelets
registration techniques. Thus, our seven algorithms for testing are: three wavelets-only, shearlets-only, and three
shearlets+wavelets hybrid algorithms.
The motivation for the hybrid registration algorithms is that using shearlet features for optimization should provide
a highly robust, but less accurate registration. Shearlet features capture edge-features, which are dominant but in
some cases are not subtle enough to provide precise, final registration transformations. Additionally, the shearlet
algorithm is not translation invariant, resulting in small errors in registration computation, even if the shearlet
features algorithm produces robust, isolated features for matching. Moreover, the shearlet algorithm sometimes
produces double-wall artifacts when identifying thin edges, generating subpixel registration errors.
Our two-step algorithm corrects for this by first providing an initial shearlet-based registration, which is subsequently
refined by the classical wavelet registration algorithms. This combines the strong robustness of shearlet features with
the high precision provided by translation-invariant wavelet features. First, the shearlet features matching produces
a robust, but sometimes imprecise registration based on the dominant anisotropic edge-like features in the image.
This initial registration is then refined with fine detail information, such as textures, from matching with wavelet
features. Note that both the wavelet and shearlet transforms are multiresolution, meaning each image is decomposed
into sub-images with features of progressively finer scales.
A. Description of Algorithm
The key difference between the wavelet and shearlet algorithms is that a directional component is included in the
latter but not the former. We summarize our hybrid algorithm below. Let θ denote a counterclockwise rotation, Tx0
a translation by x0 in the x-direction, Ty0a translation by y0 in the y-direction, and S a scale dilation.
1) Input a reference image, Ir, and an input image Ii. These will be the images to be registered.
2) Input an initial registration guess (θ0, Tx0, Ty0
, S0). This is sometimes set at (θ0, Tx0, Ty0
, S0) = (0, 0, 0, 1).
This is rather arbitrary, as our algorithm is fully automatic and assumes no a priori knowledge of the images to
be registered. If a priori knowledge is available, or if manual registration has been computed, this information
can be input for the initial guess at this stage. In many of our experiments, we will vary the initial registration
guess relative to the true registration in order to evaluate the robustness of the algorithm.
Pending approval of NASA Goddard Space Flight Center
12
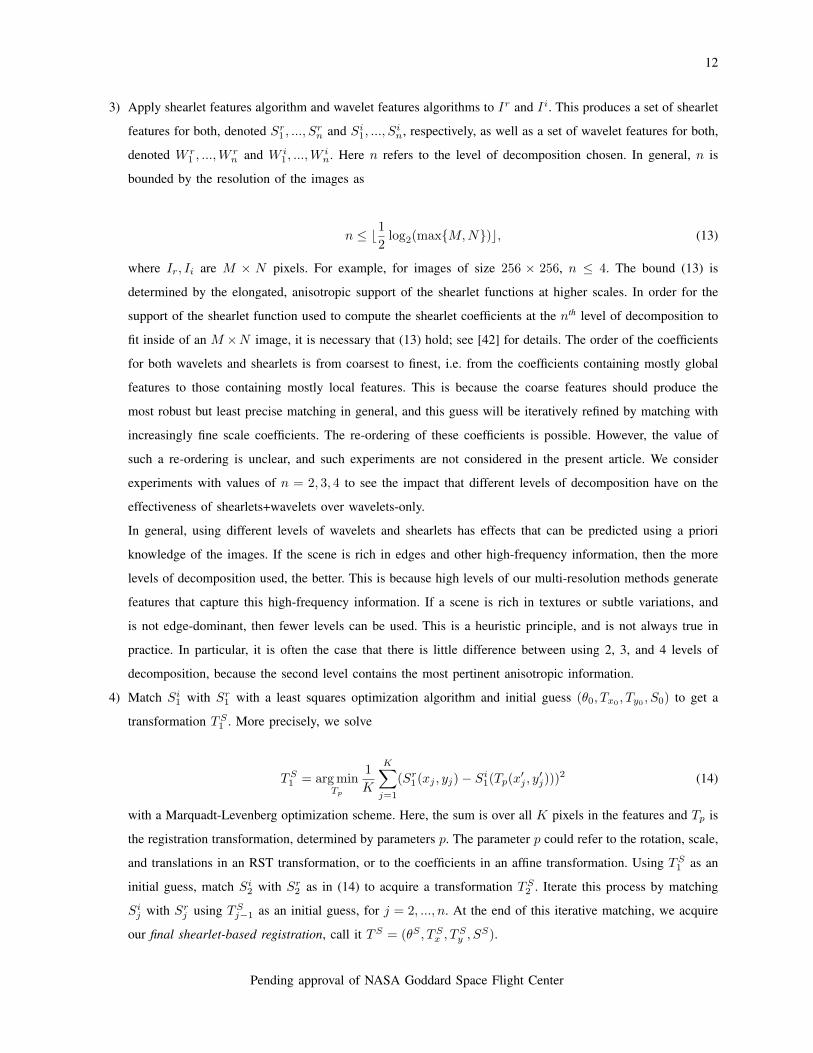
3) Apply shearlet features algorithm and wavelet features algorithms to Ir and Ii. This produces a set of shearlet
features for both, denoted Sr1 , ..., S
rn and Si
1, ..., Sin, respectively, as well as a set of wavelet features for both,
denoted W r1 , ...,W
rn and W i
1, ...,Win. Here n refers to the level of decomposition chosen. In general, n is
bounded by the resolution of the images as
n ≤ b12log2(max{M,N})c, (13)
where Ir, Ii are M × N pixels. For example, for images of size 256 × 256, n ≤ 4. The bound (13) is
determined by the elongated, anisotropic support of the shearlet functions at higher scales. In order for the
support of the shearlet function used to compute the shearlet coefficients at the nth level of decomposition to
fit inside of an M ×N image, it is necessary that (13) hold; see [42] for details. The order of the coefficients
for both wavelets and shearlets is from coarsest to finest, i.e. from the coefficients containing mostly global
features to those containing mostly local features. This is because the coarse features should produce the
most robust but least precise matching in general, and this guess will be iteratively refined by matching with
increasingly fine scale coefficients. The re-ordering of these coefficients is possible. However, the value of
such a re-ordering is unclear, and such experiments are not considered in the present article. We consider
experiments with values of n = 2, 3, 4 to see the impact that different levels of decomposition have on the
effectiveness of shearlets+wavelets over wavelets-only.
In general, using different levels of wavelets and shearlets has effects that can be predicted using a priori
knowledge of the images. If the scene is rich in edges and other high-frequency information, then the more
levels of decomposition used, the better. This is because high levels of our multi-resolution methods generate
features that capture this high-frequency information. If a scene is rich in textures or subtle variations, and
is not edge-dominant, then fewer levels can be used. This is a heuristic principle, and is not always true in
practice. In particular, it is often the case that there is little difference between using 2, 3, and 4 levels of
decomposition, because the second level contains the most pertinent anisotropic information.
4) Match Si1 with Sr
1 with a least squares optimization algorithm and initial guess (θ0, Tx0 , Ty0 , S0) to get a
transformation TS1 . More precisely, we solve
TS1 = argmin
Tp
1
K
K∑j=1
(Sr1(xj , yj)− Si
1(Tp(x′j , y′j)))
2 (14)
with a Marquadt-Levenberg optimization scheme. Here, the sum is over all K pixels in the features and Tp is
the registration transformation, determined by parameters p. The parameter p could refer to the rotation, scale,
and translations in an RST transformation, or to the coefficients in an affine transformation. Using TS1 as an
initial guess, match Si2 with Sr
2 as in (14) to acquire a transformation TS2 . Iterate this process by matching
Sij with Sr
j using TSj−1 as an initial guess, for j = 2, ..., n. At the end of this iterative matching, we acquire
our final shearlet-based registration, call it TS = (θS , TSx , T
Sy , S
S).
Pending approval of NASA Goddard Space Flight Center

13
5) Using TS as our initial guess, match W i1 with W r
1 as in (14) to acquire a transformation TW1 . Using TW
1
as an initial guess, match W i2 with W r
2 as in (14) to acquire a transformation TW2 . Iterate this process by
matching W ij with W r
j using TWj−1 as an initial guess, for j = 2, ..., n. At the end of this iterative matching,
we acquire our final hybrid registration, call it TH = (θH , THx , T
Hy , S
H).
6) Output TH .
The wavelets-only algorithm is the same as above, without step 4.) and using (θ0, Tx0, Ty0
, S0) as the initial guess
in step 5.). The shearlets-only algorithm is the same as above, without step 5.) and with TS = (θS , TSx , T
Sy , S
S)
as the final output.
As mentioned, the wavelet component of the algorithm is based on software coded in C, which is detailed in [15].
To produce the shearlet features for an image I , we proceed as follows:
1) Apply the MATLAB script known as the fast finite shearlet transform (FFST) [42], which is part of the FFST
library.
2) Perform hard thresholding on each shearlet coefficient to set the bottom 90% of coefficients in magnitude to
0. This threshold is tunable, but was fixed for all experiments. An example of these thresholded coefficients
for a level 2 decomposition is illustrated in Figure 3.
3) Add together all the coefficients of a particular scale. That is, for n > 1, the FFST produces at the nth scale
2n directionally sensitive features; once these have been thresholded, they are summed to produce a single
feature for each scale. Output the resulting n shearlet features, S1, ..., Sn, where n is as above.
In considering the value of these harmonic analysis algorithms for image registration, the computational complexity
of the wavelet and shearlet transform methods must be analyzed. For an image of size N ×N , wavelet algorithms
implement a discrete wavelet transform in O(N2) run time. The discrete shearlet transform employed in our
algorithm is based on the fast Fourier transform (FFT), and consequently has run time O(N2 log(N)) [44]. So,
both our shearlets-only algorithm and our hybrid shearlets+wavelets algorithm are slightly more demanding than
the wavelets-only algorithm, but only by a logarithmic factor.
B. Algorithm Evaluation
All of the registration algorithms tested were evaluated by computing the root-mean-square error (RMSE) between
the truth registration parameters and those computed by the algorithms, for each iteration of the experiment. The
formula for RMSE computation may be found in [15]. The units of RMSE correspond to the pixel size in the
reference image. In some experimental situations, scientists normalize RMSE to this pixel size. However, we will
Pending approval of NASA Goddard Space Flight Center
14
be using RMSE purely for comparative purposes, so such a normalization is unnecessary. In the case of our
geometrically warped synthetic experiments, the truth registration parameters are the parameters of the geometric
misregistration we applied to the images. In the case of our noisy and radiometrically warped synthetic experiments,
and in our multimodal experiments, the truth registration was known a priori or was computed using manual
registration assisted by the software package ENVI. For each of our seven image sets, a different number of
experiments was performed. The number of experiments was chosen to emphasize the robustness limits of the
wavelets-only, shearlets-only, and hybrid shearlets+wavelets algorithms for each set of images.
Our analysis of algorithm robustness involved computing whether a given experiment was convergent, by considering
if the RMSE was smaller than some threshold. The threshold for convergence of the algorithms is determined based
on a priori knowledge of the experiments, such as whether they are synthetic or multimodal, and whether wavelets are
used. In general, we hypothesized the wavelet and shearlets+wavelets algorithms should produce a highly accurate
final registration where convergent, so the RMSE threshold in this case should be quite small. The shearlets-only
algorithm was hypothesized to produce a less accurate registration where convergent, so the RMSE threshold should
be larger for this algorithm. Moreover, due to the difficulties of the multimodal registration problem, thresholds are
set to be higher for these experiments, when compared to the thresholds used in unimodal experiments. In the case
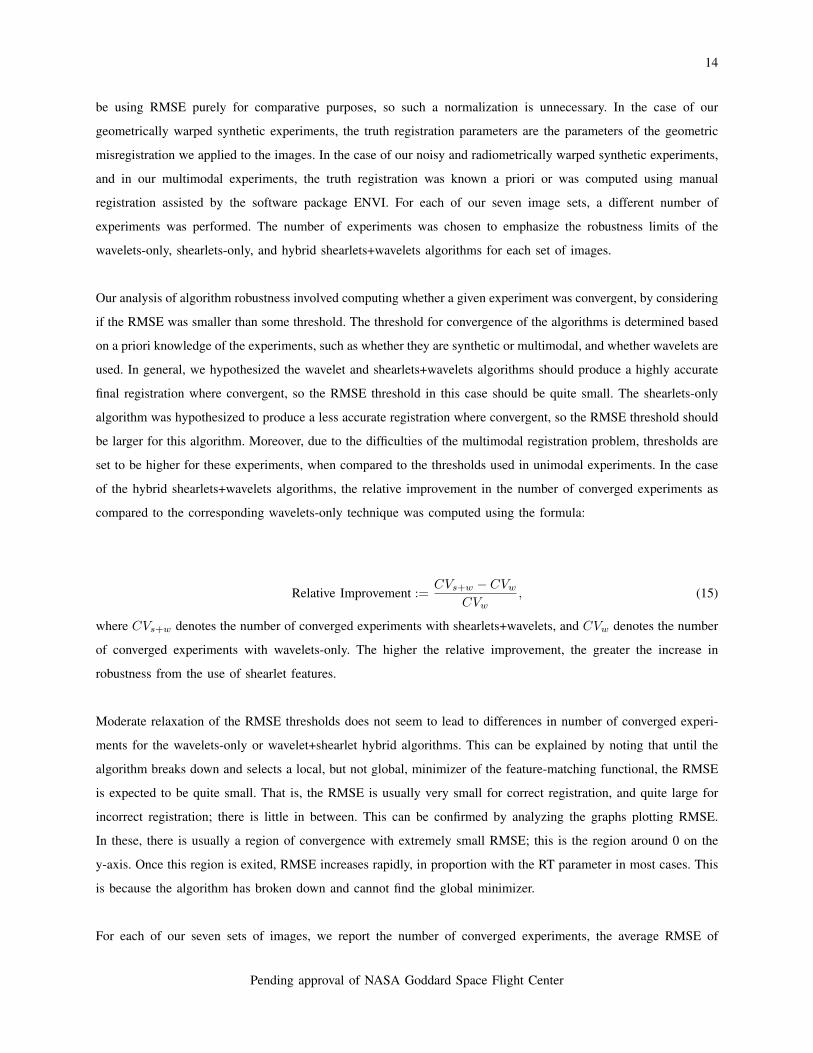
of the hybrid shearlets+wavelets algorithms, the relative improvement in the number of converged experiments as
compared to the corresponding wavelets-only technique was computed using the formula:
Relative Improvement :=CVs+w − CVw
CVw, (15)
where CVs+w denotes the number of converged experiments with shearlets+wavelets, and CVw denotes the number
of converged experiments with wavelets-only. The higher the relative improvement, the greater the increase in
robustness from the use of shearlet features.
Moderate relaxation of the RMSE thresholds does not seem to lead to differences in number of converged experi-
ments for the wavelets-only or wavelet+shearlet hybrid algorithms. This can be explained by noting that until the
algorithm breaks down and selects a local, but not global, minimizer of the feature-matching functional, the RMSE
is expected to be quite small. That is, the RMSE is usually very small for correct registration, and quite large for
incorrect registration; there is little in between. This can be confirmed by analyzing the graphs plotting RMSE.
In these, there is usually a region of convergence with extremely small RMSE; this is the region around 0 on the
y-axis. Once this region is exited, RMSE increases rapidly, in proportion with the RT parameter in most cases. This
is because the algorithm has broken down and cannot find the global minimizer.
For each of our seven sets of images, we report the number of converged experiments, the average RMSE of
Pending approval of NASA Goddard Space Flight Center
15
converged experiments, the standard deviation of the RMSE of converged experiments, and in the case of our
hybrid shearlets+wavelets algorithms, the relative improvement in number of converged experiments. Other metrics
for algorithm accuracy and robustness were considered, such as total number of pixels in each image used for
registration and RMSE leave-one-out computation [45]. Since we used many sets of features for each experiment,
each with over 50000 pixels used, these GCP evaluation techniques suggest the value of our method. Indeed, the
total number of pixels used is very large, and due to the large number of pixels, there is no significant difference
between the computed RMSE and RMSE leave-one-out,
V. EXPERIMENTS ON SYNTHETICALLY GENERATED DATASETS
A. Generation of Synthetic Data
Our seven algorithms were first tested on synthetically generated image pairs. We registered input images that were
warped with respect to their geometry, their noise levels, and their radiometry. This process has the benefit of
simple error computation. Because we knew the exact distortion that was applied to the reference image to acquire
the input image, we could compare our registration result directly to these values. In the case of the geometrically
warped experiments, the input and reference images were artificially moved apart to an increasing degree, and the
initial guess remained fixed. In the case of the noisy and radiometrically warped experiments, the initial guess of
the algorithm was allowed to vary. In both situations, we test robustness of the algorithms, either by having the
images themselves contain geometrically warped information that requires robust features to match efficiently, or
by having the initial registration guess to the algorithm become increasingly inaccurate.
B. Geometrically Warped Landsat-TM Synthetic Experiments
First, we considered the registration of images that had synthetically warped geometry. We performed these
experiments with geometric warping using as the source image a 1024 × 1024 image extracted from Band 4
of a Landsat Thematic Mapper scene of the Mount Hood National Forest; see Figure 4. We then extracted the
center 256×256 sub-image to serve as the reference image. This reference image was then rotated within the larger
source image, in order to acquire a collection of input images. A diagram of this process is shown in Figure 4. The
input images are deliberately misregistered versions of the reference image. The misregistration is parametrized by
the rotation and translations applied to the source image, which are coupled together for ease of comprehension.
That is, we examined images that had been rotated and translated in the x and y direction by the same value. This
joint parameter was denoted RT. For example, if RT= 5.5, then the input image was created from the reference
image by a rotation counter-clockwise of 5.5 degrees and a translation in the x and y directions by 5.5 pixels. In
Pending approval of NASA Goddard Space Flight Center
16
Figure 4, RT = 20. Nearest neighbor interpolation was used to create new pixel values for rotations and non-integer
translations. Letting RT increase from 0, we considered input images that were increasingly misregistered from the
reference image. Consequently, the larger RT was, the more difficult it was for an optimization algorithm to derive
the correct registration parameters. We were interested in allowing for larger values of RT, while maintaining good
registration accuracy; this tests the robustness of our algorithms. Two levels of wavelet and shearlet features were
used for these experiments. The initial registration guess was fixed at (θ, Tx, Ty) = (0, 0, 0) in these experiments.
The RT parameter ranged from 0 to 40, with increments of 0.2. We performed 200 corresponding registration
experiments, in which we used each of our seven registration algorithms to find a registration transformation.
Such a registration transformation is parametrized as a triple of rotation and translation values (θ, Tx, Ty). Table I
displays the number of converged experiments, the percentage of converged experiments, and the average RMSE in
converged cases for each algorithm. The RMSE between each wavelets-only technique and the corresponding hybrid
technique for each RT iteration are displayed graphically in Figure 5. An experiment is considered convergent if
its RMSE < 1, if wavelet features were used. The threshold for shearlets-only convergence was RMSE < 10.
Different thresholds were also considered, with little to no impact in number of converged experiments. In particular,
both the wavelets and shearlets-only thresholds could be set lower without reducing the number of converged
experiments. This is because our algorithms tend to produce fairly consistent RMSE until the algorithm breaks
down, at which point the RMSE spikes dramatically; this can be see in the graphs in Figure 5.
Our results indicate all three wavelets-only algorithms offer strong accuracy when convergent, with low standard
deviation in RMSE. The hybrid shearlets+wavelets algorithms, however, offer substantially increased robustness at
a very small error increase over the convergence set. The shearlets-only algorithm offers strong robustness, but
with higher average RMSE and RMSE standard deviation, indicating its lack of fine precision. It is interesting to
note that all three of the shearlets+wavelets hybrid algorithms have the same number of converged experiments.
This can be justified by recalling that the first stage of all three of the algorithms involves acquiring a first stage
registration, based on shearlets. Thus, when one of the hybrid algorithms fails to converge, it is likely because the
shearlet feature matching step fails to converge. This failure would be the same for all algorithms which begin
with a shearlet feature matching, since it is somewhat unlikely that the second-stage wavelet feature matching
would compensate sufficiently. We conclude that for these geometrically warped synthetic experiments, the hybrid
shearlet-wavelet registration algorithms offer increased robustness over the classical wavelets algorithms.
C. Noisy Landsat-7 ETM+ Experiments
We next considered experiments with Landsat-7 Enhanced Thematic Mapping Plus (ETM+) images with syntheti-
cally added noise. The reference image was a 256×256 image of Washington, DC, captured in 1999 and processed
Pending approval of NASA Goddard Space Flight Center
17
by the USGS EROS Center to remove artifacts and resample the data. For these synthetic experiments, Gaussian
white noise with difference variances was added to the reference image. The reference image and an input image
with added noise appear in Figure 6. We note that multitemporal images of this region of Washington DC were
analyzed in [38], with positive initial results. Here, we study the extent to which noisy images are robustly registered
by our shearlets+wavelets algorithm, when compared to wavelets-only.
Our experiments consisted of adding mean 0 Gaussian white noise N (0, σ2) to the reference image, where the
variance parameter σ2 runs from .01 to .09, stepping by .01. We then registered the input (noisy) image against
the reference (original) image, and allowed the initial guess to change in order to test robustness. In this case, the
truth registration is (θ, Tx, Ty) = (0, 0, 0), because the input image is a noisy version of the original image. For
these experiments, we tested for algorithm robustness by allowing the initial registration guess to vary according
to the RT parameter. The truth registration was modified by RT to produce the initial guess for the algorithm.
For example, if RT= 5.5, then the initial guess of the registration algorithm is a counterclockwise rotation of 5.5
degrees and a translation in both the x and y directions by 5.5 pixels, on top of the truth registration. Since the truth
registration is (θ, Tx, Ty) = (0, 0, 0), the initial guess for RT = 5.5 is (θ0, Tx0 , Ty0) = (5.5, 5.5, 5.5). This method
tests robustness in a slightly different way than did the experiments with geometric warping. For the geometrically
warped experiments, the initial guess was always set to (θ0, Tx0, Ty0
) = (0, 0, 0), but the images themselves were
synthetically misregistered to be increasingly far apart. Here, the initial guess was changed. The RT applied to
the truth registration shall be denoted RTIG to indicate this RT parameter was not applied to create a synthetic
input image, but generates the initial guess of the algorithm. The RTIG parameter was allowed to range from
RTIG = −50 to RTIG = 50, stepping by .5. We performed 201 corresponding registration experiments, with four
levels of wavelet and shearlet features used for matching.
In the interest of space, only the results for the case σ2 = .05 are presented; other experiments with different
σ2 values showed very similar results with respect to performance of wavelets-only versus shearlets+wavelets
hybrid algorithms. We considered convergence threshold RMSE < 1 for all algorithms involving wavelets, and
RMSE < 5 for the shearlets-only algorithm. There was no impact in moderately increasing the threshold for any of
the algorithms, though proportionally fewer shearlets-only experiments were determined to converge as the threshold
decreased from 5 to 1. Results of these experiments appear in Table II. We see that the shearlets+wavelets algorithm
provides more robust and consistent registration than wavelets-only. In particular, the wavelets-only algorithms
decline in quality as noise is added, while the shearlets+wavelets algorithm remains relatively consistent, and even
improves at some points. This could be due to the fact that noise obscures textural features more than edges, and
shearlets are more optimized for edges than textures; this is discussed in greater detail in Section VII.
Pending approval of NASA Goddard Space Flight Center
18
D. Radiometrically Warped Experiments
Our last set of synthetic experiments consisted of radiometrically warped images of Mossy Rock, in the Mount St.
Helens region of Washington state. The original image is a 512× 512 shaded relief lidar image captured in 2002
and produced from a airborne laser swath mapping conducted by Terrapoint, LLC under contract with the USGS.
A detailed discussion of the challenges of lidar data appears in Section VI, subsection B. For these experiments,
we synthetically added radiometric differences via convolution with a point spread function (PSF). The PSF is
implemented by the 512× 512 matrix M , given by:
M(i, j) =
1, 254 ≤ i, j ≤ 258.
0, else.(16)
This matrix is then convolved with our reference image to generate an input image that simulates a radiometrically
varied image of the same scene. This can be considered as a simulation of the challenges of multimodal registration:
many of the same features appear in the images, but not all, and the common features are often rendered differently.
The original image of Mossy Rock, together with the radiometrically warped version, appear in Figure 8. As in the
case with the noisy Landsat-7 ETM+ experiments, we allow the initial guess parameter to vary from RTIG = −50
to RTIG = 50, with steps of .5. Four levels of wavelet and shearlet features were used for registration.
Results of these experiments are given in Table III and Figure 9, for convergence threshold RMSE < 1 for all
algorithms except for shearlets-only, which had threshold RMSE < 5. We also looked at setting the threshold at
2 and 10 for the shearlets-only algorithm, with no impact on the number of converge experiments. We note that
for the remaining seven algorithms, namely wavelets-only and the shearlets+wavelets algorithms, it did not matter
whether the threshold was set to 1 or 5; the convergence and average RMSE was the same. We noticed that in
a few of our shearlet experiments, convergence was achieved in one or two of the three parameters, but not all
three. This led to an approximate registration that was partially correct, but still led to large RMSE. Consequently,
certain hybrid algorithm experiments were convergent for these images, despite the lack of convergence for the
corresponding shearlets-only algorithm experiment. We see that the use of shearlets added considerable robustness
in this case, with the shearlets-only algorithm substantially outperforming all the wavelets-only algorithms. The
hybrid algorithms performed slightly better in general than shearlets-only, but the benefit of the hybrid algorithm
in terms of average RMSE and RMSE standard deviation was minimal when compared to other experiment sets.
This is somewhat anomalous, as shearlets provide a notably less precise registration.
Pending approval of NASA Goddard Space Flight Center
19
VI. EXPERIMENTS ON MULTIMODAL IMAGES
We next considered experiments registering two real images with different modalities. Four sets of multimodal
images were considered: ETM+ RED-to-ETM+ NIR, lidar-to-optical, multispectral-to-panchromatic, and MODIS-
to-ETM. This represented a more realistic test of the functionality of our algorithms, since in reality, image
registration will be between two different images, not an image and a synthetic distortion of itself. Moreover,
these experiments have the potential to substantially impact applied remote sensing. Registration of lidar-derived
data, such as vegetation height, and radiometric images, such as solar reflectance, enable novel fusion studies of
land-cover properties and processes. Our automatic lidar-to-optical registration technique provides a solution for
these disparate data sources. Moreover, many image registration problems in the geosciences involve registering
images of different modalities, so these experiments are relevant to an important class of registration problems. In
particular, the modal differences can make finding GCPs exceedingly difficult. This renders GCP-based automatic
registration algorithms, such as SIFT, sub-optimal.
As an illustration of this, consider two data sources for a WA state mixed land-cover scene: one lidar and the
other optical. These images are shown in Figure 10. The lidar data was acquired in 2003 by Terrapoint, Inc., under
contract to NASA, using a multi-return airborne laser swath mapping (ALSM) instrument. The optical data is a
natural color aerial photograph, presented as a grey-scale image, obtained by the Google Earth database from the
United States Geological Survey in 2006. These data sources have fundamentally different, but related, information
content. A lidar image, commonly referred to as a digital elevation model (DEM), is a measure of the elevation
of the components making up the surface. The data we used is a highest surface DEM. This represents vegetation
canopy tops where vegetated, and ground, roads, and building tops where not vegetated. On the other hand, an
optical image records solar radiance reflected from the surface. The latter is a function of the reflectance of the
surface components and their three-dimensional organization. Together, these define the patterns and brightness
of illuminated and shadowed patches seen in optical images. The features in the two image types are markedly
different and thus are not well suited for GCP identification.
We partially overcome this problem by generating a synthetic shaded-relief image by artificially illuminating the
lidar elevation image with a light source directed in the same orientation as the solar illumination in the optical image
as shown in Figure 10. Similar patterns of illuminated and shadowed patches are produced, but the correspondence
is not exact for the following reasons:
1) The lidar elevation image is not a perfect representation of the surface.
2) The shaded-relief modeling used is not a perfect representation of solar illumination.
3) There can be surface change between the times of lidar and optical image acquisition. The discrepancies
Pending approval of NASA Goddard Space Flight Center

20
between the images can cause erroneous selection of GCPs.
We note that the above construction of the shaded-relief image was also performed to acquire the 512× 512 image
of Mossy Rock used for our radiometrically warped synthetic experiments in Section V, subsection C.
As an experiment, an open-source MATLAB SIFT algorithm [8] was applied to these images, which computes
pairs of points to use for GCP-based registration. The results of this algorithm with default parameters appear in
Figure 11, where the corresponding pixels are linked with a green line. There are far more incorrect pixel pairs
than correct, making this method ineffective for image registration. This highlights a pitfall of automated SIFT for
the registration of multimodal images: the visual similarity of features must be very high. We note that there are
recent modifications to SIFT that are focused on making it adequate for multimodal image registration [9], [10];
while not open-source, these algorithms appear promising in addressing the difficulties GCP-based methods face
for multimodal image registration.
It is important to note that when conducting experiments to assess the accuracy of registration algorithms using
multimodal images, knowing the truth registration between the images is not as straightforward as in synthetic
image registration. In our synthetic experiments, we knew the truth registration of the input images with respect
to the reference image perfectly, since we designed the distortions that produced the input images. Thus, we
easily computed the RMSE between the truth registration and computed registration. In some of our multimodal
image experiments, we did not know a priori the truth registration. We established this via manual selection
of approximately 50 GCPs using the ENVI image processing software and applying its rotation-scale-translation
transformation solution. We performed several iterations of GCP selection and manual registration computation,
averaging the results to acquire our truth registration.
However, as mentioned, this is very difficult for certain image pairs, as there is often little local pixel-to-pixel
correspondence near key features. Indeed, consider the images in Figure 12. These images are subsets of the WA
state lidar shaded-relief and optical images for which we performed registration experiments, depicting the same
alignment of trees. However, there is little pixel-to-pixel correspondence. These images demonstrate that features
in multimodal images can have global correspondence, but not pixel-to-pixel correspondence. Indeed, the same
features can be rendered quite differently in multimodal images. Thus, establishing the truth registration using our
manual GCP method was difficult in these circumstances. As such, the threshold for convergence for the multimodal
experiments should be increased from that used in the synthetic experiments, to account for approximations made
in computing the truth registration.
For these experiments, we tested for algorithm robustness by allowing the initial registration guess for the opti-
Pending approval of NASA Goddard Space Flight Center
21
mization algorithm to vary according to the RTIG parameter, as in the noisy and radiometrically warped synthetic
experiments.
A. ETM+ Red-to ETM+ NIR Registration Experiments
In our first set of multimodal experiments, we considered registering two bands of an ETM+ scene. We registered
the infared/RED band (band 3) to the near infared/NIR band (band 4) of a scene over the Konza Prairie in Kansas,
USA captured in 2001. The truth registration in this case was approximately (θ, Tx, Ty) = (0, 0, 0), because the
images were captured by the same sensor approximately simultaneously. We extracted two large 1024 × 1024
subsets of these scenes, which appear in Figure 13. For these experiments, we let the initial guess vary from
RTIG = −10 to RTIG = 10, stepping by increments of .5, and considered 41 corresponding experiments. We
considered an experiment involving wavelets convergent if RMSE < 1, and a shearlets-only experiment convergent
if RMSE < 5. Four levels of wavelet and shearlet features were used for these experiments.
The results for this set of experiments appear in Table IV and Figure 14. In these experiments, we see the
shearlets+wavelets hybrid algorithms yield substantial robustness improvements over wavelets-only. This is of
particular significance, owing to the large size of the images. These images feature strong edges and some strong
textural features, which indicate why shearlets performed best in terms of robustness, but the Simoncelli low-pass
features performed best among the wavelets-only algorithms. Indeed, the low-pass features are attuned to textures,
which are quite useful features for matching these image pairs. The shearlets-only algorithm performs well, with low
average RMSE and RMSE standard deviation where convergent. Indeed, the benefit of the hybrid shearlets+wavelets
approach, when compared to shearlets-only, is relatively minimal for these experiments.
B. Lidar-to-Optical Registration Experiments
Our next set of multimodal experiments involved registering our WA state lidar shaded-relief image and optical
image of approximately the same scene. The truth registration for these images was computed using our manual
ENVI method to be (θ, Tx, Ty) = (2, 1,−3).
In this experiment, we allowed the initial RTIG parameter to vary from -25 to 25, stepping by 0.5 each time.
These RTIG parameters are applied to the truth registration of (2, 1,−3) to produce the initial guess. We then
performed 101 corresponding image registration experiments with each of the seven algorithms with three levels of
shearlet and wavelet features. An experiment involving wavelets was considered convergent if RMSE < 5, while
Pending approval of NASA Goddard Space Flight Center
22
an experiment involving shearlets was considered convergent if RMSE < 25. The results appear in Table V and
Figure 15.
Our results in this case show Simoncelli low-pass features provide the best robustness out of the three wavelets-only
algorithms. The hybrid shearlets+wavelets algorithms offer some improvement over the classical wavelets, but not
to the same degree as with other experimental datasets Moreover, the shearlets-only algorithm performs the worst
of all the algorithms, with poor average RMSE and RMSE standard deviation. We believe the poor performance of
the shearlets and the strong performance of the low-pass wavelet features can be explained by noticing that these
images are texturally dominant, and that the edges in the lidar and optical images are rendered quite differently; this
analysis will be developed in more detail in Section VII. Indeed, the wavelet stage registration could be overcoming
some of the poor shearlets-only registrations, showing another benefit of the two-stage hybrid algorithm.
We note that we also performed experiments registering the original lidar DEM to the optical image. The results
were uniformly negative for both wavelets-only and shearlets+wavelets, with very poor RMSE for even small values
of RTIG. This indicates that the elevation information in the DEM is too dissimilar from the optical image radiance
information for them to be registered with these techniques. The character of the two scenes’ textures and edges
are manifest in radically different ways. Thus, our construction of the synthetic shaded-relief image, which mimics
the radiance information, is necessary to register the images with the proposed algorithm.
C. Multispectral-to-Panchromatic Registration Experiments
Our third set of multimodal experiments involved registering two bands of a multispectral image. These images of
Hasselt, Belgium were acquired by the Landsat 7 ETM+ sensor in 1999 and distributed as part of the IEEE Geo-
science and Remote Sensing Society 2000 data fusion contest. The first seven bands of the sensor are multispectral,
and produce images covering the visible and infrared spectra; the eighth band is panchromatic. We considered the
registration of band 1 to band 8. Bands 1-7 have a narrow spectral resolution of 450-515 nm, while band 8 has a
broad spectral resolution of 520-900 nm. These images appear in Figure 16. Four levels of wavelet and shearlet
features were used for these experiments.
As an added challenge, these images were artificially misregistered to have truth registration of (θ, Tx, Ty) =
(5, 10, 10). We let the initial RTIG parameter vary from -50 to 50, stepping by 1 each time. We then performed
101 corresponding image registration experiments with each of the seven algorithms, then computed the RMSE
and number of converged experiments. A wavelets-only or shearlets+wavelets hybrid experiment was considered
convergent if RMSE < 5, and a shearlets-only experiment was considered convergent if RMSE < 25. There was
little impact in changing these thresholds by a moderate amount. Results from these experiments appear in Table
Pending approval of NASA Goddard Space Flight Center
23
VI and Figure 17.
Our results indicate that among the three wavelet algorithms, Simoncelli band-pass features are the most robust,
spline wavelets the least so. In all three cases, the shearlets+wavelets hybrid registration algorithm outperforms the
corresponding wavelets-only algorithm. The average RMSE is consistent among all the algorithms, and is higher
than in the synthetic experiments of Section V, but lower than for the lidar-to-optical experiments. This is attributed
to the fact that features in the multispectral and panchromatic images are more similar than the features in the lidar-
to-optical experiments, but are less similar than in the synthetic experiments. In this case, shearlets-only produces a
somewhat high average RMSE, but low RMSE standard deviation, indicating that this method is finding a consistent,
though imprecise, first-stage registration.
We note that in our multispectral-to-panchromatic experiment, only a single multispectral band is registered to
the panchromatic band. The current methodology is only suitable for registering single bands of multispectral or
hyperspectral images to a reference image. An alternative to using only a single band is to apply a dimension
reduction technique to the entire multispectral image, in order to combine the individual bands into a single
representative image. Possible techniques for this are linear methods, such as PCA, and non-linear methods, such
as Laplacian eigenmaps [46] and related graph-kernel methods [47]. Taking as the input image the first principal
component in the case of PCA, or the first eigenvector in the case of Laplacian eigenmaps, and then registering
this to the reference image using our algorithm, is one approach to extending our method to full multispectral and
hyperspectral images.
D. MODIS-to-ETM+ Registration Experiments
Our final set of experiments featured two multimodal images of different resolutions. We registered a 128 × 128
MODIS image at 500 m resolution to a 2048 × 2048 ETM+ image at 31.25 m resolution; these images of the
Konza Prairie in Kansas, USA were captured in 2001, and are in Figure 18. Since these images are of different
resolutions, the truth registration between the images must involve a scaling multiplier, call it s. We computed, using
our ENVI GCP manual registration method, that the truth registration in this case was approximately (θ, Tx, Ty, s) =
(0, 1, 13, 16). In order to register our images of different resolutions, we applied a decimating filter to the higher
resolution image until the scenes were of approximately the same resolution, then called our usual registration
algorithms. We performed our experiments with four levels of shearlet and wavelet features. We let the initial
RTIG parameter vary from -25 to 25, stepping by .5 each time, and performed 101 corresponding experiments.
An experiment involving wavelets was considered convergent if RMSE < 1, and a shearlets-only experiment was
considered convergent if RMSE < 5. There was no effect in adjusting the threshold moderately.
Pending approval of NASA Goddard Space Flight Center
24
The results for our MODIS-to-ETM+ experiments appear in Table VII and Figure 19. It is interesting to note
the total ineffectiveness of spline wavelets and Simoncelli low-pass filters. Shearlets-only performed well, and the
shearlets+wavelets hybrid with band-pass Simoncelli features performed best. The strong performance of shearlets
and the failure of low-pass features can be understood in light of the fact that these images have essentially no
textural features in common. Only the edge-like features share any similarity. This is a common situation for
images of different resolutions: the edge-like features are preserved at different scales, while the textural features
are diminished. It is thus sensible that for images of different resolutions, the Simoncelli low-pass features, which
capture textural information, perform poorly, while shearlets and Simoncelli band-pass features, which capture more
edge-like than textural information, perform well.
VII. SUMMARY AND CONCLUSIONS
A. Analysis of Experiments
We have demonstrated in synthetic and real experiments, with both unimodal and multimodal images, that shearlet
features can be used to increase robustness of wavelets-only image registration algorithms. Table VIII summarizes,
across all experimental data, the improvements from using the hybrid shearlets+wavelets algorithms.
Although registration robustness was improved in all three image experiment sets by the use of the hybrid algorithm,
the extent of improvement varied. In particular, the improvement was noticeably lower in the lidar-to-optical
experiments than in the synthetic experiments or the other multimodal experiments. Edge features were dominant
in the other datasets, particularly the ETM+ noisy synthetic experiments and the MODIS-to-ETM+ multimodal
experiments. These edges are optimally represented by shearlets, and the significant improvement in robustness for
these experiments manifests this. Conversely, the lidar shaded-relief and optical images have fewer common edges
and many more isotropic textures. These textures are not strongly directional, and are not theoretically optimized
by shearlets. That the lidar and optical images display fewer shared edge features is clear from examining the
shearlet features produced by our algorithm; see Figure 20. Consequently, it is reasonable that shearlets would offer
comparatively little improvement over wavelets in terms of registration robustness for these type of images, as they
lack the strong, shared directional features shearlets are known to optimize.
B. Conclusions
We conclude that the experiments performed are practical confirmation of the theoretical properties of shearlets.
When integrated into a hybrid algorithm as a first-stage registration tool, shearlets offer increased robustness in
Pending approval of NASA Goddard Space Flight Center

25
registration with respect to initial registration guess and distance between the images to be registered. The extent of
the robustness increase is closely correlated with the presence of edge-like features in the images to be registered.
If the images have strong edge-features, shearlets can be expected to perform substantially better than wavelets.
Moreover, the edge-information can still be efficiently captured in the case of noise or radiometric distortion, as
indicated with by our synthetic experiments. Indeed, the performance of shearlets can even improve in the presence
of noise, due to the decreased emphasis on textures in noisy images and the increased dominance of edge-features.
However, if the edge-information is weak, or if it is manifested very differently in the two images, then shearlets
are not necessarily superior to wavelets. Indeed, our lidar-to-optical experiments indicate that in such situations,
the use of shearlets as a first-step registration need not offer substantial increases in robustness over wavelets-only.
We often see that for images in which Simoncelli low-pass features provide the best wavelet-based registration,
shearlets+wavelet hybrids offer less significant improvement. This can be explained by noting that these are these are
images in which textures are the most prominent features, not edges. Textures are well-captured by low-frequency
features, such as Simoncelli low-pass features, and are less optimally captured by band-pass features, like shearlets
and Simoncelli band-pass features. In general, edge-dominant images are good candidates for registration with
shearlets+wavelets features, while texture-dominant images are less likely to see substantial improvement over
wavelets-only.
We note that our algorithms are tested with the RT parameter varying, which accounts for differences in angle.
Different ranges of RT are used in different experiment batches, with some experiments using the range [-25, 25],
some [0, 40], some [-50, 50]. This corresponds to angles ranging from -25 to 25 degrees, 0 to 40 degrees, and -50
to 50 degrees, respectively. We believe this constitutes moderately sized angular differences. In all experiments, the
algorithms begin to fail by the time the largest angles are reached, meaning that the algorithms are quite unlikely
to provide accurate or robust registration for larger angles. This indicates a limitation of our approach: it is unable
to recover very large angular misregistrations, at least when they are coupled with translation misregistrations.
C. Future Work
In light of the success of the current experiments, it would be of interest to test other directionally-sensitive
representation systems in place of shearlets, such as curvelets or contourlets. These systems produce sparse features
that represent edge optimally, in a manner theoretically similar to shearlets. How they would perform for image
registration, compared to shearlets, is not clear. Shearlets were chosen for the proposed algorithm not only for their
anisotropic sensitivity, but for their efficient computational implementation. The other anisotropic methods under
discussion are numerically implemented by not one basis function ψ, but by a finite family of functions. This variety
of generating functions is often considered a disadvantage, but could offer flexibility in registering a wide variety
Pending approval of NASA Goddard Space Flight Center
26
of images, with basis functions adapted for certain non-linear edge features found in images.
All the experiments in this article used as a search space the space of all RST transformations. In future work, we
shall examine incorporating polynomial transformations in our algorithm to address more complex, spatially varying
distortions within images. Such images could include remotely sensed images which have not been ortho-rectified
to remove distortions due to topography. We are also interested in developing our algorithm further to work for
non-rigid transformations. This would require substantial re-working of the optimization procedure, making this
project a major departure from the present work.
As alluded to in Section VI, subsection C., it is also of interest to apply these harmonic analytic techniques to the
registration of more complicated data types, such a three-dimensional representations of data, extending beyond the
two-dimensional images considered in this article. For example, lidar measures the three-dimensional distribution
of vegetation components from which the two-dimensional highest surface DEM used in this article was derived;
see Figure 10. Registration in the z direction, as well as x and y, of multitemporal 3-D lidar cubes could aid in
the identification of areas of vertical vegetation change due to processes such as growth, tree mortality, fire and
human land use activities. This approach could also be applied to multispectral or hyperspectral image cubes in
which the z dimension is a record of spectral absorption features. 3-D registration of multitemporal data could aid
in the identification of locations that have undergone spectral change. Three dimensional shearlet implementations
exist [48], and could be applied to this problem. Moreover, 3-D shearlet methods could allow for registration of full
multispectral and hyperspectral images. This could produce a more sophisticated approach than the one proposed in
this paper for multispectral-to-panchromatic registration, in which only a single multispectral band was considered.
Moreover, a portion of the above algorithm runs in MATLAB, namely the computation of the shearlet features
used for registration. This makes comparative timing tests for the above algorithm challenging, since most of the
algorithm is coded in C. Thus, the conversion of this portion of the algorithm to C is the topic of future research.
In addition to making timing tests possible, the conversion of the MATLAB portion to C would expand the class
of image sizes appropriate for this algorithm. This is because C uses memory more efficiently than MATLAB, so
larger images could easily run with this modified algorithm.
VIII. ACKNOWLEDGEMENTS
We acknowledge NASA’s Goddard Space Flight Center for funding the first author’s summer internship. The research
conducted at Goddard during that time is the basis for this article. In addition, we thank Wojciech Czaja of the
University of Maryland and Omar Navarro Leija of the University of Nevada for providing valuable insights related
to this work. We also thank the IEEE Geoscience and Remote Sensing Society Data Fusion committee for providing
Pending approval of NASA Goddard Space Flight Center
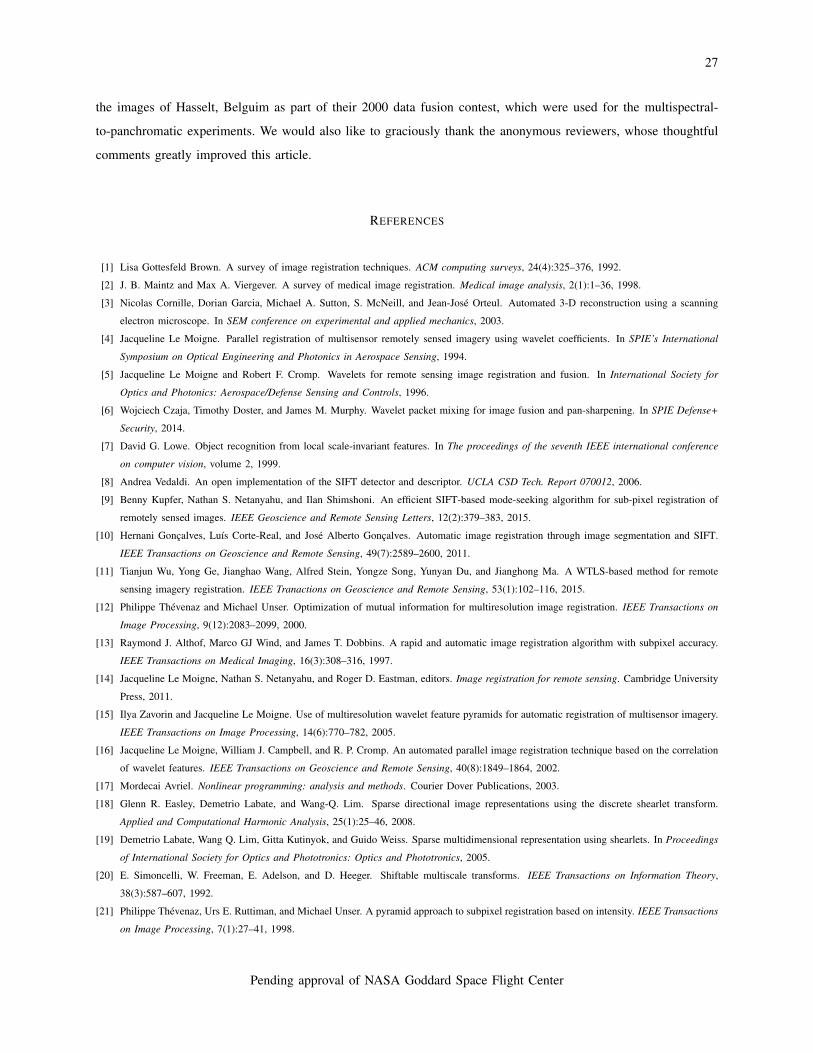
27
the images of Hasselt, Belguim as part of their 2000 data fusion contest, which were used for the multispectral-
to-panchromatic experiments. We would also like to graciously thank the anonymous reviewers, whose thoughtful
comments greatly improved this article.
REFERENCES
[1] Lisa Gottesfeld Brown. A survey of image registration techniques. ACM computing surveys, 24(4):325–376, 1992.
[2] J. B. Maintz and Max A. Viergever. A survey of medical image registration. Medical image analysis, 2(1):1–36, 1998.
[3] Nicolas Cornille, Dorian Garcia, Michael A. Sutton, S. McNeill, and Jean-Jose Orteul. Automated 3-D reconstruction using a scanning
electron microscope. In SEM conference on experimental and applied mechanics, 2003.
[4] Jacqueline Le Moigne. Parallel registration of multisensor remotely sensed imagery using wavelet coefficients. In SPIE’s International
Symposium on Optical Engineering and Photonics in Aerospace Sensing, 1994.
[5] Jacqueline Le Moigne and Robert F. Cromp. Wavelets for remote sensing image registration and fusion. In International Society for
Optics and Photonics: Aerospace/Defense Sensing and Controls, 1996.
[6] Wojciech Czaja, Timothy Doster, and James M. Murphy. Wavelet packet mixing for image fusion and pan-sharpening. In SPIE Defense+
Security, 2014.
[7] David G. Lowe. Object recognition from local scale-invariant features. In The proceedings of the seventh IEEE international conference
on computer vision, volume 2, 1999.
[8] Andrea Vedaldi. An open implementation of the SIFT detector and descriptor. UCLA CSD Tech. Report 070012, 2006.
[9] Benny Kupfer, Nathan S. Netanyahu, and Ilan Shimshoni. An efficient SIFT-based mode-seeking algorithm for sub-pixel registration of
remotely sensed images. IEEE Geoscience and Remote Sensing Letters, 12(2):379–383, 2015.
[10] Hernani Goncalves, Luıs Corte-Real, and Jose Alberto Goncalves. Automatic image registration through image segmentation and SIFT.
IEEE Transactions on Geoscience and Remote Sensing, 49(7):2589–2600, 2011.
[11] Tianjun Wu, Yong Ge, Jianghao Wang, Alfred Stein, Yongze Song, Yunyan Du, and Jianghong Ma. A WTLS-based method for remote
sensing imagery registration. IEEE Tranactions on Geoscience and Remote Sensing, 53(1):102–116, 2015.
[12] Philippe Thevenaz and Michael Unser. Optimization of mutual information for multiresolution image registration. IEEE Transactions on
Image Processing, 9(12):2083–2099, 2000.
[13] Raymond J. Althof, Marco GJ Wind, and James T. Dobbins. A rapid and automatic image registration algorithm with subpixel accuracy.
IEEE Transactions on Medical Imaging, 16(3):308–316, 1997.
[14] Jacqueline Le Moigne, Nathan S. Netanyahu, and Roger D. Eastman, editors. Image registration for remote sensing. Cambridge University
Press, 2011.
[15] Ilya Zavorin and Jacqueline Le Moigne. Use of multiresolution wavelet feature pyramids for automatic registration of multisensor imagery.
IEEE Transactions on Image Processing, 14(6):770–782, 2005.
[16] Jacqueline Le Moigne, William J. Campbell, and R. P. Cromp. An automated parallel image registration technique based on the correlation
of wavelet features. IEEE Transactions on Geoscience and Remote Sensing, 40(8):1849–1864, 2002.
[17] Mordecai Avriel. Nonlinear programming: analysis and methods. Courier Dover Publications, 2003.
[18] Glenn R. Easley, Demetrio Labate, and Wang-Q. Lim. Sparse directional image representations using the discrete shearlet transform.
Applied and Computational Harmonic Analysis, 25(1):25–46, 2008.
[19] Demetrio Labate, Wang Q. Lim, Gitta Kutinyok, and Guido Weiss. Sparse multidimensional representation using shearlets. In Proceedings
of International Society for Optics and Phototronics: Optics and Phototronics, 2005.
[20] E. Simoncelli, W. Freeman, E. Adelson, and D. Heeger. Shiftable multiscale transforms. IEEE Transactions on Information Theory,
38(3):587–607, 1992.
[21] Philippe Thevenaz, Urs E. Ruttiman, and Michael Unser. A pyramid approach to subpixel registration based on intensity. IEEE Transactions
on Image Processing, 7(1):27–41, 1998.
Pending approval of NASA Goddard Space Flight Center
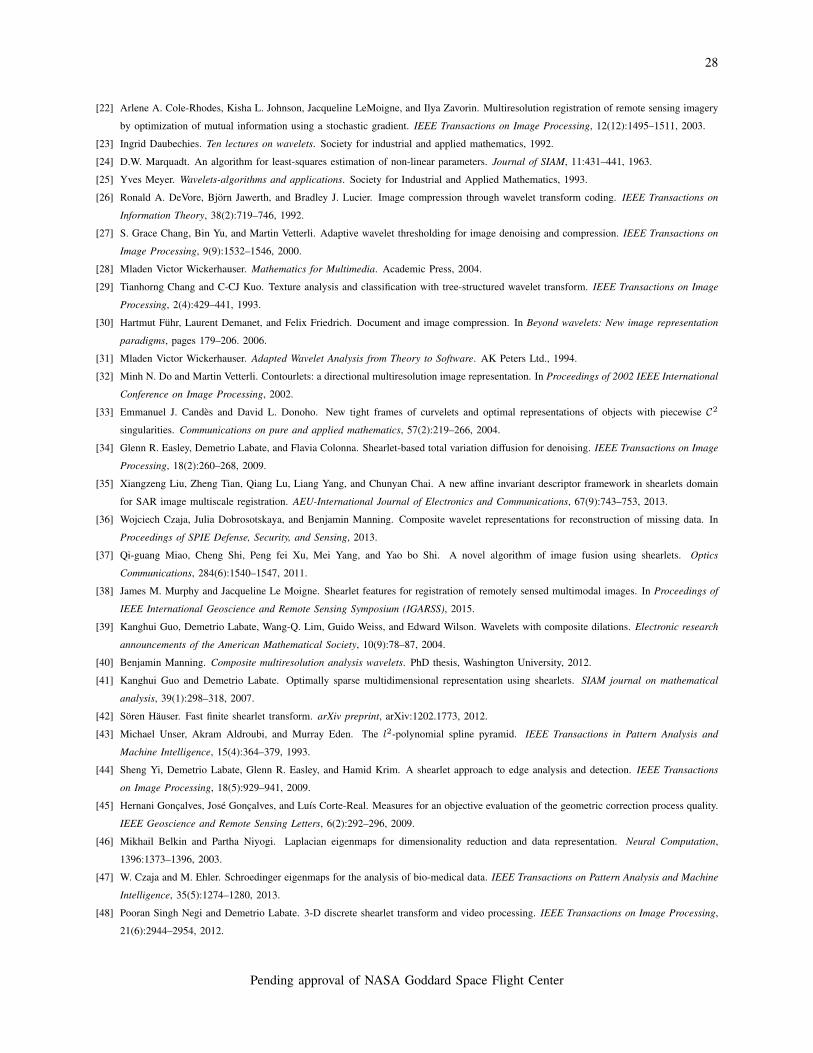
28
[22] Arlene A. Cole-Rhodes, Kisha L. Johnson, Jacqueline LeMoigne, and Ilya Zavorin. Multiresolution registration of remote sensing imagery
by optimization of mutual information using a stochastic gradient. IEEE Transactions on Image Processing, 12(12):1495–1511, 2003.
[23] Ingrid Daubechies. Ten lectures on wavelets. Society for industrial and applied mathematics, 1992.
[24] D.W. Marquadt. An algorithm for least-squares estimation of non-linear parameters. Journal of SIAM, 11:431–441, 1963.
[25] Yves Meyer. Wavelets-algorithms and applications. Society for Industrial and Applied Mathematics, 1993.
[26] Ronald A. DeVore, Bjorn Jawerth, and Bradley J. Lucier. Image compression through wavelet transform coding. IEEE Transactions on
Information Theory, 38(2):719–746, 1992.
[27] S. Grace Chang, Bin Yu, and Martin Vetterli. Adaptive wavelet thresholding for image denoising and compression. IEEE Transactions on
Image Processing, 9(9):1532–1546, 2000.
[28] Mladen Victor Wickerhauser. Mathematics for Multimedia. Academic Press, 2004.
[29] Tianhorng Chang and C-CJ Kuo. Texture analysis and classification with tree-structured wavelet transform. IEEE Transactions on Image
Processing, 2(4):429–441, 1993.
[30] Hartmut Fuhr, Laurent Demanet, and Felix Friedrich. Document and image compression. In Beyond wavelets: New image representation
paradigms, pages 179–206. 2006.
[31] Mladen Victor Wickerhauser. Adapted Wavelet Analysis from Theory to Software. AK Peters Ltd., 1994.
[32] Minh N. Do and Martin Vetterli. Contourlets: a directional multiresolution image representation. In Proceedings of 2002 IEEE International
Conference on Image Processing, 2002.
[33] Emmanuel J. Candes and David L. Donoho. New tight frames of curvelets and optimal representations of objects with piecewise C2
singularities. Communications on pure and applied mathematics, 57(2):219–266, 2004.
[34] Glenn R. Easley, Demetrio Labate, and Flavia Colonna. Shearlet-based total variation diffusion for denoising. IEEE Transactions on Image
Processing, 18(2):260–268, 2009.
[35] Xiangzeng Liu, Zheng Tian, Qiang Lu, Liang Yang, and Chunyan Chai. A new affine invariant descriptor framework in shearlets domain
for SAR image multiscale registration. AEU-International Journal of Electronics and Communications, 67(9):743–753, 2013.
[36] Wojciech Czaja, Julia Dobrosotskaya, and Benjamin Manning. Composite wavelet representations for reconstruction of missing data. In
Proceedings of SPIE Defense, Security, and Sensing, 2013.
[37] Qi-guang Miao, Cheng Shi, Peng fei Xu, Mei Yang, and Yao bo Shi. A novel algorithm of image fusion using shearlets. Optics
Communications, 284(6):1540–1547, 2011.
[38] James M. Murphy and Jacqueline Le Moigne. Shearlet features for registration of remotely sensed multimodal images. In Proceedings of
IEEE International Geoscience and Remote Sensing Symposium (IGARSS), 2015.
[39] Kanghui Guo, Demetrio Labate, Wang-Q. Lim, Guido Weiss, and Edward Wilson. Wavelets with composite dilations. Electronic research
announcements of the American Mathematical Society, 10(9):78–87, 2004.
[40] Benjamin Manning. Composite multiresolution analysis wavelets. PhD thesis, Washington University, 2012.
[41] Kanghui Guo and Demetrio Labate. Optimally sparse multidimensional representation using shearlets. SIAM journal on mathematical
analysis, 39(1):298–318, 2007.
[42] Soren Hauser. Fast finite shearlet transform. arXiv preprint, arXiv:1202.1773, 2012.
[43] Michael Unser, Akram Aldroubi, and Murray Eden. The l2-polynomial spline pyramid. IEEE Transactions in Pattern Analysis and
Machine Intelligence, 15(4):364–379, 1993.
[44] Sheng Yi, Demetrio Labate, Glenn R. Easley, and Hamid Krim. A shearlet approach to edge analysis and detection. IEEE Transactions
on Image Processing, 18(5):929–941, 2009.
[45] Hernani Goncalves, Jose Goncalves, and Luıs Corte-Real. Measures for an objective evaluation of the geometric correction process quality.
IEEE Geoscience and Remote Sensing Letters, 6(2):292–296, 2009.
[46] Mikhail Belkin and Partha Niyogi. Laplacian eigenmaps for dimensionality reduction and data representation. Neural Computation,
1396:1373–1396, 2003.
[47] W. Czaja and M. Ehler. Schroedinger eigenmaps for the analysis of bio-medical data. IEEE Transactions on Pattern Analysis and Machine
Intelligence, 35(5):1274–1280, 2013.
[48] Pooran Singh Negi and Demetrio Labate. 3-D discrete shearlet transform and video processing. IEEE Transactions on Image Processing,
21(6):2944–2954, 2012.
Pending approval of NASA Goddard Space Flight Center

29
IX. FIGURES AND TABLES
Fig. 1: A 256 × 256 grayscale optical image of a mixed land-cover area in Washington state containing both textural and
edge-like features.
Fig. 2: Wavelet (left) and shearlet (right) features extracted from Figure 1, emphasizing textural and edge features, respectively.
Pending approval of NASA Goddard Space Flight Center
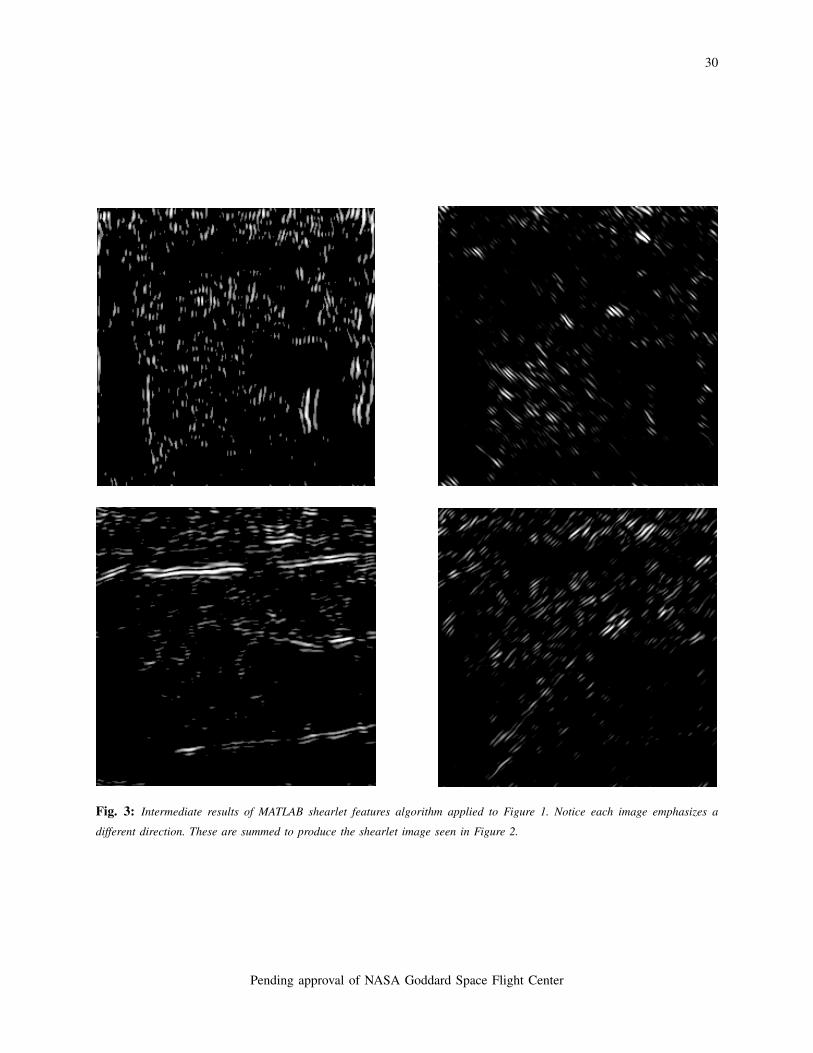
30
Fig. 3: Intermediate results of MATLAB shearlet features algorithm applied to Figure 1. Notice each image emphasizes a
different direction. These are summed to produce the shearlet image seen in Figure 2.
Pending approval of NASA Goddard Space Flight Center
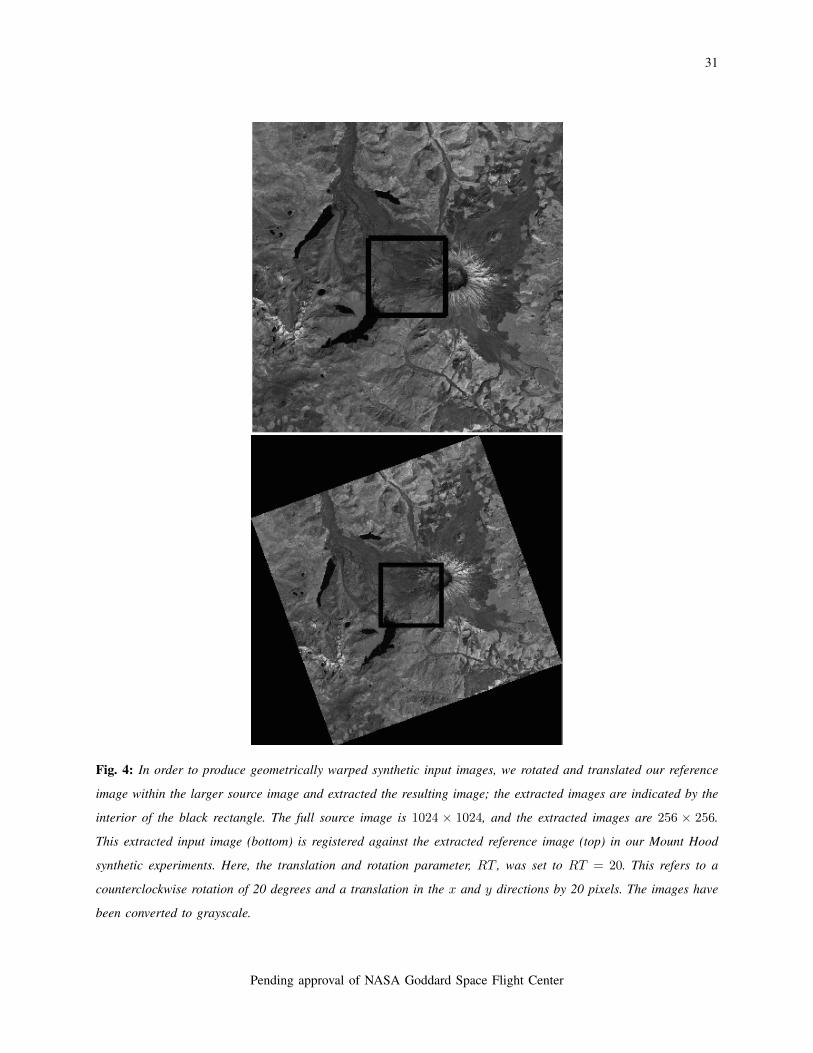
31
Fig. 4: In order to produce geometrically warped synthetic input images, we rotated and translated our reference
image within the larger source image and extracted the resulting image; the extracted images are indicated by the
interior of the black rectangle. The full source image is 1024 × 1024, and the extracted images are 256 × 256.
This extracted input image (bottom) is registered against the extracted reference image (top) in our Mount Hood
synthetic experiments. Here, the translation and rotation parameter, RT , was set to RT = 20. This refers to a
counterclockwise rotation of 20 degrees and a translation in the x and y directions by 20 pixels. The images have
been converted to grayscale.
Pending approval of NASA Goddard Space Flight Center
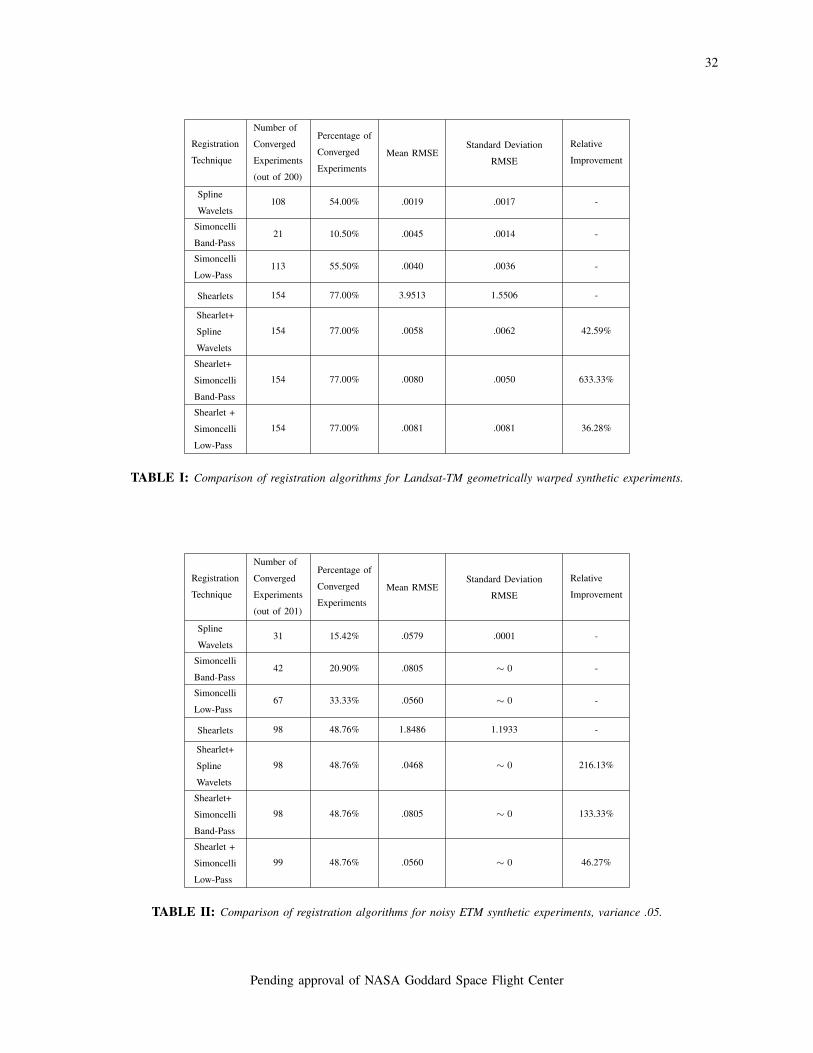
32
Registration
Technique
Number of
Converged
Experiments
(out of 200)
Percentage of
Converged
Experiments
Mean RMSEStandard Deviation
RMSE
Relative
Improvement
Spline
Wavelets108 54.00% .0019 .0017 -
Simoncelli
Band-Pass21 10.50% .0045 .0014 -
Simoncelli
Low-Pass113 55.50% .0040 .0036 -
Shearlets 154 77.00% 3.9513 1.5506 -
Shearlet+
Spline
Wavelets
154 77.00% .0058 .0062 42.59%
Shearlet+
Simoncelli
Band-Pass
154 77.00% .0080 .0050 633.33%
Shearlet +
Simoncelli
Low-Pass
154 77.00% .0081 .0081 36.28%
TABLE I: Comparison of registration algorithms for Landsat-TM geometrically warped synthetic experiments.
Registration
Technique
Number of
Converged
Experiments
(out of 201)
Percentage of
Converged
Experiments
Mean RMSEStandard Deviation
RMSE
Relative
Improvement
Spline
Wavelets31 15.42% .0579 .0001 -
Simoncelli
Band-Pass42 20.90% .0805 ∼ 0 -
Simoncelli
Low-Pass67 33.33% .0560 ∼ 0 -
Shearlets 98 48.76% 1.8486 1.1933 -
Shearlet+
Spline
Wavelets
98 48.76% .0468 ∼ 0 216.13%
Shearlet+
Simoncelli
Band-Pass
98 48.76% .0805 ∼ 0 133.33%
Shearlet +
Simoncelli
Low-Pass
99 48.76% .0560 ∼ 0 46.27%
TABLE II: Comparison of registration algorithms for noisy ETM synthetic experiments, variance .05.
Pending approval of NASA Goddard Space Flight Center
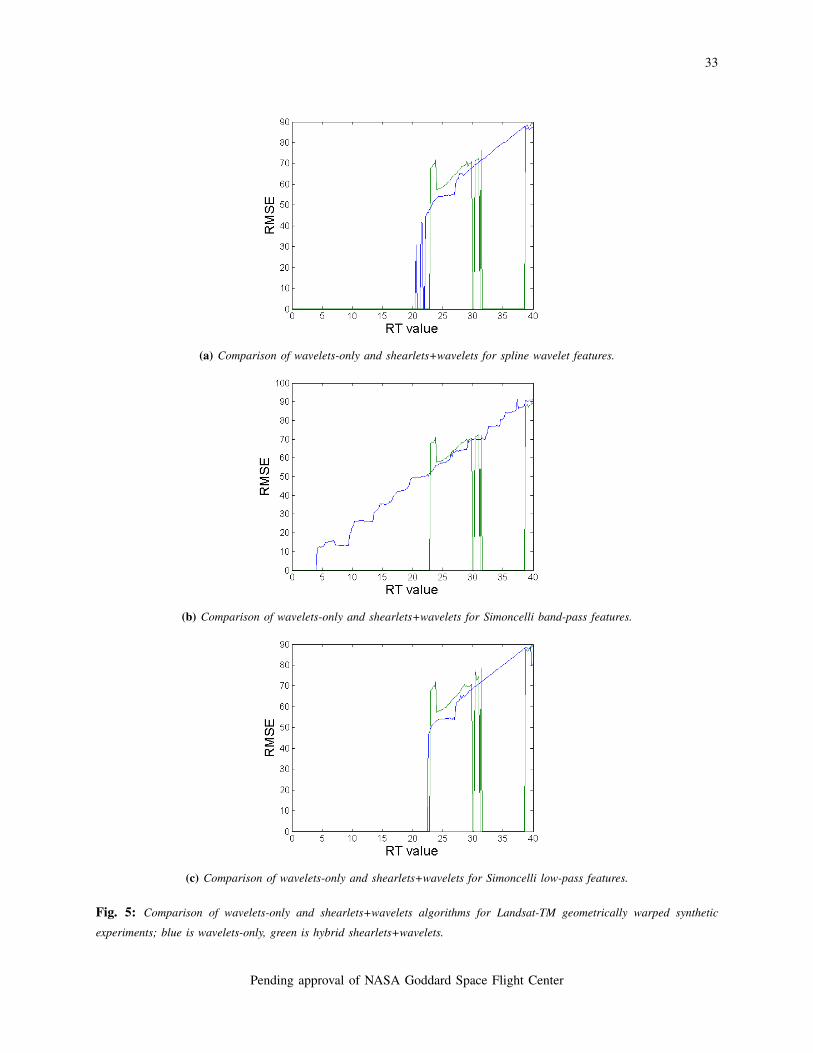
33
(a) Comparison of wavelets-only and shearlets+wavelets for spline wavelet features.
(b) Comparison of wavelets-only and shearlets+wavelets for Simoncelli band-pass features.
(c) Comparison of wavelets-only and shearlets+wavelets for Simoncelli low-pass features.
Fig. 5: Comparison of wavelets-only and shearlets+wavelets algorithms for Landsat-TM geometrically warped synthetic
experiments; blue is wavelets-only, green is hybrid shearlets+wavelets.
Pending approval of NASA Goddard Space Flight Center

34
Fig. 6: 256 × 256 Landsat-7 ETM+ images of Washington D.C. without (left) and with Gaussian noise added
(right). The parameters for the noise are mean µ = 0 and variance σ2 = .05. The images have been converted to
grayscale.
Registration
Technique
Number of
Converged
Experiments
(out of 201)
Percentage of
Converged
Experiments
Mean RMSEStandard Deviation
RMSE
Relative
Improvement
Spline
Wavelets74 36.82% .3552 .0256 -
Simoncelli
Band-Pass42 20.90% .0074 ∼ 0 -
Simoncelli
Low-Pass72 35.82% .2412 .0166 -
Shearlets 108 53.73% .0304 .0012 -
Shearlet+
Spline
Wavelets
111 55.22% .3222 .0143 50.00%
Shearlet+
Simoncelli
Band-Pass
108 53.73% .0075 ∼ 0 157.14%
Shearlet +
Simoncelli
Low-Pass
111 55.22% .2432 ∼ 0 54.71%
TABLE III: Comparison of registration algorithms for radiometrically warped lidar synthetic experiments.
Pending approval of NASA Goddard Space Flight Center

35
(a) Comparison of wavelets-only and shearlets+wavelets for spline wavelet features.
(b) Comparison of wavelets-only and shearlets+wavelets for Simoncelli band-pass features.
(c) Comparison of wavelets-only and shearlets+wavelets for Simoncelli low-pass features.
Fig. 7: Comparison of wavelets-only and shearlets+wavelets algorithms for noisy ETM+ synthetic experiments; blue is wavelets-
only, green is hybrid shearlets+wavelets.
Pending approval of NASA Goddard Space Flight Center
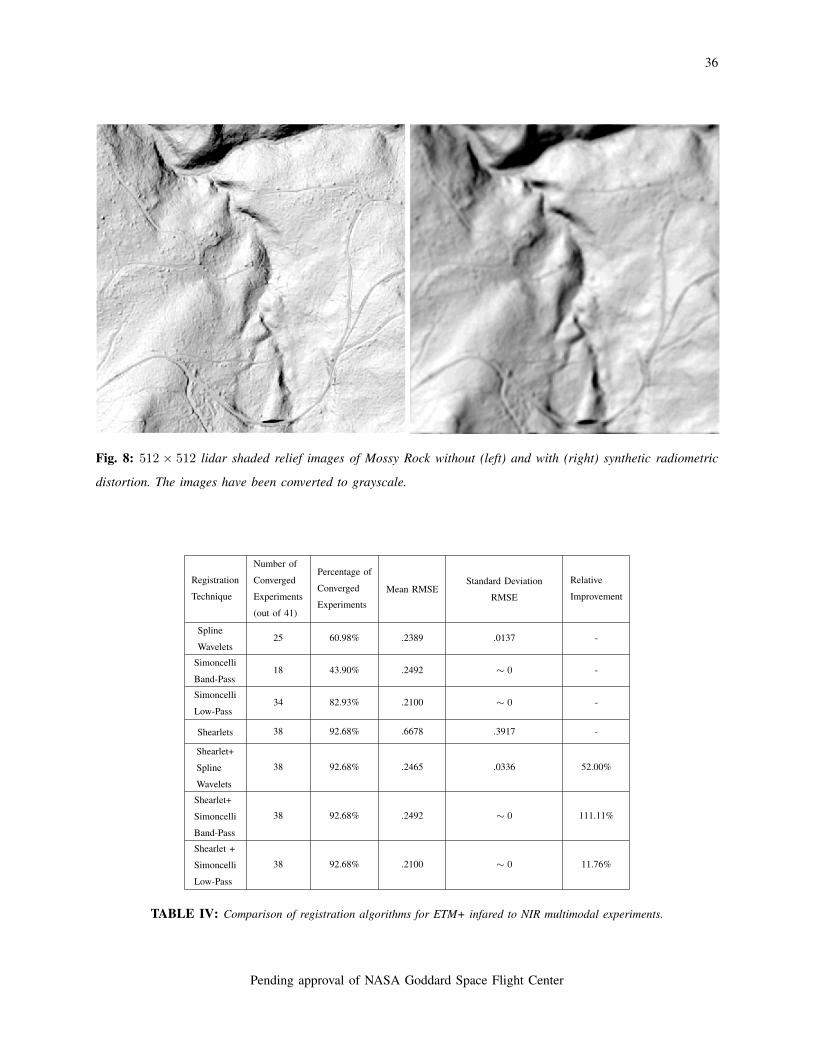
36
Fig. 8: 512 × 512 lidar shaded relief images of Mossy Rock without (left) and with (right) synthetic radiometric
distortion. The images have been converted to grayscale.
Registration
Technique
Number of
Converged
Experiments
(out of 41)
Percentage of
Converged
Experiments
Mean RMSEStandard Deviation
RMSE
Relative
Improvement
Spline
Wavelets25 60.98% .2389 .0137 -
Simoncelli
Band-Pass18 43.90% .2492 ∼ 0 -
Simoncelli
Low-Pass34 82.93% .2100 ∼ 0 -
Shearlets 38 92.68% .6678 .3917 -
Shearlet+
Spline
Wavelets
38 92.68% .2465 .0336 52.00%
Shearlet+
Simoncelli
Band-Pass
38 92.68% .2492 ∼ 0 111.11%
Shearlet +
Simoncelli
Low-Pass
38 92.68% .2100 ∼ 0 11.76%
TABLE IV: Comparison of registration algorithms for ETM+ infared to NIR multimodal experiments.
Pending approval of NASA Goddard Space Flight Center
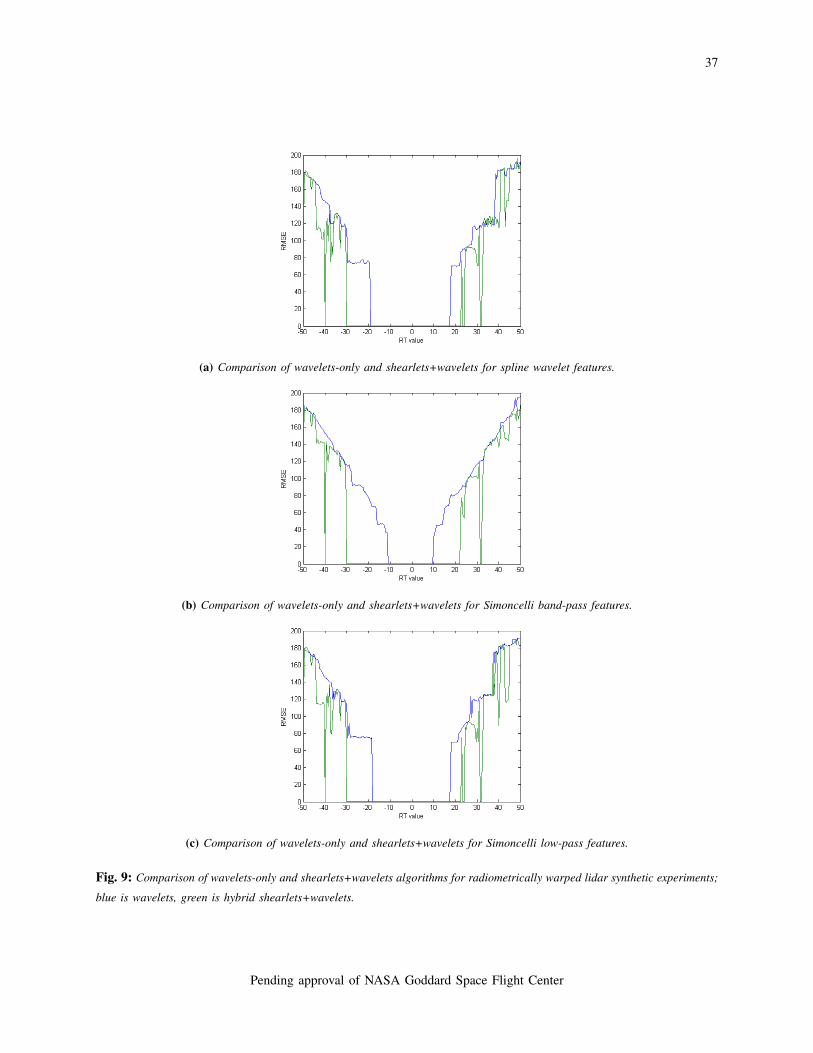
37
(a) Comparison of wavelets-only and shearlets+wavelets for spline wavelet features.
(b) Comparison of wavelets-only and shearlets+wavelets for Simoncelli band-pass features.
(c) Comparison of wavelets-only and shearlets+wavelets for Simoncelli low-pass features.
Fig. 9: Comparison of wavelets-only and shearlets+wavelets algorithms for radiometrically warped lidar synthetic experiments;
blue is wavelets, green is hybrid shearlets+wavelets.
Pending approval of NASA Goddard Space Flight Center
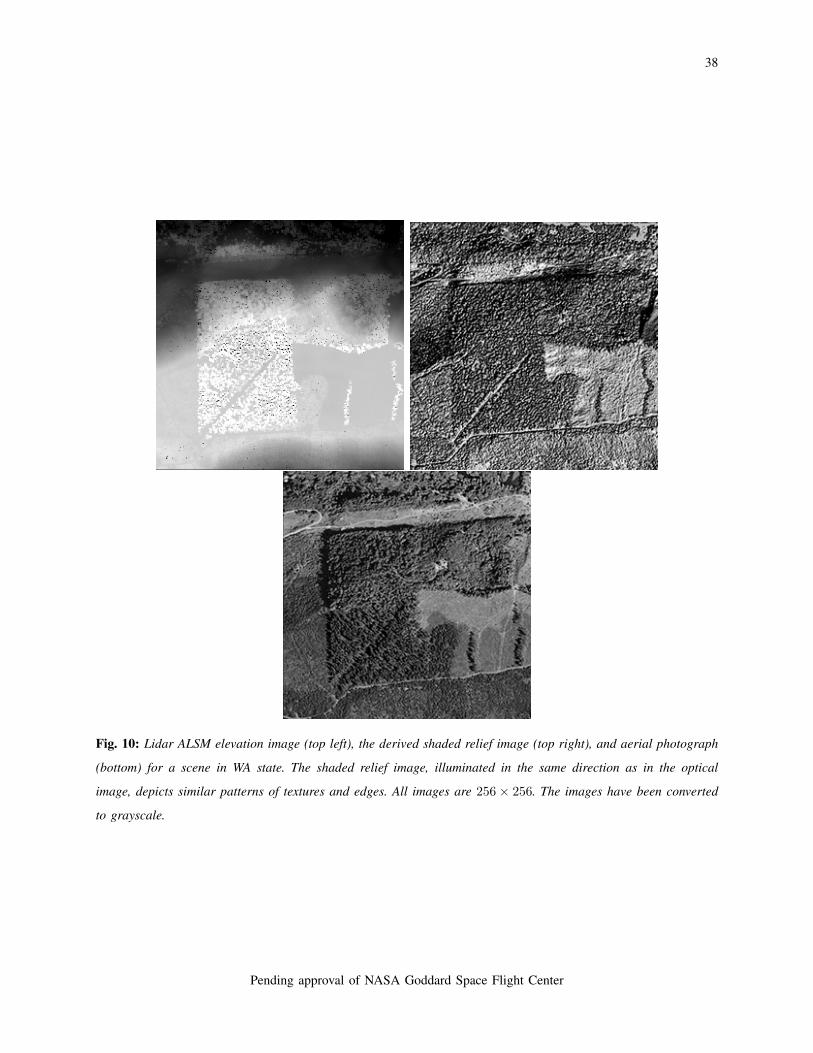
38
Fig. 10: Lidar ALSM elevation image (top left), the derived shaded relief image (top right), and aerial photograph
(bottom) for a scene in WA state. The shaded relief image, illuminated in the same direction as in the optical
image, depicts similar patterns of textures and edges. All images are 256× 256. The images have been converted
to grayscale.
Pending approval of NASA Goddard Space Flight Center

39
Fig. 11: The pixels computed by SIFT in the lidar shaded-relief (left) and optical (right) images of WA, connected
by green lines. Note the lack of correspondence; such points are unsuitable for a registration algorithm.
Fig. 12: The same alignment of trees in the lidar shaded-relief (left) and optical (right) images of WA. Although
there is clear correspondence at the macroscopic level, it is difficult to find pixel-to-pixel correspondences.
Pending approval of NASA Goddard Space Flight Center
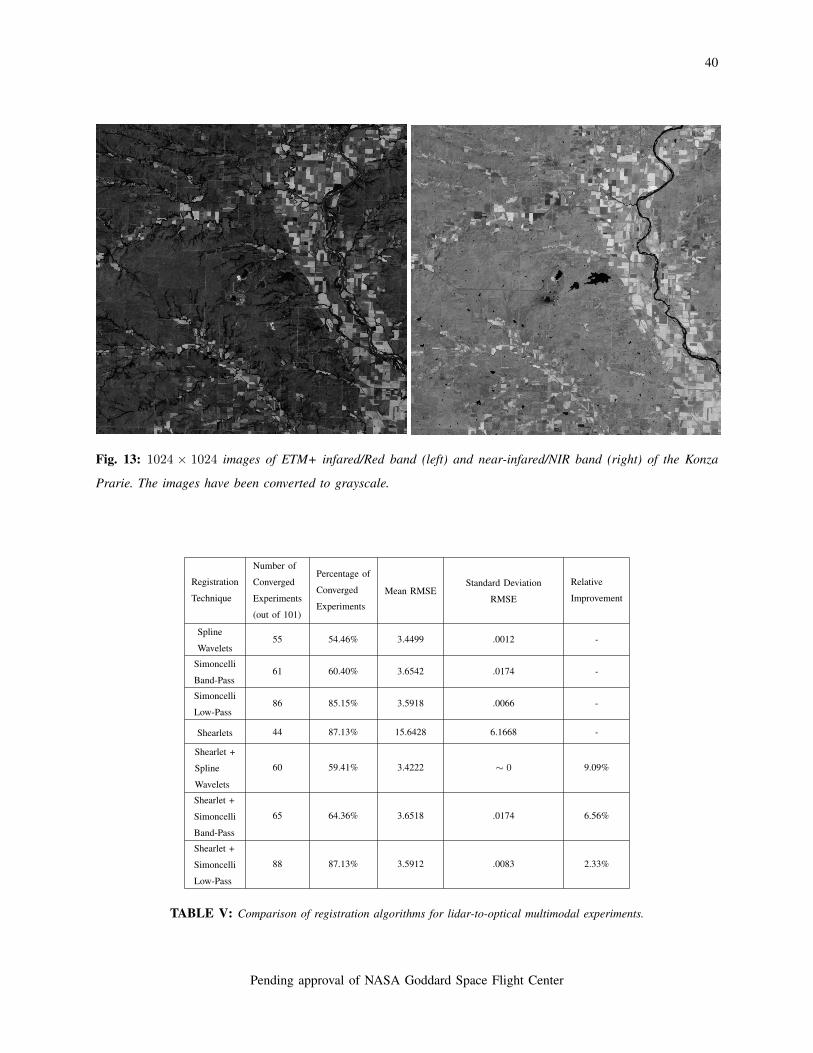
40
Fig. 13: 1024 × 1024 images of ETM+ infared/Red band (left) and near-infared/NIR band (right) of the Konza
Prarie. The images have been converted to grayscale.
Registration
Technique
Number of
Converged
Experiments
(out of 101)
Percentage of
Converged
Experiments
Mean RMSEStandard Deviation
RMSE
Relative
Improvement
Spline
Wavelets55 54.46% 3.4499 .0012 -
Simoncelli
Band-Pass61 60.40% 3.6542 .0174 -
Simoncelli
Low-Pass86 85.15% 3.5918 .0066 -
Shearlets 44 87.13% 15.6428 6.1668 -
Shearlet +
Spline
Wavelets
60 59.41% 3.4222 ∼ 0 9.09%
Shearlet +
Simoncelli
Band-Pass
65 64.36% 3.6518 .0174 6.56%
Shearlet +
Simoncelli
Low-Pass
88 87.13% 3.5912 .0083 2.33%
TABLE V: Comparison of registration algorithms for lidar-to-optical multimodal experiments.
Pending approval of NASA Goddard Space Flight Center

41
(a) Comparison of wavelets-only and shearlets+wavelets for spline wavelet features.
(b) Comparison of wavelets-only and shearlets+wavelets for Simoncelli band-pass features.
(c) Comparison of wavelets-only and shearlets+wavelets for Simoncelli low-pass features.
Fig. 14: Comparison of wavelets-only and shearlets+wavelets algorithms for ETM+ infared to NIR experiments; blue is
wavelets, green is hybrid shearlets+wavelets.
Pending approval of NASA Goddard Space Flight Center

42
(a) Comparison of wavelets-only and shearlets+wavelets for spline wavelet features.
(b) Comparison of wavelets-only and shearlets+wavelets for Simoncelli band-pass features.
(c) Comparison of wavelets-only and shearlets+wavelets for Simoncelli low-pass features.
Fig. 15: Comparison of wavelets-only and shearlets+wavelets algorithms for WA lidar-to-optical experiment; blue
is wavelets, green is hybrid shearlets+wavelets.
Pending approval of NASA Goddard Space Flight Center
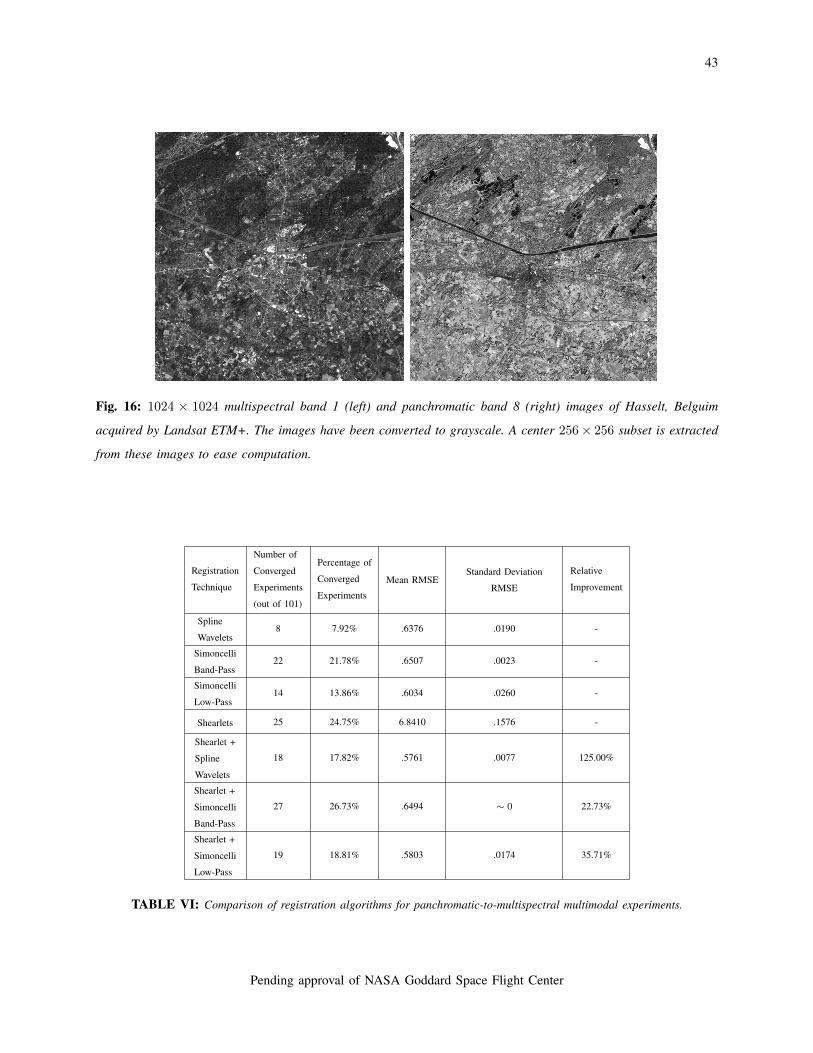
43
Fig. 16: 1024 × 1024 multispectral band 1 (left) and panchromatic band 8 (right) images of Hasselt, Belguim
acquired by Landsat ETM+. The images have been converted to grayscale. A center 256× 256 subset is extracted
from these images to ease computation.
Registration
Technique
Number of
Converged
Experiments
(out of 101)
Percentage of
Converged
Experiments
Mean RMSEStandard Deviation
RMSE
Relative
Improvement
Spline
Wavelets8 7.92% .6376 .0190 -
Simoncelli
Band-Pass22 21.78% .6507 .0023 -
Simoncelli
Low-Pass14 13.86% .6034 .0260 -
Shearlets 25 24.75% 6.8410 .1576 -
Shearlet +
Spline
Wavelets
18 17.82% .5761 .0077 125.00%
Shearlet +
Simoncelli
Band-Pass
27 26.73% .6494 ∼ 0 22.73%
Shearlet +
Simoncelli
Low-Pass
19 18.81% .5803 .0174 35.71%
TABLE VI: Comparison of registration algorithms for panchromatic-to-multispectral multimodal experiments.
Pending approval of NASA Goddard Space Flight Center
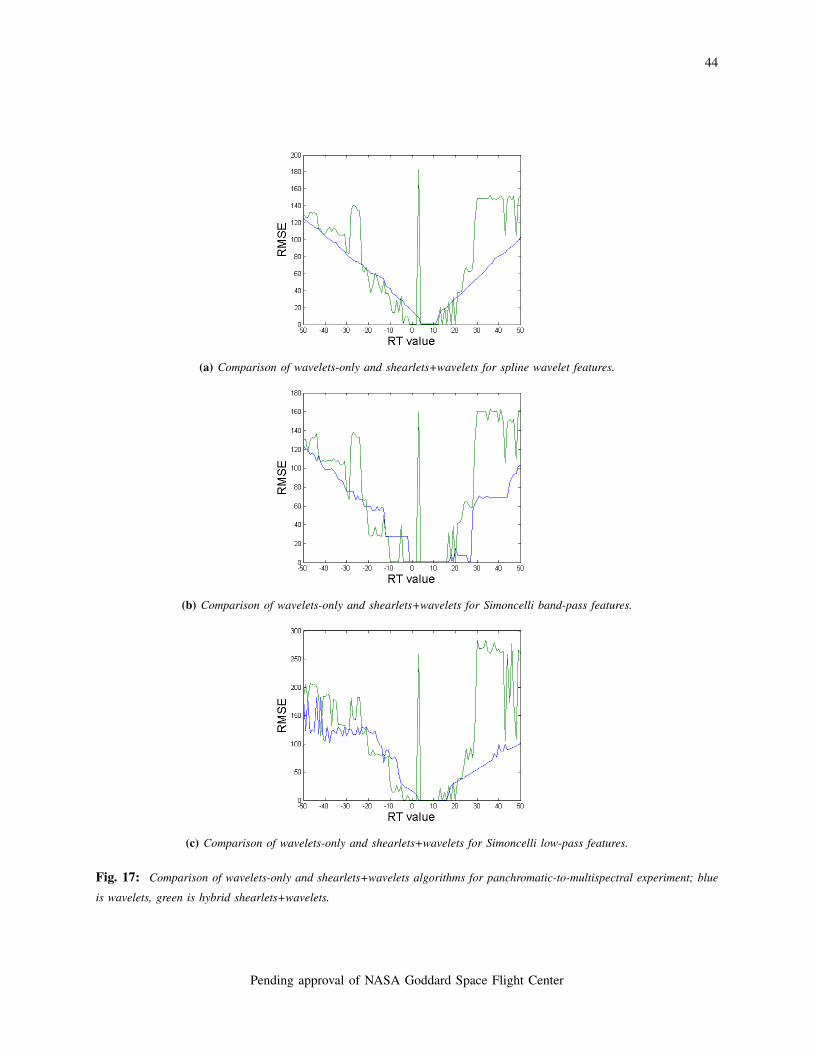
44
(a) Comparison of wavelets-only and shearlets+wavelets for spline wavelet features.
(b) Comparison of wavelets-only and shearlets+wavelets for Simoncelli band-pass features.
(c) Comparison of wavelets-only and shearlets+wavelets for Simoncelli low-pass features.
Fig. 17: Comparison of wavelets-only and shearlets+wavelets algorithms for panchromatic-to-multispectral experiment; blue
is wavelets, green is hybrid shearlets+wavelets.
Pending approval of NASA Goddard Space Flight Center

45
Fig. 18: Images of MODIS (left) and ETM+ (right) of the Konza Prarie. The MODIS image is 128× 128 and the
ETM+ image is 2048× 2048. The images have been converted to grayscale.
Registration
Technique
Number of
Converged
Experiments
(out of 101)
Percentage of
Converged
Experiments
Mean RMSEStandard Deviation
RMSE
Relative
Improvement
Spline
Wavelets0 0% - - -
Simoncelli
Band-Pass63 62.38% .2474 .0038 -
Simoncelli
Low-Pass0 0% - - -
Shearlets 82 81.19% .5433 .0741 -
Shearlet+
Spline
Wavelets
0 0% - - -
Shearlet+
Simoncelli
Band-Pass
88 87.13% .2467 .0018 39.68%
Shearlet +
Simoncelli
Low-Pass
0 0% - - -
TABLE VII: Comparison of registration algorithms for MODIS-to-ETM+ multimodal experiments.
Pending approval of NASA Goddard Space Flight Center
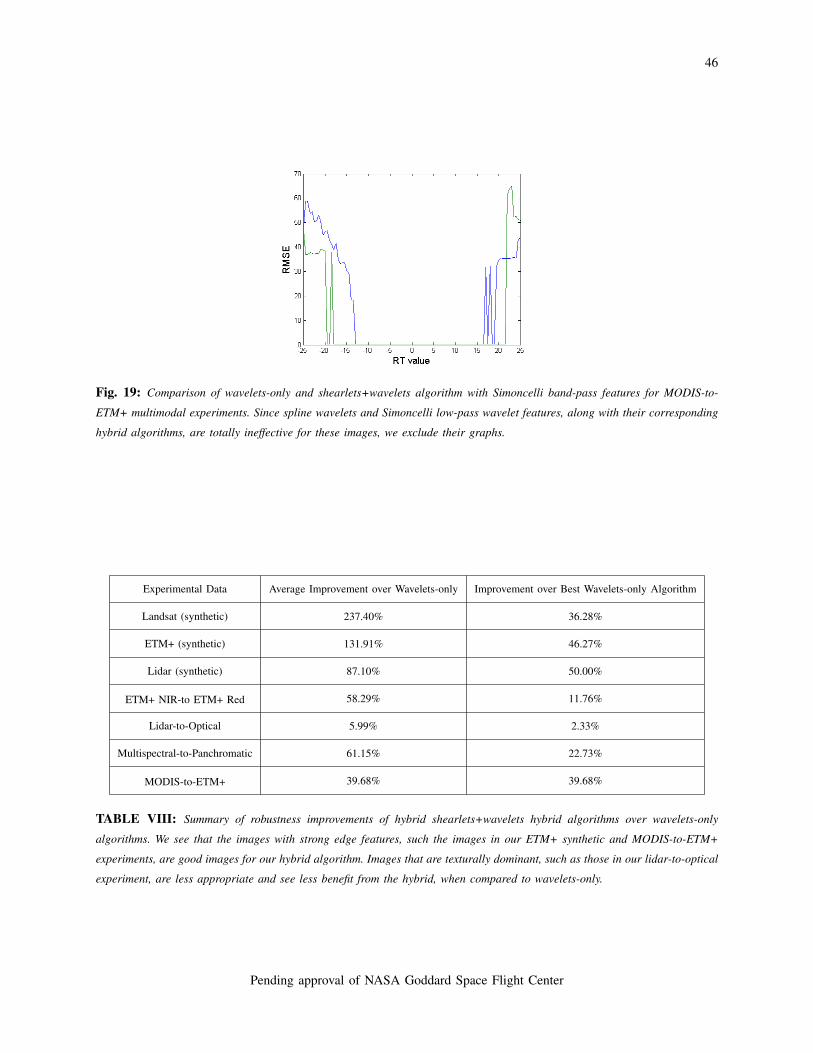
46
Fig. 19: Comparison of wavelets-only and shearlets+wavelets algorithm with Simoncelli band-pass features for MODIS-to-
ETM+ multimodal experiments. Since spline wavelets and Simoncelli low-pass wavelet features, along with their corresponding
hybrid algorithms, are totally ineffective for these images, we exclude their graphs.
Experimental Data Average Improvement over Wavelets-only Improvement over Best Wavelets-only Algorithm
Landsat (synthetic) 237.40% 36.28%
ETM+ (synthetic) 131.91% 46.27%
Lidar (synthetic) 87.10% 50.00%
ETM+ NIR-to ETM+ Red 58.29% 11.76%
Lidar-to-Optical 5.99% 2.33%
Multispectral-to-Panchromatic 61.15% 22.73%
MODIS-to-ETM+ 39.68% 39.68%
TABLE VIII: Summary of robustness improvements of hybrid shearlets+wavelets hybrid algorithms over wavelets-only
algorithms. We see that the images with strong edge features, such the images in our ETM+ synthetic and MODIS-to-ETM+
experiments, are good images for our hybrid algorithm. Images that are texturally dominant, such as those in our lidar-to-optical
experiment, are less appropriate and see less benefit from the hybrid, when compared to wavelets-only.
Pending approval of NASA Goddard Space Flight Center

47
Fig. 20: Shearlet features produced for the lidar shaded relief (left) and optical (right) images of WA. Notice that the strongest
edge-like features in each image are emphasized: a diagonal of trees for lidar and land-cover change near the top for optical.
Due to the information content differences between lidar and optical data, these features are not represented in both images.
Some edges are shared by both, but not all.
Pending approval of NASA Goddard Space Flight Center