1 and Daijun Yang 2,
12
energies Article Studies on the Effects of NH 3 in H 2 and Air on the Performance of PEMFC Kefeng Hu 1 and Daijun Yang 2, * Citation: Hu, K.; Yang, D. Studies on the Effects of NH 3 in H 2 and Air on the Performance of PEMFC. Energies 2021, 14, 6556. https://doi.org/ 10.3390/en14206556 Academic Editor: Trung Van Nguyen Received: 4 August 2021 Accepted: 8 October 2021 Published: 12 October 2021 Publisher’s Note: MDPI stays neutral with regard to jurisdictional claims in published maps and institutional affil- iations. Copyright: © 2021 by the authors. Licensee MDPI, Basel, Switzerland. This article is an open access article distributed under the terms and conditions of the Creative Commons Attribution (CC BY) license (https:// creativecommons.org/licenses/by/ 4.0/). 1 Henan Yuqing Power Co., Ltd., 416 Mu’ye Road, Xinxiang 453000, China; [email protected] 2 School of Automotive Studies, Tongji University (Jiading Campus), 4800 Cao’an Road, Shanghai 201804, China * Correspondence: [email protected] Abstract: The effect of NH 3 in H 2 and in air was investigated at various concentrations ranging from 1.0 ppm to 100 ppm in air and ranging from 0.25 ppm to 10 ppm in fuel. The effect of NH 3 on cathode caused an instantaneous decrease in cell voltage which dropped from 0.734 V to 0.712 V in 30 h and drop rates was 0.73 mV/h for 1 ppm; however, the cell voltage dropped to 0.415 V in 1 h for 100 ppm of NH 3 . The voltage could not be recovered after the polarization test (V-I test) but could be recovered to 84.4% after operation with neat air for 1.5 h and 98.4% after cycle voltammogram (CV). It was found that the voltage drop was obvious, and the drop rate increased with the NH 3 concentration in H 2 . The voltage drop rates at 500 mA/cm 2 were 0.54 mV/h for 0.5 ppm of NH 3 , 0.8 mV/h for 1 ppm, and 2 mV/h for 10 ppm. The voltage could be recovered from 70.6% to 77.3% after discharged with high purity H 2 for 24 h, to 92.8% after being purged with clean air for 10 h and to 98.4% after CV scan. The tolerance concentration of NH 3 in H 2 for 1000 h was 40 ppb, for 2000 h was 20 ppb, and for 5000 h was 9 ppb. Keywords: PEMFC; ammonia; performance; effect; tolerance concentration 1. Introduction Proton exchange membrane fuel cell (PEMFC) is one of the most suitable candidates for replacing internal combustion engine (ICE) due to its high power density, zero emissions, and low operation temperature [1]. However, if the fuel of fuel cell vehicle (FCV), hydrogen, is produced from fossil fuel or by-products, it will inevitably contain some impurities, such as N 2 [2], CO [2–5], H 2 S[5–9], CO 2 [5,7–10], SO 2 [11], and/or NH 3 [5,12–16], etc. These impurities have potential negative influences on the performance of PEMFC. Among the impurities, ammonia (NH 3 ) is a common contaminant not only in the hydrogen-rich fuel stream [12] but also in ambient air in some special places, such as heavy traffic tunnels and the livestock industry. At least four different research groups have published papers regarding the ammonia contamination of PEMFC [13–16]. Uribe, F.A et al. [13], Soto, H.J et al. [14], Gomez, Y.A et al. [15], and Halseid, R et al. [16] focused on studying the poisoning of cells in operation and recovery after exposure to ammonia in H 2 . The poisoning mechanism was only partly identified. Uribe, F.A et al. [13] found that the cell resistance measured by high frequency re- sistance (HFR) was more than doubled when the cell was exposed to 30 ppm NH 3 in H 2 for 15 h. Exposure to 30 ppm ammonia for about 1 h resulted in performance loss, which was recoverable in about 18 h. Extended exposure to 30 ppm NH 3 for 17 h was not fully recoverable within 4 days of operation on pure H 2 . Through a cyclic voltammetry (CV) test, no electrochemically active adsorbed contaminant could be identified on either the anode or the cathode. It was suggested that the observed performance loss was due to a loss of proton conductivity in the anode catalyst layer. In the work of Soto, H.J et al. [14], the cell resistance was monitored by an automated current interrupt technique. Exposure to 200 ppm NH 3 in H 2 for 10 h increased the mea- Energies 2021, 14, 6556. https://doi.org/10.3390/en14206556 https://www.mdpi.com/journal/energies
Transcript of 1 and Daijun Yang 2,

energies
Article
Studies on the Effects of NH3 in H2 and Air on the Performanceof PEMFC
Kefeng Hu 1 and Daijun Yang 2,*
�����������������
Citation: Hu, K.; Yang, D. Studies on
the Effects of NH3 in H2 and Air on
the Performance of PEMFC. Energies
2021, 14, 6556. https://doi.org/
10.3390/en14206556
Academic Editor: Trung Van Nguyen
Received: 4 August 2021
Accepted: 8 October 2021
Published: 12 October 2021
Publisher’s Note: MDPI stays neutral
with regard to jurisdictional claims in
published maps and institutional affil-
iations.
Copyright: © 2021 by the authors.
Licensee MDPI, Basel, Switzerland.
This article is an open access article
distributed under the terms and
conditions of the Creative Commons
Attribution (CC BY) license (https://
creativecommons.org/licenses/by/
4.0/).
1 Henan Yuqing Power Co., Ltd., 416 Mu’ye Road, Xinxiang 453000, China; [email protected] School of Automotive Studies, Tongji University (Jiading Campus), 4800 Cao’an Road,
Shanghai 201804, China* Correspondence: [email protected]
Abstract: The effect of NH3 in H2 and in air was investigated at various concentrations rangingfrom 1.0 ppm to 100 ppm in air and ranging from 0.25 ppm to 10 ppm in fuel. The effect of NH3 oncathode caused an instantaneous decrease in cell voltage which dropped from 0.734 V to 0.712 V in30 h and drop rates was 0.73 mV/h for 1 ppm; however, the cell voltage dropped to 0.415 V in 1 h for100 ppm of NH3. The voltage could not be recovered after the polarization test (V-I test) but couldbe recovered to 84.4% after operation with neat air for 1.5 h and 98.4% after cycle voltammogram(CV). It was found that the voltage drop was obvious, and the drop rate increased with the NH3
concentration in H2. The voltage drop rates at 500 mA/cm2 were 0.54 mV/h for 0.5 ppm of NH3,0.8 mV/h for 1 ppm, and 2 mV/h for 10 ppm. The voltage could be recovered from 70.6% to 77.3%after discharged with high purity H2 for 24 h, to 92.8% after being purged with clean air for 10 h andto 98.4% after CV scan. The tolerance concentration of NH3 in H2 for 1000 h was 40 ppb, for 2000 hwas 20 ppb, and for 5000 h was 9 ppb.
Keywords: PEMFC; ammonia; performance; effect; tolerance concentration
1. Introduction
Proton exchange membrane fuel cell (PEMFC) is one of the most suitable candidatesfor replacing internal combustion engine (ICE) due to its high power density, zero emissions,and low operation temperature [1]. However, if the fuel of fuel cell vehicle (FCV), hydrogen,is produced from fossil fuel or by-products, it will inevitably contain some impurities, suchas N2 [2], CO [2–5], H2S [5–9], CO2 [5,7–10], SO2 [11], and/or NH3 [5,12–16], etc. Theseimpurities have potential negative influences on the performance of PEMFC.
Among the impurities, ammonia (NH3) is a common contaminant not only in thehydrogen-rich fuel stream [12] but also in ambient air in some special places, such asheavy traffic tunnels and the livestock industry. At least four different research groupshave published papers regarding the ammonia contamination of PEMFC [13–16]. Uribe,F.A et al. [13], Soto, H.J et al. [14], Gomez, Y.A et al. [15], and Halseid, R et al. [16] focusedon studying the poisoning of cells in operation and recovery after exposure to ammonia inH2. The poisoning mechanism was only partly identified.
Uribe, F.A et al. [13] found that the cell resistance measured by high frequency re-sistance (HFR) was more than doubled when the cell was exposed to 30 ppm NH3 in H2for 15 h. Exposure to 30 ppm ammonia for about 1 h resulted in performance loss, whichwas recoverable in about 18 h. Extended exposure to 30 ppm NH3 for 17 h was not fullyrecoverable within 4 days of operation on pure H2. Through a cyclic voltammetry (CV)test, no electrochemically active adsorbed contaminant could be identified on either theanode or the cathode. It was suggested that the observed performance loss was due to aloss of proton conductivity in the anode catalyst layer.
In the work of Soto, H.J et al. [14], the cell resistance was monitored by an automatedcurrent interrupt technique. Exposure to 200 ppm NH3 in H2 for 10 h increased the mea-
Energies 2021, 14, 6556. https://doi.org/10.3390/en14206556 https://www.mdpi.com/journal/energies
Energies 2021, 14, 6556 2 of 12
sured cell resistance by about 35%, much less than that observed by Uribe, who useda lower concentration of NH3. CVs recorded on the anode did not reveal any electro-chemically active species. Soto, similarly to Uribe, suggested that ammonium interferedprimarily with the anode. Gomez, Y.A et al. [15] also found that 200 ppm NH3 in H2rapidly decreases the voltage of the fuel cell. The cell voltage at a constant current densityof 0.1 A/cm2 decreases from 0.83 V to 0.54 V during a 100 min period, resulting in a totalvoltage decay of 290 mV.
Halseid, R et al. [16] found that the poisoning of PEMFCs by NH3 would take 24 h ormore to reach a steady state with 10 ppm NH3 in H2. In some cases, no steady state wasreached during the experiment. The performance loss was in most cases reversible, butonly after operation on high-purity H2 for several days. The introduction of 1 ppm NH3resulted in significant performance loss. The performance loss was higher than could beexplained by the observed increase in ohmic resistance in the cell. There is also a significanteffect of ammonium on the ORR on the cathode.
In the present work, five different concentrations of NH3 in air were added to thecathode of a cell, and four different concentrations of NH3 in H2 were added to the anode.Effects of NH3 on both the anode and the cathode were studied over a long period (40 hon cathode and more than 100 h on anode) of durability tests. Uribe, F.A et al. [13], Soto,H.J et al. [14], and Gomez, Y.A et al. [15] studied the effect of relatively high contaminationlevels (200 ppm, 13–130 ppm, and 200–1000 ppm, respectively). Halseid, R et al. [16]studied FCs contaminated with lower levels of NH3 in the H2 (1–20 ppm). In this work, westudied even lower concentrations of NH3 in H2, such as 0.25–10 ppm.
The change in cell impedance was investigated by electrochemical impedance spec-troscopy (EIS) tests. To reveal change in electrochemically active species of a cell poisoningwith NH3, CV tests were carried out. Furthermore, a tolerant limit of NH3 in H2 for fuelcells (FCs) was suggested from experimental data of the durability tests.
2. Experimental2.1. Materials and Equipments
All single fuel cells used in experiments were fabricated from MEAs (membraneelectrode assemblies, Shanghai Hesen Electric, Shanghai, China) with a size of 50 cm2. ThePt loading was 0.3 mg/cm2 on each side of the membrane (DuPont, Wilmington, DE, USA).For each contamination experiment, a new MEA was used.
Highly pure H2 (>99.999%), pure N2 (>99.99%), and compressed air were used. A lowconcentration of NH3 in H2 and in air was prepared by mixing NH3 in H2 or in N2 in a gasblender to a level of 20 ppm NH3 in H2 and 200 ppm NH3 in N2, and then dynamicallydiluted to a desired concentration.
A fuel cell test bench equipped with an electrochemical station (VMP2/Z, PrincetonApplied Research) was developed, which can introduce impurities simultaneously anddynamically into H2 stream or air (See Figure 1). An electronic load (SUN-FEL200A,SUNRISE POWER) was used for discharging in galvanostatic mode.
2.2. Experiments2.2.1. Durability (V-t) Test
Durability tests before and after the introduction of NH3 into the anode and cathodeon single cells were carried out to characterize the changes in performance. The perfor-mance loss was determined by measuring the voltage drop rate (mV/h) when the cell wasdischarged at 500 mA/cm2. Unless otherwise specified, the cells were operated at 70 ◦Cand 101.3 kPa and the anode stream was humidified at 75 ◦C. The stoichiometric ratio forH2 and air were fixed at 1.5 and 3.0, respectively.

Energies 2021, 14, 6556 3 of 12Energies 2021, 14, 6556 3 of 12
H TElecronic Load
T
H2
NH3
Air
Mass flow
controller
Humidifier
Humidifier
Thermostat
Gas-Water
Seprator
Exhaust
Exhaust
Gas Flow
Water Flow
Electronic Circuit
P
H TP
H-Humidity; P-Pressure; T-Temperature
VMP
Thermostat
Thermostat
Check valve
Mass flow
controller
Check valve
Mass flow
controller
Check valve
Gas-Water
Seprator
Figure 1. Schematic of PEM fuel cell test bench.
2.2. Experiments
2.2.1. Durability (V-t) Test
Durability tests before and after the introduction of NH3 into the anode and cathode
on single cells were carried out to characterize the changes in performance. The perfor-
mance loss was determined by measuring the voltage drop rate (mV/h) when the cell was
discharged at 500 mA/cm2. Unless otherwise specified, the cells were operated at 70 °C
and 101.3 kPa and the anode stream was humidified at 75 °C. The stoichiometric ratio for
H2 and air were fixed at 1.5 and 3.0, respectively.
2.2.2. Polarization (V-I) Test
The polarization test is another method used to characterize the change in cell per-
formance. When the V-I test was carried out, the stoichiometries ratio for H2 and air were
kept unchanged. A reference V-I curve was obtained by a measurement with pure H2 right
after the MEA was activated for 30–40 h. Usually, V-I tests were carried out during the V-
t-tests.
2.2.3. EIS Test
EIS tests were carried out by a multi-channel potentiostat (VMP2/Z, PAR) in the gal-
vanostatic mode to investigate the impedance change after the introduction of NH3. In EIS
experiments, the amplitude of the sinusoid disturbance was set at 200 mA, which was 4%
of the value of the discharge current, 5 A, i.d. 100 mA/cm2. Impedances were measured
with 6 steps per decade of frequencies between 10 kHz and 100 MHz. When the EIS tests
were carried out to investigate the effect of NH3 in air, the polarization of the anode could
be ignored because of the invariability of pure H2 stream; therefore, all the changes in EIS
could be attributed to the changes at the cathode caused by the poisoning of NH3, and
vice versa for the anode.
2.2.4. CV Test
Cyclic voltammetry is a sensitive technique for investigating the behaviors of impu-
rities on both the anode and cathode. While CV was carried out to investigate the NH3
effect on the anode, N2 at a rate of 300 mL/min was introduced into the anode, which acted
as a working electrode. Meanwhile, H2 at a rate of 300 mL min−1 was introduced into the
cathode, which acted as a counter electrode and reference electrode. The anode was
scanned by the electrochemical station from 0.05 V to 1.4 V vs. RHE and the scan rate was
set at 20 mV sec−1 (and vice versa when the cathode was used as a working electrode).
Figure 1. Schematic of PEM fuel cell test bench.
2.2.2. Polarization (V-I) Test
The polarization test is another method used to characterize the change in cell per-formance. When the V-I test was carried out, the stoichiometries ratio for H2 and air werekept unchanged. A reference V-I curve was obtained by a measurement with pure H2 rightafter the MEA was activated for 30–40 h. Usually, V-I tests were carried out during theV-t-tests.
2.2.3. EIS Test
EIS tests were carried out by a multi-channel potentiostat (VMP2/Z, PAR) in thegalvanostatic mode to investigate the impedance change after the introduction of NH3.In EIS experiments, the amplitude of the sinusoid disturbance was set at 200 mA, whichwas 4% of the value of the discharge current, 5 A, i.d. 100 mA/cm2. Impedances weremeasured with 6 steps per decade of frequencies between 10 kHz and 100 MHz. Whenthe EIS tests were carried out to investigate the effect of NH3 in air, the polarization of theanode could be ignored because of the invariability of pure H2 stream; therefore, all thechanges in EIS could be attributed to the changes at the cathode caused by the poisoning ofNH3, and vice versa for the anode.
2.2.4. CV Test
Cyclic voltammetry is a sensitive technique for investigating the behaviors of impu-rities on both the anode and cathode. While CV was carried out to investigate the NH3effect on the anode, N2 at a rate of 300 mL/min was introduced into the anode, whichacted as a working electrode. Meanwhile, H2 at a rate of 300 mL min−1 was introducedinto the cathode, which acted as a counter electrode and reference electrode. The anodewas scanned by the electrochemical station from 0.05 V to 1.4 V vs. RHE and the scan ratewas set at 20 mV sec−1 (and vice versa when the cathode was used as a working electrode).
3. Results and Discussion3.1. Effect of NH3 on the Cathode
A typical cell response to exposure to air containing five different concentrations ofNH3 ranging from 1.0 to 100 ppm is shown in Figure 2. The cell was operated galvanostat-ically at 500 mA/cm2 and allowed to stabilize before NH3 was added to air for 30–40 h.Each concentration of ammonia introduction was continued until the cell voltage droppedto a stable value.

Energies 2021, 14, 6556 4 of 12
Energies 2021, 14, 6556 4 of 12
3. Results and Discussion
3.1. Effect of NH3 on the Cathode
A typical cell response to exposure to air containing five different concentrations of
NH3 ranging from 1.0 to 100 ppm is shown in Figure 2. The cell was operated galvanostat-
ically at 500 mA/cm2 and allowed to stabilize before NH3 was added to air for 30–40 h.
Each concentration of ammonia introduction was continued until the cell voltage dropped
to a stable value.
0 10 20 30 40
0.3
0.4
0.5
0.6
0.7
0.8
neat air
1.0 ppm NH3 in air
2.0 ppm NH3 in air
5.0 ppm NH3 in air
20 ppm NH3 in air
100 ppm NH3 in air
Vo
ltag
e /
V
Time / h
NH3 in
Figure 2. Performance changes of PEMFC after poisoning with NH3 in air at 500 mA cm−2.
It can be noticed that the cell performance decreased instantaneously when NH3 was
added to the cathode, and the cell voltage drop rate increased with the concentration of NH3.
It can be also found that the cell voltage decreases operating with neat air as the running time
increases because of the unstable and unsuitable operation conditions, unbalanced thermos-
water management, slowly but certainly proceeding material aging process. However, in the
V-t curve of 1.0 ppm of NH3, the cell voltage dropped from 0.734 V to 0.712 V in 30 h, and in
that of 100 ppm of NH3, the cell voltage dropped to 0.415 V in 1 h.
Figure 3 shows that the cell voltage at the constant current changes with different
tests. It can be seen that the cell voltage rapidly decreases after adding the NH3. After
turning off the NH3 addition, we carried out the following tests: V-I test, operating with
neat air, and CV scan. The cell voltage had little change after the V-I test but recovered to
0.620 V after operating with neat air for 1.5 h. However, through CV scanning, the cell
voltage could be recovered to 0.720 V, with a recovery rate of 98.2%.
0 2 4 6 8
0.3
0.4
0.5
0.6
0.7
0.8
0.9
4 1132
Vo
lta
ge
/ V
Time / h
1
1 - neat air, 2 - 100ppm NH3, 3 - V-I, 4 - CV
Figure 3. Recovery of cell voltage with discharging with neat air, V-I test, and CV at 500 mA/cm2.
Figure 2. Performance changes of PEMFC after poisoning with NH3 in air at 500 mA cm−2.
It can be noticed that the cell performance decreased instantaneously when NH3 wasadded to the cathode, and the cell voltage drop rate increased with the concentrationof NH3. It can be also found that the cell voltage decreases operating with neat air asthe running time increases because of the unstable and unsuitable operation conditions,unbalanced thermos-water management, slowly but certainly proceeding material agingprocess. However, in the V-t curve of 1.0 ppm of NH3, the cell voltage dropped from0.734 V to 0.712 V in 30 h, and in that of 100 ppm of NH3, the cell voltage dropped to0.415 V in 1 h.
Figure 3 shows that the cell voltage at the constant current changes with different tests.It can be seen that the cell voltage rapidly decreases after adding the NH3. After turningoff the NH3 addition, we carried out the following tests: V-I test, operating with neat air,and CV scan. The cell voltage had little change after the V-I test but recovered to 0.620 Vafter operating with neat air for 1.5 h. However, through CV scanning, the cell voltagecould be recovered to 0.720 V, with a recovery rate of 98.2%.
Energies 2021, 14, 6556 4 of 12
3. Results and Discussion
3.1. Effect of NH3 on the Cathode
A typical cell response to exposure to air containing five different concentrations of
NH3 ranging from 1.0 to 100 ppm is shown in Figure 2. The cell was operated galvanostat-
ically at 500 mA/cm2 and allowed to stabilize before NH3 was added to air for 30–40 h.
Each concentration of ammonia introduction was continued until the cell voltage dropped
to a stable value.
0 10 20 30 40
0.3
0.4
0.5
0.6
0.7
0.8
neat air
1.0 ppm NH3 in air
2.0 ppm NH3 in air
5.0 ppm NH3 in air
20 ppm NH3 in air
100 ppm NH3 in air
Vo
ltag
e /
V
Time / h
NH3 in
Figure 2. Performance changes of PEMFC after poisoning with NH3 in air at 500 mA cm−2.
It can be noticed that the cell performance decreased instantaneously when NH3 was
added to the cathode, and the cell voltage drop rate increased with the concentration of NH3.
It can be also found that the cell voltage decreases operating with neat air as the running time
increases because of the unstable and unsuitable operation conditions, unbalanced thermos-
water management, slowly but certainly proceeding material aging process. However, in the
V-t curve of 1.0 ppm of NH3, the cell voltage dropped from 0.734 V to 0.712 V in 30 h, and in
that of 100 ppm of NH3, the cell voltage dropped to 0.415 V in 1 h.
Figure 3 shows that the cell voltage at the constant current changes with different
tests. It can be seen that the cell voltage rapidly decreases after adding the NH3. After
turning off the NH3 addition, we carried out the following tests: V-I test, operating with
neat air, and CV scan. The cell voltage had little change after the V-I test but recovered to
0.620 V after operating with neat air for 1.5 h. However, through CV scanning, the cell
voltage could be recovered to 0.720 V, with a recovery rate of 98.2%.
0 2 4 6 8
0.3
0.4
0.5
0.6
0.7
0.8
0.9
4 1132
Vo
lta
ge
/ V
Time / h
1
1 - neat air, 2 - 100ppm NH3, 3 - V-I, 4 - CV
Figure 3. Recovery of cell voltage with discharging with neat air, V-I test, and CV at 500 mA/cm2. Figure 3. Recovery of cell voltage with discharging with neat air, V-I test, and CV at 500 mA/cm2.
When the cell voltage dropped to a stable state after poisoning with NH3, the additionof NH3 was turned off, and then a V-I test was carried out. The V-I test results wereshown in Figure 4. It can be seen that the polarization loss is closely linked with the NH3concentration, and the influence is much more severe when the concentration of NH3 isabove 5.0 ppm. Moreover, the cell could no longer work efficiently at the current density of900 mA/cm2, if the NH3 concentration was 5.0 ppm. Similarly, the cell would lose its workability at 700 mA/cm2 under the effect of 20 ppm of NH3, and at 600 mA/cm2 under theeffect of 100 ppm of NH3.

Energies 2021, 14, 6556 5 of 12
Energies 2021, 14, 6556 5 of 12
When the cell voltage dropped to a stable state after poisoning with NH3, the addition
of NH3 was turned off, and then a V-I test was carried out. The V-I test results were shown
in Figure 4. It can be seen that the polarization loss is closely linked with the NH3 concen-
tration, and the influence is much more severe when the concentration of NH3 is above
5.0 ppm. Moreover, the cell could no longer work efficiently at the current density of 900
mA/cm2, if the NH3 concentration was 5.0 ppm. Similarly, the cell would lose its work
ability at 700 mA/cm2 under the effect of 20 ppm of NH3, and at 600 mA/cm2 under the
effect of 100 ppm of NH3.
0 200 400 600 800 1000 1200
0.0
0.2
0.4
0.6
0.8
1.0
neat air
1.0 ppm NH3
2.0 ppm NH3
5.0 ppm NH3
20 ppm NH3
100 ppm NH3
Vo
lta
ge
/ V
Current Density / mA cm-2
Figure 4. Effects of NH3 in air on polarization.
3.2. Effect of NH3 on the Anode
In Figure 5, the results of contamination of a cell with four different concentrations
of NH3 in fuel are shown. The cell was discharged at 500 mA/cm2 and the addition of NH3
was continued for more than 100 h.
0 20 40 60 80 100
0.4
0.5
0.6
0.7
0.8
pure H2
0.25 ppm NH3
0.5 ppm NH3
1.0 ppm NH3
10 ppm NH3
Time / h
Vo
lta
ge
/ V
NH3 in origin voltage 0.697 V
voltage drop 25 mV to 0.672 V
Figure 5. Performance changes of PEMFC after poisoning with NH3 in fuel.
It can be seen that, in each curve, the voltage drop rate remained approximately con-
stant with the addition of NH3. For the same reason as operating with neat air, the voltage
with pure H2 also decreases. However, the voltage would fluctuate occasionally, which
could be attributed to the adsorption of NH3 in the membrane. When NH3 was adsorbed
in the membrane, reaction between NH3 and H+ took place (R1), and ammonium would
be formed, which would reduce the acidity and proton conductivity of the membrane [17].
In that case, the transfer of proton would be blocked. Simultaneously, NH3 would be
Figure 4. Effects of NH3 in air on polarization.
3.2. Effect of NH3 on the Anode
In Figure 5, the results of contamination of a cell with four different concentrations ofNH3 in fuel are shown. The cell was discharged at 500 mA/cm2 and the addition of NH3was continued for more than 100 h.
Energies 2021, 14, 6556 5 of 12
When the cell voltage dropped to a stable state after poisoning with NH3, the addition
of NH3 was turned off, and then a V-I test was carried out. The V-I test results were shown
in Figure 4. It can be seen that the polarization loss is closely linked with the NH3 concen-
tration, and the influence is much more severe when the concentration of NH3 is above
5.0 ppm. Moreover, the cell could no longer work efficiently at the current density of 900
mA/cm2, if the NH3 concentration was 5.0 ppm. Similarly, the cell would lose its work
ability at 700 mA/cm2 under the effect of 20 ppm of NH3, and at 600 mA/cm2 under the
effect of 100 ppm of NH3.
0 200 400 600 800 1000 1200
0.0
0.2
0.4
0.6
0.8
1.0
neat air
1.0 ppm NH3
2.0 ppm NH3
5.0 ppm NH3
20 ppm NH3
100 ppm NH3
Vo
lta
ge
/ V
Current Density / mA cm-2
Figure 4. Effects of NH3 in air on polarization.
3.2. Effect of NH3 on the Anode
In Figure 5, the results of contamination of a cell with four different concentrations
of NH3 in fuel are shown. The cell was discharged at 500 mA/cm2 and the addition of NH3
was continued for more than 100 h.
0 20 40 60 80 100
0.4
0.5
0.6
0.7
0.8
pure H2
0.25 ppm NH3
0.5 ppm NH3
1.0 ppm NH3
10 ppm NH3
Time / h
Vo
lta
ge
/ V
NH3 in origin voltage 0.697 V
voltage drop 25 mV to 0.672 V
Figure 5. Performance changes of PEMFC after poisoning with NH3 in fuel.
It can be seen that, in each curve, the voltage drop rate remained approximately con-
stant with the addition of NH3. For the same reason as operating with neat air, the voltage
with pure H2 also decreases. However, the voltage would fluctuate occasionally, which
could be attributed to the adsorption of NH3 in the membrane. When NH3 was adsorbed
in the membrane, reaction between NH3 and H+ took place (R1), and ammonium would
be formed, which would reduce the acidity and proton conductivity of the membrane [17].
In that case, the transfer of proton would be blocked. Simultaneously, NH3 would be
Figure 5. Performance changes of PEMFC after poisoning with NH3 in fuel.
It can be seen that, in each curve, the voltage drop rate remained approximately con-stant with the addition of NH3. For the same reason as operating with neat air, the voltagewith pure H2 also decreases. However, the voltage would fluctuate occasionally, whichcould be attributed to the adsorption of NH3 in the membrane. When NH3 was adsorbedin the membrane, reaction between NH3 and H+ took place (R1), and ammonium would beformed, which would reduce the acidity and proton conductivity of the membrane [17]. Inthat case, the transfer of proton would be blocked. Simultaneously, NH3 would be sweptby H2 and H2O stream intermittently. The adsorption and desorption of NH3 cost thefluctuation of cell voltage, which is chemisorption.
NH3 + H+ NH4+ (R1)
The voltage drop rate increased with the NH3 concentration. For example, in thecurve of 0.25 ppm of NH3, the voltage drop from 0.697 V to 0.67 V in 100 h, the voltagedrop rate is 0.27 mV/h. In the curve of other concentrations, the voltage drop rates are0.54 mV/h for 0.5 ppm of NH3, 0.8 mV/h for 1.0 ppm of NH3, and 2.0 mV/h for 10 ppmof NH3.

Energies 2021, 14, 6556 6 of 12
Serial tests were performed to study the recovery of cell performance after exposed to10 ppm NH3/H2 for more than 100 h. As seen in Figure 6, the cell was recovered through(a) cutting off NH3 and carrying out the polarization curve test and EIS test, (b) runningwith pure H2, (c) purging the anode with clean air, (d) and testing with CV. It was foundthat after the NH3 poisoning, the cell voltage dropped to ca. 0.492 V, and even dischargedwith high-purity H2 for as long as 24 h, the cell voltage was lightly recovered. It merelyrosed from 0.492 V to 0.539 V, i.e., 77.3% of the original value. After being purged withclean air for 10 h, the cell voltage was further recovered to 0.647 V, i.e., 92.8% of the originalvalue. After CV scan, the cell voltage could be recovered to 0.686 V, i.e., 98.4% of theoriginal value. During the composite processes treatment, the anode surface was cleanedwith moist H2 at first; meanwhile, some NH4
+ cations could be washed out. When clean airwas introduced, with CV scan in higher potential, the substance adsorbed on the surfacewas removed. Therefore, cell performance was mostly, if not completely, recovered.
Energies 2021, 14, 6556 6 of 12
swept by H2 and H2O stream intermittently. The adsorption and desorption of NH3 cost
the fluctuation of cell voltage, which is chemisorption.
NH3 + H+ ⇌ NH4+ (R1)
The voltage drop rate increased with the NH3 concentration. For example, in the
curve of 0.25 ppm of NH3, the voltage drop from 0.697 V to 0.67 V in 100 h, the voltage
drop rate is 0.27 mV/h. In the curve of other concentrations, the voltage drop rates are 0.54
mV/h for 0.5 ppm of NH3, 0.8 mV/h for 1.0 ppm of NH3, and 2.0 mV/h for 10 ppm of NH3.
Serial tests were performed to study the recovery of cell performance after exposed
to 10 ppm NH3/H2 for more than 100 h. As seen in Figure 6, the cell was recovered through
(a) cutting off NH3 and carrying out the polarization curve test and EIS test, (b) running
with pure H2, (c) purging the anode with clean air, (d) and testing with CV. It was found
that after the NH3 poisoning, the cell voltage dropped to ca. 0.492 V, and even discharged
with high-purity H2 for as long as 24 h, the cell voltage was lightly recovered. It merely
rosed from 0.492 V to 0.539 V, i.e., 77.3% of the original value. After being purged with
clean air for 10 h, the cell voltage was further recovered to 0.647 V, i.e., 92.8% of the origi-
nal value. After CV scan, the cell voltage could be recovered to 0.686 V, i.e., 98.4% of the
original value. During the composite processes treatment, the anode surface was cleaned
with moist H2 at first; meanwhile, some NH4+ cations could be washed out. When clean
air was introduced, with CV scan in higher potential, the substance adsorbed on the sur-
face was removed. Therefore, cell performance was mostly, if not completely, recovered.
0 20 40 60 80 100 120 140 160
0.3
0.4
0.5
0.6
0.7
0.8
353432
Time / h
Vo
lta
ge
/ V
1 —10ppm NH3, 2 —V-I/EIS, 3 —high purity H
2,
4 —air purging, 5 —CV
1
Figure 6. Recovery of cell voltage with discharging with pure H2, air purging, and CV.
Figure 7 shows the polarization curves after poisoning with different concentrations
of NH3/H2. Each polarization test was carried out 100 h after the addition of NH3. It seems
that the polarization losses did not strengthen too much in the curves of 0.25 ppm and 0.5
ppm of NH3. However, it was much more severe when 1 ppm or higher concentrations of
NH3 were introduced into the anode. Compared to the effect of NH3 in air, it was found
that the polarization losses were much more severe with the same concentration levels in
H2.
Figure 6. Recovery of cell voltage with discharging with pure H2, air purging, and CV.
Figure 7 shows the polarization curves after poisoning with different concentrations ofNH3/H2. Each polarization test was carried out 100 h after the addition of NH3. It seemsthat the polarization losses did not strengthen too much in the curves of 0.25 ppm and0.5 ppm of NH3. However, it was much more severe when 1 ppm or higher concentrationsof NH3 were introduced into the anode. Compared to the effect of NH3 in air, it was foundthat the polarization losses were much more severe with the same concentration levelsin H2.
Energies 2021, 14, 6556 7 of 12
0 200 400 600 800 1000
0.0
0.2
0.4
0.6
0.8
1.0
pure H2
0.25 ppm NH3
0.5 ppm NH3
1.0 ppm NH3
10 ppm NH3
Vo
lta
ge
/ V
Current Density / mA cm-2
Figure 7. Effects of NH3 in H2 on polarization.
3.3. Recovery Mechanism Study
3.3.1. Impedance Study
In order to clarify the effect of NH3 in air and H2 on the impedance of PEMFC, EIS
tests were carried out to study the impedance changes during the durability tests. Nyquist
plots drawn in EIS tests show the same pattern as shown in Figure 8a,b: an inductive line
at a high frequency range and a depressed capacitive semicircle at intermediate and low
frequency ranges [18,19]. The inductive lines intersecting with the real axis correspond to
the total ohmic resistance of the cell. This single semicircle loop, often called the “kinetic
loop”, occurs when the electrode process is dominated only by the interfacial kinetics of
the ORR process. The radii of the semicircle show the polarization resistance of the cell.
The electrochemical parameters (Table 1) of the MEAs were analyzed via an equivalent
circuit (EC) method (Figure 8c). Rct represents the charge transfer resistance of the ORR;
Rs represents the total ohmic resistance of the cell, which can be expressed as the sum of
the contributions from contact resistances between components and ohmic resistances of
the cell components; Rm represents the mass transfer impedance.
In Figure 8a, three Nyquist plots of the cathode under different states are shown: in
clean air, after being poisoned by 100 ppm of NH3, and after being discharged with clean
air and CV scanned.
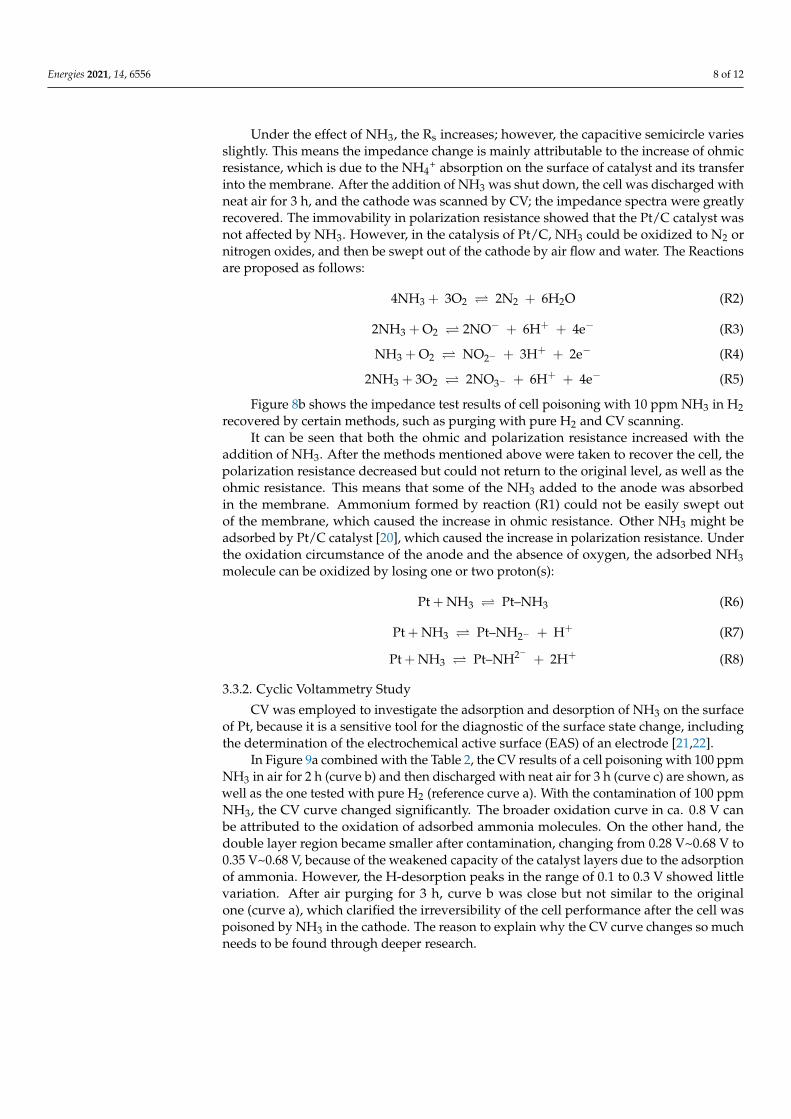
Under the effect of NH3, the Rs increases; however, the capacitive semicircle varies
slightly. This means the impedance change is mainly attributable to the increase of ohmic
resistance, which is due to the NH4+ absorption on the surface of catalyst and its transfer
into the membrane. After the addition of NH3 was shut down, the cell was discharged
with neat air for 3 h, and the cathode was scanned by CV; the impedance spectra were
greatly recovered. The immovability in polarization resistance showed that the Pt/C cata-
lyst was not affected by NH3. However, in the catalysis of Pt/C, NH3 could be oxidized to
N2 or nitrogen oxides, and then be swept out of the cathode by air flow and water. The
Reactions are proposed as follows:
4NH3 +3O2 ⇌ 2N2 + 6H2O (R2)
2NH3 + O2 ⇌ 2NO− + 6H+ + 4e− (R3)
NH3 + O2 ⇌ NO2− + 3H+ + 2e− (R4)
2NH3 + 3O2 ⇌ 2NO3− + 6H+ + 4e− (R5)
Figure 7. Effects of NH3 in H2 on polarization.

Energies 2021, 14, 6556 7 of 12
3.3. Recovery Mechanism Study3.3.1. Impedance Study
In order to clarify the effect of NH3 in air and H2 on the impedance of PEMFC, EIStests were carried out to study the impedance changes during the durability tests. Nyquistplots drawn in EIS tests show the same pattern as shown in Figure 8a,b: an inductive lineat a high frequency range and a depressed capacitive semicircle at intermediate and lowfrequency ranges [18,19]. The inductive lines intersecting with the real axis correspond tothe total ohmic resistance of the cell. This single semicircle loop, often called the “kineticloop”, occurs when the electrode process is dominated only by the interfacial kinetics ofthe ORR process. The radii of the semicircle show the polarization resistance of the cell.The electrochemical parameters (Table 1) of the MEAs were analyzed via an equivalentcircuit (EC) method (Figure 8c). Rct represents the charge transfer resistance of the ORR; Rsrepresents the total ohmic resistance of the cell, which can be expressed as the sum of thecontributions from contact resistances between components and ohmic resistances of thecell components; Rm represents the mass transfer impedance.
Energies 2021, 14, 6556 8 of 12
Figure 8b shows the impedance test results of cell poisoning with 10 ppm NH3 in H2
recovered by certain methods, such as purging with pure H2 and CV scanning.
Figure 8. Nyquist plots of the impedance spectra measured before and after a cell poisoning with NH3 in air (a) and fuel
(b); (c) the equivalent circuit.
Table 1. The electrochemical parameters of the MEAs under different conditions.
Rs (ohm) Rct (ohm) Rm (ohm)
Neat air 0.00050102 0.0010346 0.00033082
Poisoning with 100 ppm NH3 0.0005323 0.0011421 0.0003605
After neat air purging for 3 h 0.0004884 0.00099123 0.00028034
Pure H2 0.00055808 0.00042653 0.00043754
Poisoning with 10 ppm NH3 in H2 0.00055964 0.00045434 0.00051119
After operating with pure H2 for 24 h 0.00055835 0.00043846 0.00046464
It can be seen that both the ohmic and polarization resistance increased with the ad-
dition of NH3. After the methods mentioned above were taken to recover the cell, the po-
larization resistance decreased but could not return to the original level, as well as the
ohmic resistance. This means that some of the NH3 added to the anode was absorbed in
the membrane. Ammonium formed by reaction (R1) could not be easily swept out of the
membrane, which caused the increase in ohmic resistance. Other NH3 might be adsorbed
by Pt/C catalyst [20], which caused the increase in polarization resistance. Under the oxi-
dation circumstance of the anode and the absence of oxygen, the adsorbed NH3 molecule
can be oxidized by losing one or two proton(s):
Pt + NH3 ⇌ Pt–NH3 (R6)
Pt + NH3 ⇌ Pt–NH2− + H+ (R7)
Pt + NH3 ⇌ Pt–NH2− + 2H+ (R8)
Figure 8. Nyquist plots of the impedance spectra measured before and after a cell poisoning with NH3 in air (a) and fuel(b); (c) the equivalent circuit.
Table 1. The electrochemical parameters of the MEAs under different conditions.
Rs (ohm) Rct (ohm) Rm (ohm)
Neat air 0.00050102 0.0010346 0.00033082
Poisoning with 100 ppm NH3 0.0005323 0.0011421 0.0003605
After neat air purging for 3 h 0.0004884 0.00099123 0.00028034
Pure H2 0.00055808 0.00042653 0.00043754
Poisoning with 10 ppm NH3 in H2 0.00055964 0.00045434 0.00051119
After operating with pure H2 for 24 h 0.00055835 0.00043846 0.00046464
In Figure 8a, three Nyquist plots of the cathode under different states are shown: inclean air, after being poisoned by 100 ppm of NH3, and after being discharged with cleanair and CV scanned.
Energies 2021, 14, 6556 8 of 12
Under the effect of NH3, the Rs increases; however, the capacitive semicircle variesslightly. This means the impedance change is mainly attributable to the increase of ohmicresistance, which is due to the NH4
+ absorption on the surface of catalyst and its transferinto the membrane. After the addition of NH3 was shut down, the cell was discharged withneat air for 3 h, and the cathode was scanned by CV; the impedance spectra were greatlyrecovered. The immovability in polarization resistance showed that the Pt/C catalyst wasnot affected by NH3. However, in the catalysis of Pt/C, NH3 could be oxidized to N2 ornitrogen oxides, and then be swept out of the cathode by air flow and water. The Reactionsare proposed as follows:
4NH3 + 3O2 2N2 + 6H2O (R2)
2NH3 + O2 2NO− + 6H+ + 4e− (R3)
NH3 + O2 NO2− + 3H+ + 2e− (R4)
2NH3 + 3O2 2NO3− + 6H+ + 4e− (R5)
Figure 8b shows the impedance test results of cell poisoning with 10 ppm NH3 in H2recovered by certain methods, such as purging with pure H2 and CV scanning.
It can be seen that both the ohmic and polarization resistance increased with theaddition of NH3. After the methods mentioned above were taken to recover the cell, thepolarization resistance decreased but could not return to the original level, as well as theohmic resistance. This means that some of the NH3 added to the anode was absorbedin the membrane. Ammonium formed by reaction (R1) could not be easily swept outof the membrane, which caused the increase in ohmic resistance. Other NH3 might beadsorbed by Pt/C catalyst [20], which caused the increase in polarization resistance. Underthe oxidation circumstance of the anode and the absence of oxygen, the adsorbed NH3molecule can be oxidized by losing one or two proton(s):
Pt + NH3 Pt–NH3 (R6)
Pt + NH3 Pt–NH2− + H+ (R7)
Pt + NH3 Pt–NH2− + 2H+ (R8)
3.3.2. Cyclic Voltammetry Study
CV was employed to investigate the adsorption and desorption of NH3 on the surfaceof Pt, because it is a sensitive tool for the diagnostic of the surface state change, includingthe determination of the electrochemical active surface (EAS) of an electrode [21,22].
In Figure 9a combined with the Table 2, the CV results of a cell poisoning with 100 ppmNH3 in air for 2 h (curve b) and then discharged with neat air for 3 h (curve c) are shown, aswell as the one tested with pure H2 (reference curve a). With the contamination of 100 ppmNH3, the CV curve changed significantly. The broader oxidation curve in ca. 0.8 V canbe attributed to the oxidation of adsorbed ammonia molecules. On the other hand, thedouble layer region became smaller after contamination, changing from 0.28 V~0.68 V to0.35 V~0.68 V, because of the weakened capacity of the catalyst layers due to the adsorptionof ammonia. However, the H-desorption peaks in the range of 0.1 to 0.3 V showed littlevariation. After air purging for 3 h, curve b was close but not similar to the originalone (curve a), which clarified the irreversibility of the cell performance after the cell waspoisoned by NH3 in the cathode. The reason to explain why the CV curve changes so muchneeds to be found through deeper research.

Energies 2021, 14, 6556 9 of 12
Energies 2021, 14, 6556 9 of 12
3.3.2. Cyclic Voltammetry Study
CV was employed to investigate the adsorption and desorption of NH3 on the surface
of Pt, because it is a sensitive tool for the diagnostic of the surface state change, including
the determination of the electrochemical active surface (EAS) of an electrode [21,22].
In Figure 9a combined with the Table 2, the CV results of a cell poisoning with 100
ppm NH3 in air for 2 h (curve b) and then discharged with neat air for 3 h (curve c) are
shown, as well as the one tested with pure H2 (reference curve a). With the contamination
of 100 ppm NH3, the CV curve changed significantly. The broader oxidation curve in ca.
0.8 V can be attributed to the oxidation of adsorbed ammonia molecules. On the other
hand, the double layer region became smaller after contamination, changing from 0.28
V~0.68 V to 0.35 V~0.68 V, because of the weakened capacity of the catalyst layers due to
the adsorption of ammonia. However, the H-desorption peaks in the range of 0.1 to 0.3 V
showed little variation. After air purging for 3 h, curve b was close but not similar to the
original one (curve a), which clarified the irreversibility of the cell performance after the
cell was poisoned by NH3 in the cathode. The reason to explain why the CV curve changes
so much needs to be found through deeper research.
Table 2. The ECSAs before and after poisoning with NH3 in air and fuel.
ECSA (𝐦𝟐𝐠𝐏𝐭−𝟏)
Neat air 53.95
Poisoning with 100 ppm NH3 50.775
After neat air purging for 3 h 59.395
Pure H2 79.97
Poisoning with 10 ppm NH3 in H2 61.175
After operating with pure H2 for 24 h 67.415
Figure 9. CV curves before and after poisoning with NH3 in air (a) and in fuel(b).
The CV results poisoning with 10 ppm NH3 in H2 for 100 h (curve b) and then dis-
charging with pure H2 for 24 h and purging with air for 10 h (curve c) are shown in Figure
9b, as well as the one tested with pure H2 (reference curve a). It can be seen in curve b that
the H-desorption peaks in the range of 0.1 to 0.3 V decrease after the introduction of NH3,
and due to the strong adsorption of NH3 on Pt, the EAS of Pt is blocked by NH3, which in
turn suppresses the HOR, leading to a decrease in cell performance. Furthermore, there
exists a reduced oxidation peak of Pt at 0.85 V in curve b. This peak could be caused by
the reduction of the EAS of Pt. Indeed, the reduction peak for PtO or PtO2 at 0.7 V during
the cathodic scan became weaker, because less Pt oxides were generated during the pre-
vious anodic scan. After being discharged with pure H2 and purged with neat air, curve c
Figure 9. CV curves before and after poisoning with NH3 in air (a) and in fuel (b).
Table 2. The ECSAs before and after poisoning with NH3 in air and fuel.
ECSA(
m2g−1Pt
)Neat air 53.95
Poisoning with 100 ppm NH3 50.775
After neat air purging for 3 h 59.395
Pure H2 79.97
Poisoning with 10 ppm NH3 in H2 61.175
After operating with pure H2 for 24 h 67.415
The CV results poisoning with 10 ppm NH3 in H2 for 100 h (curve b) and thendischarging with pure H2 for 24 h and purging with air for 10 h (curve c) are shown inFigure 9b, as well as the one tested with pure H2 (reference curve a). It can be seen in curveb that the H-desorption peaks in the range of 0.1 to 0.3 V decrease after the introductionof NH3, and due to the strong adsorption of NH3 on Pt, the EAS of Pt is blocked by NH3,which in turn suppresses the HOR, leading to a decrease in cell performance. Furthermore,there exists a reduced oxidation peak of Pt at 0.85 V in curve b. This peak could be causedby the reduction of the EAS of Pt. Indeed, the reduction peak for PtO or PtO2 at 0.7 Vduring the cathodic scan became weaker, because less Pt oxides were generated duringthe previous anodic scan. After being discharged with pure H2 and purged with neat air,curve c recovered almost completely, but the H-desorption peaks in the range of 0.1 to0.3 V became smaller than that of the reference one (curve a), implying that the surfaceproperties (EAS, particle size, etc.) of Pt/C might be changed. Therefore, the poisoningeffect of NH3 cannot be completely recovered by CV oxidation.
3.4. Determination of Tolerant Limit of NH3 in H2
Compared with air, the lower concentration of NH3 in H2 has a more severe perfor-mance degradation. Therefore, it is important to set a tolerance limit of NH3 in H2 forautomotive applications, under which the fuel cell should not be impacted to lose too muchwork efficiency in a certain period and the cell should be able to perform under ratherlow degradation rates. In automotive application, the ideal lifetime should be 5000 h ormore [23]. However, nowadays, the technologies for the lifespan of FC do not reach thathigh a level. If the level of 5000 h is set, the tolerance limit would be set extremely low,and the cost of hydrogen would be impractically high. Therefore, it could be consideredthat the tolerance limit of NH3 can be set in three phases. The running time of FC mustreach 1000 h in the first phase, 2000 h in the second phase, and 5000 h in the third phase.Additionally, the limitation of the decrease in cell voltage at 500 mA/cm2 was set at 25 mV.
In Figure 5, the original voltage and the dropped voltage poisoning with NH3 wereindicated by two straight lines. The line at 0.697 V indicated the original voltage and the

Energies 2021, 14, 6556 10 of 12
one at 0.672 V as the voltage drop tolerance limit. Based on the experimental results givenin Figure 5, the time spent for 25 mV of cell voltage decrease, and for the four correspondingconcentrations of NH3, the time spent to reach 25 mV voltage decrease under the effectof certain concentration of NH3 can be obtained. In Figure 10, CNH3 , the concentration ofNH3, is plotted against 1/t. A polynomial relationship between the two variables can bedrawn out:
CNH3 = 44888(
1t
)3− 2170.3
(1t
)2+ 45.251
(1t
)(1)
where t is time of fuel cell running, h, and CNH3 is NH3 concentration, ppm.
Energies 2021, 14, 6556 10 of 12
recovered almost completely, but the H-desorption peaks in the range of 0.1 to 0.3 V be-
came smaller than that of the reference one (curve a), implying that the surface properties
(EAS, particle size, etc.) of Pt/C might be changed. Therefore, the poisoning effect of NH3
cannot be completely recovered by CV oxidation.
3.4. Determination of Tolerant Limit of NH3 in H2
Compared with air, the lower concentration of NH3 in H2 has a more severe perfor-
mance degradation. Therefore, it is important to set a tolerance limit of NH3 in H2 for
automotive applications, under which the fuel cell should not be impacted to lose too
much work efficiency in a certain period and the cell should be able to perform under
rather low degradation rates. In automotive application, the ideal lifetime should be 5000
h or more [23]. However, nowadays, the technologies for the lifespan of FC do not reach
that high a level. If the level of 5000 h is set, the tolerance limit would be set extremely
low, and the cost of hydrogen would be impractically high. Therefore, it could be consid-
ered that the tolerance limit of NH3 can be set in three phases. The running time of FC
must reach 1000 h in the first phase, 2000 h in the second phase, and 5000 h in the third
phase. Additionally, the limitation of the decrease in cell voltage at 500 mA/cm2 was set
at 25 mV.
In Figure 5, the original voltage and the dropped voltage poisoning with NH3 were
indicated by two straight lines. The line at 0.697 V indicated the original voltage and the
one at 0.672 V as the voltage drop tolerance limit. Based on the experimental results given
in Figure 5, the time spent for 25 mV of cell voltage decrease, and for the four correspond-
ing concentrations of NH3, the time spent to reach 25 mV voltage decrease under the effect
of certain concentration of NH3 can be obtained. In Figure 10, CNH3, the concentration of
NH3, is plotted against 1/t. A polynomial relationship between the two variables can be
drawn out:
tttCNH
1251.45
13.2170
144888
23
3 (1)
where t is time of fuel cell running, h, and CNH3 is NH3 concentration, ppm.
0.00 0.01 0.02 0.03 0.04 0.05 0.06 0.07 0.08
0
2
4
6
8
10
9999.0
1251.45
13.2170
144888
2
23
3
R
tttCNH
C N
H3 /
pp
m
t -1 / h
-1
Figure 10. Relationship between the concentration of NH3 and the maintained time allowed for a
cell voltage drop of 25 mV.
From Equation (1), the tolerance limit for a 25 mV voltage drop can be calculated. For
example, to reach a running time of 1000 h, the concentration of NH3 in H2 should be
Figure 10. Relationship between the concentration of NH3 and the maintained time allowed for acell voltage drop of 25 mV.
From Equation (1), the tolerance limit for a 25 mV voltage drop can be calculated.For example, to reach a running time of 1000 h, the concentration of NH3 in H2 shouldbe controlled at a level of 40 ppb. For 2000 h of operation time, the concentration ofNH3 should be decreased to 20 ppb. For 5000 h of operation time, the concentration ofNH3 should be controlled at 9 ppb, which is very close to the level set by the nationalstandard [24].
In this work, the determination of the tolerance limit was discussed based on thedurability test results. However, the influence factors on the behavior of NH3 effect may bemultiple. Therefore, more experiments should be carried out in various operation condi-tions, such as Pt loading, the operating current density, or voltage and cell temperature, etc.Nevertheless, the method in this paper can be applied in the same way; furthermore, theeffects of other hydrogen impurities, such as CO and H2S, etc., can also be investigatedas well.
4. Conclusions
The present work investigated the poisoning effect of a low concentration of NH3 inair and in fuel on PEMFC. From the experimental results, the following conclusions canbe drawn:
(1) The effect of NH3 on the cathode in the concentration range from 1.0 to 100 ppmwas investigated. The cell voltage would drop to a stable value when the NH3 wasadded to the cathode, and the value decreased with NH3 concentration. Throughdischarging with neat air and then CV, the cell voltage could be recovered to 98.2% ofthe original level. NH3 addition in air caused the increase in polarization resistance,which could be recovered through discharging with neat air. However, the CV curve

Energies 2021, 14, 6556 11 of 12
changed significantly under the effect of NH3, which could not be recovered by neatair purging.
(2) The effect of NH3 on the anode in the concentration range from 0.25 to 10 ppm wasinvestigated. The cell voltage drop rate remained approximately constant with theaddition of NH3; however, the voltage would fluctuate occasionally. The cell voltagecould be recovered to 98.4% of the original level through discharging with pure H2,neat air purging, and CV scan. NH3 in fuel would cause the ohmic and polarizationresistance to increase, which was irreversible when the methods mentioned abovewere taken to recover the cell. The irreversibility was also shown in the CV curves.The H-adsorption peaks in the range of 0.1–0.3 V after poisoning with NH3 could notbe recovered to the original one.
(3) The tolerance limits of NH3 concentration in H2 were determined and a polynomialrelationship between the concentration of NH3 for a cell voltage drop of 25 mV andthe corresponding time of operation was established. The allowable concentration ofNH3 in H2 for a fuel cell operation time of 1000 h is 40 ppb, while for 2000 h, the limitshould be lowered to 20 ppb. For 5000 h, the limit should be controlled at 9 ppb.
Author Contributions: Conceptualization, K.H. and D.Y.; Methodology, K.H. and D.Y.; Software,K.H.; Validation, D.Y.; Formal analysis, K.H. and D.Y.; Investigation, K.H. and D.Y; Resources, D.Y.;date curation, K.H.; writing-original draft, K.H.; writing-review and editing, D.Y. All authors haveread and agreed to the published version of the manuscript.
Funding: This research was funding by the Major Science and Technology Projects of Xinxiang City(ZD18008).
Institutional Review Board Statement: Not applicable.
Informed Consent Statement: Not applicable.
Data Availability Statement: Data sharing not applicable.
Acknowledgments: The author wishes to thank Henan Yuqing Power Co., Ltd. for the support. Thepresent work is partly supported by the Major Science and Technology Projects of Xinxiang City(ZD18008).
Conflicts of Interest: The authors declare no conflict of interest.
References1. EG&G Technical Services, Inc. Fuel Cell Handbook, 7th ed.; US Department of Energy: West Virginia, WV, USA, 2004.2. Devrim, Y.; Albostan, A.; Devrim, H. Experimental investigation of CO tolerance in high temperature PEM fuel cells. Int. J.
Hydrogen Energy 2018, 43, 18672–18681. [CrossRef]3. De Bruijn, F.A.; Papageorgopoulos, D.C.; Sitters, E.F.; Janssen, G.J.M. The influence of carbon dioxide on PEM fuel cell anodes. J.
Power Sources 2002, 110, 117–124. [CrossRef]4. Janssen, G.J.M. Modelling study of CO2 poisoning on PEMFC anodes. J. Power Sources 2004, 136, 45–54. [CrossRef]5. Zhao, Y.Q.; Mao, Y.J.; Zhang, W.X.; Tang, Y.L.; Wang, P.Z. Reviews on the effects of contaminations and research methodologies
for PEMFC. Int. J. Hydrogen Energy 2020, 45, 23174–23200. [CrossRef]6. Cremers, C.; Rau, M.S.; Niedergesass, A.; Pinkwart, K.; Tuebke, J. Effect of Model Fuel Impurities for Reformed Jet Fuels on the
Hydrogen Oxidation at Platinum Based Catalysts under HT-PEMFC Conditions. ECS Trans. 2016, 75, 919–929. [CrossRef]7. Araya, S.S.; Andreasen, S.J.; Kaer, S.K. Experimental Characterization of the Poisoning Effects of Methanol-Based Reformate
Impurities on a PBI-Based High Temperature PEM Fuel Cell. Energies 2012, 5, 4251–4267. [CrossRef]8. De Wild, P.J.; Nyqvist, R.G.; De Bruijn, F.A.; Stobbe, E.R. Removal of sulphur-containing odorants from fuel gases for fuel
cell-based combined heat and power applications. J. Power Sources 2006, 159, 995–1004. [CrossRef]9. Mohtadi, R.; Lee, W.K.; Van Zee, J.W. The effect of temperature on the adsorption rate of hydrogen sulfide on Pt anodes in a
PEMFC. Appl. Catal. B 2005, 56, 37–42. [CrossRef]10. Jimenez, S.; Soler, J.; Valenzuela, R.X.; Daza, L. Assessment of the performance of a PEMFC in the presence of CO. J. Power Sources
2005, 151, 69–73. [CrossRef]11. Prithi, J.A.; Rajalakshmi, N.; Dhathathereyan, K.S. Mesoporous platinum as sulfur-tolerant catalyst for PEMFC cathodes. J. Solid
State Electrochem. 2017, 21, 3479–3485. [CrossRef]12. Chellappa, A.S.; Fischer, C.M.; Thomson, W.J. Ammonia decomposition kinetics over Ni-Pt/Al2O3 for PEM fuel cell applications.
Appl. Catal. A-Gen. 2002, 227, 231–240. [CrossRef]

Energies 2021, 14, 6556 12 of 12
13. Uribe, F.A.; Gottesfeld, S.; Zawodzinski, T.A. Effect of ammonia as potential fuel impurity on proton exchange membrane fuelcell performance. J. Electrochem. Soc. 2002, 149, A293–A296. [CrossRef]
14. Soto, H.J.; Lee, W.K.; Van Zee, J.W.; Murthy, M. Effect of transient ammonia concentrations on PEMFC performance. Electrochem.Solid ST 2003, 6, A133–A135. [CrossRef]
15. Gomez, Y.A.; Oyarce, A.; Lindbergh, G.; Lagergren, C. Ammonia Contamination of a Proton Exchange Membrane Fuel Cell. J.Electrochem. Soc. 2018, 165, F189–F197. [CrossRef]
16. Halseid, R.; Viel, P.J.S.; Tunold, R. Effect of ammonia on the performance of polymer electrolyte membrane fuel cells. J. PowerSources 2006, 154, 343–350. [CrossRef]
17. Hongririkarn, K. Effect of Impurities on Performance of Proton Exchange Membrane Fuel Cell Componets; Celmson University: Clemson,CA, USA, 2010; pp. 14–20.
18. Rodat, S.; Sailler, S.; Druart, F.; Thivel, P.X.; Bultel, Y.; Ozil, P. EIS measurements in the diagnosis of the environment within aPEMFC stack. J. Appl. Electrochem. 2010, 40, 911–920. [CrossRef]
19. Tant, S.; Rosini, S.; Thivel, P.X.; Druart, F.; Rakotondrainibe, A.; Geneston, T.; Bultel, Y. An algorithm for diagnosis of protonexchange membrane fuel cells by electrochemical impedance spectroscopy. Electrochim. Acta 2014, 135, 368–379. [CrossRef]
20. Ford, D.C.; Xu, Y.; Mavrikakis, M. Atomic and molecular adsorption on Pt(111). Surf. Sci. 2005, 587, 159–174. [CrossRef]21. Marken, F.; Neudeck, A.; Bood, A.M. Electroanalytical Methods; Scholz, F., Ed.; Springer: Berlin/Heidelberg, Germany, 2010;
Chapter II.1, pp. 57–106.22. Zhang, X.Y.; Pasaogullari, U.; Molter, T. Influence of ammonia on membrane-electrode assemblies in polymer electrolyte fuel
cells. Int. J. Hydrogen Energy 2009, 34, 9188–9194. [CrossRef]23. Gasteiger, H.A.; Kocha, S.S.; Sompalli, B.; Wagner, F.T. Activity benchmarks and requirements for Pt, Pt-alloy, and non-Pt oxygen
reduction catalysts for PEMFCs. Appl. Catal. B 2005, 56, 9–35. [CrossRef]24. Chinese Standard GB/T. Fuel Specification for Proton Exchange Membrane Fuel Cell Vehicles-Hydrogen; GB/T 37244-2018; Chinese
Standard GB/T: Beijing, China, 2018.