1 AMBER Areal Mean Basin Estimated Rainfall COMAP Flash Flood Course Robert S. Davis, Pittsburgh...
55
AMBER AMBER Areal Mean Basin Areal Mean Basin Estimated Rainfall Estimated Rainfall COMAP Flash Flood Course COMAP Flash Flood Course Robert S. Davis, Robert S. Davis, Pittsburgh WFO Pittsburgh WFO
-
Upload
josephine-gray -
Category
Documents
-
view
215 -
download
1
Transcript of 1 AMBER Areal Mean Basin Estimated Rainfall COMAP Flash Flood Course Robert S. Davis, Pittsburgh...

1
AMBERAMBERAreal Mean Basin Estimated RainfallAreal Mean Basin Estimated Rainfall
COMAP Flash Flood CourseCOMAP Flash Flood Course
Robert S. Davis, Pittsburgh WFORobert S. Davis, Pittsburgh WFO

2
AMBER OverviewAMBER Overview
• All watersheds in county warning area are defined All watersheds in county warning area are defined to a Minimum Basin Area (MBA) of 2 mito a Minimum Basin Area (MBA) of 2 mi22 to to show spatial rainfall distribution. show spatial rainfall distribution.
• The WSR-88D polar grid (1The WSR-88D polar grid (1oo by 1 km) is mapped by 1 km) is mapped to the defined watersheds.to the defined watersheds.
• Average Basin Rainfall (ABR) is computed for Average Basin Rainfall (ABR) is computed for each watershed every volume scan. each watershed every volume scan.
• An hourly ABR rate is determined from the single An hourly ABR rate is determined from the single volume scan (5-6 min.) of ABR.volume scan (5-6 min.) of ABR.

3
Digital Radar Digital Radar RainfallRainfall

4

5
Digital Radar DataDigital Radar Data• Radar provides 3 rainfall measurements, Radar provides 3 rainfall measurements,
location, time, and quantitative estimate.location, time, and quantitative estimate.• Radar grid size determines the minimum Radar grid size determines the minimum
basin area (MBA) for ABR computations.basin area (MBA) for ABR computations.• Sample rate determines time interval, but Sample rate determines time interval, but
product time interval may be larger.product time interval may be larger.• Z/R relationship determines rainfall Z/R relationship determines rainfall
estimate. (Sources of error important!!)estimate. (Sources of error important!!)

6
Digital Rainfall ProductsDigital Rainfall Products• Manually Digitized RadarManually Digitized Radar
(MDR:1975-1993) 40 km grid / 1 hour(MDR:1975-1993) 40 km grid / 1 hour• RADAP-II digital rainfallRADAP-II digital rainfall (1977-1993) (1977-1993)
10-12 offices. Polar grid (210-12 offices. Polar grid (2oo x 2.2 km / 10 min.) x 2.2 km / 10 min.)• WSR-88D Digital Precipitation ArrayWSR-88D Digital Precipitation Array
(DPA:1993-current) 4 km grid - 1 hour(DPA:1993-current) 4 km grid - 1 hour• WSR-88D Digital Hybrid Scan ReflectivityWSR-88D Digital Hybrid Scan Reflectivity
(DHR:1999-current) Polar grid: (1(DHR:1999-current) Polar grid: (1oo x 1 km / 5 min.) x 1 km / 5 min.)

7
ABCDEFGH
JI
KLMNOPQRSTUVWXY
A B C D E F G H I J K L M N O P Q R S T U V W X Y
250nm
125nm
MDR
GRIDRadar inBox MM
LJ352
3 5 2
ROB DigitalReport:

8
Digital Precipitation Array Digital Precipitation Array (DPA)(DPA)
• Time interval (1 hour)Time interval (1 hour)
• Data grid size (HRAP 4 km x 4 km grid)Data grid size (HRAP 4 km x 4 km grid)
• Rainfall estimates in the WSR-88D polar Rainfall estimates in the WSR-88D polar grid (1grid (1oo x 2 km) are averaged to produce a x 2 km) are averaged to produce a single rainfall estimate in each HRAP grid.single rainfall estimate in each HRAP grid.
• Used for Stage 1-3 precipitation estimation Used for Stage 1-3 precipitation estimation and for FFMP in AWIPS Build 5.0.and for FFMP in AWIPS Build 5.0.

9
MDR vs. HRAP 4kmAllegheny County, PA
Pine Creek
HRAP 4kmGrid
Little Pine Creek
4.2km at 40oN
727 mi2
68 mi2
6 mi2
Manually Digitized Radar

10
Digital Hybrid Scan Digital Hybrid Scan Reflectivity (DHR)Reflectivity (DHR)
• Time interval (5-6 minutes)Time interval (5-6 minutes)
• Grid size (1 degree x 1 km)Grid size (1 degree x 1 km)
• Reflectivity to the nearest 0.5 dBZReflectivity to the nearest 0.5 dBZ

11
AMBER DHR Grid AMBER DHR Grid AssignmentAssignment
• DHR grid is mapped to all defined DHR grid is mapped to all defined watershed segmentswatershed segments. This allows ABR . This allows ABR computation in 5-6 minute time steps.computation in 5-6 minute time steps.
• DHR grid is mapped to all DHR grid is mapped to all urban areasurban areas to to compute ABR urban rainfall. compute ABR urban rainfall.
• Single 1km DHR bins are assigned to Single 1km DHR bins are assigned to location of all location of all rain gagesrain gages, allowing gage , allowing gage comparison with radar estimated rainfall.comparison with radar estimated rainfall.

12
78°
80°
82°
84°
86°
88°
90°
92°
94°
96°
22.5km
24.5km26.5km
6380
6379
6378
LITTLE PINE CREEK #5168
2.4mi2
2.1mi2
1.6mi2
ABR 1930-2100 UTC
6380:7.09in
6379:6.35in
6378:3.55in
5168:5.70
30May1986RADAP-II

13
DHR Grid Area (kmDHR Grid Area (km22) ) vs. Radar Range (km)vs. Radar Range (km)
0
0.5
1
1.5
2
2.5
3
3.5
4
0 50 100 150 200

14
Stream Basin Stream Basin DefinitionsDefinitions

15
National Basin DelineationNational Basin Delineation
• 30Sep1999 – NWS agrees to fund the 30Sep1999 – NWS agrees to fund the AMBER National Basin Delineation project AMBER National Basin Delineation project by NSSL for all of the United States.by NSSL for all of the United States.
• ArcInfo used to define the watershed ArcInfo used to define the watershed boundaries.boundaries.
• USGS 1 arc second (30 m) DEM data USGS 1 arc second (30 m) DEM data supplied by EROS Data Center.supplied by EROS Data Center.
• www.nssl.noaa.gov/teams/western/basinswww.nssl.noaa.gov/teams/western/basins

16
AMBER Watershed DivisionAMBER Watershed Division
• All watersheds in the county warning area All watersheds in the county warning area are divided into hydrologic segments no are divided into hydrologic segments no larger than 10 milarger than 10 mi22..
• A Minimum Basin Area of 2 miA Minimum Basin Area of 2 mi22 is used in is used in the initial NSSL stream creation procedure.the initial NSSL stream creation procedure.
• Each forecast office may modify the NSSL Each forecast office may modify the NSSL stream database (subdivide or aggregate).stream database (subdivide or aggregate).

17
ABR and ABR Rate ABR and ABR Rate
ComputationsComputations

18
50km 51km 52km 53km
1km 1km 1km90°
91°
0.34mi2 0.35mi2 0.35mi2
0.8
7km
0.9
3km
0.35"0.25"0.08"
(.34 + .35 + .35)
6min RAIN:Z = 300R1.4
ABR = = 0.228"
watershedboundary
AVERAGE BASIN RAINFALL (ABR)
Rate = 0.228 X 10 = 2.28 in/hr
.34 .35 .35 .35 )(.08 x x x+ .25 +
42dBZ* 50dBZ* 52dBZ** Average Reflectivity 2 Scans

19
Flash Flood Threat and ABRFlash Flood Threat and ABR
• Severity of flash flooding is directly related Severity of flash flooding is directly related to the observed ABR in a watershed.to the observed ABR in a watershed.
• The time period of the ABR determines the The time period of the ABR determines the ABR rate. The higher the ABR rate, the ABR rate. The higher the ABR rate, the greater the risk of serious flash flooding.greater the risk of serious flash flooding.
• ABR varies as function of watershed area. ABR varies as function of watershed area. As watershed area increases, ABR and As watershed area increases, ABR and ABR rate tend to decrease.ABR rate tend to decrease.

20
ABR RateABR Rate
• Based on 5-6 minute observed ABR. Based on 5-6 minute observed ABR.
• Hourly ABR Rate = ABR x 3600/vsec, Hourly ABR Rate = ABR x 3600/vsec, where vsec= the number of seconds in the where vsec= the number of seconds in the volume scan.volume scan.
• ABR Rate is used to identify watersheds ABR Rate is used to identify watersheds currently receiving the heaviest rainfall, currently receiving the heaviest rainfall, before the flash flood producing before the flash flood producing accumulation occurs.accumulation occurs.

21
Pittsburgh Urban Pittsburgh Urban Flash FloodFlash Flood
May 18, 1999May 18, 1999

22
ABR in WatershedsABR in Watersheds

23
AVERAGE BASIN RAINFALL (ABR)TURTLE CREEK WATERSHED 147mi2
18-19May1999
18/2100-
19/0200 UTC
X.XX = ABR (in)
MONONGAHELARIVER
ALLEGHENYCOUNTY
WESTMORELANDCOUNTY
N
PITCAIRN
0 5km
1108 2303 2306
2307
2304 2305
3.03 2.03 1.661.33
2.04 1.13
1108 = TURTLE CREEK(1)2303 = TURTLE CREEK(2)2304 = BRUSH CREEK(1)
2305 = BRUSH CREEK(2)2306 = TURTLE CREEK(3)
2307 = TURTLE CREEK(4)
1.86
24.0mi2
10.2mi228.2mi2
22.4mi2 34.8mi2
26.9mi2
1hr FFG 1.83hr FFG 2.6

24
AMBER Time Display IntervalAMBER Time Display Interval
• 5-minute ABR5-minute ABR: Used to compute ABR Rate and : Used to compute ABR Rate and to sum the ABR through a 2 hour time period. to sum the ABR through a 2 hour time period.
• 15-minute ABR15-minute ABR: Used for comparison with : Used for comparison with IFLOWS rain gage data and to sum the ABR IFLOWS rain gage data and to sum the ABR through a 6 hour time period.through a 6 hour time period.
• 1-hour ABR1-hour ABR: Used for history of ABR in a : Used for history of ABR in a watershed and to sum ABR through a 24 hour watershed and to sum ABR through a 24 hour time period.time period.
25
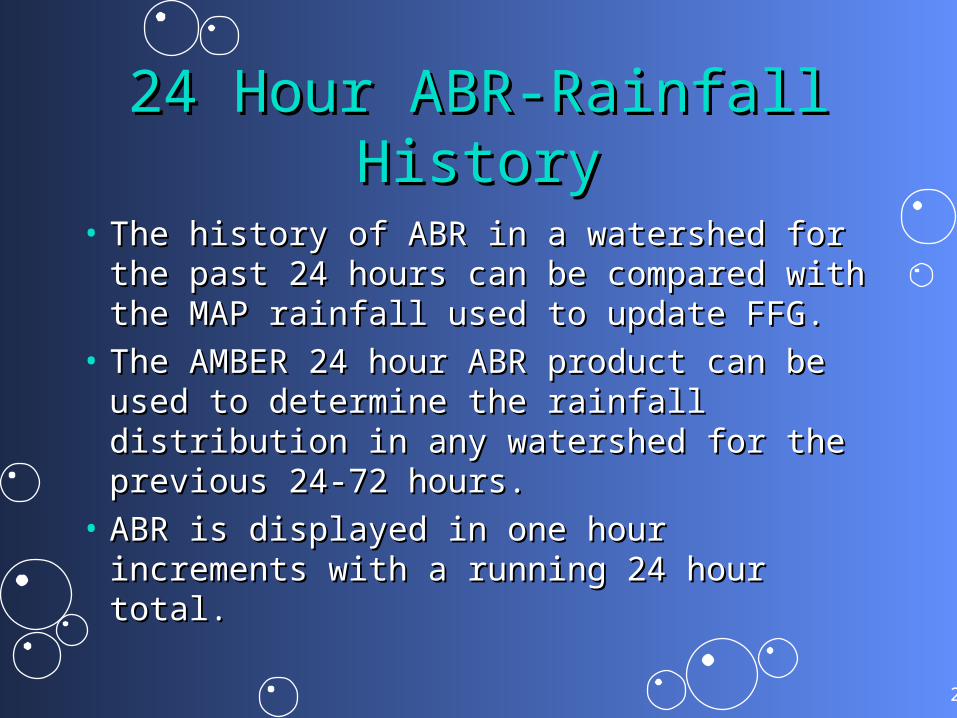
24 Hour ABR-Rainfall History24 Hour ABR-Rainfall History
• The history of ABR in a watershed for the The history of ABR in a watershed for the past 24 hours can be compared with the past 24 hours can be compared with the MAP rainfall used to update FFG.MAP rainfall used to update FFG.
• The AMBER 24 hour ABR product can be The AMBER 24 hour ABR product can be used to determine the rainfall distribution in used to determine the rainfall distribution in any watershed for the previous 24-72 hours. any watershed for the previous 24-72 hours.
• ABR is displayed in one hour increments ABR is displayed in one hour increments with a running 24 hour total.with a running 24 hour total.

26
0
0.5
1
1.5
2
2.50
10
0
05
00
09
00
13
00
17
00
21
00
ABR Rate
ABR
Turtle Creek (1) ABR #1108Turtle Creek (1) ABR #110818 May 1999 1-hour data18 May 1999 1-hour data

27
0
0.5
1
1.5
2
2.5
3
3.520
00
2100
2200
2300
0000
0100
0200
ABR Rate
ABR
Turtle Creek (1) ABR #1108Turtle Creek (1) ABR #110818-19 May 1999 15-minute data18-19 May 1999 15-minute data

28
Turtle Creek(1)#1108
Turtle Creek
MonongahelaRiver
BraddockLock
Kenmore Ave.
Electric Ave.
53215322
6334
6598
63366597
6335
6599 6309
63106605
6596
Pitcairn
5.09
4.404.28
3.76
3.72
3.22
3.09
3.09
1.81
2.12
2.46
1.75
X.XX = ABR18MAY1999 2000 UTC-19MAY1999 0200 UTC
3.03
(inches)
2.42.3
3.8
3.12.8
1.8
2.7
0.70.5
1.4
0.2
0.9
x.x = Area(square miles)

29
00.5
11.5
22.5
33.5
44.5
520
00
2100
2200
2300
0000
0100
0200
ABR Rate
ABR
Forest Hills Run ABR #5321Forest Hills Run ABR #532118-19May1999 15 min. data18-19May1999 15 min. data

30
0
0.5
1
1.5
2
2.5
3
3.521
06
2121
2136
2151
2206
2221
2236
2251
2306
ABR Rate
ABR
Forest Hills Run ABR #5321Forest Hills Run ABR #532118May1999 5 min. data18May1999 5 min. data
31
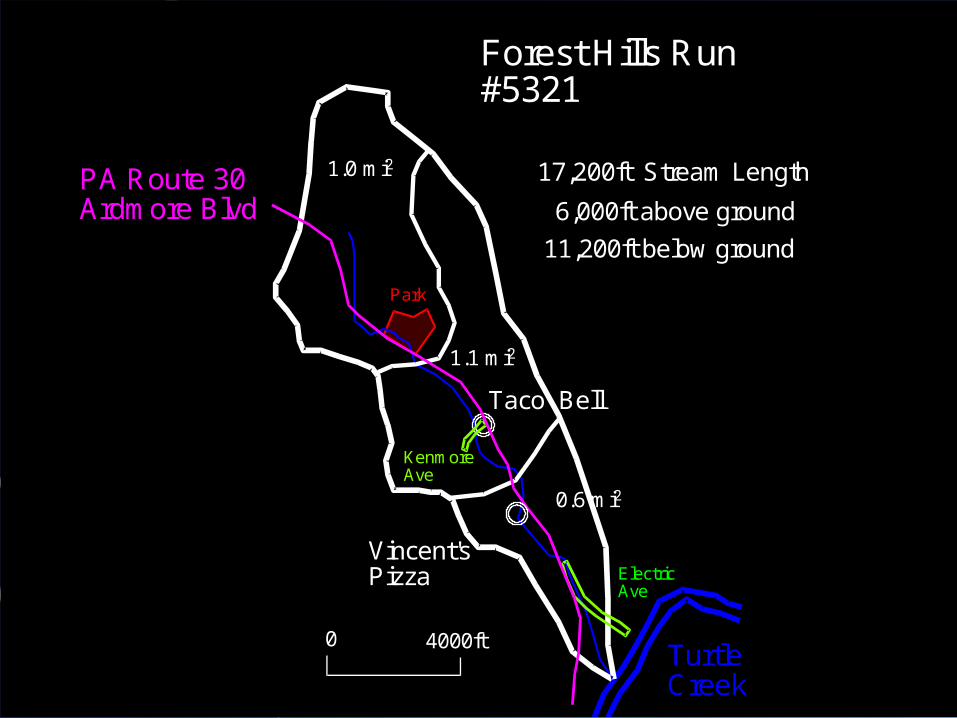
PA Route 30Ardmore Blvd
TurtleCreek
1.0 mi2
0.6 mi2
1.1 mi2
0 4000ft
Forest Hills Run#5321
17,200ft Stream Length
6,000ft above ground
11,200ft below ground
Vincent'sPizza
Taco Bell
KenmoreAve
ElectricAve
Park

32

33

34

35

36

37

38
Forest Hills EMA ReportsForest Hills EMA Reports
• 2215 UTC - First reports of water in 2215 UTC - First reports of water in basements. basements.
• 2300 - 0100 UTC many cars stranded along 2300 - 0100 UTC many cars stranded along Ardmore Boulevard.Ardmore Boulevard.
• 0056 UTC - 10/homes/20 people evacuated 0056 UTC - 10/homes/20 people evacuated on Kenmore Avenue.on Kenmore Avenue.

39
ABR in Urban ABR in Urban AreasAreas
NWSFO LocalizationNWSFO Localization

40
MonongahelaRiver
YoughioghenyRiver
Braddock Lock12191218
63986399
1725
5333
5332
1226
4030
4032
41344031
4058
4117
4028
4059
4029
4028 Braddock 4029 Clairton4030 McKeesport4031 Glassport4032 Portvue4058 Dravosburg4059 Wilson4117 Duquesne4134 Liberty
(4332)
Urban Areas:
4.38
3.86
3.99
3.74
3.58
3.90
3.673.28
4.213.49 3.01
3.18
2.32
2.93
2.90
3.273.18
5.26 (4.44)Rain Gage
0.9
3.0
2.21.4
1.3
1.2
0.4
2.0
0.4
x.xx = ABR18May1999 2000 UTC-19May1999 0200 UTC
x.x = Area in(square miles)
1.6
3.2
1.8 2.3
3.1
1.5
0.9
1.5
6398 Thomson Run(1)6399 Thompson Run(2)
1218 West Run1219 Homestead Run
1226 Crooked Run
1725 Curry HollowRoad Run
5332 Coal Valley Run5333 New EnglandRoad Run

41
Mon Valley Urban AreasMon Valley Urban AreasTotal population 86,565Total population 86,565
• Rankin/Braddock 8,256 3.0miRankin/Braddock 8,256 3.0mi22
• Clairton 12,188 1.3miClairton 12,188 1.3mi22
• McKeesport 31,012 2.0miMcKeesport 31,012 2.0mi22
• Glassport 6,242 1.2miGlassport 6,242 1.2mi22
• Port Vue 5,316 0.9miPort Vue 5,316 0.9mi22
• Wilson/Dravosburg 11,075 0.8miWilson/Dravosburg 11,075 0.8mi22
• Duquesne 10,094 1.4miDuquesne 10,094 1.4mi22
• Liberty 3,112 2.2miLiberty 3,112 2.2mi22

42
AMBER Rain Gage AMBER Rain Gage ComputationComputation
NWSFO LocalizationNWSFO Localization

43
AMBER Z/R Gage ComparisonAMBER Z/R Gage Comparison
• The single 1km DHR bin that contains the The single 1km DHR bin that contains the rain gage is used to compute the radar rain gage is used to compute the radar rainfall estimate.rainfall estimate.
• Tropical vs. Standard Z/R usage can be Tropical vs. Standard Z/R usage can be estimated using 15 minute gage data.estimated using 15 minute gage data.
• Gage comparisons should be done to verify Gage comparisons should be done to verify validity of the WSR-88D rainfall estimates.validity of the WSR-88D rainfall estimates.

44
0
1
2
3
4
5
620
00
2100
2200
2300
0000
0100
0200
ABR Rate
ABR
Braddock Lock 2 ABR #4332Braddock Lock 2 ABR #433218-19May1999 15 min. data18-19May1999 15 min. data
24 hr Gage:24 hr Gage:4.44 inches4.44 inches

45
0
0.5
1
1.5
2
2.5
3
3.5
4
4.521
06
2121
2136
2151
2206
2221
2236
2251
2306
ABR Rate
ABR
Braddock Lock 2 ABR #4332Braddock Lock 2 ABR #433218May1999 5 min. data18May1999 5 min. data
24 hr Gage:24 hr Gage:4.44 inches4.44 inches

46
Amber arrives in Amber arrives in AWIPSAWIPS
Build 5.1Build 5.1

47
Flash Flood Monitoring and Flash Flood Monitoring and Prediction (FFMP) in AWIPSPrediction (FFMP) in AWIPS
• Build 5.0: FFMP will compare DPA rainfall Build 5.0: FFMP will compare DPA rainfall with FFG (HRAP 4 km x 4km grid). No with FFG (HRAP 4 km x 4km grid). No ABR computations.ABR computations.
• Build 5.1 FFMP will compute AMBER Build 5.1 FFMP will compute AMBER ABR and ABR Rate, using the DHR ABR and ABR Rate, using the DHR product (1product (1oo x 1 km polar grid) and the x 1 km polar grid) and the NSSL NBD watersheds.NSSL NBD watersheds.

48

49

50
AMBER AMBER Both Standard Both Standard and Tropical and Tropical
Convective Z/RConvective Z/R

51
Tropical Z/R CasesTropical Z/R Cases• Standard Z/R: Z = 300RStandard Z/R: Z = 300R1.41.4
• Tropical Z/R: Z = 250RTropical Z/R: Z = 250R1.21.2
• Maximum Rate Cap 5.0 in/hr?Maximum Rate Cap 5.0 in/hr?
• Tropical Storm not required!!!Tropical Storm not required!!!

52
ConclusionsConclusions• Small watersheds definition is the key to detection Small watersheds definition is the key to detection
of flash flooding.of flash flooding.• ABR Rate gives early warning for flash flood ABR Rate gives early warning for flash flood
potential. potential. • Time duration of rainfall (5, 15, 60 minutes) Time duration of rainfall (5, 15, 60 minutes)
impacts forecaster perception of flash flood threat.impacts forecaster perception of flash flood threat.• User selectable time window needed (30, 60, 90, User selectable time window needed (30, 60, 90,
120, 150, 180 minutes).120, 150, 180 minutes).

53
AMBER SummaryAMBER Summary• ABR provides basin specific rainfall to ABR provides basin specific rainfall to
determine flash flood risk (ABR-FFG)determine flash flood risk (ABR-FFG)
• ABR rate focuses forecaster attention on ABR rate focuses forecaster attention on critical streams before flooding occurs.critical streams before flooding occurs.
• History of ABR helpful in adjusting FFG for History of ABR helpful in adjusting FFG for multiple rainfall events.multiple rainfall events.
• Basin specific ABR allows forecaster to Basin specific ABR allows forecaster to mention “threat area” in warning text.mention “threat area” in warning text.

54
AMBER Data SourcesAMBER Data Sources• ArcView and the spatial analyst extension. ArcView and the spatial analyst extension.
www.esri.comwww.esri.com• USGS Data (3 arc second DEM data) USGS Data (3 arc second DEM data)
edcwww.cr.usgs.govedcwww.cr.usgs.gov• EPA Data (RF3 data files) EPA Data (RF3 data files)
www.epa.gov/OST/BASINS/gisdata.htmlwww.epa.gov/OST/BASINS/gisdata.html• Ami Arthur [email protected] Arthur [email protected]• [email protected] (SOO KHNL)[email protected] (SOO KHNL)

55
AMBER Case StudiesAMBER Case Studiesftp 198.206.50.10 publicftp 198.206.50.10 public
• buff.ppt 13Jul96 buff.ppt 13Jul96 • epgh99.ppt 18May99epgh99.ppt 18May99• pitcairn.ppt 01Jul97pitcairn.ppt 01Jul97• zion.ppt 27Jul98zion.ppt 27Jul98• ohio98.ppt 26Jun98ohio98.ppt 26Jun98• dallas95.ppt 05May95dallas95.ppt 05May95• ftc97.ppt 28Jul97ftc97.ppt 28Jul97• kc1998.ppt 05Oct98kc1998.ppt 05Oct98
• Buffalo Creek, COBuffalo Creek, CO• Pittsburgh, PAPittsburgh, PA• Pittsburgh, PAPittsburgh, PA• Cedar City, UTCedar City, UT• Eastern OhioEastern Ohio• Dallas, TX*Dallas, TX*• Fort Collins, CO*Fort Collins, CO*• Kansas City, MO* Kansas City, MO*
* Tropical Z/R * Tropical Z/R CasesCases