Comparison of Tensiometer and Climatological Methods for ...

1. A PRELIMINARY STUDY ON CONSTRUCTION OF A HIGH CAPACITY TENSIOMETER AND ITS USE IN MEASUREMENT OF
MATRIC SUCTION IN UNSATURATED SOILS
A THESIS SUBMITTED TO THE GRADUATE SCHOOL OF NATURAL AND APPLIED SCIENCES
OF MIDDLE EAST TECHNICAL UNIVERSITY
BY
ALİ OKAN KÖKSALAN
IN PARTIAL FULFILLMENT OF THE REQUIREMENTS FOR
THE DEGREE OF MASTER OF SCIENCE IN
CIVIL ENGINEERING
FEBRUARY 2013


Approval of the thesis:
A PRELIMINARY STUDY ON CONSTRUCTION OF A HIGH CAPACITY TENSIOMETER AND ITS USE IN MEASUREMENT OF MATRIC SUCTION IN UNSATURATED SOILS
submitted by ALİ OKAN KÖKSALAN in partial fulfillment of the requirements for the degree of Master of Science in Civil Engineering Department, Middle East Technical University by,
Prof. Dr. Canan Özgen ____________________ Dean, Graduate School of Natural and Applied Sciences Prof. Dr. Ahmet Cevdet Yalçıner ____________________ Head of Department, Civil Engineering Dept., METU Inst. Dr. N. Kartal Toker ____________________ Supervisor, Civil Engineering Dept., METU
Examining Committee Members: Prof. Dr. Erdal Çokca ____________________ Civil Engineering Dept., METU
Inst. Dr. Nabi Kartal Toker ____________________ Civil Engineering Dept., METU
Assist Prof. Dr. Nejan Huvaj Sarıhan ____________________ Civil Engineering Dept., METU
Inst Dr.Onur Pekcan ____________________ Civil Engineering Dept., METU
Sarp Dinçer, M. Sc. Civil Engineer ____________________ Teknik Destek Grubu Bilimsel Ölçme Ltd. Şti..
Date: 01.01.2013

iv
I hereby declare that all information in this document has been obtained and presented in accordance with academic rules and ethical conduct. I also declare that, as required by these rules and conduct, I have fully cited and referenced all material and results that are not original to this work.
Name, Last Name : ALİ OKAN KÖKSALAN
Signature :

v
ABSTRACT
A PRELIMINARY STUDY ON CONSTRUCTION OF A HIGH CAPACITY
TENSIOMETER AND ITS USE IN MEASUREMENT OF MATRIC
SUCTION IN UNSATURATED SOILS Köksalan, Ali Okan
M.Sc., Department of Civil Engineering
Supervisor: Inst. Dr. Nabi Kartal Toker
February 2013, 85 pages
Soil suction is one of the main state parameters that governs unsaturated soil behaviour. Tensiometers are the only type of probe that can measure soil suction directly, but only up to 90 kPa. In the past two decades, a new type of tensiometer with much greater measurement range (up to 2 MPa) has appeared in the literature. The measurement range (i.e. capacity) of a tensiometer is limited by (i) how well it is saturated, and (ii) the air entry value of its porous interface.
In this study, the first high capacity tensiometer of Turkey was designed and built. For the purpose of increasing the measurement capacity of the tensiometers, a novel saturation setup that uses a hydraulic pressurization system with capacity of 10 MPa was designed and built. A vacuum-and-pressure saturation procedure was developed. To calibrate the 10 MPa pressure transducers that form the core of the tensiometers, a high-pressure calibration setup capable of pressurizing up to 11 MPa was designed and built. By varying designs of tensiometer bodies, porous interfaces and seals, ways of increasing the suction capacity are investigated. Over a dozen tensiometer design variations are developed, and tried by exposing to atmospheric evaporation. A maximum suction measurement of 870 kPa was achieved with a conventional design; however, none of the new designs were successful. 3 successful designs were also briefly tried on soil samples.
Key Words High Capacity Tensiometers, Miniature Tensiometers, Suction on Soils, Matric Suction Porous Filter Material, Ankara Clay, Ceramic Membrane, Unsaturated Soil, Unsaturated Soil Mechanics

vi
ÖZ
YÜKSEK KAPASİTELİ TANSİYOMETRE YAPIMI VE DOYMAMIŞ
ZEMİNLERDE MATRİK EMME GERİLMESİ ÖLÇÜMÜNDE
KULLANILMASI HAKKINDA ÖN ÇALIŞMA
Köksalan, Ali Okan
Yüksek Lisans, İnşaat Mühendisliği Bölümü
Tez Yöneticisi: Öğr. Gör. Dr. Nabi Kartal Toker
Şubat 2013, 85 sayfa
Zemin çekme basıncı doyumamış zeminlerin davranışlarını belirleyen en önemli parametrelerden biridir. Tansiyometerler 90 kPa’a kadar olan zemin çekme basınç değerlerini doğrudan ölçebilen yegane cihazlardır. Geçtiğimiz yirmi yıllık süre zarfında daha yüksek ölçüm aralığına sahip (2 MPa’a kadar) yeni bir tansiyometre türü litaratüre girmiştir. Bu tansiyometrelerin ölçüm aralığı (kapasite) (i)tansiyometrenin doyurma kalitesiyle ve (ii) gözenekli arayüzün hava giriş basıncı ile doğrudan ilgilidir.
Bu çalışmada Türkiye’nin ilk yüksek kapasiteli tansiyometresi tasarlanmış ve üretilmiştir. Üretlilen tansiyometrenin kapasitesini arttırabilmek amacıyla hidrolik ünite yardımıyla 10 Mpa’a kadar basınç üretebilen özgün bir doyurma düzeneği tasarlanmışır. Vakum ve doyurma prosedürü geliştirilmiştir. Tansiyometrelerin ana parçalarından biri olan basınç sensörlerini 10 MPa’a kadar kalibre edebilmek için 11 MPa kapasiteli yüksek basıç kalibrasyon sistemi tasarlanmış ve üretilmiştir. Tansiyometenin kapasitesini arttırmak amacıyla çeşitli tansiyometre gövdeleri,gözeneki arayüzler ve sızdırmazlık ekipmanları denenmiştir.
Birçok tansiyometre tasarım varyasyonları geliştirilmiş ve atmosferik buharlaşma altında test edilmiştir. Konvensiyonel tasarımlarla maksimum 870 kPa zemin çekme basıncı ölçülmüş; fakat yeni tasarımlardan hiçbiri başarılı sonuçlar vermemiştir. Başarılı 3 tasarım ile doymamış zemin numunelerinde çok detaylı olmayan testler yapılmıştır.
Anahtar Kelimeler: Yüksek Kapasiteli Tansiyometre, Minyatür Tansiyometre, Çekme Basıncı, Matrik Basınç, Gözenekli Filtre Malzemesi, Ankara Kili, Seramik Membran, Doymamış Zemin, Doymamış Zemin Mekaniği,

vii
To My Mom and Dad...

viii
ACKNOWLEDGEMENTS
I would like to state that I am very grateful to my advisor Dr. Nabi Kartal Toker for his motivation and contribution. He has been supervising me with everlasting patience and interest from the beginning to the end.
I would like to thank to Işın Dizvay for her encouragement, positive motivation and in hard times. I always feel your endless support with me. Thank you again.
My boss Necati Yılmaz showed an everlasting patience during my graduate education. I am very grateful to him all for their invaluable respect.
The research was accomplished under the financial support of METU Scientific Research Projects (BAP) Coordination Office. Support of this office is appreciated. Special thanks are to Asst. Prof. Dr. Nejan Huvaj Sarıhan and Dr. Onur Pekcan for being control commission members for BAP.
I would like to thank my thesis committee members for all of their guidance through this process; your discussion, ideas, and feedback have been absolutely invaluable.
I would like to express thanks to my friends Reza Ahmadi Naghadeh, Arash Maghsoudloo, Emrah Sünnetçioğlu Volkan Engin Orkhan Musayev and Erdinc Susuzluoglu for their supports and helps during my study. I am very glad to have friends like you.
I wish to thank Kamber Bilgen and Ulaş Nacar for providing me such a friendly environment
I am appreciative of Mahmut Arslan from Hidrolift,Tuncay İnce from Demirer Hidrolik and Koray Kuzucu from Hidrokontrol. Special thanks are to Uğur Oğuz and Erman Tunçay and other employees of Eylul Lab.
Last not but least, I owe a deep gratitude to my family Nilgün Köksalan and Sinan Köksalan whose support and encouragement were indispensable in realizing this study. Without their support and patience, this study would stay as a plan and could never be realized. In this sense, if having an academic degree is a success, i think my parents possess the greater part of it.
.

ix
TABLE OF CONTENTS
ABSTRACT ........................................................................................................................... v
ÖZ .................................................................................................................................. vi
ACKNOWLEDGEMENTS ..................................................................................................... viii
TABLE OF CONTENTS .......................................................................................................... ix
LIST OF FIGURES ............................................................................................................... xiii
LIST OF TABLES ................................................................................................................. xvi
1. INTRODUCTION .......................................................................................................... 1
1.1 Research Statement and Significance ........................................................................ 1
1.2 Scope and Aims of Thesis ........................................................................................... 2
1.3 Outline of Thesis ........................................................................................................ 2
2. LITERATURE SURVEY .................................................................................................. 3
2.1 Tensile Strength of Water .......................................................................................... 3
2.1.1 Surface Tension ................................................................................................. 3
2.1.2 Cavitation .......................................................................................................... 4
2.2 Soil Suction ................................................................................................................. 4
2.2.1 Matric Suction ................................................................................................... 5
2.2.2 Osmotic Suction ................................................................................................ 6
2.3 Soil Moisture Characteristic Curve ............................................................................. 7
2.4 Soil Suction Measurements........................................................................................ 8
2.4.1 Tensiometers ..................................................................................................... 9
2.4.1.1 Porous Interface ............................................................................................ 9
2.4.1.2 Conventional Tensiometers ........................................................................ 10
2.4.2 High Capacity Tensiometers (HCT) .................................................................. 12
2.4.2.1 Cavitation in HCT ......................................................................................... 12
2.5 History of High Capacity Tensiometers .................................................................... 14
3. EQUIPMENT .............................................................................................................. 21
3.1 Tensiometers ........................................................................................................... 21
Porous Interface ............................................................................................................... 22
3.1.1.1 Soil Moisture Equipment (SME) Corporation Porous Ceramics. ................. 23

x
3.1.1.2 Synkera Ceramic Membranes ..................................................................... 23
3.1.1.3 Protective Layers......................................................................................... 23
3.1.2 Pressure Transducer ........................................................................................ 24
3.1.3 Tensiometer Body ........................................................................................... 24
3.1.3.1 S –Type Bodies ............................................................................................ 25
3.1.3.2 T –Type Bodies ............................................................................................ 25
3.1.4 Sealing Types ................................................................................................... 27
3.1.4.1 Epoxies ........................................................................................................ 27
3.1.4.2 Back Seals .................................................................................................... 27
3.2 Saturation Setup ...................................................................................................... 28
3.2.1 Piston ............................................................................................................... 30
3.2.2 Oil Pump .......................................................................................................... 31
3.2.3 Vacuum Pump ................................................................................................. 33
3.2.4 Saturation Chamber ........................................................................................ 34
3.2.5 Water Deaeration Tank ................................................................................... 35
3.2.6 Connection Parts and Valves ........................................................................... 36
3.3 Calibration Setup ..................................................................................................... 36
3.4 Data Acquisition System and Software .................................................................... 38
4. PROCEDURES ............................................................................................................ 39
4.1 Tensiometer Assembly ............................................................................................. 39
4.1.1 1-Layered Porous Stone Sealing ...................................................................... 39
4.1.2 2-Layered Porous Stone Sealing ...................................................................... 39
4.1.3 Back Sealing ..................................................................................................... 41
4.1.4 Front Sealing ................................................................................................... 41
4.2 Initial Checks ............................................................................................................ 41
4.2.1 Stability of the Oil Pump ................................................................................. 41
4.2.2 Corrosion and Water Infiltration Check .......................................................... 42
4.2.3 Data Acquisition and Software ........................................................................ 42
4.2.4 Calibration for Lower Pressures ...................................................................... 43
4.2.5 Calibration for Higher Pressures ..................................................................... 44
4.3 Saturation Procedure ............................................................................................... 45
4.3.1 System Water Filling ........................................................................................ 45
4.3.2 System Vacuuming and Pressurizing ............................................................... 45
4.4 HCT Capacity Trials ................................................................................................... 48

xi
4.5 Soil Suction Measurement ....................................................................................... 48
5. RESULTS .................................................................................................................... 51
5.1 Calibration of Pressure Transducers ........................................................................ 52
5.2 Capacity and Soil Suction Measurement Trials ........................................................ 52
5.2.1 Trial #1: S/C1 with O-ring ................................................................................ 54
5.2.2 Trial #2: T/C1 with PTFE band ......................................................................... 54
5.2.3 Trial #3: T/M1 with Partial Liquid Gasket ........................................................ 54
5.2.4 Trial #4: T/C1 with Full Liquid Gasket .............................................................. 55
5.2.5 Trial #5: S/C1 with Full Liquid Gasket .............................................................. 55
5.2.6 Trial #6: T/M1 with Full Liquid Gasket ............................................................. 55
5.2.7 Trial #7: S/C1 with O-ring ................................................................................ 55
5.2.8 Trial #8: T/M1 with O-ring ............................................................................... 56
5.2.9 Trial #9: T/M1 with Full Body Liquid Gasket and O-Ring ................................. 56
5.2.10 Trial #10: S/M2 with O-Ring ............................................................................ 56
5.2.11 Trial #11: S/C1 with O-Ring ............................................................................. 57
5.2.12 Trial #12: S/M2 with O-Ring ............................................................................ 57
5.2.13 Trial #13: T/C1 with PTFE Band ....................................................................... 57
5.2.14 Trial #14: S/W1 with O-Ring ............................................................................ 57
5.2.15 Trial #13: T/C1 with PTFE Band ....................................................................... 57
5.2.16 Trial #14: S/W1 with O-Ring ............................................................................ 57
5.2.17 Trial #15 and Trial#16: TC1 with PTFE band and SC1 with O-ring ................... 58
5.2.18 Trial #17 and Trial#18: SC2 with O-ring ........................................................... 58
5.2.19 Trial #19 and Trial#20: SC2 with O-ring ........................................................... 58
5.2.20 Trial #21and Trial#22: SC2 with O-ring ............................................................ 58
5.2.21 Trial #23and Trial#24: SC2 with O-ring ............................................................ 58
5.3 Interpretation of Results .......................................................................................... 59
5.3.1 HCT Response to pressure ............................................................................... 59
5.3.2 HCT Response to Suction ................................................................................. 60
6. CONCLUSION ............................................................................................................. 61
6.1 Summary of Works ................................................................................................... 61
6.2 Research Findings..................................................................................................... 61
6.3 Recommendation of Future Works .......................................................................... 62
7. BIBLIOGRAPHY .......................................................................................................... 63
APPENDIX - A. ................................................................................................................... 67

xii
A.1 XPM-10 PRESSURE SENSOR DIMENSIONS AND WIRE SHEMATIC ............................ 67
A.2 HCT INNER PTFE BODY ENGINEERING DRAWING .................................................... 69
A.3 HCT OUTER STEEL BODY ENGINEERING DRAWING ................................................. 70
A.4 PISTON ENGINEERING DRAWING ............................................................................ 71
A.5 SATURATION CHAMBER UPPER PLATE .................................................................... 72
A.6 SATURATION CHAMBER LOWER PLATE ................................................................... 73
APPENDIX - B. ................................................................................................................... 75
B.1 TIME VERSUS PRESSURE GRAPHS OF TRIALS ........................................................... 75
B.2 CALIBRATION DATA AND GRAPHS ........................................................................... 82

xiii
LIST OF FIGURES
Figure 2-1 Surface Tension at the air-water interface (a) Inter molecular forces on contractile
skin and water (b) pressures and surface tension acting on a curved two dimensional surface
(Fredlund & Rahardjo, 1993) ....................................................................................................... 3
Figure 2-2 Phase Diagram for Water (Marinho & Chandler, 1995) ............................................. 4
Figure 2-3 Surface tension on warped membrane (Fredlund & Rahardjo, 1993) ....................... 6
Figure 2-4 Total Matric and osmotic suction measurements (Krahn & Fredlund, 1972) ............ 7
Figure 2-5 SMC curve conceptual general behaviour model (McQueen & Miller, 1974) ........... 7
Figure 2-6 Enlarged Cross Section of Porous Cup-Porous Medium and surface (ASTM
D3404,2004) ................................................................................................................................ 9
Figure 2-7 Schematic Drawing of Conventional Tensiometer (AgriDrip Co., 2012) .................. 11
Figure 2-8 Typical Conventional Tensiometers (A. Ridley & Wray, 1996) ................................. 11
Figure 2-9 The crevice model of heterogeneous nucleation (Marinho et al., 2008) ................. 13
Figure 2-10 Cavitation Nuclei (Marinho & de Souza Pinto, 1997) ............................................. 13
Figure 2-11 The Imperial College Tensiometer (A. Ridley & Burland, 1993) ............................. 14
Figure 2-12 Saskatchewan suction probe (tensiometer) (Guan & Fredlund, 1997) .................. 14
Figure 2-13 Behaviour of two types of porous stone (Sjoblom, 2000) ...................................... 15
Figure 2-14 MIT Tensiometer Version 6.1 (Toker, 2002) ........................................................... 16
Figure 2-15 Schematic diagram of the mini suction probe (Meilani et al., 2002) ..................... 17
Figure 2-16 A suction Probe (Ridley & Burland, 2005) .............................................................. 17
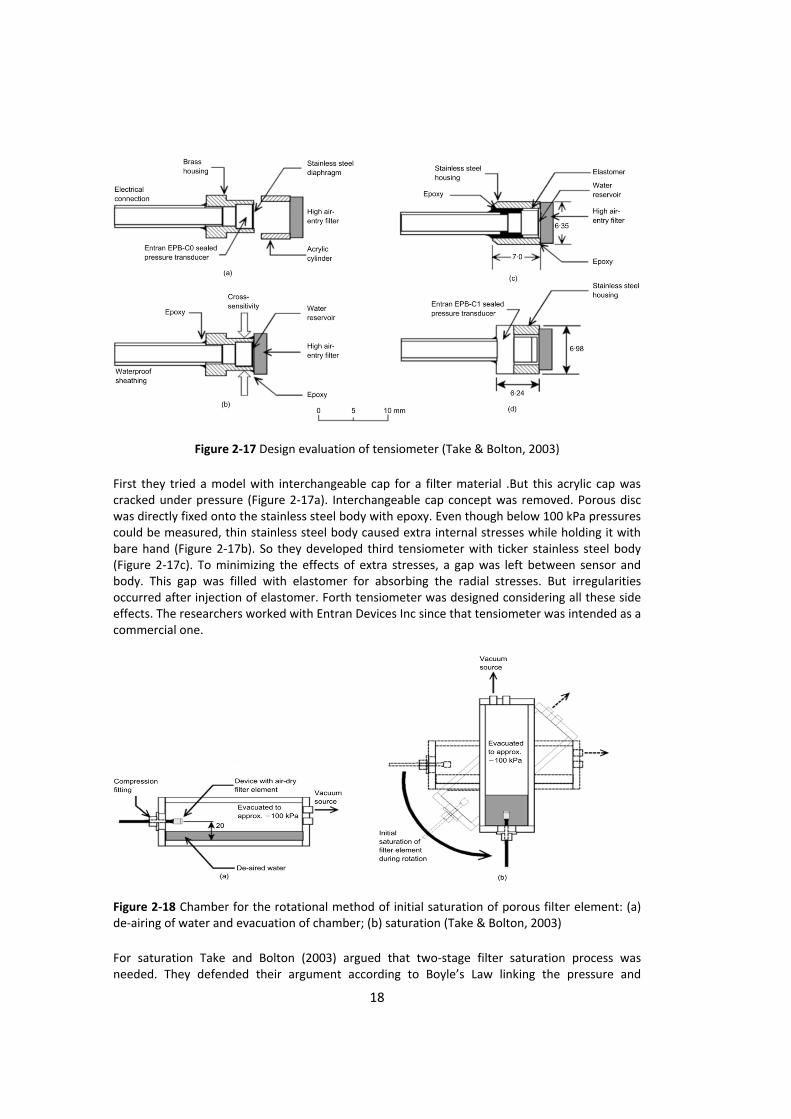
Figure 2-17 Design evaluation of tensiometer (Take & Bolton, 2003) ...................................... 18
Figure 2-18 Chamber for the rotational method of initial saturation of porous filter element:
(a) de-airing of water and evacuation of chamber; (b) saturation (Take & Bolton, 2003) ........ 18
Figure 2-19 Schematic drawing of the WF-DU tensiometer (Lourenço, et al., 2006) ............... 19
Figure 3-1 Typical T type High Capacity Tensiometer ............................................................... 21
Figure 3-2 SEM of the cross-section and the surface of the opposite faces of nonporous AAO
membranes (Synkera Tech. Inc., 2011) ..................................................................................... 23
Figure 3-3 Details of XPM-10 miniature transducer(Measurement Specialties, 2012) ............. 24
Figure 3-4 Top view of the HCT’s bodies after epoxying porous stone ..................................... 25
Figure 3-5 PTFE body after machined with CNC ........................................................................ 26
Figure 3-6 Outer steel body ....................................................................................................... 26
Figure 3-7 Final shape of T-type (left) and S-type (right) bodies ............................................... 27
xiv
Figure 3-8 Sealing Types; (a) reinforced O-ring and (b) PTFE band ........................................... 28
Figure 3-9 Saturation Setup ...................................................................................................... 29
Figure 3-10 Schematic View of the Saturation Setup ................................................................ 29
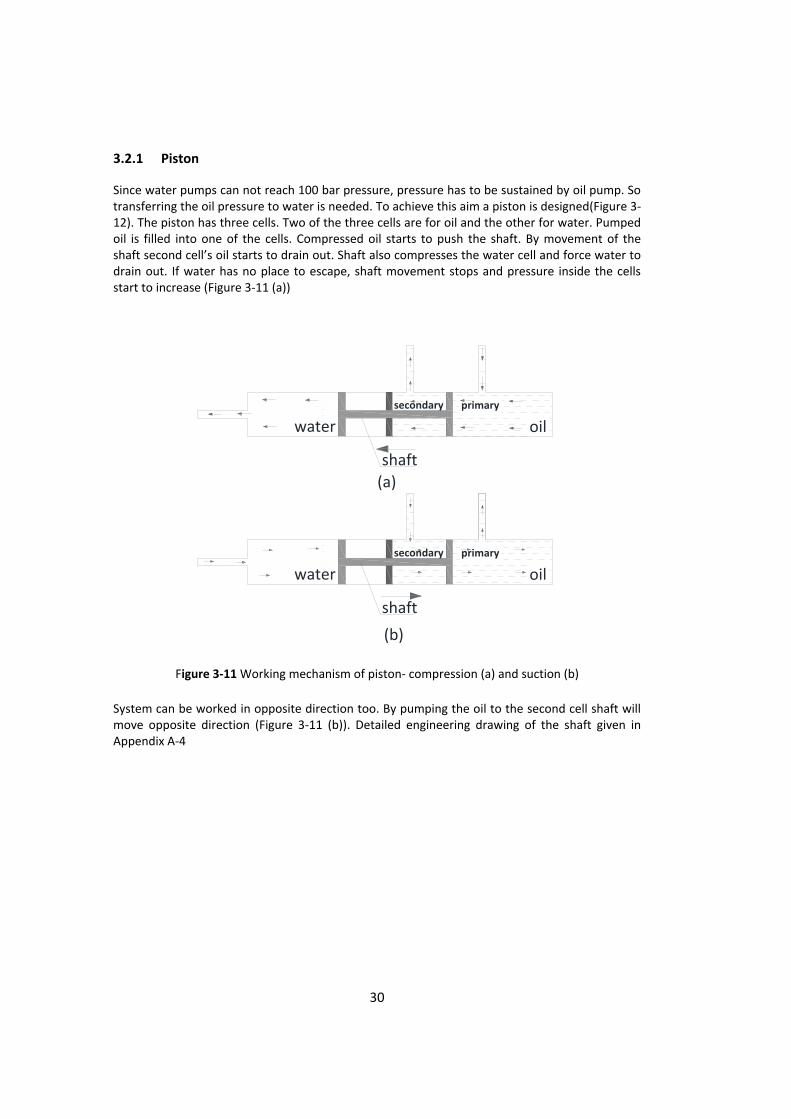
Figure 3-11 Working mechanism of piston- compression (a) and suction (b) .......................... 30
Figure 3-12 Piston of saturation setup ...................................................................................... 31
Figure 3-13 Oil pump photo and schematic drawing ................................................................ 32
Figure 3-14 Electrical panel board ............................................................................................. 33
Figure 3-15 Vacuum Pump ........................................................................................................ 34
Figure 3-16 HCT mounted on saturation chamber .................................................................... 35
Figure 3-17 Water deaeration tank ........................................................................................... 35
Figure 3-18 Connection valves .................................................................................................. 36
Figure 3-19 Saturation Setup .................................................................................................... 37
Figure 3-20 Data acquisition system ......................................................................................... 38
Figure 4-1 HCT bodies after lower porous stone is epoxied (S-2(left) and T-2 (right) HCT
bodies) ....................................................................................................................................... 39
Figure 4-2 Protected nano-membrane between filter papers (a) in type-1 protection and (b)
type-2 protection ...................................................................................................................... 40
Figure 4-3 Fixing apparatus for protected membrane .............................................................. 41
Figure 4-4 Corroded part of the saturation setup ..................................................................... 42
Figure 4-5 Saturation setup valve and opening setup ............................................................... 43
Figure 4-6 Water deaeration ..................................................................................................... 46
Figure 4-7 System vacuuming ................................................................................................... 46
Figure 4-8 System water filling .................................................................................................. 47
Figure 4-9 System pressurization .............................................................................................. 47
Figure 4-10 Soil Suction Measurement on Ankara clay ............................................................. 48
Figure 4-11 Silt specimen .......................................................................................................... 49
Figure 5-1 Designed HCTs .......................................................................................................... 51
Figure 5-2 Response time of two different porous interface during pressurization ................. 59
Figure 5-3 Response time of two different porous interface during unloading ........................ 60
Figure 5-4 Ideal suction versus time graph for HCT measurement ........................................... 60
Figure B-1 Trial #1 Suction versus time graph ........................................................................... 75
Figure B-2 Trial #2 Suction versus time graph ........................................................................... 75
Figure B-3 Trial #3 Suction versus time graph ........................................................................... 76
Figure B-4 Trial #4 Suction versus time graph ........................................................................... 76
Figure B-5 Trial #5 Suction versus time graph ........................................................................... 77
xv
Figure B-6 Trial #6 Suction versus time graph ........................................................................... 77
Figure B-7 Trial #7 Suction versus time graph ........................................................................... 78
Figure B-8 Trial #8 Suction versus time graph ........................................................................... 78
Figure B-9 Trial #9 Suction versus time graph ........................................................................... 79
Figure B-10 Trial #10 Suction versus time graph ....................................................................... 79
Figure B-11 Trial #11 Suction versus time graph ....................................................................... 80
Figure B-12 Trial #12 Suction versus time graph ....................................................................... 80
Figure B-13 Trial #13 Suction versus time graph ....................................................................... 81
Figure B-14 Trial #14 Suction versus time graph ....................................................................... 81
Figure B-15 Graph of “pd_I” response voltages versus given pressures and corresponding
tredline of calibration with triaxial setup .................................................................................. 82
Figure B-16 Graph of “pd_II” response voltages versus given pressures and corresponding
tredline of calibration with triaxial setup .................................................................................. 83
Figure B-17 Graph of “pd_I” response voltages versus given pressures and corresponding
tredline of calibration with calibration setup ............................................................................ 84
Figure B-18 Graph of “pd_II” response voltages versus given pressures and corresponding
treeline of calibration with calibration setup ............................................................................ 85
xvi
LIST OF TABLES
Table 2-1 Suction measurement techniques (Toker, 2002) ........................................................ 8
Table 2-2 Physical properties of porous ceramics (Soil Moisture Corp., 2008) ........................ 10
Table 2-3 High-capacity tensiometers developed by various authors including their
specifications used (Delage et al., 2008, Toll et al., 2012) ........................................................ 20
Table 3-1 Tensiometer designation symbols ............................................................................. 22
Table 3-2 Components of composite porous interfaces ........................................................... 22
Table 3-3 Specifications of Synkera nano-membranes ............................................................. 23
Table 3-4 Seal type vs. maximum sustainable saturation pressure .......................................... 28
Table 3-5 Oil Pump Specifications ............................................................................................. 31
Table 3-6 Vacuum Pump Specifications .................................................................................... 33
Table 3-7 Specifications of TESTBOX 1001 Data Acquisition System ........................................ 38
Table 5-1 Structural variables of HCT designs trials .................................................................. 52
Table 5-2 Saturation details of HCT design trials ...................................................................... 53
Table B-1 “pd_I” responses on given pressures on triaxial setup ............................................. 82
Table B-2 “pd_II” responses on given pressures on triaxial setup ............................................ 83
Table B-3 “pd_I” responses on given pressures on calibration setup ....................................... 84
Table B-4 “pd_II” responses on given pressures on calibration setup ...................................... 85

xvii


1
CHAPTER 1
1. INTRODUCTION
In today’s world every place in big cities can be interpreted as a valuable asset even though it is a geotechnically problematic site. So dealing with these kinds of problems become important. Solutions to modern geotechnical problems have to be based on 2 main criteria: safety and economy. Most of the solutions are based on two-phased model such as air-solid or water-solid. This is the model of fully saturated or fully dry soils. This assumption is widely used because it is easier to determine soil properties and it is a conservative assumption.
Although this assumption is widely accepted in most cases, it does not reflect the real condition. Most of the earth surface is covered by unsaturated soils which can be modeled as a three-phase medium (air, water and solid).Modeling a soil as unsaturated makes it possible for some problems to be understood more clearly, such as rain fall induced landslides or heaving on expansive soils. Moreover exploring the behavior of unsaturated soils may reduce total cost of structures as designers may wander farther away from conservative assumptions of saturated soil mechanics.
Soil suction is one of the most important variables of unsaturated soils to analyze and describe their behavior since it is related to many soil properties.
1.1 Research Statement and Significance
In unsaturated soils there are two stress variables. One of them is named as “net normal stress” and the other is “soil suction”. Whatever parameters that affect soil suction affect unsaturated soil behaviour. Also some studies show that suction has direct relationship between soil properties such as permeability (Fredlund et al., 1994) volume change behaviour (Zhan et al.,2007; Estabragh & Javadi,2012; Montanez, 2002; Tadepalli et al.,1992) or shear strength (Fredlund et al, 1995; Çokça & Tilgen, 2010). These properties related to geotechnical problems, including landslides, retaining wall and excavation stability, shrinkage or swelling of expansive soils, or flow related problems (Lu & Likos, 2004). So understanding and measuring soil suction is important in developing analysis and design methods that are more precise and realistic for
There are some methods that are used for measuring soil suction values. Most of these techniques are empirical or semi-empirical techniques that find suction values using relationship between soil suction and other soil parameters. Tensiometers are the only method of direct suction measurement.
Use of tensiometers is more reliable as it is eliminates error caused by empirical techniques. However this method has to be improved since it is able to measure suction values up to limited value.
In the last two decades, high capacity tensiometers (HCT) were invented and have been used by a handful of researchers all over the world. However, the high capacity of these devices is only relative to their conventional counterparts and is still no match for the indirect –empirical measurement techniques.
2
1.2 Scope and Aims of Thesis
In this study constructing first HCT of Turkey is aimed along with necessary support equipment. Also with improved saturation procedure and using nano-porous membrane with various configurations as porous interface increasing capacity of constructed HCT is planned. To have a final design with replaceable parts different sealing methods will be tried. To find most suitable configuration several HCTs will be designed.
Verifying the reliability of HCTs results will be compared with results of soil samples with known suction –water content relationship.
1.3 Outline of Thesis
The next chapter (2) is the “Literature Survey” chapter that gives brief theoretical information about the soil suction mechanism and continues with the researches subjected about HCTs up to today.
In chapter 3 equipment that is designed, built and used which includes tensiometer itself, its saturation setup and calibration setup is explained.
In “Procedure” chapter which is in chapter 4, detailed information about assembling and usage of tensiometer and its saturation setup is given. Moreover saturation procedure is explained in detail.
Chapter 5 is result chapter. All test results with different tensiometers and different saturation schemes are tabulated
In chapter 6 findings of the study is summarized and the study is concluded.
Finally appendices for engineering drawings of equipment components and suction measurement records of different trials are given.

3
CHAPTER 2
2. LITERATURE SURVEY
2.1 Tensile Strength of Water
Tensile strength is limit stress at which material ruptures under tensile force. Liquids such as water can carry tensile forces just like solid materials. The theoretical tensile strength of water at 25 C is approximately 1400 bar (Fisher, 1948) calculated from intermolecular forces. However the measured values of water tensile strength are much smaller than that value because of cavitation. Some physicists found tensile strength of water to be about 5MPa from experiments. (Chapman, 2001, Green et al., 1990) It was measured 27.7MPa with using Berthelot setup (1850) by Trevena (1987).
2.1.1 Surface Tension
Surface tension is result of intermolecular forces acting on a layer of molecules between water and air. This boundary is called contractile skin (Fredlund & Rahardjo, 1993).
Forces on a water molecule do not act equally on every side of it if it is in contact with air (Figure 2-1a). The force equilibrium is balanced by tensile force in the contractile skin. This force is called surface tension (Ts). Contractile skin is curved with concavity toward the larger pressure side.
Figure 2-1 Surface Tension at the air-water interface (a) Inter molecular forces on contractile skin and water (b) pressures and surface tension acting on a curved two dimensional surface
(Fredlund & Rahardjo, 1993)
In 2-D model, vertical force equilibrium (Figure 2-1b) on contractile skin is
(2.1)
where;

4
Ts : Surface tension of water
β : Contact angle of water and contact material
Rs : Radius of curvature
∆u : Pressure differences between two sides of the contractile skin
2.1.2 Cavitation
Cavitation is the formation of vapor nucleons from liquid when absolute pressure decreases below the vapor pressure (Lu & Likos, 2004). Under tension cavities (or bubbles) within tiny cracks or suspended in liquid become larger until “explosion” occurs. After continuous bonding of water is broken, it can no longer withstand tension.
Figure 2-2 Phase Diagram for Water (Marinho & Chandler, 1995)
In Figure 2-2 Path A1-A indicates the cavitation path. Decreasing the pressure to below the vapor pressure triggers the cavitation mechanism. Vapor bubbles do not form as soon as the vaporization curve is passed. Instead the liquid remains at a metastable state until cavitation occurs.
2.2 Soil Suction
Total soil suction is the soil pore water thermodynamic energy relative to free water’s reference potential (Lu & Likos, 2004). This energy can be formulated in terms of partial vapor pressure of water (Richards, 1965).
(2.2)

5
where
ψ : total suction (kPa)
R : universal gas constant (i.e. 8.310432: J/mol K)
T : absolute temperature (K)
vw0 : specific volume of water (m3/kg)
wv molecular mass of the water vapor (i.e. 18.016 kg/mol)
v : partial pressure of pore-water vapor (kPa)
v0 : saturation pressure of water vapor over a flat surface of water at the same pressure (kPa)
So the equation becomes;
(2.3)
Soil suction has two components namely matric suction (ua-uw) and osmotic suction (π ).
(2.4)
2.2.1 Matric Suction
Matric suction can be defined as a suction component that is developed as a result of interaction between soil solid and pore water. Any soil that has pores small enough to hold pore water against body forces has matric suction potential (Toker, 2002).
Matric suction can be formulated by the forces equilibrium at the contractile skin. Rearranging Equation 2.1 gives:
(2.5)
This is the equation of two dimensional contractile skin. For a three-dimensional surface Equation (2.5) becomes by using Young-Laplace Equation (1806)
(2.6)
where R1 and R2 are two orthogonal radii of curvature of the surface (Figure-2-3)

6
Figure 2-3 Surface tension on warped membrane (Fredlund & Rahardjo, 1993)
If radii of curvature of surface are same in all directions the equation becomes
(2.7)
In unsaturated soils is the difference between air pressure (ua) and water pressure (uw). So,
(2.8)
where (ua-uw).is matric suction. As matric suction decreases radius of curvature increases .If the air pressure and water pressure become equal to each other R goes to infinity meaning the surface of the contractile skin is flat.
2.2.2 Osmotic Suction
Osmotic suction is result of dissolved solutes in water. Dissolved solutes create concentration differences and that leads to osmosis in pore water. In geotechnical engineering problems important changes on osmotic suction are not seen (Nelson & Miller, 1992). Also its effect on total suction is small compared to matric suction (Figure 2-4). So most of the time osmotic suction is ignored while computing total suction.

7
Figure 2-4 Total Matric and osmotic suction measurements (Krahn & Fredlund, 1972)
2.3 Soil Moisture Characteristic Curve
Soil Moisture Characteristic (SMC) is the curve that reflects the relation between water content of soil and soil suction. SMC curve shape is related with many effects like grain size and pore size distribution of soil, proportion of other soil types.
Figure 2-5 SMC curve conceptual general behaviour model (McQueen & Miller, 1974)
In 1974 McQueen and Miller developed a model for SMC curves. He divided SMC curve into 3 parts (Figure 2-5). The state of lower water content and lower suction values is named as a “Tightly absorbed regime”. In this regime pore water molecules are held in place by hydrogen bonding. In the second part which is “Absorbed film regime” water molecules are kept together by Van der Waals attraction. There is a thin water layer around soil particles in these two

8
regimes. With increasing water content this thin layer becomes thicker. This is the phase named “Capillary regime” where water air interface start disappearing.
2.4 Soil Suction Measurements
Soil suction measurements are vital part of the unsaturated soil mechanics. There are many suction measurement techniques. Some of them are listed in Table 2-1 :
Table 2-1 Suction measurement techniques (Toker, 2002)
Technique (ASTM Code or Reference) Suction Type
Parameter Measured Range(bar)
Porous Plate (D2325-68) matric (i) uw=1 atm ua is controlled 0.1-1
Pressure Membrane ( D3152-72) matric (i) uw=1 atm ua is controlled 0-15
Axis Translation (Southwood,1980) matric (i) Positive uw, ua is controlled
0-15
Filter Paper ( D5298-94) matric (w) Contacting paper water content
0.3-1000
Filter Paper( D5298-94) total (r) Nearby paper water content
4-1000
Time Domain Reflectomery (Conciani et al. ,1996)
matric (w) Dielectric constant of device
0-5
Heat dissipation sensor matric (w) Thermal conductivity device
0-7
Gypsum Porous Block matric (w) Electrical conductivity device
0.1-30
Tensiometer matric Water tension 0-0.9
HCT matric Water tension 0-20
Squeezing (D4552-95) osmotic Ion concentration 0-350
Humidity Chamber total (i) Relative humidity of air 1-10000
Psychrometers total (r) Temperature at evaporation
0.5-700
Centrifuge (D425-88) matric (i) Capillarity 0-30
In Table 2-1 (i) indicate the measurement techniques that induce a chosen suction value. (w) means the techniques that correlate the suction value using relations between water content of the measurement device and suction value. Techniques with (r) are almost the same with techniques with (w) except that correlation is not water content and suction, it is between relative humidity of air.
As it can be seen from Table-2.1 tensiometer is the only measurement way to obtain suction value directly.

9
2.4.1 Tensiometers
Tensiometers are the instruments that measure the absolute suction values of soil directly. They consist of tree essential parts: high air entry (HAE) porous medium, pressure measurement device and body that encase other components with a water reservoir.
2.4.1.1 Porous Interface
Porous interface is a permeable material that connects water reservoir of tensiometer to soil specimen.
Before operation porous interface should be saturated since it transfers the suction to measurement device. As it can be seen on Figure 2-6, soil water tension is transferred to water reservoir through HAE material. In other words it can be imagined as a hydraulic bridge between soil and pressure measurement device
Figure 2-6 Enlarged Cross Section of Porous Cup-Porous Medium and surface (ASTM D3404,2004)
HAE stones are special porous materials that have micro TO NANO scale pores. Air entry refers to the pressure that is needed by air to pass through pores against air-water surface tension. Air-entry is the most important specification of the porous interface as far as tensiometers are concerned. High air entry” means greater than the gage vapor pressure of water (~99 kPa). Other relevant properties are hydraulic conductivity and pore diameter size. Porous ceramics are commonly used porous interfaces in design of tensiometers. Some of the porous ceramics and their specifications are listed in Table 2-2

10
Table 2-2 Physical properties of porous ceramics (Soil Moisture Corp., 2008)
Air Entry Value Bubbling Pressure
Approximate Porosity
Saturated Hydraulic
Conductivity
Maximum Pore Size
Flow Through 0.635 cm Plate
(bar) ( % vol.) (cm/sec) (µm) (ml/hr/cm2/bar)
0.5 BAR 0.48 to
0.62 50% 3.11 x 10⁻⁵ 6 180
HIGH FLOW
1BAR 1.31 to1.93 45% 8.6 x 10⁻⁶ 2.5 50
HIGH FLOW
1 BAR 1.38 to
2.07 34% 7.56 x 10⁻⁷ 1.7 5 STANDARD
FLOW
2 BAR 2.62 to
3.10 32% 6.30 x 10⁻⁷ 1.1 4.2
STANDARD
2 BAR 2.21 to
2.90 38% 6.93 x 10⁻⁷ 1.3 4.6
HIGH FLOW
3 BAR 3.17 to
4.82 34% 2.5 x 10⁻⁷ 0.7 1.6 STANDARD
FLOW
5 BAR
5.52 31% 1.21 x 10⁻⁷ 0.5 0.7 STANDARD FLOW
15 BAR
15.17 32% 2.59 X 10 -9 0.16 0.15 STANDARD FLOW
2.4.1.2 Conventional Tensiometers
Conventional tensiometers are used in agricultural engineering. By using it farmers can decide how much water is needed for crops. That information provides farmers to make more precise watering schedules.
These kinds of tensiometers have a high air entry (HAE) ceramic tip. It is usually deployed by pushing into the soil. For this purpose its tip is generally rounder. The ceramic tip is connected through a tube to the measurement device (Figure 2-7)

11
Figure 2-7 Schematic Drawing of Conventional Tensiometer (AgriDrip Co., 2012)
Conventional tensiometers can be divided into three groups according to their measurement techniques: manometer type, gauge type and transducer type (Figure 2-8). In manometer type tensiometer mercury filled reservoir is used as the measurement device. By suction pressure mercury rises on scaled tube. In gauge type, a vacuum gauge is used and values are read from it. It is the most common tensiometer type. In transducer type tensiometers pressure transducers are used as the pressure measurement device.
Figure 2-8 Typical Conventional Tensiometers (A. Ridley & Wray, 1996)
Suction measurement capacity of conventional tensiometers is limited to 99 kPa minus elevation difference between measurement device and porous interface atmosphere. Higher values cause cavitation.

12
2.4.2 High Capacity Tensiometers (HCT)
High capacity tensiometers (HCT) are instruments that enable to measure suction values higher than 1 atm which is the limit of conventional tensiometers. Just like their conventional predecessors HCTs mainly consist of three parts (measurement device, porous stone and tensiometer body).
Measurement device is the electrical part of tensiometer that converts pressure values into voltage. Stain gauges and pressure transducers can be used for this purpose. There are lots of types of commercially available transducers. But it is important to choose the transducer which satisfies the need of tensiometer. According to research up to today, small transducers are most commonly preferred since size of the transducer is the predominant factor in tensiometer size Accuracy, diaphragm’s position, electrical connection specifications and measurement range are also important.
Porous medium is key part of tensiometer design. Its saturation degree directly affects the tensiometer measurement. AEV of porous stone is limit air water pressure difference at which air enters the largest pores. According to this higher AEV make the tensiometer capacity larger. But that is not always advantageous because higher AEV means higher saturation pressure is required. Since saturation procedure is not an easy task, porous stones with larger AEV are not preferable. In practice porous ceramics with AEV of 3, 5 and 15 bars are commonly used.
Another part of the HCT is body. It is just a body that surrounds other parts of the tensiometer and sustains a volume for a water reservoir. Another job of body is to protect other parts from outer effects. Bodies of HCT usually are ma de of stainless steel. If the body is not stiff enough, it may deform under and thus transmit external stresses to the pressure measurement device.
Data acquisition systems can also be counted as a part of the tensiometer system. It is device which transfers incoming analog voltage values from measurement device to computer in digital form.
HCT working principle is same as the conventional ones. However in HCTs saturation procedure is most important issue. Cavitation occurs at air water interfaces. Aim of the saturation procedure is making water reservoir and porous stone air-free to prevent cavitation. For saturation procedure a pressurization setup and a vacuum pump is needed. These two machines does opposite works. Vacuum pump is used for sucking air from the saturation system .However pressurization setup is a system that is connected to the tensiometer and applies water pressure on the tensiometer
2.4.2.1 Cavitation in HCT
In HCTs main problem is cavitation. There are two types of cavitation: homogenous and heterogeneous. Heterogeneous cavitation, which is cavitation at a phase boundary, is the main interest of the tensiometer measurement (Marinho et al., 2008)
In Figure 2-9 heterogeneous cavitation mechanism on tensiometer is explained. Air is trapped on the tensiometer body because of imperfection of surface (Figure 2-9a).If the pressure of water is decreased, trapped gas volume start to enlarge to balance pressure inside and outside the crevice (Figure 2-9b). If decrease of the water pressure continues, trapped gas volume increases until critical contact angle is reached. After this point stability on contractile skin cannot be obtained and cavitation occurs (Figure 2-9c).

13
Figure 2-9 The crevice model of heterogeneous nucleation (Marinho et al., 2008)
It must be pointed that cavitation may occur not only on tensiometer body but also on porous material (Tarantino & Mongiovi, 2002; Tarantino, 2004) For this procedure high pressure has to be applied to dissolve the air in cavities. In some cases high pressure is not enough to dissolve air. On the contrary the pressure makes air more stable.(Figure 2-10).Cycles between pressurization and zero pressure or negative pressure are tried by researchers to reduce the cavitation risk (Marinho & de Souza Pinto, 1997).
Figure 2-10 Cavitation Nuclei (Marinho & de Souza Pinto, 1997)
Filling the voids of the porous medium with water is not an easy task. One of the key parameters for the saturation is the air entry value (AEV) of the porous medium. AEV is defined as the matric suction value that must be exceeded before bulk water is sucked out of the pores (Fredlund & Rahardjo, 1993). It also directly correlated with the largest continuous pore size of the porous medium
Another parameter is porosity. Porosity is the volume ratio of pore spaces to total volume. If porosity is too high, it probably has large pores which mean its tension holding capacity is small. If it is too low, saturation of porous stone becomes hard. Pore arrangement is also important. More regular pore pattern in microscopic scale makes saturation work easier and lessen cavitation probability

14
.
2.5 History of High Capacity Tensiometers
First HCT (Figure-2-11) was developed by Ridley and Burland (1993).Until then it was not thought the tensiometers could measure beyond 1 atm pressure. Ridley and Burland focused on cavitation mechanism on their research. To delay cavitation they reduced the water reservoir volume to minimize the probability of nucleation of air bubbles. They used a porous stone with AEV of 1500 kPa.. To saturate the tensiometer they pressurized it up to 3500 kPa which is the upper limit of pressure transducer used in HCT. After a couple hours, pressure was reduced to atmospheric level. About 1500 kPa suction is measured with this tensiometer. Later Ridley and Burland (1995) also used a diaphragm instrumented with strain gauges as the measurement devices.
Figure 2-11 The Imperial College Tensiometer (A. Ridley & Burland, 1993)
After Ridley and Burland, Guan and Fredlund (1997) developed a different tensiometer. (Figure 2-12) They used a pressure transducer with higher limit. Also they focused on saturation of porous stone. They used a cyclic pre-pressurization i.e. cycles between suction and pressurization. 6 cycles of pressure of 12000 kPa was applied and it was followed by vacuum of -85 kPa. The tensiometer was connected to a pressure plate equipment and its accuracy was tested on different soil types. Test showed HCT is successfully measure suction values. However only a maximum of 1250 kPa matric suction was measured
.
Figure 2-12 Saskatchewan suction probe (tensiometer) (Guan & Fredlund, 1997)

15
Between 1996 and 2004 several HCTs were designed in Massachusetts Institute of Technology (MIT) by Sjoblom (2000) and Toker (2002, 2007). Tensiometers with strain gauges did not satisfy the researchers because of poor resolution. HCT with pressure transducers gave more reliable results. Also researchers replaced the Soil Moisture Equipment Corporation porous ceramics with a different porous ceramics developed in Kochi University, Japan (Yanagisawa et al., 1994) . Kochi ceramic has smaller pore diameter (30-80µm) and slightly higher AEV (up to 22 bars) than the Soil Moisture Equipment Corporation ceramics. In addition, Kochi ceramics were easier to saturate, implying better inter-pore connectivity (Figure 2-13). With these Sjoblom (2000) reports highest suction measurement of 2200 kPa.
But it had some disadvantages. Kochi ceramic was brittle, so it could be cracked under sudden changes in pressure at the time of cavitation. So it could not be used as many times as the commercial SMC ceramics. Also since these ceramics were product of another research project that had ended a few years before their supply and AEV were neither reliable nor repeatable.
Figure 2-13 Behavior of two types of porous stone (Sjoblom, 2000)
Another change by Toker (2002) was that cooper ring seals were used instead of O-rings and epoxy since pressure transducers gave inaccurate results with o rings and extra inner stresses were occurred because of different thermal expansion coefficients of pressure transducer and epoxy (Figure 2-14).
Toker (2004) tried another porous medium named Vycor Porous Glass. It is a glass plate with 4nm average pore size and porosity of 0.28. With this material 2.4MPa suction value is measured before the glass shattered due to pressure difference between the reservoir and the outside.

16
Figure 2-14 MIT Tensiometer Version 6.1 (Toker, 2002)
Tarantino and Mongiovi (2003) developed a tensiometer similar to Imperial College Tensiometer. The only difference was that the new system was enabling the calibration in the negative range pressures of pore water. And this study showed that extrapolation of positive calibration curve to negative side cause 1-1.5% error. Tarantino (2004) designed a more detailed saturation procedure. Every step of saturation had its own checks. According to the researcher, such a procedure made suction probe measurements more trustable without needing any additional measurements. It starts with positioning the tensiometer with a porous stone of known retention curve in a saturation chamber. The chamber is pre-pressurized at 4Mpa for 24 hours. All pressure increments and corresponding tensiometer readings are recorded. Each tensiometer was expected to record same values. If any contradiction detected tensiometer was positioned on a dry sample to trigger cavitation. After removal from saturation setup, tensiometer is placed on free water. It must equilibrate for 1-2 hours. After equilibrium was reached porous stone is wiped with thumb and left to evaporate. Pressure reading can decrease up to air entry value of porous stone. Immediately after reaching that limit tensiometer is placed on free water again. And this procedure repeated twice. Allowable reading error was ±10 kPa. After this procedure tensiometer was ready for measurements. After the measurement; if cavitation occurred, reading on tensiometer must be around 100 kPa. If cavitation did not occur, tensiometer was placed on free water and measured value must be 0. If any of these prerequisite conditions were not satisfied, tensiometer was placed on a dry sample to trigger the cavitation. In his saturation apparatus he used pressurized nitrogen to supply continuous and stable pressure on water which was connected to tensiometers. As result of those experiments 2540 kPa was the highest suction value measured.

17
Figure 2-15 Schematic diagram of the mini suction probe (Meilani et al., 2002)
Another challenge in HCT measurement is to be able to sustain suctions greater than vapor pressure of water for prolonged durations. Meilani et al. (2002) developed a new HCT and mounted it to the triaxial apparatus (Figure 2-15). Differently they used porous ceramic with lower AEV. Since the entire HCT was submerged, strain gauge was used instead of pressure transducer. Finally 400 kPa and 200 kPa were measured for a period of 15 and 155 hours respectively
Ridley & Burland (2005) improved their first tensiometer (Ridley & Burland, 1993) Aim was to design a tensiometer for the field measurement.(Figure 2-16) It measured up to 90 kPa for a long period of time. The researchers concluded that the capacity of tensiometer could be increased by using higher pressure while saturation.
Figure 2-16 A suction Probe (Ridley & Burland, 2005)
Take & Bolton (2003) looked the issue from another perspective. They claimed that most of the suction measurements in laboratory did not exceed 400 kPa. Therefore in their opinion HCT with higher capacities were not needed for most of the cases. Based upon this idea they designed new tensiometers.
18
Figure 2-17 Design evaluation of tensiometer (Take & Bolton, 2003)
First they tried a model with interchangeable cap for a filter material .But this acrylic cap was cracked under pressure (Figure 2-17a). Interchangeable cap concept was removed. Porous disc was directly fixed onto the stainless steel body with epoxy. Even though below 100 kPa pressures could be measured, thin stainless steel body caused extra internal stresses while holding it with bare hand (Figure 2-17b). So they developed third tensiometer with ticker stainless steel body (Figure 2-17c). To minimizing the effects of extra stresses, a gap was left between sensor and body. This gap was filled with elastomer for absorbing the radial stresses. But irregularities occurred after injection of elastomer. Forth tensiometer was designed considering all these side effects. The researchers worked with Entran Devices Inc since that tensiometer was intended as a commercial one.
Figure 2-18 Chamber for the rotational method of initial saturation of porous filter element: (a) de-airing of water and evacuation of chamber; (b) saturation (Take & Bolton, 2003)
For saturation Take and Bolton (2003) argued that two-stage filter saturation process was needed. They defended their argument according to Boyle’s Law linking the pressure and

19
bubble’s pressure and Henry’s Law about solubility. Saturation process was started with placing the tensiometer laterally into vacuum chamber (Figure 2-18). In half of the chamber there was de-aired water. And under the vacuum chamber was rotated 90 degrees and tensiometer remaining under the water in vacuumed chamber at least 20 min. Next tensiometer was taken to another apparatus. In that device pressure at (900kpa) and suction at - (100kpa) was applied for 1 hour for each. But in the end saturation of did not satisfy the researchers. Then they designed another apparatus. They heated the new saturation chamber and tensiometer up to 60 degree Celsius for decreasing the initial saturation degree to zero. Tensiometer introduced with de-aired water under vacuum of -100 kPa at least 20 min after heating. After initial saturation vacuum was released and tensiometer was left submerged for further saturation under atmospheric pressure. At the end of the research the researchers concluded that poor saturation limited the measurement reliability.
Lourenço also tried to develop a commercial transducer (Lourenço et al., 2006). He designed the WF-DU tensiometer collaboration with Wykeham Farrance Limited and Durham University (Figure 2-19).
Figure 2-19 Schematic drawing of the WF-DU tensiometer (Lourenço, et al., 2006)
They used a ceramic pressure transducer as a measurement device. Unlike the preceding researches porous disc with 15 bars AEV was directly soldered the tensiometer surface by using spacers. The tensiometer first saturated under the vacuum from a dry condition and followed by pre-pressurization stage under 800 kPa for 48 or 72 hours. As a result of these experiments maximum 1271 kPa suction was measured.
To sum up from Ridley (1993) to today the researchers have designed many tensiometers. They have tried to change measurement devices saturation setups, its dimensions or porous stones (Table 2-3). But the story of HCTs appears to be far from finished.

20
Table 2-3 High-capacity tensiometers developed by various authors including their specifications used (Delage et al., 2008, Toll et al., 2012)

21
CHAPTER 3
3. EQUIPMENT
3.1 Tensiometers
During this study performance of several tensiometer designs have been investigated. During design step HCT dimensions were tried to be kept as small as possible.
Figure 3-1 Typical T type High Capacity Tensiometer
Different tensiometer designs are labeled in a systematic and straightforward manner. First character is either S or T indicating the tensiometer body is either stainless steel or steel/ polytetrafluoroethylene respectively.(Figure 3-1).Following two characters are designating the porous interface. For example SC1 tensiometer denotes the tensiometer design with steel body and Soil Moisture Equipment Corp (SME) porous ceramic having 15 bar AEV and 7.1mm thickness All designations are given in Table 3.1

22
Table 3-1 Tensiometer designation symbols
Abbreviations. Explanation:
TENSIOMETER BODIES
T PTFE BODY
S STEEL BODY
POROUS INTERFACE
C1 1st 15 bar Porous Ceramic of SME-(thickness:7.1mm)
C2 2nd 15 bar Porous Ceramic of SME-(thickness: 6.2 mm)
M1 elb+mb18+elb*
M2 elb+mb13+elb*
M3 elm+mb18+mb13+mb18+elm*
M4 *
W1 w+mb13+w*
W2 elm+mb18+w*
*see Table 3.2 for components
Table 3-2 Components of composite porous interfaces
Abbreviations. Explanation:
elb Porous Stone from ELE -no spesifacation
elm Porous Metal from ELE -no spesifacation
mb13 Synkera 13 nano-meter membrane
mb18 Synkera 18 nano-meter membrane
w Mesh wire of ASTM sieve #50
In this thesis several different porous stones are tested. All of them have different thicknesses and dimensions Since the membranes are square and impossible to cut, rest of the components (body, protective layers) had to be sized accordingly. So the porous stones were cut to a size slightly smaller than the membrane. For cutting procedure water-jet cutter is used. Water jet cutter is a machine that is used for cutting materials like marbles, granites or metals in micron sensitivity. The machine producing a high water pressure and, pressurize water is applied to surfaces from a nozzle. The machine is designed to cut and process the industrial parts. So placing the relatively small parts like porous stone with about 5cm diameter to the table of jet cutter and then cutting an 8mm square piece from it is not an easy task. The edges around the perimeter of one square face of each porous stone or metal was rounded with a grinding wheel to prevent stress concentrations on the membrane
Porous Interface
Main obstacle in front of the progress in HCT technology is to find suitable porous interface. By using the suitable one and applying effective saturation step to it, capacity of tensiometers can theoretically double the current HCTs capacity

23
3.1.1.1 Soil Moisture Equipment (SME) Corporation Porous Ceramics.
These ceramics are traditionally used in HCT designs. It has 2.59 x 10⁻¹¹ m/s hydraulic conductivity and 15 bar AEV pressure. Its pore diameter is 0.16µm. Tensiometer with this porous stone is as a control group tensiometer since there are plenty of studies with SME porous ceramics
3.1.1.2 Synkera Ceramic Membranes
Perfect porous material have to have high AEVs and have smooth pore pattern. Based on this information, “Synkera Ceramic Membrane” is used. It is a thin membrane that has pores in nano-scale. Two different nano-membranes are obtained, with manufacturer’s designations of “SM-18-50-10 X 10” and “SM-13-50-10 X 10” (Table 3-2).
Table 3-3 Specifications of Synkera nano-membranes
Name Pore Size Thickness Porosity
SM-18-50-10 X 10 18±3 nm 51 µm %10
SM-13-50-10 X 10 13±2 nm 51 µm %9
These membranes are made of Anodic Aluminum Oxide (AAO) which is a self-organized nanostructured material containing a high density of uniform cylindrical pores. These pores are aligned vertical to the material’s surface area (Figure 3-2) (Synkera Tech. Inc., 2011)
One expected disadvantage is strength given that these membranes are not only very thin but also exhibit the brittleness of ceramics
Figure 3-2 SEM of the cross-section and the surface of the opposite faces of nonporous AAO membranes (Synkera Tech. Inc., 2011)
3.1.1.3 Protective Layers
As the membrane is so thin and so brittle it has to be protected. So it is placed between 2 highly permeable porous interfaces. Those porous interfaces protect the membrane from the pressure changes by blocking the deformations of it. Also they prevent the membrane to be damaged by direct contact with soil sample.

24
For this purpose different protective porous interfaces are used. Both of them are products of ELE® Int. . One of them is a metal porous medium that part of Shear Box Set. There is no given specification for this material .But permeability of it is tested simply by pouring water on it. Water was absorbed the stone rapidly and that shows it has high permeability and low air entry value. The other porous stone is a part of Triaxial Setup of ELE®. In its catalogue permeability of water is given in the order of 2 x 10⁻⁸ m/s (ELE Int., 2012).As a protective layer a wire mesh of ASTM #50 sieve is also used. It is chosen since it is relatively thinner and have larger openings compared with ELE® porous interfaces. It is also prevent breaking of membranes caused by excessive deformations.
Protective layers have stiff surfaces that can be damage nano-scaled ceramic membrane if it is in direct contact with them. To prevent this effect, membranes are placed between two filter paper. It is relatively soft material that can absorb stress concentration and distribute it to surface more equally.
3.1.2 Pressure Transducer
For pressure/tension measurement XPM-10 miniature pressure transducer is used(Figure 3-3). Its measurement capacity is up to 100 bars. It is made of stainless steel.
This model is chosen because its dimensions are small. (total length is 21.5mm) and it has good accuracy. (±0.25% of the total capacity). Also its shape is an important factor. For our study transducer must have a flange on which tensiometer body is mounted. Also its diaphragm should not be embedded into the transducer. XPM-10 satisfies all needs of the study.
Its detailed technical data sheet is given in Appendix A1
Figure 3-3 Details of XPM-10 miniature transducer(Measurement Specialties, 2012)
3.1.3 Tensiometer Body
Tensiometer’s body is built with threads for pressure transducer to use it with different bodies since pressure transducer is the most expensive part of the HCT. On the top they have hole for

25
porous stone (11.5 mm X 11.5 mm and 8 mm height). It is 1.75mm larger than the porous stone which is 8.0 mm x 8.0 mm. That gap is filled with epoxy (Figure 3-4). Under that hole there is a water reservoir (6mm diameter and 1mm height) under. Porous stone hole is designed with rounded corners, because epoxying sharp edges is difficult. Water reservoir is connected to pressure transducer by a tiny opening (1mm diameter and 1mm height). Also the circular form of bodies is cut flat on two sides to be able to hold tensiometer with a spanner. Dimensions are almost same for all designed transducers. The only difference in dimensions is the depth of porous stone hole, which is adjusted according to porous interface thickness. Detailed engineering drawings are given in Appendix A2 and Appendix A3.
Two different HCT bodies are designed in this research .Both designs fit the same geometry
described above and the only main difference between the two is material.
Figure 3-4 Top view of the HCT’s bodies after epoxying porous stone
3.1.3.1 S –Type Bodies
S-type tensiometers are made of stainless steel. Since 3 different porous materials is used, there is three different bod S-type bodies. These bodies have 1mm depth and 6mm diameter cylindrical water reservoir. This part is connected to the transducer through a hole with dimensions of 1mm depth and 1mm diameter. For screwing the pressure transducer, inside of the steel body has. It is M10 X 1 threads (1mm thread and 10mm diameter of screw). The transducer hole is 14mm deep, which is a dimension that minimizes water reservoir volume when transducer is sealed by reinforced O-ring (see section 3.1.4.2 for more details on seals.)
3.1.3.2 T –Type Bodies
T-type tensiometers are made of two different materials. Inside of the body’s material is polytetrafluoroethylene (PTFE). Polytetrafluoroethylene is a fluorocarbon-based polymer. It is a hydrophobic polymer that is repelled from water molecules. It has also low friction against any soils. Its melting point is 330°C, density is 2200 kg/m3 and thermal expansion coefficient is 135 x 10−6 K−1 which is given by manufacturer. Inner PTFE body is constructed from PTFE rod by CNC machine (Figure 3-5).

26
PTFE material is chosen for sustaining better sealing between body and transducer. But PTFE is not used as single material, because it can be deformed by internal pressure during saturation p. It is surrounded by a second body which is made of steel and prevents deformation of inner PTFE body.
Figure 3-5 PTFE body after machined with CNC
Inside of outer body is also threaded. It has also two holes for fixing screws (Figure 3-6) Outer steel body is screwed on to inner PTFE body and fixed with two screws and these two pieces form PTFE /steel composite body of T-type HCTs.
Figure 3-6 Outer steel body
Initially, all HCT tensiometer bodies had the same height. (Figure 3-7) Three of them are steel others are PTFE/steel bodies which all of them has 8mm depth porous stone pocket. Due to different porous stone thicknesses, each body is cut to the precise height at the end

27
Figure 3-7 Final shape of T-type (left) and S-type (right) bodies
3.1.4 Sealing Types
3.1.4.1 Epoxies
Epoxies are used for affixing the porous stone to tensiometers body. Long working time (i.e. pot life), fluidity, impermeability and high strength are the required specifications of epoxies in this research.
For sealing porous medium, two different epoxies; Bison Epoxy Metal Adhesive and Wiscon TK-7000; are tested. These tests are performed between unused porous stones and a piece of stainless steel. Epoxies are too viscous to apply easily between porous medium and tensiometer bodies. So the idea of mixing epoxy with water was experimented. After 24 hours of applying diluted epoxies Bison Epoxy Metal Adhesive was found to bond more rigidly than Wiscon’s Epoxy. But in the end this idea is abandoned and Bison epoxy is used. Bison epoxy has 45 minute pot life. Its hardening time is about 10 hours whereas it gains full strength after 24 hours
3.1.4.2 Back Seals
Seals between pressure transducers and tensiometers bodies are named as a back seals. In this research many different back seals are used:
1- .For sealing the pressure transducers to S-type bodies reinforced O-rings- are used (Figure 3-8(a)). They are similar to regular O-rings except they are confined inside a steel washer. They are designed for high pressures. O ring is placed on pressure transducers and they are squeezed between pressure transducer and tensiometer body after screwing it.
2- The idea behind having polymer body is to establish seal on the transducer’s threads (O-rings seal at the bottom of the transducer), thus minimising the reservoir volume and crevices on the threads. To sustain this kind of a sealing, polymer’s threads are processed more tightly than transducer’s threads. So polymer threads and transducer’s ones do not meet each other exactly.. Instead, the transducer tensiometer opens its own threads by yielding the polymer as torque is applied. Main idea is sealing transducer to body without using any additional seals. .Same technique is applied outside of the PTFE body to screw steel body on
3- Another back seal is using PTFE band (Figure 3-8(b)). Such bands are widely used in plumbing against leakage. Threads of pressure transducer are wrapped with this band to prevent leakage.

28
4- Lastly liquid gasket of Sista® is used. As its name implies it is a kind of liquid silicon. It is also used to stop leakage in waterworks. It is smeared on the threads of both pressure transducer and tensiometer body. The hardening time of the liquid gasket is not given by the manufacturer, but by testing 24 hours is found to be enough for gaining its full strength.
Figure 3-8 Sealing Types; (a) reinforced O-ring and (b) PTFE band
All sealing and corresponding maximum sustainable saturation pressures are given in Table 3-4.
Table 3-4 Seal type vs. maximum sustainable saturation pressure
Seal Type Maximum Sustainable saturation pressure (bar)
O-ring 80+
T-type bodies without additional sealing 10
PTFE band 40
Liquid gasket 30
3.2 Saturation Setup
Saturation setup (Figure 3-9) is designed to apply vacuum on system and then a 100 bar pressure to the water inside two saturation chambers for 24 hours
All hydraulic systems for large pressure are designed for oil circulating systems. Those systems are not suitable for the water circulating ones. Because parts of systems are made of steel, circulating water causes those parts to get rust.

29
Figure 3-9 Saturation Setup
So system should be noncorrodible system. Noncorrodible materials which are used in hydraulic systems are brass or stainless steel. Brass parts are not suitable since it has low strength; there is no brass equipment that holds 100 bar pressure. Stainless steel parts are used in our systems. But these are also rare piece of equipment, because it is unusual to supply 100 bar pressure with water (as an example municipal water pressure is about 5bar).
The saturation system has five main components: oil pump, piston, vacuum pump, saturation chamber and connection water deaeration tank (Figure 3-10)
Figure 3-10 Schematic View of the Saturation Setup
oil-pump
piston
water oil
vacuum-pump
path #2
path #1
saturation chamber
valve
water trap
(section 3.2.3)
(section 3.2.1)
(section3.2.5)
(section 3.2.2)
deaerationtank
(section 3.2.4)
30
3.2.1 Piston
Since water pumps can not reach 100 bar pressure, pressure has to be sustained by oil pump. So transferring the oil pressure to water is needed. To achieve this aim a piston is designed(Figure 3-12). The piston has three cells. Two of the three cells are for oil and the other for water. Pumped oil is filled into one of the cells. Compressed oil starts to push the shaft. By movement of the shaft second cell’s oil starts to drain out. Shaft also compresses the water cell and force water to drain out. If water has no place to escape, shaft movement stops and pressure inside the cells start to increase (Figure 3-11 (a))
Figure 3-11 Working mechanism of piston- compression (a) and suction (b)
System can be worked in opposite direction too. By pumping the oil to the second cell shaft will move opposite direction (Figure 3-11 (b)). Detailed engineering drawing of the shaft given in Appendix A-4
water oil
shaft
water oil
shaft
(a)
(b)
primarysecondary
primarysecondary
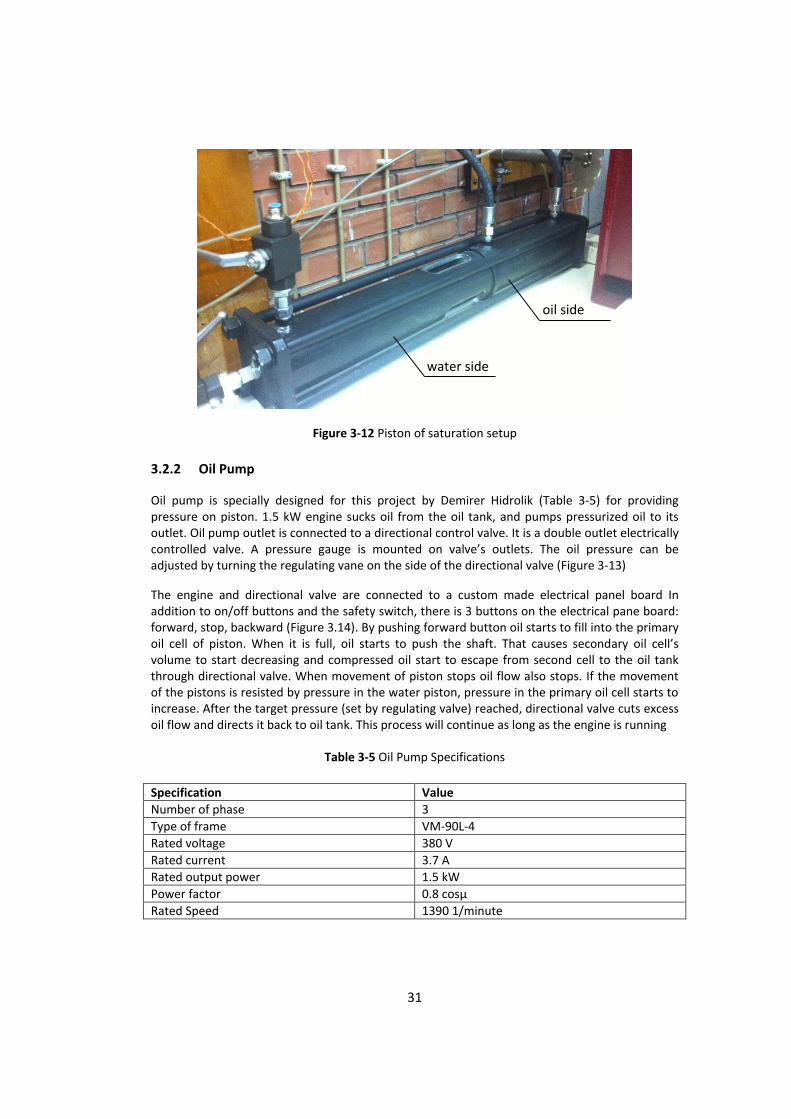
31
Figure 3-12 Piston of saturation setup
3.2.2 Oil Pump
Oil pump is specially designed for this project by Demirer Hidrolik (Table 3-5) for providing pressure on piston. 1.5 kW engine sucks oil from the oil tank, and pumps pressurized oil to its outlet. Oil pump outlet is connected to a directional control valve. It is a double outlet electrically controlled valve. A pressure gauge is mounted on valve’s outlets. The oil pressure can be adjusted by turning the regulating vane on the side of the directional valve (Figure 3-13)
The engine and directional valve are connected to a custom made electrical panel board In addition to on/off buttons and the safety switch, there is 3 buttons on the electrical pane board: forward, stop, backward (Figure 3.14). By pushing forward button oil starts to fill into the primary oil cell of piston. When it is full, oil starts to push the shaft. That causes secondary oil cell’s volume to start decreasing and compressed oil start to escape from second cell to the oil tank through directional valve. When movement of piston stops oil flow also stops. If the movement of the pistons is resisted by pressure in the water piston, pressure in the primary oil cell starts to increase. After the target pressure (set by regulating valve) reached, directional valve cuts excess oil flow and directs it back to oil tank. This process will continue as long as the engine is running
Table 3-5 Oil Pump Specifications
Specification Value
Number of phase 3
Type of frame VM-90L-4
Rated voltage 380 V
Rated current 3.7 A
Rated output power 1.5 kW
Power factor 0.8 cosµ
Rated Speed 1390 1/minute
water side
oil side

32
Figure 3-13 Oil pump photo and schematic drawing

33
Figure 3-14 Electrical panel board
3.2.3 Vacuum Pump
Vacuum pump (Figure 3-15) used in this study is a rotary vane vacuum pump of “Riwak Vakum”. It is specifications are listed in Table 3-6. It has a vacuum regulator and dial gage for more precise vacuum applications. Water traps are used on vacuum lines to prevent water from getting into the vacuum pump.
Table 3-6 Vacuum Pump Specifications
Specification Unit Value
Discharge Capacity m3/hour 28
Effective Capacity m3/hour 25
Final Absolute Pressure mbar 0.3
Engine Power V, Hz, kW 220, 50, 0.75
Suction Inlet Diameter inch 1
Pressure Inlet Diameter inch 1
Engine Rotation Speed rpm 1450

34
Figure 3-15 Vacuum Pump
3.2.4 Saturation Chamber
Saturation chambers are designed for connecting tensiometer to saturation setup. Each chamber consists of upper plate, lower plate and 4 pieces of screws
Upper plate (Figure 3-16) maintains the connection to the pipes coming from saturation setup. An opening is drilled with -4 threads in the middle of it to connect to 1/4’’ nipple. Inside of the plate has reservoir with 20 mm diameter and 3.5 mm height. Outside the reservoir there is a recess of 1 mm depth for a tensiometer body alignment. Since HCT surface is directly contacts with upper plate and water in reservoir has high pressures during saturation process, an O-ring is placed in upper plate. O-ring housing is 1.0 mm x 1.0 mm annular section. Also there are 4 holes for connecting the upper and lower plates to each other. These holes do not have threads; screws pass through freely.

35
Figure 3-16 HCT mounted on saturation chamber
3.2.5 Water Deaeration Tank
Water deaeration tank (Figure 3-18) is an air tight Plexiglas tank used for storing water. It has 2 valves. Top valve is used for connecting the suction pump. Lower pump is the outlet of stored water. The tank is designed to accommodate a magnetic stirrer underneath, which helps the deaeration process.
Figure 3-17 Water deaeration tank
lower plate
upper plate
tensiometer

36
3.2.6 Connection Parts and Valves
The saturation procedure is not a static procedure. Vacuuming and pressurizing to entire system or only one saturation chamber are examples of the variations. A four valve junction is designed to connection of saturation system parts (Figure 3-18). These valves are stainless steel spherical vanes. Two of four valves are connected to two different saturation chambers meaning that two HCTs can be saturated at the same time with the same procedure of saturation. An other valve connects to the deaeration tank. And the last one connects to the piston. Besides these valves fifth spherical valve is placed on the upper side of the piston to be used when filling the piston.
Other than the valves connection pipes are used between valves and other saturation equipment’s .These parts are also made of stainless steel. All the connections have 1/4 inch diameter openings.
Connections that do not get pressurized (vacuum, water refill, etc.) are made of flexible plastic tubing
Figure 3-18 Connection valves
3.3 Calibration Setup
For calibrating pressure transducers at pressures up to 10 MPa, a calibration setup is designed (Figure 3-19). Its working principle is based on Pascal Law (i.e. principle of transmission of fluid-pressure). There is a piston rod with a diameter of 5mm which is used for pressurizing the system. Top of the rod is designed for placing weights easily. To sustain impermeability, sealing ring is used between rod and shaft. But using sealing ring causes an extra friction forces that

37
affects the total pressure applied to system. To overcome this problem piston is rotated in its axis. That makes friction forces directions lateral and horizontal friction forces zero. This design enables to measure exact pressures caused by placed weights.
Figure 3-19 Saturation Setup
Increasing weights on piston causes compressing of oil and gases, as well as expansion of pipes and the system. These effects lead the piston to decrease from its initial position when weight and pressure is increased. To bring it back to its initial position a small pump is placed in system . By rotating the pump arm piston rises back to its initial position. If piston rises too much, relief valve is opened, and piston falls.
In this system there are 3 of 1kg ,3 of 2kg 2 of 4kg and 1 of 5kg weights. With total 22kg weights the system can be pressurized up to 112 bar.
relief valve
weight
pump arm
shaft
Transducer
screw hole

38
3.4 Data Acquisition System and Software
To transfer the analog signals of pressure transducers to the digital computer TESTBOX 1001 Data Acquisition System is used. Its specifications are given in Table 3-8
Table 3-7 Specifications of TESTBOX 1001 Data Acquisition System
Resolution: 16 bit / /65536 steps / 0,000305 V precision*
No of Channels: 8 channels
Working Temperature: 10 ° C-35 °C - Recommended 25 ° C
Sampling Rate: 8 samples/second
Measurement Range: From ±10 mV to 10 V
Channel Gains: 1/150/247/396/494/643/740/890 separately set for each channel**
Excitation Voltage: 5V/10V separately set for each channel***
Sensor Connector: DSUB9
* : equivalent to 0.75kPa for XPM10 transducer
** : set to 1for XPM10 transducer
*** : set to 10V for XPM10 transducer
TestLab Basic General Purpose Quasi-Static Data Acquisition Software is used for the logging, acquiring of data which is transferred by TESTBOX 1001
Figure 3-20 Data acquisition system

39
CHAPTER 4
4. PROCEDURES
4.1 Tensiometer Assembly
The water reservoir of a tensiometer must be isolated from the outside, except through the porous interface. This isolation is achieved by various sealing materials, as described in section 3.1.4. Different procedures are followed for different porous interface. For precise application of epoxy on various components a needle whose tip had been flattened (to make a miniature spatula) was used.
4.1.1 1-Layered Porous Stone Sealing
1. Place porous stone in the middle of the hole with tweezers. The distance between sides of the hole and stone is only 1.75 mm. (Figure 4-4)
2. Put some epoxy around the perimeter of the bottom of the square hole.
3. Wait for the epoxy to harden.
4. Fill all gaps with epoxy using flattened needle. Precise work must be done since voids due to poor filling can cause early cavitation.
4.1.2 2-Layered Porous Stone Sealing
1. Round edges of porous stones with lathe for protecting membrane from sharp edges.
2. Cut two filter papers square shaped with a side of 9mm,9.5mm (type-1 protection) or 10mm (type-2 protection)
3. Cut corners of these two square filter papers
4. Put a nano-porous membrane (10 mm x 10 mm) between filter papers to protect nano-porous membrane from porous stones (Figure 4-5).
Figure 4-1 HCT bodies after lower porous stone is epoxied (S-2(left) and T-2 (right) HCT bodies)

40
5. Glue rubbers to end of tweezers for holding protected membrane without giving damage
6. Put one side of protected membrane to epoxy. Epoxy width should be 1mm -1.5mm long to cover the edges of filter papers and nano-porous membrane juncture.
7. Hold protected and one sided epoxied nano membrane with modified tweezers and squeeze and fix it by a clamp (Figure 4-3)
.
Figure 4-2 Protected nano-membrane between filter papers (a) in type-1 protection and (b) type-2 protection
8. Spread epoxy to remaining three side of protected nano-membrane with the modified needle. Make sure all sides are epoxied continuously (Figure 4-2).
9. Take excess epoxy with clean spatula.
10. Leave protected nano-membrane for hardening about 24 hours while it is held by tweezers (Figure 4-6). During this time the small amount of epoxy that bonds the lower stone in place also hardens.
11. Epoxy remaining gap between the body and the lower porous stone.
12. Put protected nano membrane over porous stone inside the body.
13. Put upper porous stone over protected nano-membrane
14. Epoxy sides of second porous stone while holding it in place with a thin rod.
15. To avoid trapped air inside the epoxy, place it with mostly up and down motions of the needle.
16. Clean surface of tensiometer with a spatula and paper towel.
17. Put a weight on the stone to prevent uplifting
18. Let it harden for a day.

41
Figure 4-3 Fixing apparatus for protected membrane
4.1.3 Back Sealing
Another sealing point is between pressure transducer and HCT body. For PTFE/steel bodies that connection is sustained by body’s itself. It is explained in section 3.1.4.2.
To stop leakage two solutions are tried in PTFE bodies. First one is wrapping tensiometer with PTFE strip. After 4 cycles around the pressure transducer, it is screwed to the body. Other solution is liquid gasket. It is applied inside wall of the PTFE/steel bodies. After screwed, it is waited to harden for a day.
For steel bodies a O-rings with steel protection ring is used. It is screwed on pressure transducer before connecting transducer to bodies.
4.1.4 Front Sealing
PTFE/steel bodies have another leakage problem between inner PTFE body and outer steel body. To resolve that problem, a groove is opened in 1.5 mm depth and 1 .5 mm width by a lathe. This groove is on the surface of PTFE/steel body. Half of the pocket’s width is in inner body, the other half of it is in outer body. After spinning pocket is filled with epoxy. Excess epoxy is cleared with a paper towel and a spatula. Epoxy is left to harden for a day. Final shape can be seen on Figure 4-3.
4.2 Initial Checks
4.2.1 Stability of the Oil Pump
Since it is a new machine, it had to be tried before using in experiments. So 19kg # 37 motor oil is poured on oil tank and the pump runs for 24 hours at 100 bar with closed valve which is between

42
piston and pipe junction. No problem is recorded. Only heat increase in oil tank is observed. It is a normal situation for engines having long working period. For a precaution cables connecting with oil tank is lifted up.
4.2.2 Corrosion and Water Infiltration Check
Corrosion problem is an important issue for this study. Piston’s inside walls are covered by chromium plating. That makes piston corrosion proof and also it decrease friction coefficient between piston and shaft’s rubber. But it is a close system, there is no way to control inside of piston if it is corroded or not. So another method is used. Piston is filled with water and it is fully poured. It is left empty for one day. Next it is filled with water. And the water is pumped out to a glass container. If it is corroded, there will be a colour change in water. But no colour change is observed.
Figure 4-4 Corroded part of the saturation setup
After that control other connection parts are controlled by filling with water and emptied. Valves are made of stainless steel but, connection pipes, gaskets and sleeves are steel.24 hours later all connection parts are corroded (Figure 4-4). They are changed with stainless steel parts. Same procedure is applied to stainless steel parts and saturation chamber. No corroded area is observed.
Corrosion check also make possible to control if there is a leakage or not. No leakage area is observed on connections, pistons and saturation chamber. It is important to fit tensiometer to its exact place for avoiding leakage. Otherwise leakage occurs and pressurized water damages O-rings.
4.2.3 Data Acquisition and Software
Recording test data procedure is as follows:
1. Connect pressure transducer to TESTBOX 1001 System

43
2. Turn switches to 10 V and “off “ position for all gains
3. Run TestLab Basic General Purpose Quasi-Static Data Acquisition Software
4. Select time period for data recording
5. Select calibration file and open it.
6. Click on the calibration data and click run button.
7. Click recording data
8. At the end of the test click on “export data to excel”
4.2.4 Calibration for Lower Pressures
Calibration of pressure transducer is made by Triaxial Setup’s flow instrument. There is an extra valve between triaxial setup and saturation setup for taking air from the pipes to outside and for connecting two different systems.
Calibration procedure is done as follows:
Figure 4-5 Saturation setup valve and opening setup
1. Screw pressure transducer to one of the tensiometer body which has no porous stone on
2. Connect pressure transducer to TESTBOX 1001 Data Acquisition System
3. Turn switches to 10 V and “off “ position for all gains
4. Mount tensiometer body to saturation chamber
5. Fill system with water.(see section 4.3.1)
6. Connect saturation chamber to OUTLET-1
7. Open computer and start “Quasi-Static Data Acquisition Software ”
oil-pump
piston
water oil
vacuum-pump
path #2
path #1
saturation chamber
valve
water trap
deaerationtank
(section 3.2.4)
1
2
3
7
8
9
4
56

44
8. Read a voltage as an initial value
9. Put triaxial setup’s pipe to OUTLET-6
10. Connect water reservoir to OUTLET-2
11. Run triaxial setup and fill pipes up to VALVE-6.
12. Open triaxial setup valve to atmosphere and after seeing water flow it is closed again.
13. Close VALVE 3 for avoiding from errors due to movement of shaft.
14. Adjust triaxial setup to pump initial 200 kPa.
15. Read voltage from software
16. Increase pressure up to 1300 kPa which is the capacity of Triaxial Setup and read corresponding voltage values.
17. Draw voltage values versus applied pressures diagram and draw a trend line.
18. Find trend line formula as a calibration
Calibration procedure is applied both of the pressure transducer separately.
4.2.5 Calibration for Higher Pressures
Calibration is also made with newly designed calibration setup (see section 3.3).Pressure transducers are calibrated up to 100 bar with this setup. Calibration is done as follows:
1. Put reinforced O-ring on pressure transducer.
2. Connect pressure transducer to computer and start software
3. Mount pressure transducer to its screw socket
4. Turn “pump arm” while watching piston height. After piston rises by 5-10 mm, stop pumping
5. Spin the shaft from its lower point not to apply additional bending moments since it is a thin rod.
6. Read corresponding voltage values from computer while shaft is turning.
7. Place 1 kg weight and spin the shaft, again holding from lower part, not from the weights.
8. Read voltage values while shaft is spinning
9. Repeat step 7 and 8 until calculated pressure value reach slightly less than 100 bars. While placing weights it is essential to control shaft position. If it falls from its original position turn pump arm and raise it again. It is observed that approximately after every 4kg increment adjusting the shaft position is needed.
10. After reaching 100 bar, remove weights one by one and record voltage values.

45
11. Control shaft original position since it will rise during unloading step. By opening relief valve slowly shaft starts to fall again. After original position is reached, close valve. By observation removing every 4kg needs adjusting of the shaft height during unloading.
4.3 Saturation Procedure
4.3.1 System Water Filling
1. To pressurize saturation chamber, filling inside of piston is needed. This is one time procedure. It is not needed to be repeated in every trial. The procedure is as follows:
2. Initially VALVE 1, 2 and 4 are closed, VALVE 3, 4, 5, 7, 8 and 9 are opened.
3. Connect pipe’s one side to OUTLET 6 and outer side to OUTLET 8
4. Pour about 2lt water to water deaeration tank.
5. Plug vacuum pump pipe to OUTLET 9 and run for 45 minute.
6. Close VALVE 9 and unattach pipe from OUTLET 9.
7. Connect vacuum pump pipe to OUTLET 7 and run it for about 15 minute to vacuum inside of system.
8. Meanwhile open slowly VALVE 9 to let becoming atmospheric pressure on water deaeration tank’s water.
9. Open VALVE 4 while vacuum pump is still running
10. After observing water coming on the water trap which is connected to vacuum pump, close VALVE 7 immediately.
11. Close VALVE 3
4.3.2 System Vacuuming and Pressurizing
Saturation procedure is needed to saturate porous interfaces. Main aim is filling deaired water into to deaired saturation system. Procedure is given as follows:
1. Initially VALVE 1,2,3, 5, 8 and 9 are open VALVE 4, 6,7 is closed
2. Mount HCTs to OUTLET 1 and OUTLET 2.
3. Take piston back as much as possible.
4. Fill water deaeration tank with enough distilled water
5. Plug one tip of pipe to OUTLET 6 another tip to OUTLET 8
6. Plug Vacuum Pump to OUTLET 9
7. Run vacuum pump until bubbling in water is disappeared .This lasts about 45 minute. (Figure 4-6)

46
Figure 4-6 Water deaeration
8. Close OUTLET 9 and unattach vacuum pump
9. Open OUTLET 9 slowly to prevent air penetrating inside of water
10. Plug Vacuum Pump to OUTLET 5
11. Run software and start recording data.
12. Start Vacuum Pump and run it about 30 -90 minutes depends on observing negative pressures on the computer screen. (Figure 4-7)
Figure 4-7 System vacuuming
13. Turn valve to close VALVE5 and open VALVE 6 and wait water to fill inside of system as a result of pressure difference. (Figure 4-8)

47
Figure 4-8 System water filling
14. Unattach vacuum pump. Do not turn if the vacuum pump before unattaching it from the system, hence opening it to atmosphere
15. Start the oil pump
16. Push “FORWARD” button to give a command to the piston and adjust pressure to about 5 bar
17. Open VALVE 4.
18. Increase the pressure slowly by turning adjustment screw of directional valve. It is important observing HCTs if there is leakage or not while increasing pressure. If leakage is observed, pressure increasing must be stopped. (Figure 4-9)
19. Run system for a day
Figure 4-9 System pressurization

48
4.4 HCT Capacity Trials
To test HCT capacities, HCTs are opened to atmospheric pressure after saturation procedure. Procedure of trials as follows:
1. After saturation procedure pressure is decreased to zero slowly.
2. After reaching zero pressure, valve connecting piston and junction is closed.
3. Waited for a while to be pressure inside and outside of tensiometer to be equalised
4. Dismount saturation chamber from saturation chambers
5. Loosen saturation chamber screws and remove upper plate. It is important to hold water on porous interface
6. Place HCT horizontally while it has water on its porous interface
7. Watch pressure changes from a computer and wait after pressure change is stabilized.
8. Wipe water on porous stone with dry paper towel.
4.5 Soil Suction Measurement
For soils suction measurements two different procedure is followed. First one is for testing usability of HCTs on soil specimen. An “Ankara Clay” specimen is roughly taken and pushed on a smooth surface to prepare a smooth connecting surface for HCT. After Specimen is placed on tensiometer and tensiometer with specimen is enclosed with a glass cup for keeping water content same during measurement (Figure 4-6).
Figure 4-10 Soil Suction Measurement on Ankara clay
The other testing is done on silt specimen (Figure 4-11). For testing 2 specimens with different water contents which are 10% and 20% are prepared
1. Preparation procedure as follows:

49
2. 20 g fully dry silt specimen is weighted
3. Sufficient amount of water is added until wanted water content is reached (for w=10 2g, for w=20g 4g water is added)
Figure 4-11 Silt specimen
4. Water added specimen is mixed to sustain homogeneity of water
5. Specimen is left with closing it to air.
6. Specimen with density of 1.3 is placed on top of the porous interface
7. Wait until equilibrium is reached

50

51
CHAPTER 5
5. RESULTS
This study’s results are classified into three sections. In first section (5.1) pressure transducer’s calibration test results are given. After calibration of system, trials on designed tensiometers are conducted. Since it is newly designed instruments, its usability must be checked before using it on soil specimen. First group of trials are conducted under atmospheric condition and monitored its suction carrying capacity. Their results are given in section 5.2. A In Section 5.3 results of trials are interpreted. Finally tests performed on Ankara Clay are presented in Section 5.4. In this section obtained results are compared with other test results which are performed in METU Geotechnical Engineering Laboratory by other researchers with different techniques.
Trials of HCT designs are different from each other by means of its body material, porous interface and sealing. List of abbreviations used in following sections are listed in Table 5.1
Figure 5-1 Designed HCTs

52
5.1 Calibration of Pressure Transducers
2 pressure transducers are used in the study. They are calibrated using Geocomp Triaxial Setup volume pressure controller(Flow Trac-II)and newly designed calibration setup. Transducers are labelled as “pd_I” and” pd_II”
Both of “pd_I” and “pd_II” gives linear results in loading and unloading.
where CF is the calibration factor.
For pd_I transducer calibration factors are calculated as;
From triaxial setup : 2543.94
From designed calibration setup :2568.90
For pd_II transducer calibration factors are calculated as;
From triaxial setup : 2544.86
From designed calibration setup :2528.40
5.2 Capacity and Soil Suction Measurement Trials
While seeking most suitable configuration for an HCT, some properties of design are changed and labeled as a new trial. There are 6 tensiometers bodies having different porous medium and different sealing type. Also effect of saturation and vacuuming are investigated and they can be listed as variables of HCTs design. In Table 5-3 and Table 5-4 all” trials and its variables are listed. Except Trials #11, #13, #21, #22 all of them are suction capacity trials. These 4 trials are soil suction measurement trials.
Table 5-1 Structural variables of HCT designs trials
Trial # Body Porous medium Pressure
transducer Seal type
1 S C1 pd_1 o-ring
2 T C1 pd_2 PTFE -band
3 T M1 pd_1
liquid gasket to only threads of body
4 T C1
pd_2 liquid gasket to threads of body and parts of transducer
5 S C1
pd_1 liquid gasket to threads of body and parts of transducer
6 T M1
pd_1 liquid gasket to threads of body and parts of transducer
7 S C1 pd_2 o-ring

53
8 T M1 pd_1 o ring
9 T M1 pd_2 o ring liquid gasket to threads of body and
parts of transducer
10 S M2 pd_1 o ring
11 S C1 pd_2 o ring
12 S M2 pd_1 o ring
13 T C1 pd_2 PTFE -band
14 S W1 pd_1 o ring
15 T C1 pd_2 o ring
16 S C1 pd_1 o ring
17 S C2 pd_2 o ring
18 S C2 pd_1 o ring
19 S C2 pd_2 o ring
20 S C2 pd_1 o ring
21 S C2 pd_2 o ring
22 S C2 pd_1 o ring
23 S C2 pd_2 o ring
24 S C2 pd_1 o ring
Table 5-2 Saturation details of HCT design trials
trial # vacuum duration
(min)
1st saturation pressure
(bar)
1st saturation duration
(hr)
2nd saturation pressure
(bar)
2nd saturation duration
(hr)
1 30 35 24 75 24
2 30 35 24 - -
3 30 30 0,5 - -
4 30 70 24 5 20 30 24 - -
6 20 30 24 - -
7 90 15 9 85 13
8 90 15 9 - -
9 120 15 12 - -
10 120 15 12 - -
11 90 75 24- - -
12 90 75 24 - -
13 90 35 24
14 90 35 24
15 90 85 24 - -
16 90 85 24 - -
17 90 85 24 - -

54
18 90 85 24 - -
19 90 85 24 - -
20 90 85 24 - -
21 90 85 24 - -
22 90 85 24 - -
23 90 85 24 - -
24 90 85 24 - -
5.2.1 Trial #1: S/C1 with O-ring
Trial #1 is made with steel body and SME – porous ceramic. Sealing is obtained by O-ring. Maximum measured suction is 500 kPa.
In this trial vacuum is applied for relatively short period (30 minute). Vacuuming can be measured from pressure transducer after 15 minutes of starting vacuum pump .This is because of the thickness and low permeability of the porous stone. After vacuuming water pressure is applied to tensiometers. Since two tensiometers are saturated at the same time, same pressure is applied both. For “Trial #1” its couple is “Trial #2”. Applied pressure is increased until “Trial #2” tensiometer start to leak which is 35 bar. After 24 hours “Trial #1” tensiometer is pressurized up to 75 bar for 24 hours. Like vacuuming, pressurization can also be measured after a while due to same reason of transmissivity.
Measured value is 500 kPa which is lower than AEV of porous disk (≈1500 kPa). This may result from a defect -maybe a crack- inside of porous stone. Also short period of vacuuming could be the reason of pre-cavitation.
In graph some fluctuations are seen. That could be the reason of pressure transducer accuracy distortion.
5.2.2 Trial #2: T/C1 with PTFE band
Trial #2 is made with PTFE/steel body and SME porous stone sealing is sustained by PTFE band. Maximum measured suction is 150 kPa
PTFE body is not worked that is wanted to be since it is leaked before designed pressures. So pre-cavitation is most likely due to poor saturation which is 35bar. Also leakage shows seals are not worked properly. So during suction or saturation process, air may penetrate inside the tensiometer. This also triggers early cavitation.
This trial is important because it is the first trial of PTFE/steel composite body. It shows these bodies can be used as a tensiometer body.
5.2.3 Trial #3: T/M1 with Partial Liquid Gasket
After Trial #2 shows PTFE/steel composite bodies are worked, same body type is tried with different porous interface which is labelled as M1. M1 porous medium’s working principle is mainly based on nano-membrane which is placed between two filter papers and those between two porous stones for back seal, liquid gasket is used only up to the perimeter of transducer’s head. This trial is recorded as unsuccessful.

55
There are some possibilities for this trial’s failure. Most important one is poor saturation. As serious leakage occurs at the beginning of saturation procedure, early cavitation is not an abnormal situation. Another reason is that membrane may be damaged under high pressures or suctions. Last possibility is liquid gasket may cause extra cavitation surfaces.
But as it can be seen on Figure 5-5, a suction is measured up to a value. This shows also nano-membrane could also be used in measurement of suctions.
5.2.4 Trial #4: T/C1 with Full Liquid Gasket
Tensiometer used in Trial #4 has PTFE/steel body and SME ceramic. Liquid gasket is placed the threads of pressure transducer and perimeter of its head and inside of the body.
Trial #3 and #4 are vacuumed and pressurized at the same time. After #3 begins to leak, it is removed from the saturation setup. But #4 is stayed under pressure. Its leakage starts at 70 bar for 24 hours. In this trial 500 kPa suction is measured. This value is consistent with Trial #1 which has same porous stone. That result strengthens the possibility of porous stone defect. Some defects inside the stone may lead AEV to drop.
5.2.5 Trial #5: S/C1 with Full Liquid Gasket
Steel body and SME porous stone is used in Trial #5. Sealing is tried by full body liquid gasket. The trial is not resulted successfully.
After successful trial with “full body liquid gasket”, it is decided to use it on steel body and eliminate O-ring since O-rings are said to cause problems of tensimetrs in literature. A washer is placed instead of O-ring to provide a thickness.
This is also an important trial. Because steel bodies are shortened by cutting in a lathe.To decrease water reservoir volume
Failure of the trial could be due to poor saturation. Also an extra possibility is explained in Section 5.2.6. This trial also shows using liquid gasket without O-rings is useless since leakage starts after 30 bar.
5.2.6 Trial #6: T/M1 with Full Liquid Gasket
PTFE/steel bodies and M1 porous stone are parts of the design used in HCT of Trial #6. Result of this trial is unsatisfactory.
As mentioned leakage is main problem of PTFE/steel bodies. So after leakage problem is partially solved in Trial #4, same sealing is tested in this trial. But leakage is observed above 35 bar. That problem points out a manufacturing problem in PTFE/steel bodies since same sealing is used in Trial #4 and no problem is observed.
Another possibility is having a problem in vacuuming or saturation. This is also a potential problem as almost same graph is obtained both of Trial #5 and Trial #6 which are the saturation pairs.
5.2.7 Trial #7: S/C1 with O-ring
Trial #7 is same as Trial #1 which has steel body and SME porous ceramic. This trial is also counted as an unsuccessful trial

56
After shortening of steel bodies’ length, no trial is made with SC1 body. It was expected to measure a value higher than 500 kPa since it was measured 500 kPa in Trial #1. But it is not achieved although this design is stayed under vacuum for 1.5 hours and under pressure of 85 bar for13 hours after 15 bar pressurization for 9 hours. There is two possible failure causes. One of them is operating error during mounting HCT to saturation setup or during saturation procedure. Other one is due to manufacturing problem while shortening the bodies. After shortening the bodies, a greased apparatus is screwed on this body by lathe operator to align threads of bodies. Cleaning the bodies is almost impossible in this body, because stone is epoxied In front of the body and that makes washing grease out by applying water impossible. It is cleaned by thin rod and a paper towel, but it is not a perfect cleaning. If remaining grease reaches the porous stone, it may close pores of stone or reduce AEV of porous stone. There may be also unpredictable results of it.
5.2.8 Trial #8: T/M1 with O-ring
PTFE/steel body with M1 porous membrane is tried with O ring sealing in Trial #8. Result is unsuccessful.
Since a consistent sealing for T bodies can not be found, An O-ring is decided to be tried on these kinds of bodies too. But O ring also failed stop water. After 40 bars it starts to leak and water do not stop until decreasing pressure to 15 bar. In this trial it is seen that the limit pressure of O-rings is reached during saturation process and leakage starts, significant pressure drop which may be 1/3 of the limit is needed to stop leakage
Also some fluctuations are observed in graph. That may be the reason of excessive usage of pressure transducers. To eliminate this possibility trials are stopped for a day.
5.2.9 Trial #9: T/M1 with Full Body Liquid Gasket and O-Ring
Same HCT design with Trial #8 is used except improved sealing. Full body liquid gasket is applied and O ring is placed between pressure transducer and body. Results are not satisfactory in this trial.
This is another trial for finding best sealing for T bodies. Liquid gasket is applied to threads and other sides of pressure transducer except top of it which is a diaphragm of transducer Also an o ring is placed under body. But these precautions become useless too. After 15 bar of pressure leakage occurs which occurred at 35 bars in previous trials. These unsuccessful trials could be the proof of progressive deformation of T type bodies.
5.2.10 Trial #10: S/M2 with O-Ring
In Trial #10 the tensiometer with steel body and M2 porous medium is used. For a sealing O-ring is used. This trial also gives unsatisfactory results.
It is proven that O-rings properly work on S bodies. But there is not a solid result for porous interface with nano-porous membrane if it is utilizable or not. So this combination is decided to be tested.
Test results are obviously not convincing. But it is not possible to decide if nano-membrane is utilizable in HCT or not by looking of those results. 15 bar saturation may be the reason for those results.

57
5.2.11 Trial #11: S/C1 with O-Ring
This is a repeated test of Trial #7. The designed tensiometer has steel body and SME porous ceramic. O ring is used as sealing. The results are not as expected
Since reason of failure of Trial #7 is thought poor saturation, saturation procedure is improved in this trial .Vacuuming lasts for 1.5 hours. And pressure is increased up to 75 bars for 24 hours. After the saturation pressure transducer is connected to Ankara clay specimen rather than not by opening directly to atmosphere Results are not good as expected. This strengthens the possibility of manufacturing error which is mentioned in Section 5.2.7.
5.2.12 Trial #12: S/M2 with O-Ring
This is a repeated test of Trial #10 with an improved saturation procedure. Expected results are not encountered in this trial.
Improved saturation procedure was essential for testing SM2 type HCT to draw a conclusion about M2 porous interface. After 75 bar saturation it is concluded that SM2 type of HCT is an unserviceable design.
5.2.13 Trial #13: T/C1 with PTFE Band
The designed tensiometer has steel body and SME porous ceramic. PTFE band is used as sealing.
Tensiometer is stayed under 35 bar of saturation since its saturation couple trial has a brittle porous medium so it can be damaged under high pressures.
But this saturation procedure seems not sufficient. So testing on Ankara Clay did not give any results
5.2.14 Trial #14: S/W1 with O-Ring
A new design with steel body and W1 labelled porous medium is tested in this trial. O-ring used as a seal. This is an unsuccessful trial.
After unsuccessful trials with nano-porous membrane, it was thought that problem may be caused by upper porous interface since it is relatively thick layer and that enlarge distance between nano membrane and measurement surface. To lessen this distance wire mesh is used as an upper porous interface. Results were not as an expected.
5.2.15 Trial #13: T/C1 with PTFE Band
The designed tensiometer has steel body and SME porous ceramic. PTFE band is used as sealing.
70 bar pressure was applied to HCT, but its pressure transducer did not reflect that pressure. That may be a result of a poor vacuuming.
5.2.16 Trial #14: S/W1 with O-Ring
Steel body and W1 labelled porous medium is tested in this trial. O-ring used as a seal.
This design tested twice to be sure if it was working. Proper vacuuming and saturation is observed but results were not satisfactory.

58
Broken membrane may cause the unsatisfactory result.
5.2.17 Trial #15 and Trial#16: TC1 with PTFE band and SC1 with O-ring
Ceramic porous stone with both PTFE and steel bodies are tested in this trial.
These designs were tested previously and at first had given good results. But fist trials measurements could not be repeated again. So these designs were tested in Trial #15 and #16 for the last time.
Results showed that these designs were not working at all.
5.2.18 Trial #17 and Trial#18: SC2 with O-ring
New porous ceramic with 15 bar AEV is used for this trials.
Two exactly same HCT were tested simultaneously to verify their results accuracy. 80 bar was applied during saturation. In Trial #17 200kPa and in Trial #18 870 kPa suction were measured. Trial #18 results are the highest measured results in this study. Different results in same vacuuming and same saturation procedure may be a result of a pressure transducer failure or poor epoxying procedure.
5.2.19 Trial #19 and Trial#20: SC2 with O-ring
Same HCTs were mounted on saturation system to test their capacity again.
In these trials high capacity measurements were achieved. Recorded measurement in Trial#19 and Trial#20 are 230 kPa and 700 kPa respectively.
Differences between results were continued. That strengthened the assumptions made in section 5.3.18.
5.2.20 Trial #21and Trial#22: SC2 with O-ring
Successful design SC2 was tested on silt specimens.
Specimen with 20% water content was tested on Trial#21 which is used the same HCT in Trial#17 and Trial#19. Specimen with 10% water content was tested on Trial#22.
Trials were not going well since recorded suction value was not fixed on a constant value. In Trial#21 220 kPa, in Trial #22 400 kPa maximum suctions were measured and cavitation observed.
Results on SC2 tensiometer may be caused by poor contact between tensiometer and soil specimen.
5.2.21 Trial #23and Trial#24: SC2 with O-ring
Same designs were tested again to verify if they still work after soil specimen testing.
Recorded data shows they were vacuumed and saturated properly. But results were not as expected. It seems soil specimen testing affected the capacity of HCTs.

59
5.3 Interpretation of Results
5.3.1 HCT Response to pressure
Different porous interfaces have different properties such as AEV, permeability or pore spacing. During saturation process these specifications affect the response time of HCT to measure applied pressures. In Figure 5-3 response differences between porous interface with nano-membrane and porous ceramic is illustrated for pressurization during saturation
Figure 5-2 Response time of two different porous interface during pressurization
It can be seen delayed response of porous ceramic under incremental increased pressure whereas porous interface with nano-membrane gives a rather quick response. This is because it takes time for water to pass through ceramic’s pore since it is thicker than me the nano-membrane although the latter has much smaller pores than porous ceramic
In unloading case it is a little different. As it can be seen in Figure 5-4 differences in response time of two interfaces is not too much different from each other. This is not a surprising behaviour since all pores are filled with water. There is a continuous water bond between pressure transducer and shafts. Any pressure change is directly transferred to pressure transducer.
As a result vacuum interfaces are pushed through the much longer pores of SME ceramics in a significantly longer time, when compared to the nano-membranes. However, in a pure water phase, there wasn’t much difference in response times employing the two different kinds of porous interfaces.

60
Figure 5-3 Response time of two different porous interface during unloading
5.3.2 HCT Response to Suction
After successful saturation procedure it is expected from HCT to measure suction values until cavitation occurs. After a cavitation occurs, abrupt change in pressure is observed. Pressure drops to about 80 kPa, as noted by other researchers in the literature (Toker,2002, Tarantino et al.,2004)
Figure 5-4 Ideal suction versus time graph for HCT measurement

61
CHAPTER 6
6. CONCLUSION
6.1 Summary of Works
In this study the first high capacity tensiometers of Turkey are built. Ways of increasing the capacity of HCTs were investigated by making several structural changes to previously designed HCTs. These modifications are based on studies on HCTs. In these studies main obstacle for HCT progress seems poor saturation of porous medium. To achieve better saturation either use more suitable porous medium must be used or saturation procedure must be improved or both
Up to today almost same porous interface are used with a few exceptions. In this thesis beside SME ceramics, a nano-porous membrane is used as a porous medium Main idea to choose this material is that it has nano scaled and uniformly distributed pores. Small pores mean having higher AEV which is also the upper limit of suction value that can be measured by a HCT. Uniformity of pores in membrane makes saturation process more effective.
Saturation process is tried to be improved by designing new system. A setup which can pressurize water up to 100 bars for 48 hour is designed.
In addition to these two improvements a new material is used as tensiometer body material to improve sealing between pressure transducer and HCT’s body while minimising water reservoir volume and amount of crevices that can nucleate cavitation. This material is a kind of polymer which is which is used widely in water transport structures.
For pressure transducer calibration a new calibration setup is designed.
6.2 Research Findings
As a porous interface different combinations of materials are tested. Porous ceramics give best results. With these ceramics suction is measured up to 870kPa.
Measurement with combination of several porous materials did not result in desired capacity increase. However using thinner HAE medium accelerates pressure equilibration
Steel bodies seem most suitable material for HCT design. PTFE bodies’ behaviour is not as expected. These bodies leaked water above 30 bar no matter which sealing is used. So leaked pressure is used as a maximum saturation pressures instead of planned pressures. Reason of leakage may be excessive deformations of PTFE bodies due to multiple usage of it. Poor workmanship may be another reason since small defects on processing may cause leakage.
Reinforced O-rings are found to be the most suitable sealing for HCTs with steel bodies. However it must be noted that sealing the transducer to the body with epoxy which is sometimes found in literature which is sometimes found in literature which is sometimes found in literature which is sometimes found in literature was not tried.

62
In design procedure some difficulties are experienced. One of them is using galvanized connection equipment. It was thought that galvanized parts do not rust. But they rusted after one or two usage. After that rusted parts are changed with new stainless steel part. It must be noted that using stainless steel part is a must for working with high pressured water. Another difficulty is to stop leakage from PTFE bodies. These bodies were selected to be more resistant to leakage. But they behaved oppositely. The leakage did not even stop with O-ring. The reason may be that PTFE bodies are softer than it was thought. So it was deformed excessively after few times of screwing pressure transducer. Another possible reason is poor workmanship while shaping it. After these experiences PTFE bodies are not suitable for using as a tensiometer bodies
6.3 Recommendation of Future Works
This study can be improved by extending the trial group by adding some new HCT design Current designs shows PTFE/steel bodies are not working well. So additional designs should focus on steel bodies. Also additional test can be made by PTFE/steel bodies without starting leakage. Additionally multi-layered porous interface with using 3 or more nano-membrane can be tested considering brittleness of membranes.
Once a tensiometer design is finalized and procedures established, the tensiometer should be used for suction measurement on various soils with known suction-water content relationships.
After ascertaining the measurement capabilities of tensiometers on soil samples, various soil testing equipments can be modified to incorporate tensiometers to be used in unsaturated soils.
This study is mainly based on a designing of a high capacity tensiometer. Extended tests on different soil specimens are out of this study’s subject. To solidify designed tensiometers accuracy, it is essential to check it with more specimens with known suction- water content relationships. Further tests with axial translation techniques and designed tensiometers on same specimens can be performed.

63
7. BIBLIOGRAPHY
AgriDrip Co. (2012). Irrigation Requirements. Retrieved from
http://www.agridrip.com/page/437455580
ASTM Standard D3404-91 (2004). Standard Guide for Measuring Matric Potential in the Vadose
Zone Using Tensiometers. Annual Book of ASTM Standards, 04(08)
Berthelot M.(1850). Sur quelques phenomenes de dilatation forceo des liquides . Ann. chim.
phys.,30(3) 232-237
Chapman, P. J., Richards, B. E., & Trevena, D. H. (2001). Monitoring the growth of tension in a
liquid contained in a Berthelot tube. Journal of Physics E: Scientific Instruments, 8(9),
731.
Çokça, E., & Tilgen, H. P. (2010). Shear strength-suction relationship of compacted Ankara
clay. Applied Clay Science, 49(4), 400-404.
Delage, P., Romero, E., & Tarantino, A. (2008). Recent developments in the techniques of
controlling and measuring suction in unsaturated soils. Unsaturated Soils: Advances in
Geo-Engineering. CRC Press, Leiden, 33-52.
Ele Int. (2012). Soil Equipment Catalog. Retrieved December 22, 2012, from
http://ele.com/usa/pdfs/soil-v3.pdf
Estabragh, A., & Javadi, A. (2012). Effect of suction on volume change and shear behaviour of an
overconsolidated unsaturated silty soil. Geomechanics and Engineering, 4(1), 55-65
Fisher, J. C. (1948). The fracture of liquids. Journal of applied Physics,19(11), 1062-1067.
Fredlund, D. G., Rahardjo, H., & Fredlund, D. G. (1993). Soil mechanics for unsaturated soils. New
York: Wiley
Fredlund, D. G., Xing, A., & Huang, S. (1994). Predicting the permeability function for unsaturated
soils using the soil-water characteristic curve.Canadian Geotechnical Journal, 31(4), 533-
546.
Fredlund, D. G., Vanapalli, S. K., Xing, A., & Pufahl, D. E. (1995). Predicting the shear strength
function for unsaturated soils using the soil-water characteristic curve. In First
International Conference on Unsaturated Soils, Paris, France
Green, J. L., Durben, D. J., Wolf, G. H., & Angell, C. A. (1990). Water and solutions at negative
pressure: Raman spectroscopic study to-80 megapascals. Science (New York,
NY), 249(4969), 649.

64
Guan, Y., & Fredlund, D. G. (1997). Use of the tensile strength of water for the direct
measurement of high soil suction. Canadian Geotechnical Journal, 34(4), 604-614.
Krahn, J., & Fredlund, D. G. (1972). On total, matric and osmotic suction.Soil Science, 114(5), 339-
348.
Laplace, P.S. (1806), Méchanique céleste,10
Lourenço, S. D. N., Gallipoli, D., Toll, D. G., & Evans, F. D. (2006). Development of a commercial
tensiometer for triaxial testing of unsaturated soils. ASCE.
Lu, N., & Likos, W. J. (2004). Unsaturated soil mechanics.New Jersey: J. Wiley.
Marinho, F. A. M., and Chandler, R. J. (1995). Cavitation and the direct measurement of soil
suction. Proc., 1st Int. Conf. on Unsaturated Soils, E. E. Alonso and P. Delage, eds.,
Balkema, Paris, 623–630
Marinho, F. A. M., & de Sousa Pinto, C. (1997). Soil suction measurement using a tensiometer.
Symposium on Recent Developments in Soil and Pavement Mechanics, Rio de Janeiro,
Brazil
Marinho, F. A., Take, W. A., & Tarantino, A. (2008). Measurement of matric suction using
tensiometric and axis translation techniques. Geotechnical and Geological
Engineering, 26(6), 615-631
McQueen, I. S., & Miller, R. F. (1974). Approximating soil moisture characteristics from limited
data: empirical evidence and tentative model. Water Resources Research, 10(3), 521-
527.
Measurement Specialties. (2012). XPM10 Miniature pressure sensor. Retrieved from
http://www.meas-spec.com/downloads/XPM10.pdf
Meilani, I., Rahardjo, H., Leong, E. C., & Fredlund, D. G. (2002). Mini suction probe for matric
suction measurements. Canadian Geotechnical Journal,39(6), 1427-1432.
Montanez, C. J. E. (2002). Suction and volume changes of compacted sand-bentonite
mixtures (Doctoral dissertation), Imperial College London
Nelson, J. D., & Miller, D. J. (1992). Expansive soils: problems and practices in foundation and
pavement engineering. New York: John Wiley & Sons Inc.
Nishimura, T., & Fredlund, D. G. (2000). Relationship between shear strength and matric suction
in an unsaturated silty soil. In Asian Conference on Unsaturated Soils from theory to
practice,8-19.
Richards, B. G. (1965). Measurement of free energy of soil moisture by the psychrometric
technique using thermistors. Moisture equilibria and moisture changes in soil beneath
covered areas, Butterworth, Australia, 39–46.

65
Ridley, A. M., & Burland, J. B. (1993). A new instrument for the measurement of soil moisture
suction. Géotechnique, 43(2),321‐324.
Ridley, A. M., & Burland, J. B. (1995). Measurement of suction in materials which swell. Applied
mechanics reviews, 48, 727.
Ridley, A.M. and Wray, W.K. (1996). Suction measurement: A review of current theory and
practices. Proc. 1st Int. Conf. on Unsaturated Soils, Paris. Unsaturated Soils. E.E. Alonso
and P. Delage (eds.). A.A. Balkema / Presses des Ponts et Chaussées, Paris, 3: 1293‐1322.
Ridley, A. M., Dineen, K., Burland, J. B., & Vaughan, P. R. (2003). Soil matrix suction: some
examples of its measurement and application in geotechnical
engineering. Géotechnique, 53(2), 241‐253
Sjoblom, K. J. (2000). The mechanisms involved during the desaturation process of a porous
matrix (Doctoral dissertation), Massachusetts Institute of Technology
Soil Moisture Corp. (2008). Porous Ceramic Catalog. Retrieved December 25, 2012, from
http://www.soilmoisture.com/PDF Files/ceramics2008.pdf
Synkera Tech. Inc. (2011). Nanoporous Ceramic Mebranes. Retrieved January 5, 2012, from
http://www.synkera.com/images/pdf/Synkera_TechProfile_Membranes.pdf
Tadepalli, R., Rahardjo, H., & Fredlund, D. G. (1992). Measurements of matric suction and volume
changes during inundation of collapsible soil.Geotechnical Testing Journal, 15(2), 115‐
122.
Take, W. A., & Bolton, M. D. (2003). Tensiometer saturation and the reliable measurement of soil
suction. Geotechnique, 53(2), 159‐172.
Tarantino, A., & Mongiovì, L. (2002). Design and construction of a tensiometer for direct
measurement of matric suction. International Conference on Unsaturated Soils,3, 319‐
Tarantino, A., & Mongiovì, L. (2002). Design and construction of a tensiometer for direct
measurement of matric suction. International Conference on Unsaturated Soils,3, 319‐
324
Tarantino, A., & Mongiovi, L. (2003). Calibration of tensiometer for direct measurement of matric
suction. Géotechnique, 53(1).
Tarantino, A. (2004). Direct measurement of soil water tension. Proceedings of 3rd International
Conference on Unsaturated Soils. Recife: Taylor & Francis, 1005‐1017.
Temperley, H., & Chambers, L. (1946). The behavior of water under hydrostatic tension: I.
Proceedings of the Physical Society of London, 58, 420–436.
Temperley, H. (1946). Hydrostatic, The behavior of water under tension: II. Proceedings of the
Physical Society of London, 58, 436–443.

66
Temperley, H. (1947). The behavior of water under hydrostatic tension: III. Proceedings of the
Physical Society of London, 59, 199–208.
Toker, N. K. (2002). Improvements and reliability of MIT tensiometers and studies on soil moisture
characteristic curves (Masters Thesis), Massachusetts Institute of Technology.
Toker, N. K., Germaine, J. T., Sjoblom, K., & Culligan, P. J. (2004). A new technique for rapid
measurement of continuous soil moisture characteristic curves. Geotechnique, 54(3),
179‐186.
Toker, N. K. (2007). Modeling the relation between suction, effective stress and shear strength in
partially saturated granular media (Doctoral dissertation), Massachusetts Institute of
Technology.
Toll, D. G., Lourenço, S. D., & Mendes, J. (2012). Advances in suction measurements using high
suction tensiometers. Engineering Geology.
Trevena, D. H. (1987). Cavitation and tension in liquids.Bristol: A. Hilger.
Yanagisawa, K., Ioku, K., & Yamasaki, N. (1994). Pore size control of porous silica ceramics by
hydrothermal hot‐pressing. Nippon Seramikkusu Kyokai Gakujutsu Ronbunshi(J. Ceram.
Soc. Jpn.), 102, 961‐971.
Zhan, L. T., Chen, P., & Ng, C. W. (2007). Effect of suction change on water content and total
volume of an expansive clay. Journal of Zhejiang University‐Science A, 8(5), 699‐706.

67
APPENDIX - A.
A.1 XPM-10 PRESSURE SENSOR DIMENSIONS AND WIRE SHEMATIC

68

69
A.2 HCT INNER PTFE BODY ENGINEERING DRAWING

70
A.3 HCT OUTER STEEL BODY ENGINEERING DRAWING
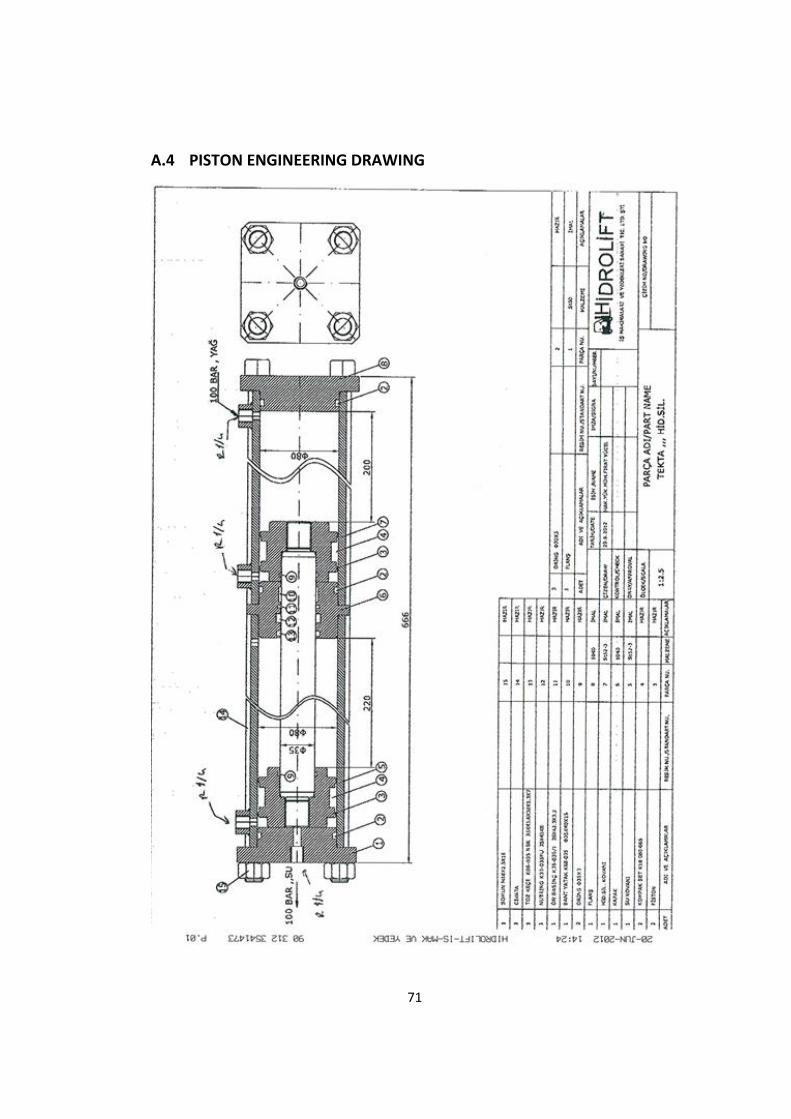
71
A.4 PISTON ENGINEERING DRAWING

72
A.5 SATURATION CHAMBER UPPER PLATE

73
A.6 SATURATION CHAMBER LOWER PLATE

74

75
APPENDIX - B.
B.1 TIME VERSUS PRESSURE GRAPHS OF TRIALS
Figure B-1 Trial #1 Suction versus time graph
Figure B-2 Trial #2 Suction versus time graph

76
Figure B-3 Trial #3 Suction versus time graph
Figure B-4 Trial #4 Suction versus time graph

77
Figure B-5 Trial #5 Suction versus time graph
Figure B-6 Trial #6 Suction versus time graph

78
Figure B-7 Trial #7 Suction versus time graph
Figure B-8 Trial #8 Suction versus time graph
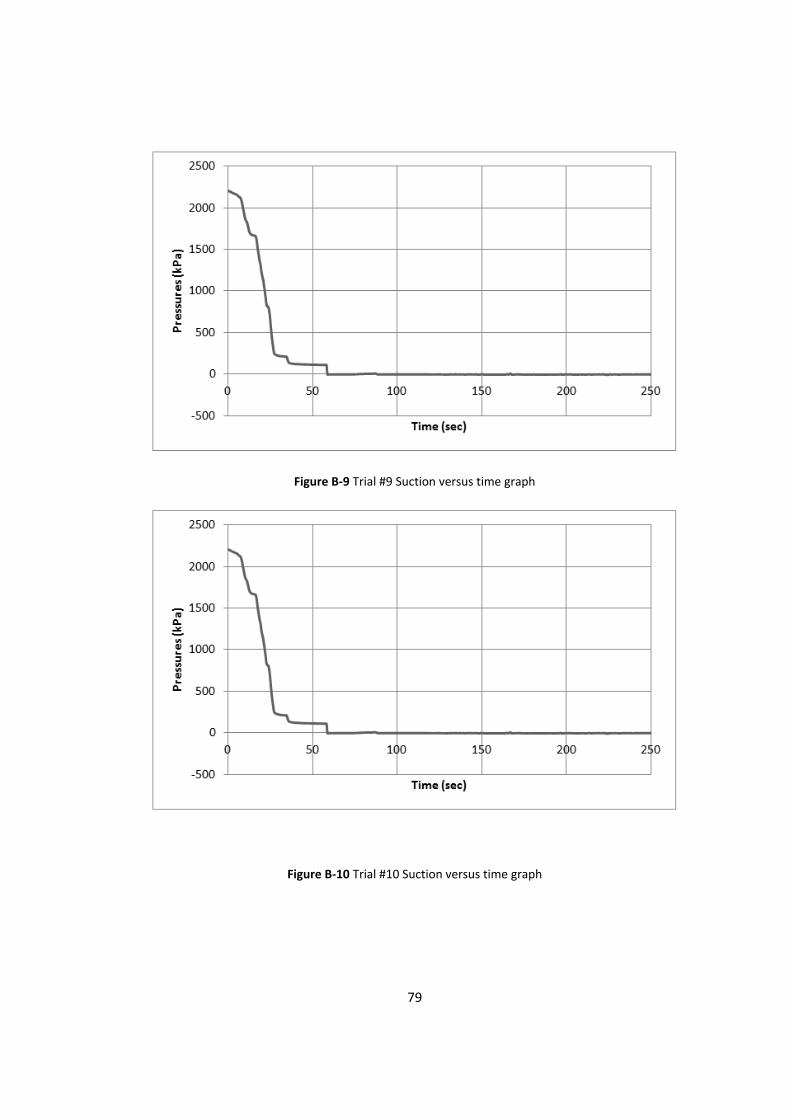
79
Figure B-9 Trial #9 Suction versus time graph
Figure B-10 Trial #10 Suction versus time graph

80
Figure B-11 Trial #11 Suction versus time graph
Figure B-12 Trial #12 Suction versus time graph

81
Figure B-13 Trial #13 Suction versus time graph
Figure B-14 Trial #14 Suction versus time graph

82
B.2 CALIBRATION DATA AND GRAPHS
Table B-1 “pd_I” responses on given pressures on triaxial setup
Pressure (kPa)
Voltage (V)
Pressure (kPa)
Voltage (V)
Pressure (kPa)
Voltage (V)
0 0,63
899,94 0,9834
699,94 0,9038
99,915 0,6688
999,94 1,0225
599,99 0,8644
199,94 0,7079
1099,94 1,0622
499,96 0,8248
299,91 0,7472
1199,94 1,1015
400 0,786
399,94 0,7866
1199,94 1,1015
300 0,7469
499,94 0,8254
1099,94 1,0616
200 0,707
599,94 0,8659
999,94 1,0225
100 0,6688
699,94 0,9041 899,94 0,9825 50 0,6496
799,94 0,9438 799,94 0,9429
Figure B-15 Graph of “pd_I” response voltages versus given pressures and corresponding tredline of calibration with triaxial setup

83
Table B-2 “pd_II” responses on given pressures on triaxial setup
Pressure (kPa)
Voltage (V)
Pressure (kPa)
Voltage (V)
Pressure (kPa)
Voltage (V)
0,4433 0
0,7161 699,95
0,7945 899,98
0,4625 49,985
0,7549 799,95
0,7549 799,95
0,4817 99,97
0,7945 899,95
0,6752 599,99
0,5205 199,96
0,8345 999,95
0,6358 499,95
0,5592 299,97
0,8739 1099,95
0,518 200
0,5983 399,96
0,9136 1199,95
0,4787 100
0,6374 499,96
0,8342 1000
0,4591 50
0,6767 599,93
Figure B-16 Graph of “pd_II” response voltages versus given pressures and corresponding tredline of calibration with triaxial setup

84
Table B-3 “pd_I” responses on given pressures on calibration setup
weight (kg)
pressure (kPa)
voltage (v)
weight (kg)
pressure (kPa)
voltage (v)
weight (kg)
pressure (kPa)
voltage (v)
0.74 371.55 0.76
9.70 4844.62 2.51
18.92 9448.06 4.25
1.74 869.87 0.95
10.70 5342.39 2.71
17.92 8950.04 4.14
2.74 1367.54 1.15
11.69 5840.41 2.91
16.92 8451.72 3.94
3.74 1865.56 1.34
12.69 6336.78 3.09
12.69 6336.78 3.10
4.72 2358.08 1.53
13.68 6835.10 3.28
10.69 5341.74 2.70
5.70 2846.11 1.72
14.68 7333.12 3.44
8.70 4346.21 2.31
6.69 3343.78 1.92
15.68 7830.78 3.54
4.79 2393.94 1.53
7.69 3842.10 2.12
16.92 8451.72 3.91
0.82 407.41 0.76
8.70 4346.31 2.32
17.92 8950.04 4.04
Figure B-17 Graph of “pd_I” response voltages versus given pressures and corresponding tredline of calibration with calibration setup
y = 2568,9x - 1585,2 R² = 0,9996
0
2000
4000
6000
8000
10000
12000
0 0,5 1 1,5 2 2,5 3 3,5 4 4,5
app
lied
pre
ssu
res
(kP
a)
pressure transducer response (V)

85
Table B-4 “pd_II” responses on given pressures on calibration setup
weight (kg)
pressure (kPa)
voltage (v)
weight (kg)
pressure (kPa)
voltage (v)
weight (kg)
pressure (kPa)
voltage (v)
0.74 371.55 0.61
9.70 4844.62 2.37
18.92 9448.06 4.19
1.74 869.87 0.80
10.70 5342.39 2.56
19.91 9945.72 4.39
2.74 1367.54 0.99
11.69 5840.41 2.76
18.92 9448.06 4.19
3.74 1865.56 1.19
12.69 6336.78 2.86
17.92 8950.04 3.99
4.72 2358.08 1.38
13.68 6835.10 3.10
16.92 8451.72 3.79
5.70 2846.11 1.58
14.68 7333.12 3.35
12.69 6336.78 2.96
6.69 3343.78 1.77
15.68 7830.78 3.55
10.69 5341.74 2.57
7.69 3842.10 1.97
16.92 8451.72 3.79
8.70 4346.21 2.17
8.70 4346.31 2.17
17.92 8950.04 3.99
4.79 2393.94 1.38
Figure B-18 Graph of “pd_II” response voltages versus given pressures and corresponding treeline of calibration with calibration setup
y = 2528,4x - 1134,8 R² = 0,9999
0
2000
4000
6000
8000
10000
12000
0 1 2 3 4 5
app
lied
pre
ssu
res
(kP
a)
pressure transducer response (V)