
1-84 OCTOBER 6 2010 OUTPUT - New India Oman · TARUN BAJAJ, IAS (Chairman) (Ceased - 16.02.2010)...
180
Transcript of 1-84 OCTOBER 6 2010 OUTPUT - New India Oman · TARUN BAJAJ, IAS (Chairman) (Ceased - 16.02.2010)...


okf"kZd fjiksVZANNUAL REPORT 2009-10
1
CO
NT
EN
TS
CO
NT
EN
TS
CO
NT
EN
TS
CO
NT
EN
TS
CO
NT
EN
TS
CONTENTSDirectors and Management ............................................................................................................................ 3
Annual General Meeting Notice ..................................................................................................................... 6
Report of the Board of Directors ................................................................................................................... 7
Addendum to Directors’ Report ................................................................................................................... 43
Corporate Governance Certificate .............................................................................................................. 45
Management Report ...................................................................................................................................... 46
Auditors’ Report ............................................................................................................................................ 48
Comments of CAG......................................................................................................................................... 51
Certificate as required by Schedule ‘C’ of IRDA Regulations 2002 ........................................................ 52
Revenue Accounts ........................................................................................................................................ 53
Profit & Loss Account ................................................................................................................................... 56
Balance Sheet ................................................................................................................................................ 57
Schedules ....................................................................................................................................................... 58
Receipts and Payments Account (Cash Flow Statement) ........................................................................ 71
Segment Reporting Schedules .................................................................................................................... 72
Shareholders’ & Policyholders’ Funds ....................................................................................................... 83
Significant Accounting Policies, Notes and Disclosures ........................................................................ 84
Balance Sheet Abstract .............................................................................................................................. 110
Statement of Interest in Subsidiary Companies ...................................................................................... 111
New India Offices ........................................................................................................................................ 174
ANNUAL REPORTS OF SUBSIDIATIES
The New India Assurance Co. (Trinidad & Tobago) Limited .................................................................. 113
The New India Assurance Co. (Sierra Leone) Limited ............................................................................ 142
Prestige Assurance Plc (Nigeria) .............................................................................................................. 148

2
Estbd. 1919
fn U;w bafM;k ,';ksjUl da- fy-THE NEW INDIA ASSURANCE CO. LTD.

okf"kZd fjiksVZANNUAL REPORT 2009-10
3

4
Estbd. 1919
fn U;w bafM;k ,';ksjUl da- fy-THE NEW INDIA ASSURANCE CO. LTD.
DIR
EC
TD
IRE
CT
DIR
EC
TD
IRE
CT
DIR
EC
TO
RS
& M
AN
OR
S &
MA
NO
RS
& M
AN
OR
S &
MA
NO
RS
& M
AN
AAAA AG
EM
EN
TG
EM
EN
TG
EM
EN
TG
EM
EN
TG
EM
EN
T
BOARD OF DIRECTORSCHAIRMAN-CUM-MANAGING DIRECTOR
M. RAMADOSS B. CHAKRABARTI(Appointed - 30.12.2009) (Ceased - 30.09.2009)
DIRECTORSR. GOPALAN, I.A.S. SANJAY GUPTA
(Appointed - 16.02.2010) SARAT PATTANAYAKTARUN BAJAJ, I.A.S. N.S.R. CHANDRAPRASAD(Ceased - 16.02.2010) (Ceased - 04.06.2009)
M.D. MALLYA A.R. SEKARM. RAZZACK I.S. PHUKELA
(Appointed - 20.01.2010)
Audit Committee
M. RAZZACK (Chairman)TARUN BAJAJ, IAS
(Chairman)(Ceased - 16.02.2010)
M.D. MALLYASANJAY GUPTA
(Appointed - 30.03.2010)N.S.R. CHANDRAPRASAD
(Ceased - 04.06.2009)A.R. SEKAR
(Appointed - 17.08.2009)
Investment Committee
M. RAMADOSS (Chairman)(Appointed - 04.02.2010)
B. CHAKRABARTI(Chairman)
(ceased - 30.09.2009)TARUN BAJAJ, IAS
(Ceased - 16.02.2010)M.D. MALLYA
SANJAY GUPTAA.R. SEKAR
A.R. PRABHU
Remuneration Committee
R. GOPALAN, I.A.S.(Chairman)
(Appointed - 30.03.2010)TARUN BAJAJ, I.A.S.
(Chairman)(Ceased - 16.02.2010)
M.D. MALLYAM. RAZZACK
Risk Management Committee
M. RAMADOSS (Chairman)SANJAY GUPTA
A.R. SEKARI.S. PHUKELA
Policyholders’ Protection CommitteeM. RAMADOSS (Chairman)
M. RAZZACKSARAT PATTANAYAK
A.R. SEKARI.S. PHUKELA
Financial Advisor
A.R. SEKAR
Chief Vigilance OfficerGOPA RAY
(upto 19.04.2010)N. TOBDAN
(19.04.2010 to 30.06.2010)A.R. SEKAR
(from 01.07.2010)
Appointed Actuary
A.R. PRABHU
Company Secretary
A.R. SEKAR(upto 13.08.2010)
V.C. JAIN(from 13.08.2010)

okf"kZd fjiksVZANNUAL REPORT 2009-10
5
MA
N M
AN
MA
N M
AN
MA
NAA AAA
GE
ME
NT
GE
ME
NT
GE
ME
NT
GE
ME
NT
GE
ME
NT
GENERAL MANAGERSA. R. SEKAR I. S. PHUKELA
S. GOPALAKRISHNAN S. B. L. GOUR
ASHA NAIR R. K. DEKA
VASANTH KRISHNA *
DEPUTY GENERAL MANAGERS
P. MANOKARAN N. TOPPO * P. SENTHIL KUMAR
A.P. MITTAL * SUDIP SINHA * P.G. JOSHI *
ASWATHA NARAYANA * K.L.R. BABU S. BANARJI
NARINDER KUMAR J.P. SHEOKAND RAKESH KUMAR
C.J. PHILIP P. DUTTA S.SEGAR
V. HARI SRINIVAS AHMED RAFI K. SURYA RAO
ANIL KUMAR S. SIVARAMAN M.M. HUSSAIN
G.C. SHARMA A.N. JHA K.V. KRISHNA
*On deputation to other companies / foreign offices
AUDITORSCHATURVEDI & SHAH KARNAVAT & CO. FORD, RHODES, PARKSChartered Accountants Chartered Accountants & CO.
Chartered Accountants
REGISTERED & HEAD OFFICE
NEW INDIA ASSURANCE BUILDING,87, M. G. ROAD, FORT, MUMBAI 400 001
www.newindia.co.in

6
Estbd. 1919
fn U;w bafM;k ,';ksjUl da- fy-THE NEW INDIA ASSURANCE CO. LTD.
NOTICE OF THE 91st ANNUAL GENERAL MEETINGTo,
ALL SHARE HOLDERS / DIRECTORS / STATUTORY AUDITORS
NOTICE is hereby given that the 91st Annual General Meeting of the members of The New India AssuranceCompany Limited will be held on Monday, the 16th day of August, 2010 at 11.30 a.m. at the RegisteredOffice of the company at New India Assurance Building, 87, Mahatma Gandhi Road, Fort, Mumbai – 400001 to transact the following business :-
1. To receive, consider and adopt the Balance Sheet of the company as at 31st March 2010, Profit andLoss Account for the year ended 31st March 2010, the reports of the Board of Directors for the periodcovered by the accounts and the Auditors’ report on the Balance Sheet and Accounts.
2. To declare a dividend for the year 2009-10.
3. To seek approval for grant of remuneration as required under Section 224(8) (aa) of Companies(Amendment) Act, 2000, for Central Joint Statutory Auditors at HO and Regional Office / DivisionalOffice / Hub Auditors for the financial year 2010-11 to be appointed by CAG under Section 619(2) ofthe Companies Act, 1956 and in addition payment of out of pocket expenses and travelling expensesto the auditors, wherever necessary.
By Order of the Board
(A. R. SEKAR)
DIRECTOR & COMPANY SECRETARY
Place : Mumbai
Date : 3rd August 2010
Note :
A Member entitled to attend and vote is entitled to appoint a Proxy and attend and vote instead of himselfand the Proxy need not be a Member. Proxies in order to be effective must be lodged with the Company atleast 48 hours before the commencement of the Meeting.
AAAA AG
M N
OG
M N
OG
M N
OG
M N
OG
M N
OT
ICE
TIC
ET
ICE
TIC
ET
ICE

okf"kZd fjiksVZANNUAL REPORT 2009-10
7
DIRECTORS’ REPORT 2009-10REPORT OF THE BOARD OF DIRECTORS OF THE NEW INDIA ASSURANCE COMPANY LIMITED UNDERSECTION 217 OF THE COMPANIES ACT, 1956.
To the members :
The Directors are pleased to present the 91th Annual Report together with the audited statement of accountsand balance sheet of the company for the year ended 31st March 2010.
I. CLASS-WISE PERFORMANCE SUMMARY:
(Rupees in crore)
Fire Marine Misc Total
Gross Direct Premium Income India CY 923.78 474.30 4644.43 6042.51
PY 773.33 446.10 4289.40 5508.82
(% Growth) CY 19.46 6.32 8.28 9.69
PY 4.02 2.02 4.72 4.39
Outside India CY 288.14 50.37 718.12 1056.63
PY 225.05 65.49 656.42 946.96
(% Growth) CY 28.03 -23.09 9.40 11.58
PY -5.43 13.80 13.36 8.28
Global CY 1211.92 524.67 5362.55 7099.14
PY 998.38 511.59 4945.82 6455.78
(% Growth) CY 21.39 2.56 8.43 9.97
PY 1.73 3.39 5.79 4.95
Reinsurance Premium Accepted India CY 68.66 5.40 635.85 709.91
PY 59.33 7.44 579.69 646.46
Outside India CY 420.09 15.78 100.37 536.24
PY 450.72 14.32 46.64 511.68
Global CY 488.75 21.18 736.22 1246.15
PY 510.05 21.76 626.33 1158.14
Reinsurance Premium Ceded India CY 411.83 306.95 1346.57 2065.35
PY 312.85 285.26 1296.65 1894.76
Outside India CY 191.83 9.92 75.53 277.28
PY 157.43 10.43 50.99 218.85
Global CY 603.66 316.87 1422.10 2342.63
PY 470.28 295.69 1347.64 2113.61
Net Premium India CY 580.61 172.75 3933.71 4687.07
PY 519.81 168.28 3572.44 4260.52
(% Growth) CY 11.70 2.66 10.11 10.01
PY 4.98 -5.87 10.13 8.75
(% to Gross Premium) CY 62.85 36.42 84.70 77.57
DIR
EC
TD
IRE
CT
DIR
EC
TD
IRE
CT
DIR
EC
TO
RS
’ RE
PO
RO
RS
’ RE
PO
RO
RS
’ RE
PO
RO
RS
’ RE
PO
RO
RS
’ RE
PO
RTT TTT

8
Estbd. 1919
fn U;w bafM;k ,';ksjUl da- fy-THE NEW INDIA ASSURANCE CO. LTD.
DIR
EC
TD
IRE
CT
DIR
EC
TD
IRE
CT
DIR
EC
TO
RS
’ R
EP
OR
OR
S’
RE
PO
RO
RS
’ R
EP
OR
OR
S’
RE
PO
RO
RS
’ R
EP
OR
TTTT T
PY 67.22 37.72 83.29 77.34
Outside India CY 516.40 56.23 742.96 1315.59
PY 518.34 69.38 652.07 1239.79
(% Growth) CY -0.37 -18.95 13.94 6.11
PY 32.04 30.91 18.33 24.40
(% to Gross Premium) CY 179.22 111.63 103.46 124.51
PY 230.32 105.94 99.34 130.92
Global Net Premium CY 1097.01 228.98 4676.67 6002.66
PY 1038.15 237.66 4224.51 5500.31
(% Growth) CY 5.67 -3.65 10.70 9.13
PY 16.95 2.54 11.32 11.93
(% to Gross Premium) CY 90.52 43.64 87.21 84.55
PY 103.98 46.45 85.42 85.20
Addition / Reduction in Un-expired CY 29.44 -8.67 271.03 291.80
Risks Reserves PY 75.22 5.89 169.90 251.01
(% to Net Premium) CY 2.68 -3.78 5.80 4.86
PY 7.25 2.48 4.02 4.56
Earned Premium CY 1067.58 237.65 4405.64 5710.86
PY 962.92 231.77 4054.61 5249.30
Incurred Claims Net CY 1068.78 190.75 3872.92 5132.45
PY 606.68 277.11 3788.07 4671.86
(% to Earned Premium) CY 100.11 80.27 87.91 89.87
PY 63.00 119.56 93.43 89.00
Commission Net CY 128.27 19.07 414.02 561.36
PY 137.05 14.55 409.23 560.83
(% to Earned Premium) CY 12.02 8.02 9.40 9.83
PY 14.23 6.28 10.09 10.68Operating Expenses CY 359.69 86.59 1290.51 1736.79
PY 293.41 77.82 1085.22 1456.45
(% to Earned Premium) CY 33.69 36.44 29.29 30.41
PY 30.47 33.58 26.77 27.75U/W Results CY -489.16 -58.76 -1171.81 -1719.74
PY -74.22 -137.71 -1227.91 -1439.84
(% to Earned Premium) CY -45.82 -24.73 -26.60 -30.11
PY -7.71 -59.42 -30.28 -27.43Investment Income - Policyholders CY 183.44 70.64 962.09 1216.17
PY 133.76 47.61 755.60 936.97
Revenue Account Surplus CY -305.72 11.88 -209.72 -503.57
- Policyholders PY 59.54 -90.10 -472.31 -502.87

okf"kZd fjiksVZANNUAL REPORT 2009-10
9
Investment Income - Shareholders CY 923.52
PY 749.85
Other Income less Outgo CY -60.66
PY 50.26
Profit before Tax CY 359.29
PY 297.24
Provision for Tax CY -45.40
PY 73.08
Profit after Tax CY 404.69
PY 224.16
Dividend (Proposed) CY 85.00
PY 45.00
Dividend Tax CY 14.45
PY 7.65
Transfer to Reserves CY 305.24
PY 171.51
II PERFORMANCE REVIEW (GLOBAL) (Rupees in crore)
2009-10 2008-09
A GROSS DIRECT PREMIUM (INDIA): 6042.51 5508.83
Percentage change over previous year: 9.69 4.39
GROSS DIRECT PREMIUM (FOREIGN): 1056.63 946.95
Percentage change over previous year: 11.58 8.28
Gross direct premium (GDP) in India has increased from Rs. 5508.83 crore. in 2008-09 to Rs. 6042.51
crore. in 09-10 recording a good growth of 9.69% as against 4.39% growth registered during 2008-09.
The growth has more than doubled and is observed in all geographical as well as business class
segments (except for a minor fall in aviation), thus indicating over all recovery in the company’s
performance.
Health continues to be the major growth driver followed by motor. However, aviation segment recorded
a minor fall in business during the year.
Foreign (Direct) operations also bettered their growth rate from 8.28% to 11.58% despite the slow
recovery of the world economy and despite fall in marine premium. Direct foreign business increased
from Rs 946.95 crore to Rs 1056.63 crore, a growth of Rs 109.68 crore.
During 2009-10 company continued to be the market leader in India. With global premium havingcrossed Rs. 7099.14 crore. the company has crossed yet another milestone during 2009-10.
DIR
EC
TD
IRE
CT
DIR
EC
TD
IRE
CT
DIR
EC
TO
RS
’ RE
PO
RO
RS
’ RE
PO
RO
RS
’ RE
PO
RO
RS
’ RE
PO
RO
RS
’ RE
PO
RTT TTT

10
Estbd. 1919
fn U;w bafM;k ,';ksjUl da- fy-THE NEW INDIA ASSURANCE CO. LTD.
B NET PREMIUM 6002.66 5500.31
Percentage change over previous year: 9.13 11.93
The net premium income of the company grew by Rs Rs.502.35 crore from Rs.5500.31 crore toRs. 6002.66 crore, with a retention ratio of 84.55 % in the current year, against previous year’sratio of 85.20 %.
C ADDITIONAL UNEXPIRED RISK RESERVES : 291.80 251.01
Percentage to net premium: 4.86 4.56
Unexpired Risk Reserves have increased from Rs. 2824.03 crore as at 31.03.2009 to Rs.3115.83crore as at 31.03.2010. Thus the additional reserve strain during the year was Rs 291.80 crore.There was a reserve release of Rs. 8.67 crore in marine segment and reserve strain of Rs.300.47 crore in other segments.
D INCURRED CLAIMS ( NET) : 5132.45 4671.86
Percentage to earned premium: 89.87 89.00
Global net incurred claims have shown an absolute increase of Rs.460.59 crore. The 0.87%increase in claims ratio was mainly on account of reclassification of TPA fees as claims expenses
DIR
EC
TD
IRE
CT
DIR
EC
TD
IRE
CT
DIR
EC
TO
RS
’ R
EP
OR
OR
S’
RE
PO
RO
RS
’ R
EP
OR
OR
S’
RE
PO
RO
RS
’ R
EP
OR
TTTT T

okf"kZd fjiksVZANNUAL REPORT 2009-10
11
and increase in the claims ratio of foreign operations. The increase in claim ratio of health andmotor segments has been arrested though both the segments still continue to have a claims ratioabove 100%..
E COMMISSION (NET): 561.36 560.83
Percentage to earned premium: 9.83 10.68
Net acquisition cost of business has gone up by a marginal amount of Rs.0.53 crore. However,the acquisition cost as % has come down from 10.68% to 9.35%. Thus the increase in theacquision cost observed in preceding years stands arrested.
F OPERATING EXPENSES : 1736.79 1456.45
Percentage to earned premium: 30.41 27.75
Operating expenses have increased by Rs 280.34 crore, mainly due additional provision requiredfor arrears of wages, increased expenditure on advertisement and publicity and increasedamortisation cost as well as operating costs of the new software. Operating expenses constitute30.41% of earned premium during 2009-10 as against 27.75 % during 2008-09.
G UNDERWRITING RESULTS: -1719.74 -1439.84
Percentage to earned premium: -30.11 -27.43
During 2009-10, the underwriting deficit has gone up by Rs.279.90 crore, mainly due to increasedoperating expenses, as the claim ratio and acquisition costs have remained more or less at theprevious year’s level.
H INVESTMENT INCOME (LESS PROVISION)
Apportioned to policyholders 1216.17 936.97
Apportioned to shareholders 923.52 749.85
Total 2139.69 1686.82
Continued good investment performance enabled the company to earn an investment income ofRs. 2139.69 crore in the current year against Rs.1686.82 crore in the previous year.
DIR
EC
TD
IRE
CT
DIR
EC
TD
IRE
CT
DIR
EC
TO
RS
’ RE
PO
RO
RS
’ RE
PO
RO
RS
’ RE
PO
RO
RS
’ RE
PO
RO
RS
’ RE
PO
RTT TTT

12
Estbd. 1919
fn U;w bafM;k ,';ksjUl da- fy-THE NEW INDIA ASSURANCE CO. LTD.
I REVENUE ACCOUNT RESULTS : -503.57 -502.87
Percentage to earned premium -8.82 -9.58
The policyholders’ account showed a net deficit of Rs.503.57 crore in the current yearagainst Rs.502.87 crore in the previous year. In percentage terms, the deficit was lesser at8.82% against 9.58% of previous year
J OTHER INCOME / OUTGO -60.66 50.24
K PROFIT BEFORE TAX 359.29 297.22
L PROFIT AFTER TAX 404.69 224.14
M PROPOSED FINAL DIVIDEND 85.00 45.00
N DIVIDEND TAX 14.45 7.65
O PAID-UP CAPITAL 200.00 200.00
P RESERVES AND SURPLUS 7203.95 6898.72
Q TOTAL ASSETS 36832.91 26931.58
R INVESTMENTS (AT COST) 11851.03 10771.71
S SOLVENCY MARGIN
Required solvency margin under IRDA regulations (Global) 1644.51 1491.65
Available solvency margin (Global) 5833.72 5083.48
Required solvency margin under IRDA regulations (Indian) 1429.33 1268.15
Available solvency margin (Indian) 6621.70 5569.09
The company’s solvency ratio has further strengthened from 3.41 to 3.55.
T COMPLIANCE WITH SECTION 40C
Percentage of expenses prescribed under the act 19.61 19.60
Company’s actual percentage of expenses 26.04 23.82
Percentage of expenses including commission prescribed under the act27.15 27.47
Company’s actual percentage of expenses including commission 33.93 31.99
Provisions for wage arrears and provisions for terminal benefits have continued to affect thecompliance with the provisions of section 40 C.
III. OVERVIEW OF COMPANY’S OPERATIONS
A. Indian
Gross direct premium in India has increased from Rs.5508.83 crore in 2008-09 to Rs.6042.51crore in 2009-10 recording an impressive growth of 9.69% as against 4.39% registered during2008-09. The growth has more than doubled and is observed in all geographical segments aswell as all classes of business. Health continues to be the major driver for growth followed byMotor. Thus during 2009-10 the company has crossed yet another milestone of Rs.6000 croreand continued to be the market leader in India with a premium of Rs.6042.51 crore.
DIR
EC
TD
IRE
CT
DIR
EC
TD
IRE
CT
DIR
EC
TO
RS
’ R
EP
OR
OR
S’
RE
PO
RO
RS
’ R
EP
OR
OR
S’
RE
PO
RO
RS
’ R
EP
OR
TTTT T

okf"kZd fjiksVZANNUAL REPORT 2009-10
13
The net premium income of the company grew by Rs.426.55 crore i.e. from Rs.4260.52 crore of2008-09 to Rs.4687.07 crore in 2009-10 recording growth of 10.01% (PY 8.75%) in its operations.
Company disbursed claims of Rs.4627.61 crore during 2009-10 against Rs.4303.15 crore in theprevious year. The gross direct incurred claim ratio during the year under review was 83.93%against previous year’s 87.01%. The reduction in gross claims ratio is a significant developmentof 2009-10. The increase in claim ratio of health and motor segments has been arrested thoughboth the segments still continue to have a claim ratio above 100%.
However, this reduction in gross claim ratio was neutralized by adjustments pertaining to previousyear. Net incurred claim ratio marginally decreased from 98.95% in 2008-09 to 98.03% in 2009-10on net earned premium. But for the said adjustments, the reduction would have been much higher.
Operating expenses have increased by Rs.280.15 crore, from Rs.1359.43 crore in 2008-09 toRs.1639.58 crore in 2009-10 mainly due to additional provision required for wage arrears andincreased amortization and operating cost for implementation of the new software.
During 2009-10 the underwriting deficit has gone-up by Rs.255.72 crore from Rs.1564.64 crorein 2008-09 to Rs.1820.36 crore in 2009-10 mainly due to increased operating expenses andadjustments of previous year.
The investment operations of the company contributed additional Rs.450.95 crore to the Income.The continued good investment performance enabled the company to earn an investment incomeof Rs.2021.70 crore in the year 2009-10 against Rs.1570.75 crores in the year 2008-09 andcontributed to the increase in the net profit of the company. The investment yield for the year2009-10 was 16.70% as against 13.38% of the previous year.
The Investment portfolio has gone-up significantly from Rs.10771.71 crore to Rs.11851.03 crore.The market value of investments has also gone-up significantly to Rs.27,400.72 crore in the year2009-10 against Rs. 18,160.87 crore of previous year showing an increase of 50.88%.
The company received the business leadership award for the year 2009 from “NDTV Profit” TVchannel.
INDIAN OPERATIONAL RESULTS
FOR THE YEAR ENDED 31ST MARCH 2010.
(Rs. in crore)
Sr. No PARTICULARS 2009-10 2008-09
Rs. % Rs. %
1 Gross Premium 6042.51 9.69 5508.82 4.39
2 Net Premium 4844.59 11.73 4260.53 8.75
3 URR Additional 301.74 6.64 166.19 3.99
4 Net Earned Premium 4542.85 - 4169.83 -
5 Commission 270.23 5.95 249.00 5.97
6 Incurred claims 4453.40 98.03 4126.04 98.95
7 Management Expenses 1639.58 36.09 1359.43 32.60
8 U/W (Loss) (1820.36) 40.07 -1564.64 37.52
9 Investment Income 2021.70 44.50 1570.75 37.67
10 Other Income -60.66 1.34 53.00 1.27
11 Profit before Tax (PBT) 140.68 3.10 59.11 1.42
DIR
EC
TD
IRE
CT
DIR
EC
TD
IRE
CT
DIR
EC
TO
RS
’ RE
PO
RO
RS
’ RE
PO
RO
RS
’ RE
PO
RO
RS
’ RE
PO
RO
RS
’ RE
PO
RTT TTT

14
Estbd. 1919
fn U;w bafM;k ,';ksjUl da- fy-THE NEW INDIA ASSURANCE CO. LTD.
Note : Percentage shown in sr. no. 1 & 2 indicates the growth over previous year and the percentageshown in sr. no. 3 to 11 is percentage to ‘Earned Premium.’
B. FOREIGN OPERATIONS :
The gross premium is Rs. 1427.79 crore in 2009-10 as against Rs. 1376.89 crore in 2008-09showing an accretion of 3.7%. The net premium is Rs. 1158.07 crore as against Rs. 1164.28crore in 2008-09 showing a marginal fall of 0.5%. The fall is attributed to (a) closure of ouroperations in Saudi Arabia as an agency (b) fall in exchange rate of pound vis –a-vis rupee (c)negative accretion in UK due to the company’s decision not to underwrite business from theCaribbean and Central American territories during the current year.
The foreign operations showed underwriting profit of Rs. 100.63 crore in 2009-10 as againstunderwriting profit of Rs. 78.08 crore in 2008-09. The operations showed net profit of Rs. 218.61crores in 2009-10 as against Rs. 194.16 crore in 2008-09. The incurred claims cost is highduring the year due to increase in claims in Japan, typhoon Ondoy claims in Manila and reinsurancerecoveries accounted in Muscat and Dubai in 2008-09.
The foreign exchange earning during the year 2009-10 amounted to Rs. 24.23 crore towardsdividend received from our associate and subsidiary companies (Rs. 8.36 crore) and remittancereceived from foreign offices out of profits (Rs. 15.87 crore).
OVERSEAS OPERATIONAL RESULTSFOR THE YEAR ENDED 31ST MARCH 2010.
(Rs. in crore)
Sr. No PARTICULARS 2009-10 2008-09
Rs. % Rs. %
1 Gross Premium (Gross Direct plus 1427.79 3.7 1376.90 20.4Accepted)
2 Net Premium 1158.07 -0.5 1164.28 24.9
3 Incurred Claims 679.04 58.6 545.83 46.9
4 Commission 291.14 25.1 311.82 26.8
5 Expenses of Management 93.32 8.1 104.84 9.0
6 Exchange Gain/ Loss Other Income / -3.38 -0.3 -2.54 -0.2Outgo
7 Underwriting Profit / Loss before Reserve 91.19 7.9 199.25 17.1Strain
8 Reserve Strain / Release -9.44 0.8 121.17 10.4
9 Underwriting Profit / Loss after Reserve 100.63 8.7 78.08 6.7Strain
10 Investment Income 117.98 10.2 116.08 10.0
11 Net Profit / Loss 218.61 18.9 194.16 16.7
i) Percentage shown in sr. no. 1 & 2 indicates the growth over previous year and the percentageshown in sr. no. 3 to 11 is percentage to ‘Net Premium.’
ii) Country-wise details are appended as “Annexure-I”.
DIR
EC
TD
IRE
CT
DIR
EC
TD
IRE
CT
DIR
EC
TO
RS
’ R
EP
OR
OR
S’
RE
PO
RO
RS
’ R
EP
OR
OR
S’
RE
PO
RO
RS
’ R
EP
OR
TTTT T

okf"kZd fjiksVZANNUAL REPORT 2009-10
15
IV. PLAN for 2010-11 :
Domestic
“New India” has achieved another milestone by surpassing gross direct premium income(GDPI) of Rs.6000 crore. for the year 2009-10 and proved its undisputed leadership in generalinsurance industry.
Premium completion : 2009-10 Rs. 6042.52 crore
Premium completion : 2008-09 Rs. 5508.83 crore
Growth rate : 2009-10 Rs. 9.69%
Premium target : 2010-11 Rs. 6960 crore
Targeted growth rate : 2010-11 15.18%
The year ahead will be of consolidation. Premium rates have started stabilizing and anagreement has been reached at General Insurance Council level to have uniform deductiblesin the industry for other than large risks.
“New India” being largest company has lot of in-built strength and capacity to underwrite bigbusinesses. Main growth areas identified are :
� Our leadership position in large risks will be our strong point and we will consolidate it.We will focus on mega power projects, infra projects, energy risk as well as aviationand marine hull insurance.
� Infrastructure projects have taken front seat in development across the country includingmajor power projects, express highways, metro rail, networking, port development,airports of international standards, shopping malls etc. The projects are private – publicfunded and lot of global investment is pouring in. Naturally, insurance covers ofinternational standards are in demand. This has given boost to MEGA project tailormade insurance policies. New India leads in tapping this new and challenging market.
� Manufacturing sector also has accelerated its growth. On this front also variety of riskcoverages are in demand, both in size and complexity. New India leads in this sectoralso by offering appropriate MEGA or IAR policies.
� With estimated growth of gross direct premium of 8.5%, disposable income in thehands of individual will increase, which will give boost to growth of health and otherpersonal line of Insurance.
� Auto industry growth has surpassed all the expectations and is growing at a very fastpace this year also. This is likely to give incremental growth together with our focuson existing renewals.
� Under agents performance enhancement programme (APEP), an initiative under ProjectNew Energy, new reward scheme has been launched to encourage company’s directagents to market personal lines of insurance and this has yielded good results.
� Channel partners like brokers and bancassurance would continue to contribute tocompany’s growth. Steps have been taken to have more and more strategic partners.
Foreign
The premium target for 2010-11 is Rs. 1631.20 crore (gross) against completion of Rs. 1427.79crore in 2009-10 and Rs. 1376.47 crore (net) against completion of Rs. 1158.07 crore in2009-10.
DIR
EC
TD
IRE
CT
DIR
EC
TD
IRE
CT
DIR
EC
TO
RS
’ RE
PO
RO
RS
’ RE
PO
RO
RS
’ RE
PO
RO
RS
’ RE
PO
RO
RS
’ RE
PO
RTT TTT

16
Estbd. 1919
fn U;w bafM;k ,';ksjUl da- fy-THE NEW INDIA ASSURANCE CO. LTD.
V. ORGANISATION STRUCTURE
Domestic
The company has entered a phase of consolidation and restructuring of offices. The companyhas converted 59 offices as specialized offices to take care of bancassurance, brokers andauto tie-ups.
As on 31.03.2010, the company has a network of 26 Regional Offices, 395 Divisional Offices,591 Branch Offices, 27 Direct Agent Branches and 23 Extension Counters, totaling 1062 offices.
Foreign
The company operates through a network of 9 branches, 7 agencies, 4 associate companiesand 3 subsidiary companies (including 1 fully owned subsidiary) in 23 countries.
VI. PROJECT NEW ENERGY – BUSINESS TRANSFORMATION EXERCISE
The business process re-engineering exercise, which was initiated in New India in September2007, to reorient the company to meet the challenges of competition and customer expectations,has reached the stabilisation stage as of March 2010. The initiatives are showing good results,and our organisation has steadily crossed the milestone of Rs.6000 crore. (Indian businessonly) in spite of massive rate reduction after de-tariffing and severe competition in all fronts.
For the re-engineering exercise, a prioritized roadmap was developed by the New Energy(BPR) team, consisting of initiatives in three waves, with a tight monitoring programme. A briefaccount of the targets and results achieved under each initiative is given hereunder.
Strategic initiatives :
� Large Corporate Regional Offices were launched in Mumbai & Delhi in order to providededicated service and organizational focus to corporate clients and governmentaccounts.
� Auto tie-up specialised offices were launched for capturing greater share of motorthrough original manufacturers as well as to establish dealer relationships. Focus isalso on innovative product design and pricing.
� Specialised offices were carved for brokers and bancassurance specialized channels.
� Processes & IT have been redesigned and refined in order to improve speed andefficiency of underwriting and claims processes through consolidation.
� Claim hubs have been created for centralized claim processing in all Regional Officecentres.
� Agents performance enhancement program (APEP) has been implemented to re-energize agents channel through better development, support and aligned incentives
� Health and third party administrator (TPA) management is an initiative to improvehealth profitability through hospital relationships and improved TPA performance
� In the realm of human resources management (HRM), the new performancemanagement system (PMS) has been introduced. Overall structure of PMS andincentives has been charted, with targets and action plan.
DIR
EC
TD
IRE
CT
DIR
EC
TD
IRE
CT
DIR
EC
TO
RS
’ R
EP
OR
OR
S’
RE
PO
RO
RS
’ R
EP
OR
OR
S’
RE
PO
RO
RS
’ R
EP
OR
TTTT T

okf"kZd fjiksVZANNUAL REPORT 2009-10
17
� Motor third party (TP) claims management process has been redesigned for reducingpayouts and decreasing backlog of TP claims. TP Cells have been created for focusedand speedy settlement of claims. Simultaneously, expeditious settlement of TP claimsis being taken up through DICC/ RICC and Lok Adalats, thereby improving the TPclaim settlement ratio.
� Cash management system (CMS) and investments process too, have been improvedfor driving higher returns, reduction in float, streamlined process and better vendornegotiation/ management
These new energy initiatives have redefined the company’s approach to business performance.Their implementation is producing positive impact, vis-à-vis customer servicing, premiumaccretion and profitability. Simultaneously, implementation of the redesigned performancemanagement system with incentive structure is expected to translate into highly motivatedwork force, with improved productivity.
VII. FIRE & ENGINEERING BUSINESS
Fire Department
In fire insurance the company has succeeded in increasing its premium by 19.41% (4% for theprevious year) during the current financial year despite the challenges posed by the liberalisedmarket. This was achieved through a disciplined approach of effective service resulting ingreater customer satisfaction.
The current incurred claims ratio of 61.65% - as against 89.5% in the previous year waspossible mainly due to initiatives taken at the underwriting level, better claims management byinspection of major losses by company officials and periodic review of pending claims.
The company has responded proactively to two major catastrophic losses – ‘Southern floods’in the month of Sept / Oct. 2009 in the states of Andhra Pradesh, Karnataka, Goa andMaharashtra and a large fire/explosion loss in the month of Oct./ Nov. 2009 of IOCL at Jaipurand settled majority of claims to the satisfaction of the insured / clients.
The company has set a target of Rs.1060 crores as against completed premium of Rs.923crore with a growth of 16% which we are confident of achieving through better supervision andcontrol.
Engineering Department
Company’s engineering department has shown commendable growth of 20% over the previousyear in the face of cut-throat competition prevailing in the Indian market. This has been possiblebecause the company has been proactive in its support to the infra-structure development ofthe country. At the same time through prudent underwriting and loss control measures, companyhas been able to contain loss ratio at 40%. Company will strive to ensure that the trend furtherimproves in the future.
VIII. RURAL INSURANCE, SOCIAL SECTOR INSURANCE AND SPECIAL SCHEMES
The New India Assurance is a pioneer non-life insurance company insuring all types of assets,belongings and lives of rural and social sector in the country.
DIR
EC
TD
IRE
CT
DIR
EC
TD
IRE
CT
DIR
EC
TO
RS
’ RE
PO
RO
RS
’ RE
PO
RO
RS
’ RE
PO
RO
RS
’ RE
PO
RO
RS
’ RE
PO
RTT TTT

18
Estbd. 1919
fn U;w bafM;k ,';ksjUl da- fy-THE NEW INDIA ASSURANCE CO. LTD.
Insurance covers provided by the company are need-based/tailor-made for the benefit of ruraland social sectors. During this financial year, company has covered wider rural and socialsector and procured about 580 crore premium from these sectors.
The details of rural/social sector covers specially designed during the year are detailed herewith.
� Insurance of fishermen in Orissa: It is a comprehensive group JPA policy given to
fishermen under FISHCOPFED covering 8,00,000 persons procuring a premium ofRs.2.24 crore.
� Plantation insurance : The company has designed a new innovative cover for tissueculture date palm and many other plantations in the rural sector. The premium procuredunder these schemes is Rs.2.24 crore.
� Special insurance schemes for high yielding cattle: This scheme is implementedunder centrally sponsored special livestock development project in various states ofthe country. Company has procured Rs.5 crore under this scheme in Uttar Pradesh,Haryana, Himachal Pradesh, Tamilnadu & Andhra Pradesh.
� Insurance of Drip Irrigation- Multi-periled lift irrigation policy: The drip irrigationutilities of farmers in drought prone areas around Baroda & Gujarat are covered underspecial package policies through Gujarat Green Revolution, a subsidiary of GujaratState Fertilizer Co. Ltd. During this year, 50,000 farmers are covered for a premium ofRs.3.98 crore.
� Emu bird insurance : Emu a relative bird of Ostrich family, is reared by farmersi nvarious places of India for breeding purposes. Company has devised a special policyfor covering these birds and procured premium in states of Maharashtra, AndhraPradesh and Kerala.
� Janata Personal Accident Policy for Kisan Credit Card Holders: The companyhas agreement with several leading banks like State Bank of India, Bank of Baroda,Union Bank of India, Central Bank of India, various Regional Rural Banks and Co-operative Banks for coverage of farmers having Kisan Credit Card under JanataPersonal Accident Policy. The Company has covered more than 50 lakh farmersunder this scheme and procured premium of Rs.3.80 crore.
� Elephant insurance : Company has devised a special package cover under elephantinsurance covering religious and commercial purpose elephants against accidents,diseases, cremation expenses, tranquilization expenses, along with third party personalinjury and thirty party property damage due to the acts of elephants. Also, personalaccident, treatment expenses, medical expenses for their Mahouts are covered.
� Farmers’ Package Insurance : This is a composite package policy covering farmer’shouse, assets, cattle, livestock, agricultural implements, tractors and personal accidentbenefits. Company has covered about 31,200 farmers with premium of 12.55 crore.
Apart from the above the company during this year has extended Rural Group JanataPersonal Accident coverage benefits as a welfare measure to the beneficiaries/members of the following institutions/banks during 2009-10:
DIR
EC
TD
IRE
CT
DIR
EC
TD
IRE
CT
DIR
EC
TO
RS
’ R
EP
OR
OR
S’
RE
PO
RO
RS
’ R
EP
OR
OR
S’
RE
PO
RO
RS
’ R
EP
OR
TTTT T

okf"kZd fjiksVZANNUAL REPORT 2009-10
19
Sr. No. Name of Institutions/Banks Premium (Rs.in Lakh)
1 Malegaon Merchant Co.op.Bank 3.22
2 Guntur Dist.Co.op.Bank 35.10
3 Hasti Co.op.Bank, Dondaicha 5.30
4 Government & Semi-Govt. Admn. Employees’ Assn., Nagpur 10.44
5 Jalgaon Muncipal Corpn., Tax Payees 26.00
6 Babasaheb Ambedkar Sahakari Sakhar Karkhana, Aurangabad 2.50
7 Nandurbar Co.op.Society 0.70
8 Vidhyut Mandal Kamgar Sah.Pat Sanstha, Aurangabad 2.81
9 Shree Agrasen Co.op.Bank, Aurangabad 0.81
10 JPA to Sugarcane Cutters to Beed, Nasik, Ahmednagar Dist. 15.00
11 The Buldhana Dist.Central Co.Op.Bank, Buldhana 91.35
12 The Mula Pravara Electric Co.Op.Soc.Ltd. 3.14
13 Zilla Parishad Sahakari Pat Sanstha 0.96
14 GJPA for Fishermen of Odisha State, FISHCOPFED 224.00
Performance of major products of rural sector, social sector and special schemes for the past fiveyears is appended hereto as Annexure II to directors’ report.
IX. TECHNO MARKETING
New India has a techno marketing department, which plays a proactive role in devisinginnovative insurance solutions for the large corporate in the Indian market. The process involvesidentification of mega risks in India through various sources, constant liaison and vigorousfollow-up to convert opportunities into premium income for the company.
New India continues to dominate the Indian mega risk U/W market. Total premium of Rs.380.12crore. was written during 2009-10. Out of the total about 150 mega risks existing in the country(operational as well as projects), New India retains the dominant position by writing 77 risks asleaders and 57 risks as co insurer.
In case of operational policies, the Company procured premium of Rs.276 crore. (with aleadership share of Rs.177 crore. i.e. 64.13%)
In case of project policies, the company procured premium of Rs.83.40 crore. (with a leadershipshare of Rs.79.55 crore. i.e. 95.38%). More and more infrastructure projects are coming-up inthe country including large power plants with capacities more than 2000-2500 MW and NewIndia dominate the scene in this sector also.
Many mega risks availed terrorism cover from international market. By efficiently sourcing theterrorism capacity, New India earned a premium income of Rs.20.72 crore. (with a leadershipshare of Rs.15.34 crore i.e. 74.03%).
In the backdrop of entry of more and more players and the stiff competition in mega risksinsurance market, the premium earned is quite sizable.
The company will continue to maintain the lead position by writing more and more mega risks,especially new projects, on the strength of underwriting capacity, competence and experience.
DIR
EC
TD
IRE
CT
DIR
EC
TD
IRE
CT
DIR
EC
TO
RS
’ RE
PO
RO
RS
’ RE
PO
RO
RS
’ RE
PO
RO
RS
’ RE
PO
RO
RS
’ RE
PO
RTT TTT

20
Estbd. 1919
fn U;w bafM;k ,';ksjUl da- fy-THE NEW INDIA ASSURANCE CO. LTD.
X. BANCASSURANCE AND BROKERS’ DISTRIBUTION CHANNEL
The company has bancassurance (corporate agency) tie-ups with State Bank of India, UnionBank of India, Corporation Bank , Central Bank of India and Catholic Syrian Bank and referralarrangements with 28 Co-operative banks /RRBs. Through bancassurance channel premiumof Rs.327.04 crore has been generated in FY 2009-10 registering growth @ 9% over previousyear. The bancassurance distribution channel has been quite cost effective as well as profitable.There are 23 bancassurance specialized offices to service banks exclusively under tie-ups.Premium of Rs.82.79 crore has been procured in the current FY through specialized officesregistering 33% growth.
Through the broker’s channel premium of Rs.525.28 crore has been generated in the FY2009-10 registering growth @ 43%. There are 13 broker’s specialized offices to cater to brokersexclusively. Premium of Rs.223.50 crore has been procured in the current FY throughspecialized offices registering 36% growth.
XI. MOTOR LOSS CONTROL MEASURES
With a view to accomplish management’s directive to arrest the high number and amount ofoutstanding motor accident claims, special focus areas were determined and plan chalked outto reduce the motor combined incurred claim ratio (ICR) and in particular the third party(TP)claim ICR. During the year, review of motor TP claim files helped elimination of multipleprovisions for same claims in different offices, closing claims in the computer system whichwere omitted to be done earlier etc. resulted in better house keeping and provisioning. Whilehigher awards of MACT courts continued to be a drain, suggestions mooted for an overhaul ofthe Motor Vehicles Act and accepted by the government could be seen to be taking shapethrough a new bill introduced in the Rajya Sabha in the earlier year. This was subsequentlyreferred to a select committee for a complete relook. Hopefully, this new Act would addressmost of the concerns of the insurers as well as the insuring public in the larger interest of all.
The web enabled system introduced last year to issue online motor policies in line with theexpectations of the retail market has covered most of the offices across the country. Barring acouple of offices all other offices had become operational in respect of motor policies.
Motor Own Damage (OD)
Initiatives for centralized settlement of claims through setting up of claim hubs specifically formotor OD claims (already set up at 25 centers covering over 300 operating offices) started tobring-about improved customer satisfaction. We also expect marked improvement in qualityof assessment and settlement of claims through these hubs.
Motor OD premium has had a reasonable accretion of 8% even as competition and discountsseemed to counter increase in fresh business. The business is expected to increase furtheronce the favorable response to claim hubs gathers momentum. (Surveyors’ panel reviewed in17 ROs).
Motor Third Party (TP)
An increased focus on motor TP claims were initiated:
Target of reducing the outstanding claims in 2010-11 set at 10,000 as compared to the previousyear.
Special drive launched to reduce and eliminate orphan claims outstanding for over a year.
Regional in-house conciliatory committee (RICC) & divisional in-house conciliatory committees(DICCs) formed with target of settling a minimum number of TP cases per month for eachhandling office in RICC/DICC, besides drive to settle maximum cases in Lok Adalat.
DIR
EC
TD
IRE
CT
DIR
EC
TD
IRE
CT
DIR
EC
TO
RS
’ R
EP
OR
OR
S’
RE
PO
RO
RS
’ R
EP
OR
OR
S’
RE
PO
RO
RS
’ R
EP
OR
TTTT T

okf"kZd fjiksVZANNUAL REPORT 2009-10
21
A concerted effort initiated to ensure that physical verification of pending files was done of allTP claims by all operating offices and inter-office reconciliation done regularly.
Communicated management’s directive down the line and ensure focus on TP claims by visitingROs and reviewing their performance on one to one basis with DO in-charges.
Meetings with advocates / investigators at many centers held.
Special workshops held in Aurangabad (for Southern & Western zone regions) & at Amritsar(for Eastern & Northern zone regions) where detailed deliberations were held with top executivesof ROs on the endeavors & plans on motor TP and steps were chalked out for each RO.
Thanks to this focus on motor TP claims, outstanding number of TP claims was reduced byover 20,000 claims and TP claims outstanding amount at year end reduced by Rs. 456 crorescompared to previous year. The orphan claims have substantially been reduced and increasedsettlements through conciliatory settlements have reduced outgo lower than the provisions.Lok Adalat manual was released immediately after the end of the year under review.
This exercise of loss reduction is being pursued with renewed vigor and target of reduction inclaims kept at 33% of the new and existing claims for 2010-11. New TP claim hubs at about 15new centres are also planned for this year. Strengthening of the department by allotting newofficers has also been done.
XII. CLAIMS SETTLEMENT AND AGEWISE ANALYSIS
The company had taken target of 90% claims settlement in respect of non-suit claims. Theactual ratio in respect of non-suit claims in 2009-10 is 90.30%.
However, the overall claims settlement ratio including suit claims (comprising mainly of motorTP claims) is 75.74% in 2009-10.
Number of claims outstanding as on 01.04.2009 374130
Number of claims intimated during 2009-10 1165968
Number of claims settled during 2009-10 1166501
Number of claims outstanding as on 31.03.2010 373597
Age-wise classifications of outstanding claims as on 31.03.2010 is given below :
Claims outstanding for less than three months 61648
Claims outstanding for more than three months but less than one year 84101
Claims outstanding for more than one year 227848
Total 373597
Out of a total 373597 pending claims as on 31st March 2010, 261781 claims are motor TPclaims which are pending at various MACTs across the country.
XIII. REINSURANCE
Due to climate changes, global meltdown and credit squeeze there were apprehensions thatthe reinsurance rates would firm up. Indications after the 1st January 2009 renewals the worldover was that the rates in Asian sub-continent would be more or less stable and there wouldbe no reduction in capacity.
DIR
EC
TD
IRE
CT
DIR
EC
TD
IRE
CT
DIR
EC
TO
RS
’ RE
PO
RO
RS
’ RE
PO
RO
RS
’ RE
PO
RO
RS
’ RE
PO
RO
RS
’ RE
PO
RTT TTT

22
Estbd. 1919
fn U;w bafM;k ,';ksjUl da- fy-THE NEW INDIA ASSURANCE CO. LTD.
Proportional treaty capacity was under strain due to de-tariffing and reducing treaty balancesfor re-insurers. However, for the year 2009-10 New India was in a comfortable position with allits non-proportional and proportional treaties placed with top rated securities.
Most of our proportional and non-proportional reinsurers are continuing participation in ourtreaties over a period of time and it has been our endeavour to maintain long standingrelationships with them.
During the year under review through two catastrophic losses and two risk losses were reported,the impact on the treaties is expected to be only marginal.
XIV. INFORMATION TECHNOLOGY
The company had embarked on establishing a centralized web based insurance systemssolution (CWISS) focusing on providing value added 24x7 services to the customer usingmultiple-channels with a single view for the customer.
The project included rolling out the core insurance applications for the insurance lines ofbusiness and Oracle Financials for the complete accounting and financial package and alsoencompassed the peripheral applications including CRM with a Grievance module and CallCenter, various portals, Dealers Portal, Customers Portal, Brokers and Agents’ Portal, EmployeePortal, Business Intelligence, Bilingual/ Multilingual policies, Document Management Systemsand various modules of a integrated HRMS package with People Soft Payroll etc.
The year gone by had the motor line of business rolled-out in 996 offices and two more linesviz aviation and credit shield fully rolled-out which covers nearly 35 % of the premium incomeand 70% of documentation. The engineering line of business has been rolled-out in three pilotoffices. The Core Insurance Solution will be integrated with multiple communication channelslike Internet, e-mail, mobile and Interactive voice and Call Center.
All the remaining lines of business will be completed in the ensuing year. The portals are in thefinal stages of testing and will be put into production shortly enabling customers to get theirpolicies online. The Grievance module is in operation across all offices which has definitelyimproved the redressal mechanism and ensured better monitoring of grievance redressal.The Customer Relationship Module when fully deployed will go a long way in customer retentionand building customer loyalty and help in cross-selling and up-selling. The integrated HRMSmodule has various modules which will go a long way in better deployment and managementof human resources and also enable employees to view status of various applications madeby them.
The company plans to replace outdated hardware with a proper buy back and e-wastemanagement policy. Laptops have been provided to all Divisional Managers and Scale V andabove officers. Initiatives are being taken to save energy, cost and to go green in IT procurement.
The company is also involved in imparting regular training to employees to ensure thatemployees are abreast with new systems and are able to better handle the new software andCWISS applications.
DIR
EC
TD
IRE
CT
DIR
EC
TD
IRE
CT
DIR
EC
TO
RS
’ R
EP
OR
OR
S’
RE
PO
RO
RS
’ R
EP
OR
OR
S’
RE
PO
RO
RS
’ R
EP
OR
TTTT T

okf"kZd fjiksVZANNUAL REPORT 2009-10
23
XV. HUMAN RESOURCE DEVELOPMENT
Particulars of Employees and Recruitment
The number of employees recruited during the year and the employee strength as on31st March 2010 are shown below :
Category Number of Total Number ofRecruitment Employees
Class I 272 5941
Class II (Marketing) NIL 1947
Class II (Administration) NIL 600
Class III NIL 9032
Class IV (Excluding Part Time Sweepers) NIL 2049
Part Time Sweepers NIL 389
Total 272 19958
Training :
The company’s training set-up is as under:-
� One Corporate Training College in Mumbai,
� Two Zonal Training Centres at Kolkata and Chennai and
� Twenty one Regional Training Centres.
Besides, Thirty three agents Training Centres operating throughout the country for training ofagents.
The company endeavors constantly to upgrade the knowledge and improve skills of itsemployees through regular training programmes conducted at our above training centers.
The company also nominates its employees for training at National Insurance Academy atPune, co-promoted by the company along with its public sector counterparts and LIC. It impartsinsurance training of a high degree to the Insurance professionals. The Academy also offersresearch facilities in the field of insurance.
Apart from training facilities offered at its own training centers and National Insurance Academy,Pune, the company nominates its employees to various technical and personality developmentprogrammes, policy awareness and updation programmes organized by external instituteslike College of Insurance, ASSOCHAM, CBI Academy, Gaziabad, Institute of PublicAdministration, Bombay Chambers of Commerce & Industry, Institute of Actuaries of India,FICCI, Academy of Resource Management, BSE etc.
Executives and officers also attended international seminar, conference, trainings conductedby IMIA, Istanbul, Avon Insurance, London, M/s Richards Hogg & Lindley London, Rendes-Vous De Septembre etc.
DIR
EC
TD
IRE
CT
DIR
EC
TD
IRE
CT
DIR
EC
TO
RS
’ RE
PO
RO
RS
’ RE
PO
RO
RS
’ RE
PO
RO
RS
’ RE
PO
RO
RS
’ RE
PO
RTT TTT

24
Estbd. 1919
fn U;w bafM;k ,';ksjUl da- fy-THE NEW INDIA ASSURANCE CO. LTD.
The details of training programmes attended by the employees for the period from 01/04/2009to 31/03/2010 are given in the table below:-
CENTRES TOTAL NO.OF TOTAL NO.OFPROGRAMMES PARTCIPANTS
NIA, PUNE 92 381
COLLEGE OF INSURANCE 1 02
EXTERNAL INSTITUTES 15 25
TRAINING ABROAD 09 12
CTC 59 1036
TOTAL 176 1456
● TRAINING ACTIVITES AT CORPORATE TRAINING COLLEGE DURING 2009-10.
Company has its own Corporate Training College at Andheri, Mumbai, which caters to trainingneeds of officials mainly in scale I, II and III. Apart from conducting refresher courses in variousbranches of non-life insurance, the college also conducts programmes on management subjects.Management development programmes (2 modules) are targeted at officers promoted fromwithin class III. Having regard to changing training requirements, college has introduced trainingprogrammes on several new topics viz. Marketing Strategies, Risk Management, CommunicationSkills & Customer Service, programme for legal officers etc. college also conducted programmesspecifically targeted for women officers/employees and for retiring officials.
During 2009-10, Corporate Training College conducted 59 programmes covering 1036 officials.Of these, 224 officials were from schedule caste category, 86 from schedule tribe, 70 fromother backward classes and remaining 656 from general category. On behalf of I.T. departmentHead Office, college also facilitated conduct of 43 CWISS related programmes covering 1071officers/employees. Thus, during the year, 102 programmes were conducted at college covering2107 officers/employees.
During 2010-11. Corporate Training College plans to conduct 75 programmes covering over1500 employees. Programmes to be conducted on behalf of I.T. department will be over andabove these projections.
Scheduled Caste (SC), Scheduled Tribe (ST), Other Backward Class (OBC), People withDisabilities (PwD) and Ex-servicemen
The representation of SC/ST in various cadres as on 31.03.2010 is as under :-
Category/ Level Total Nos. Number of Percentage of
SC ST SC ST
Group A (Officers) 5941 1224 337 20.6 5.67
Group B (Development OfficersMarketing and Administration) 2547 252 72 9.89 2.82
Group C (Clerical) 9032 2018 704 22.34 7.79
Group D (Sub staff) 2049 827 161 40.36 7.85
Part Time Sweepers 389 256 32 65.8 8.22
Total 19958 4577 1306 22.93 6.54
DIR
EC
TD
IRE
CT
DIR
EC
TD
IRE
CT
DIR
EC
TO
RS
’ R
EP
OR
OR
S’
RE
PO
RO
RS
’ R
EP
OR
OR
S’
RE
PO
RO
RS
’ R
EP
OR
TTTT T

okf"kZd fjiksVZANNUAL REPORT 2009-10
25
The company strictly follows the government guidelines regarding reservations, concessionsand safeguards to employees belonging to SC/ST/OBC/PWD and Ex-servicemen.
SC/ST & OBC Cells are actively functioning at the Head Office and all Regional Offices. LiaisonOfficer under the charge of Chief Liaison Officer assist this cell at Head Office, whereas AssistantLiaison Officer heads the Cells at various Regional Offices.
Once in a year, the Liaison Officer from the Head Office inspects the rosters pertaining torecruitment and promotions at all Regional Offices. The inspection reports, with the observationsto Liaison Officer, are put up to the General Manager (Personnel) and Chief Liaison Officer forfurther directions and sent back to the respective Regional Offices. Based on the inspectionreport, efforts are taken by the concerned Regional Office in coordination with the Head Officeto clear the backlog and rectify the shortcomings in the procedure, if any, observed by theLiaison Officer.
The grievances and complaints are investigated and resolved immediately.
Pre-promotional training programmes were imparted to all eligible SC/ST employees forpromotion to various cadres.
Similarly, within Class III and Class III to I, pre-promotional training is extended to SC/ST/OBCemployees under Dr. B.R. Ambedkar Welfare Trust. Regular training Programmes are conductedon personality development, stress management, motivation etc for SC/ST employees of variouscadres. Various benefits under Dr. B. R. Ambedkar Welfare Trust has been given to SC/ST/OBC employees. SC/ST/ OBC Liaison Officers two days workshop has been conducted duringthe year. SC/ST employees have been nominated for NIA training programme Pune on regularbasis.
We are providing financial support on behalf of Dr. B. R. Ambedkar Welfare Trust, to SC/STWelfare Groups for distribution of Free JPA policy to the people of downtrodden community onthe eve of Mahaparinirvan day i.e. 6th December of Dr. Babasaheb Ambedkar at Chaitya Bhomi,Dadar, every year.
Staff Welfare Schemes
Many welfare schemes for employees and their families viz. Group Savings Linked InsuranceScheme, Group Term Insurance Scheme, Group Mediclaim Policy covering hospitalizationexpenses, Lump sum Domiciliary payments, Group Personal Accident Policy (having 24 hoursaccident cover), Baggage Policy, Special leave and medical expenses reimbursement underaccident whilst on duty, Exgratia relief for uncovered medical expenses for high cost/protractedtreatment, Incentives for family planning, financial assistance for post-graduate managementcourses, Employees Deposit Linked Insurance Scheme and also housing loan at subsidizedrate of interest, have been continued.
The company has introduced online access for the said benefits to the employees as alsoimparted training on the same to them. This will facilitate transparency and immediate informationto the employees.
� Gender Issues and Empowerment of Women
The company has a strong women force equipped with adequate opportunities for self andcareer development. The details of Significant Posts held by Women Officers are asfollows:
GM 1
CRM 1
DIR
EC
TD
IRE
CT
DIR
EC
TD
IRE
CT
DIR
EC
TO
RS
’ RE
PO
RO
RS
’ RE
PO
RO
RS
’ RE
PO
RO
RS
’ RE
PO
RO
RS
’ RE
PO
RTT TTT

26
Estbd. 1919
fn U;w bafM;k ,';ksjUl da- fy-THE NEW INDIA ASSURANCE CO. LTD.
DM/ SDM 14
BM/ SBM 18
Foreign Postings 4
� On recommendations of the Head Office Women’s Committee, sexual harassment atworkplace has been incorporated as misconduct in our CDA Rules after approval from theBoard of Directors.
� Efforts are made to educate the women employees on legal provisions and facilities withinthe organisation, towards safe and healthy work atmosphere. These programmes areconducted at CTC and are aimed towards harmonious inter-personal relations andunderstanding.
� Company’s representatives participate in various programmes such as the National Meetof Women in Public Sector, programme on ‘Managing High Profile Portfolio In CorporateSector.’ and similar events conducted throughout the year.
●●●●● Industrial Relations
Industrial relations in the company during the financial year continued to remain pleasant, co-operative and efficient. Through deliberations and discussions across the table, issues weresorted out amicably. In order to protect the interest of the women employees in the companyand to provide proper, safe and secured working conditions, Conduct, Discipline and Appealrules have been amended. In tune with the guidelines prescribed by the
Hon’ble Supreme Court of India in the case of Vishaka v. State of Rajasthan, we haveincorporated one specific clause in CDA rules, with a provision to prevent sexual harassment atworkplace and to treat sexual harassment as ‘misconduct’. In addition, the CDA rules havebeen displayed in the intranet of the company which is accessible to all the employees.
● Sports Activities
� For the first time in the history of New India, sports club organized All india singing competitiontitled as “Voice of New India”. The event received overwhelming response across thecountry.
� In Kabaddi, company’s team participated and won “A” division. Shivaneri Raja Ram GoldTrophy and runners up in Mumbai dist. Kabaddi Association tournament our player NileshTawade (contract player) has been honoured in both the tournaments.
� In cricket as host company have successfully organized All India Public Sector Sportspromotion Board’s, T-20 cricket tournament in Mumbai. The company’s team were runnerup in Corporation Shield Cricket Tournament, Mumbai.
� In Table Tennis company’s team have participated and became runner up in the officer’stournament and also participated in All India public sector tournament, Coimbatore anddistrict level championship at Mumbai.
� Also participated in All India public sector Carom tournament at Chennai.
XVI. OFFICIAL LANGUAGE IMPLEMENTATION
� Hindi Training
Five days training programmes for all classes of employees not possessing workingknowledge of hindi were organised at Bengaluru, Chennai, Coimbatore, Kolkata,
DIR
EC
TD
IRE
CT
DIR
EC
TD
IRE
CT
DIR
EC
TO
RS
’ R
EP
OR
OR
S’
RE
PO
RO
RS
’ R
EP
OR
OR
S’
RE
PO
RO
RS
’ R
EP
OR
TTTT T
okf"kZd fjiksVZANNUAL REPORT 2009-10
27
Bhubneshwer, Guwahati and Vizag. 137 employees were imparted working knowledge ofHindi. Cash prizes amounting Rs. 1,37,000/- were distributed to the successful participantemployees.
� Conference
All India Hindi Officers’ Conference was held at Aurangabad (Maharastra) on 21-22November 2009. Integration of language policy with main stream and growth of insurance,expansion of company’s market share with help of hindi and Indian languages, Micro financeand rural and social sector were subjects discussed during the event. Compilation ofdeliberations (on micro insurance) was published by Hindi department.
� Incentive Scheme for Writing Technical Books in Hindi
Consolation prizes to (1) Davendra Mishra Rs.15000/-, (2) Amrish Sinha Rs. 11000/- and(3) V.B.Tiwari Rs. 7000/- were awarded. Amount of Rs. 33,000/- was disbursed under thescheme.
The scheme introduced in the year 2007 was amended for addition of three more prizes(Rs. 15000/-, Rs. 11000/- & Rs. 7000/-).First prize of Rs. 2,00,000/- now shall be consideredfor lifetime contribution in technical literature in Hindi.
� Incentive Scheme for Work done in Hindi
The scheme revised in 2007 is implemented and popular in region ‘B’ & ‘C’ .
� Publication of House Magazine ‘Arjan’
Two issues consisting 80 pages each were published.
� Inspection
Inspection of progressive use of Hindi was carried out at 65 offices.
� Inspection by the Parliamentary Committee on Official Language
Third sub-committee of Parliamentary Committee on Official Language reviewed positionand progress of Hindi in the company and Chattarpur Branch in particular. Madam AlkaKshtriya, Convener and other Honorable members of the committee are satisfied withCompany’s achievements and efforts taken for promotion of use of Hindi and other Indianlanguages in the company.
� Promotion of Hindi & other Indian Languages
The company has decided to translate all documents pertaining to ten polices in languagesspecified in the 8th schedule of the Constitution. The policies are : Janata Personal AccidentPolicy, Personal Accident Policy, Cattle Insurance Policy, Farmer Package Policy,Householder Insurance Policy, Shopkeeper Insurance Policy, Micro Insurance, UniversalHealth Insurance Policy, Mediclaim 2007, Rajrajeshwari Mahila Kalyan Policy.
� This is a step towards inclusive growth and expansion of NEW INDIA’s market share aswell as insurance propagation among masses which provide wider customer base.
� Translation of Manuals
All new health polices (i.e all 6 documents) as well as Reservation policy manual havebeen translated in Hindi and Marathi. Similarly Personnel manual including CDA rules
DIR
EC
TD
IRE
CT
DIR
EC
TD
IRE
CT
DIR
EC
TO
RS
’ RE
PO
RO
RS
’ RE
PO
RO
RS
’ RE
PO
RO
RS
’ RE
PO
RO
RS
’ RE
PO
RTT TTT

28
Estbd. 1919
fn U;w bafM;k ,';ksjUl da- fy-THE NEW INDIA ASSURANCE CO. LTD.
(7 Parts), liability, aviation, engineering manuals have been translated in Hindi and vettingis in progress.
� Workshop
90 Hindi workshops were organised at different stations.1413 employees benefited.
XVII. PUBLICITY ACTIVITIES
Publicity and marketing play a vital role of promoting the corporate image and popularizing thecompany’s products among urban, semi-urban and rural masses. No matter what marketshare a brand enjoys one has to market one’s products to keep in pace with the ever-changingscenario of globalisation and stiff competition. Publicity can generate great sales through greatadvertisements. For this, careful planning is a must and that’s what exactly the company hasdone to reach out to the target customers through the various advertising medias.
Electronic media, outdoor media and print media were utilized for publicity purpose. Hoardingsand glow-signs have been placed at many major road junctions, highways, railway stations andairports. Advertisements are also displayed on transit media like buses, trains, baggage trolleysand barricades. Banner display at local events help the company in brand-building in ruralareas.
The company participates in fairs, exhibitions, road shows and also sponsor various socialgatherings, sports and cultural events. It organizes customer seminars, customer awarenesscamps to educate the customers about the various insurance policies and the procedures/requirements for speedy settlement of claims.
This year the company ventured into television and radio activities and the next biggest eventwas sponsored the Mumbai Indian Team of IPL3, T20 along with the franchise, RelianceIndustries Ltd., which has given a tremendous visibility to the customers of all ages and variousgroups not only nationwide but global-wise also.
The company has a strong conviction that the publicity is a tool to reach real masses andeducate them about their insurance requirement.
XVIII. VIGILANCE ACTIVITIES
The Vigilance department comprises of the CVO (GM) , the Chief Manager and vigilanceofficers at Head Office and vigilance officers posted in all 26 Regional Offices.
The focus of vigilance is prevention of frauds by preventive and proactive actions andpunitive action in matter of frauds detected and system lapses.
The vigilance administration comprises of surprise inspections. During 2009-10 thevigilance officers conducted 307 surprise inspections. This is an effective tool fordetecting irregularities /system lapses committed at operational levels and particularlyhelpful for the BM s / DM s for understanding the importance of control andsupervision and identify the weak areas.
Training programmes are held at Corporate Training College to include preventive vigilancein various training modules and awareness programmes are conducted at Regional Officesand Divisional Offices levels. This helps the participants in understanding the facet ofvigilance and the importance of adhering to rules and regulations of the company.
49 awareness programmes were conducted at RO and DO levels to create betterunderstanding of vigilance. newly recruited vigilance officers have attended training at the
DIR
EC
TD
IRE
CT
DIR
EC
TD
IRE
CT
DIR
EC
TO
RS
’ R
EP
OR
OR
S’
RE
PO
RO
RS
’ R
EP
OR
OR
S’
RE
PO
RO
RS
’ R
EP
OR
TTTT T

okf"kZd fjiksVZANNUAL REPORT 2009-10
29
CBI academy - Ghaziabad for better understanding of procedures of disciplinary proceedingsand investigation.
Thus the sole purpose of vigilance department is to make employees focus on andaccept ‘Vigilance’ as an organisational objective, to create an atmosphere conducive to“Zero –corruption “ functioning with role clarity and clear sense of direction.
XIX. INTERNAL AUDIT
Keeping in tune with the last two years practice that has yielded good results, the internal auditdepartment has continued its’ thrust in detecting and rectifying systems and procedural lapses,enhancing the performance of audit compliance cells at the various operating offices for fasterresolution of pending audit queries – both internal and C.A.G. The pending employee recoverycases are now gradually brought to the minimum and this year such cases have nearly becomenegligible as these are sorted-out during the course of audit.
As directed by the Board of Directors – each and every Board and CMD level queries wereexamined age-wise, nature-wise and feed back was obtained and submitted to the board.Resolution of old pending queries was the major thrust.
With the help of H.O., internal audit officials and executives from H.O. – 25 audit workshopswere conducted during the year, which has substantially helped in resolving the pending queriesand in the process, the number has come-down to a great extent. In co-ordination with C.A.G.,two zonal workshops were conducted at MRO-I and Chennai, for compliance of queries andconfirmation of status. The result was extremely encouraging.
In order to streamline the audit department and to enhance its effectiveness the time gap betweenthe conduct of audit and subsequent submission of report has been directed to be reduced tomaximum two weeks. The Regional Office audit teams have been instructed to include “systemaudit” in their audit methodology, so that procedures and methods are further improved.
Audit committee has been closely monitoring the functioning of internal audit department and ina path breaking and unconventional initiative have gone to the micro level and interacted withRegional in-charges and Regional audit in-charges in order to guide and mentor them to performeven better. This hands-on ground level approach of the directors have immensely benefitedthe internal audit department in discharging their duties in a improved manner. The results areevident in audit compliance for this year.
Various attempts were made to switch-over from traditional audit interventions to risk basedaudit. This year also, during the all India audit conference at Khajjiar, it was once againemphasized that we should concentrate more on risk based audit. It was decided to put forthsuggestions by all Audit in-charges for implementation of risk based audit.
XX. CITIZENS’ CHARTER
The company’s commitment to customers in terms of delivering performance vis-à-vis laiddown parameters is embodied in the Citizens’ Charter. The same is displayed at prominentplaces, in Head Office, Regional Offices and Divisional Offices in affirmation of the same and inthe spirit of good governance.
XXI. CUSTOMER SERVICE
Customer service & grievance cells are well established at company’s corporate office and allRegional Offices. “May I help You? “ counters have been provided in all Regional Offices,Divisional offices and Branch offices for customer service.
DIR
EC
TD
IRE
CT
DIR
EC
TD
IRE
CT
DIR
EC
TO
RS
’ RE
PO
RO
RS
’ RE
PO
RO
RS
’ RE
PO
RO
RS
’ RE
PO
RO
RS
’ RE
PO
RTT TTT

30
Estbd. 1919
fn U;w bafM;k ,';ksjUl da- fy-THE NEW INDIA ASSURANCE CO. LTD.
The company’s website provides addresses and contact numbers of all offices for convenienceof the customers. Online information of the company’s products is also provided for the benefitof public. Company has also launched a Call Centre on 19th June 2010 at Pune which is availableto customers 24 x 7 for inquiries of various products, tracking motor claims and grievances bothin Hindi & English.
In order to ensure better and efficient customer service, the company has decided to launch atoll-free no. on all India basis, catering to the needs of the existing as well as prospectiveclients. In fact, this is a business approach that tries to integrate the company’s employees, theprocess and technology to improve the relationship with the customers – both the existing andprospective, as well as internal and external.
XXII. GRIEVANCE REDRESSAL
The company has a well established grievance cell at Head Office and all Regional Offices.The grievance cell is headed by Chief Manager and is supervised by Dy. General Managerand General Manager at Head Office. At Regional Offices it is headed by RegionalManagers/Managers.
In tune with company’s philosophy to constantly endeavor to improve its service deliverystandards and capabilities in order to meet the increasing legitimate expectations of customersfor better, faster and more effective service, the company’s Board had approved a grievanceredressal policy for the company, which inter-alia specifies its objectives, lays down structurefor grievance redressal mechanism and sets time bound parameters for grievance redressal.
The company has made operational, grievance module for online assigning, tracking andresolution of grievances by all offices.
To implement the grievance redressal policy in its true spirit and to harness the enabling featuresof online grievance module, training was imparted to officials from all the R.O.’s so as todisseminate awareness amongst our employees about obligations to our customers.
The grievance redressal status for the year is given below :-
O/s. as on Registered Resolved/ O/s. as on1.4.2009 Complied 31.03.2010
DPG & OTHERS 10 78 83 5
I.R.D.A. 145 337 399 83
HODT 303 849 879 273
RODT 846 2322 2855 313
TOTAL 1304 3586 4216 674
XXIII. CORPORATE LEGAL MATTERS
The corporate legal dept. was re-instituted in the year 2006. The first step taken by thedepartment was to obtain a database of all legal cases pending in various tribunals, consumerforum, Civil Courts, High Courts, Ombudsman and Supreme Court.
This has been followed by review of actual files in operational offices under various RegionalOffices by the team from Head Office and the findings submitted to the management fromtime to time. Remedial actions as suggested and approved have been communicated to therespective Regional offices for compliance, so as to reduce the litigations as well as liability.
DIR
EC
TD
IRE
CT
DIR
EC
TD
IRE
CT
DIR
EC
TO
RS
’ R
EP
OR
OR
S’
RE
PO
RO
RS
’ R
EP
OR
OR
S’
RE
PO
RO
RS
’ R
EP
OR
TTTT T

okf"kZd fjiksVZANNUAL REPORT 2009-10
31
It is proposed to buttress it further by holding work-Shops/review meetings to achieve thetarget of reduction in litigations and liabilities, in particular, the motor third party cases.
XXIV. RIGHT TO INFORMATION ACT, 2005
In keeping with the letter and spirit of the Right to Information Act 2005, and in conformity tothe ideals of transparency and accountability in the functioning of public authorities, CentralPublic Information Cell, at Head Office has been consistently creating awareness amongstits employees and in-charges of different offices to respond promptly and precisely within theprovisions of the Act, to the various information seekers.
A 2 days training-cum-awareness programme conducted by Institute of Public Administrationhad been arranged for the CPIOs/ FAAs of all Regional Offices at Bangaluru on 27th and 28th
March,2010.
This campaign of awareness in a sustained manner has also been followed up with circulars/In-house discussion and regular up dation of official website of the company. The disposaldetails are as under: -
Progress in 2009-10:-
Particulars Requests First Appeals
Opening balance as on 01.04.2009* 4 3
Received during the year including casestransferred to other public authority 1470 304
No. of cases transferred to other public authorities 36 0
Decision where requests/appeals rejected 191 79
Decisions where requests/appeals accepted 1224 228
Closing balance as on 31.03.2010 23 0
* These were cases reported before 31.03.2009 which were disposed off in themonth of April i.e within time stipulated under the Act and, thus, not shown as o/sas on 31.3.2009.
XXV. CERTAIN EXPENSES OF MANAGEMENT
Expenses of management of the company include:
(a) Entertainment (Indian & foreign): Rs. 1.00 crore (previous year – Rs.1.08 crore)
(b) Foreign tours undertaken by the executives: Rs. 1.75 crore (previous year -Rs.0.82crore).
(c) Publicity and advertisement: Rs. 28.34 crore (previous year – Rs.22.53 crore)
XXVI. FOREIGN EXCHANGE EARNINGS & OUTGO
The company’s foreign exchange earning for the year 2009-10 is Rs.259.50 crore (previousyear – Rs.156.97 crore) whereas the outgo in foreign currency has been Rs. 452.90 crore(previous year – Rs.415.92 crore).
DIR
EC
TD
IRE
CT
DIR
EC
TD
IRE
CT
DIR
EC
TO
RS
’ RE
PO
RO
RS
’ RE
PO
RO
RS
’ RE
PO
RO
RS
’ RE
PO
RO
RS
’ RE
PO
RTT TTT

32
Estbd. 1919
fn U;w bafM;k ,';ksjUl da- fy-THE NEW INDIA ASSURANCE CO. LTD.
XXVII. FINANCIAL RATING
AM BEST company, a premier financial rating agency has re-affirmed its rating A- (Excellent)for the company which indicates company’s financial strength and ability to meet its ongoingobligations to policyholders. The rating reflects New India is leading business profile in theIndian general insurance market and reliance on investment return to generate profit.
XXVIII. CORPORATE GOVERNANCE
New India’s philosophy on Corporate Governance is embedded in ethical governance practices.The company strives to operate under the highest standards of Corporate Governance andbest practices are assimilated and incorporated in the processes followed by the company.
It has been the endeavor of the board of the company and its executive management todemonstrate and practice business integrity, high ethical values and professionalism and adhereto a set of strong Corporate Governance practices in its activities. Company believes that goodCorporate Governance is essential to achieve long term corporate goals and for meeting theneeds and aspirations of its policyholders and other stakeholders.
The Insurance Regulatory and Development Authority (IRDA) has issued detailed guidelineson Corporate Governance for insurance sector including formation of various sub-committeesof the board vide circulars ref. no. IRDA/ F&A/CIR/ 025/2009-10 dated 5th August 2009 and ref.no. IRDA/ F&A/014 /01/2010 dated 29th January 2010. The company seeks to comply-with allapplicable legal, regulatory and license requirements and strives to work constructively withregulatory bodies.
1. Board of Directors:
New India’s Board consists of a perfect blend of experts from the fields of insurance, banking andfinance. The composition and profile of the Board of directors of the company as on 31st March,2010 is as under:
Sl. No. Name and Designation Qualification Category ofof Directors Directorship
1. M. Ramadoss B.Com.,ACA,FIII,ACII. Chairman-cum-Chairman-cum-Managing Director Managing Director
2. R. Gopalan, I.A.S. Secretary B.Sc. Chemistry, M.A. Non-executive(Dept. of Financial Services), Eco. (Boston DirectorMinistry of Finance, Govt. of India University),M.P.A.
(Harvard University)
3 M.D. Mallya Chairman & Managing B.E, P.G. Diploma in Ex-officio DirectorDirector, Bank of Baroda Management
4 M. Razzack Chartered Accountant B.Com, FCA. Part-time non-official Director
5 Sanjay Gupta Chartered Accountant B.Sc, FCA,ISA(ICAI) Part-time non-official Director
6 Sarat Pattanayak Social Worker B.A, L.L.B. Part-time non-official Director
7 A R Sekar, General Manager, FCS, MBA, FIII, CAIIB, Whole-timeFinancial Advisor & Company Secretary BGL, B.Com. Director
8 I. S. Phukela,General Manager B.Sc, Mech.Engg. Whole-time(Hons.), AIII. Director
DIR
EC
TD
IRE
CT
DIR
EC
TD
IRE
CT
DIR
EC
TO
RS
’ R
EP
OR
OR
S’
RE
PO
RO
RS
’ R
EP
OR
OR
S’
RE
PO
RO
RS
’ R
EP
OR
TTTT T

okf"kZd fjiksVZANNUAL REPORT 2009-10
33
The Board underwent the following changes in its composition since the date of last directors’report, i.e., 4th August, 2009:
a) B. Chakrabarti, CMD ceased to be director on attaining superannuation from the servicesof the company on 30.09.2009 and A. R. Sekar , Senior most functional director wasappointed as CMD (Current-in-charge) vide Govt. of India order No. F. No. A-11011/19/2008- Ins. IV dated 30th September, 2009 issued by the Ministry of Finance, Government ofIndia.
b) M. Ramadoss was appointed as CMD vide Govt. of India order No. F. No. 11011/ 19/2008-Ins.IV dated 29th December 2009 and he assumed office on 30th December 2009.
c) N.S.R.C. Prasad, Director and General Manager, ceased to be a director with effect from 4th
June 2009 consequent upon his appointment as Chairman-cum-Managing Director of NationalInsurance Company Limited, Kolkata, vide Govt. of India order No. F No A 11011/19/2008 –Ins.IV dated 1st June, 2009.
d) I. S. Phukela, General Manager was appointed as functional director vide Govt. of India orderNo. F. No.11011/10/2008Ins.IV dated 20th January 2010.
e) R. Gopalan, IAS, Secretary, dept. of Financial Services was appointed as director vide Govtof India order No.F.No.11011/3/2010-Ins.II dated 16th February, 2010 in place of Tarun Bajaj.IAS. Joint Secretary (Insurance and Pension).
f) A.R. Sekar, General Manager had completed his tenure of office as functional director on 5th
March 2010. His tenure as functional director was extended until further order vide Govt. ofIndia order No. F.No.14 /4 / 2005-Ins. IV. Dated 26th February 2010.
Seven board meetings took place during the year. The attendance of directors during the meetings isgiven below:
Attendance during meetings
Name of the 18.04.2009 25.06.2009 17.08.2009 29.09.2009 08.12.2009 04.02.2010 30.03.2010Director
Mr. B. Chakrabarti � � � � NA NA NA
B. Chakrabarti ✓ ✓ ✓ ✓ NA NA NA
M. Ramadoss NA NA NA NA NA ✓ ✓
R. Gopalan NA NA NA NA NA NA ✓
Tarun Bajaj ✓ ✓ ✓ ✓ ✓ Leave of NAabsence
M.D. Mallya Leave of Leave of Leave of Leave of Leave of Leave ofabsence absence absence absence absence absence ✓
M.Razzack ✓ ✓ ✓ ✓ ✓ ✓ ✓
Sanjay Gupta ✓ ✓ ✓ ✓ ✓ ✓ ✓
Sarat Pattanayak ✓ ✓ ✓ ✓ ✓ ✓ ✓
N S R Chandra ✓ NA NA NA NA NA NAPrasad
A R Sekar ✓ ✓ ✓ ✓ ✓ ✓ ✓
I. S. Phukela NA NA NA NA NA ✓ ✓
Note : ✓ – Attended the meeting NA – Not applicable
DIR
EC
TD
IRE
CT
DIR
EC
TD
IRE
CT
DIR
EC
TO
RS
’ RE
PO
RO
RS
’ RE
PO
RO
RS
’ RE
PO
RO
RS
’ RE
PO
RO
RS
’ RE
PO
RTT TTT

34
Estbd. 1919
fn U;w bafM;k ,';ksjUl da- fy-THE NEW INDIA ASSURANCE CO. LTD.
The Board places on record its sincere gratitude for the valuable contributions made by B.Chakrabarti,as CMD , Tarun Bajaj as Director & as Chairman of the audit committee & remuneration committee &as member of investment committee and Mr. NSRC Prasad as Director & member of the auditcommittee.
Sub-Committees of the Board :(i) Audit Committee:
� The company has constituted Audit Committee as per section 292A of the Companies Act,1956.
The composition of the audit committee as on 31st March 2010 is as under :
i) M. Razzack (Chairman)
ii) M. D. Mallya
iii) Sanjay Gupta
iv) A. R. Sekar
� Appointments/cessation of members during the year :
i) A.R.Sekar Director and General Manager was appointed as member of the committeew.e.f. 17th August 2009.
ii) Sanjay Gupta Director was appointed as member of the committee w.e.f. 30th March2010.
iii) M. Razzack, present member was elevated as Chairman of the committee w.e.f. 30th
March 2010.
iv) Tarun Bajaj ceased to be member of the committee w.e.f. 16.02.2010 vide Govt. ofIndia letter ref. F/No.11011/014-INS-II dated 16.02.2010.
During the financial year 2009-10, the committee held five meetings. The attendance of membersduring the meetings is given below :
Attendance during meetings
Name of the member 25.06.2009 27.07.2009 29.09.2009 08.12.2009 30.03.2010
Tarun Bajaj ✓ ✓ ✓ ✓ NA
M. Razzack ✓ ✓ ✓ ✓ ✓
A. R. Sekar NA NA ✓ ✓ ✓
M.D. Mallya Leave of Leave of Leave of Leave ofof absence absence absence absence ✓
Sanjay Gupta NA NA NA NA ✓
Note : ✓ – Attended the meetingNA – Not applicable
(ii) Investment Committee:
Consequent-upon appointment of M. Ramadoss as CMD in place of B.Chakrabarti, theInvestment Committee was reconstituted by nominating M. Ramadoss as Chairman at theboard meeting held on 4th February 2010.
DIR
EC
TD
IRE
CT
DIR
EC
TD
IRE
CT
DIR
EC
TO
RS
’ R
EP
OR
OR
S’
RE
PO
RO
RS
’ R
EP
OR
OR
S’
RE
PO
RO
RS
’ R
EP
OR
TTTT T

okf"kZd fjiksVZANNUAL REPORT 2009-10
35
i) M. Ramadoss (Chairman)
ii) M. D. Mallya
iii) Sanjay Gupta
iv) A. R. Sekar
v) A. R. Prabhu.
During the financial year 2009-10, the committee held five meetings. The attendance of membersduring the meetings is given below:
Name of the member Attendance during Meetings
25.06.2009 17.08.2009 08.12.2009 04.02.2010 30.03.2010
B. Chakrabarti ✓✓✓✓✓ ✓✓✓✓✓ NA NA NA
M. Ramadoss NA NA NA ✓✓✓✓✓ ✓✓✓✓✓
Tarun Bajaj ✓✓✓✓✓ ✓✓✓✓✓ ✓✓✓✓✓ Leave of NAabsence
Sanjay Gupta ✓✓✓✓✓ ✓✓✓✓✓ ✓✓✓✓✓ ✓✓✓✓✓ ✓✓✓✓✓
M.D. Mallya Leave of Leave of Leave of Leave ofabsence absence absence absence ✓✓✓✓✓
A R Sekar ✓✓✓✓✓ ✓✓✓✓✓ ✓✓✓✓✓ ✓✓✓✓✓ ✓✓✓✓✓
A R Prabhu ✓✓✓✓✓ ✓✓✓✓✓ ✓✓✓✓✓ ✓✓✓✓✓ ✓✓✓✓✓
Note : ✓ – Attended the meetingNA – Not applicable
� Tarun Bajaj ceased to be member of the committee w.e.f. 16.02.2010 vide Govt. of India letterref. F/No.11011/014-INS-II dated 16.02.2010.
(iii) Remuneration Committee:
Remuneration Committee of the company is constituted in compliance with the Governmentdirectives. Consequent-upon the appointment of R. Gopalan as Director in place of TarunBajaj, the remuneration committee was reconstituted with R. Gopalan as a Chairman at theboard meeting held on 30th March 2010. The committee consists-of the following members ason 31.03.2010 :
i. R.Gopalan (Chairman)
ii. M.D.Mallya
iii. M. Razzack
No remuneration committee meeting was held during the year.
iv) Risk Management Committee
Risk Management Committee was formed during the year in the board meeting held on 4th
February, 2010. Composition of the committee is as under:
i M. Ramadoss (Chairman)ii. Sanjay Guptaiii. A.R. Sekariv. I.S. Phukela
DIR
EC
TD
IRE
CT
DIR
EC
TD
IRE
CT
DIR
EC
TO
RS
’ RE
PO
RO
RS
’ RE
PO
RO
RS
’ RE
PO
RO
RS
’ RE
PO
RO
RS
’ RE
PO
RTT TTT

36
Estbd. 1919
fn U;w bafM;k ,';ksjUl da- fy-THE NEW INDIA ASSURANCE CO. LTD.
A.R. Prabhu, Appointed Actuary and General Manager/s of technical departments shall beinvitees.
Since the committee was constituted in February, 2010, no meeting of the risk managementcommittee was held during the year 2009-10.
v) Policyholder Protection Committee
Policyholder Protection Committee was formed during the year in the board meeting held on 4th
February, 2010. Composition of the committee is as under:
i. M. Ramadoss ( Chairman)
ii. M. Razzack
iii. Sarat Pattanayak
iv. A.R. Sekar
v. I.S. Phukela
A.R. Prabhu, Appointed Actuary and General Manager (Grievance Department) shall be invitees.
Since the committee was constituted in February 2010, no meeting of Policyholder Protection Committeewas held during the Year 2009-10.
2. Independent Directors’ remuneration and disclosures :
(A) Remuneration to directors :
Company has three independent directors on the board and its sub-committees. The remunerationpaid to independent directors during the Year 2009-10 is as under.
i. M. Razzack Rs.50,500/-
ii. Sanjay Gupta Rs.49,000/-
iii. Sarat Pattanayak Rs.32,000/-
The remuneration includes sitting fees only for attending board meetings and sub-committee meetings ofthe company. No sitting fees is payable to whole time directors and director representing Govt. of India.
(B) Disclosures :
� During the year, there are no pecuniary relationships or transactions with the non- executivedirectors.
� Financial statements accurately and fairly represent the financial condition of the company.
� There has not been any significant changes in the accounting policies of the company duringthe year.
� The company has Business Risk Management process which is periodically reviewed by theBoard of Directors for determining its effectiveness.
� The Board of Directors and the Audit Committee periodically reviewed the status of compliancesin respect of applicable laws and report thereon by the Internal Audit team.
� Whistle Blower Policy – Being a Government company, the CVC guidelines are applicable tothe company. Hence no separate whistle blower mechanism has been formulated.
� Solvency Margin of the company for the year 2009-10 is 3.55 (previous year 3.41).
XXIX. PARTICULARS OF EMPLOYEES U/S 217(2A) OF THE COMPANY ACT, 1956
The particulars of employees drawing remuneration of Rs.24 lakh and above for the year ended 31st
March 2010 as required under Section 217 (2A) read with the companies (particulars of employees)Rules, 1975, are enclosed as per annexure III to the directors’ report.
DIR
EC
TD
IRE
CT
DIR
EC
TD
IRE
CT
DIR
EC
TO
RS
’ R
EP
OR
OR
S’
RE
PO
RO
RS
’ R
EP
OR
OR
S’
RE
PO
RO
RS
’ R
EP
OR
TTTT T

okf"kZd fjiksVZANNUAL REPORT 2009-10
37
XXX. AUDITORS
Under Section 619 of the Companies Act, 1956, the Comptroller and Auditor General of India, appointedM/s. Chaturvedi & Shah, M/s. Ford, Rhodes, Park & Co. and M/s. Karnavat & Co. as the CentralStatutory Auditors of the company for the year 2009-10. Branch auditors for the various RegionalOffices and Divisional Offices in India and for the foreign branch offices were also appointed for theyear. The Board of Directors expresses its gratitude for the directions and guidance given by thestatutory auditors in drawing up the company’s annual results.
XXXI. SUBSIDIARY COMPANIES
The company has 3 subsidiary companies. The names and details of New India shareholding are asunder:
Sr. No. Name of the Total Paid Up New Indiaís % Holding of Newsubsidiary Capital (no. of shares) shareholding (no. of shares) India Assurance
1. The New India Assurance 17,418,946 146,12,444 83.89%Company (Trinidad & Tobago) Limited
2. The New India Assurance 250,000 250,000 100%Company (Sierra Leone) Limited
3. Prestige Assurance Plc., 2,149,985,000 1,096,555,085 51.00%Nigeria
The performance of subsidiaries for the year ended 31st December 2009 is summarized below:(Figures in ‘000)
Name of the subsidiary Currency U/w Profit/Loss Investment Other Income Net Income DividendIncome (before tax)
2009 2008 2009 2008 2009 2008 2009 2008 2009 2008
NIA (T&T) Ltd. $ 9391 5543 5892 5668 1299 -534 16582 10677 1741 1741
NIA (S..Leone)Ltd. Le -15327 -13114 20245 35563 NIL NIL 4918 22449 NIL NIL
Prestige Assurance N (88959) 74685 936498 911466 18143 3869 864682 990020 429997 343998
� All the subsidiary companies follow the calendar year for finalisation of accounts. Therefore,performance has been given for the year ended 31st December 2009.
� The New India Assurance Company (Sierra Leone) Limited has closed down businessoperations with effect from 1st January 2003 due to the civil disturbances prevailing in thatcountry. The company has not declared any dividend for the year 2009-10.
� In compliance with the provisions of the section 212 of the Companies Act 1956, the reportand audited accounts of the subsidiary companies are appended hereto.
XXXII. ADOPTION OF ACCOUNTS BY SHAREHOLDERS
The company’s annual accounts for the year 2008-09 were adopted by the shareholders at the AnnualGeneral Meeting held on 17th August 2009.
XXXIII. SUBMISSION OF ACCOUNTS BEFORE PARLIAMENT
The Ministry of Finance, Department of Financial Services, (Insurance Division) has confirmed that
DIR
EC
TD
IRE
CT
DIR
EC
TD
IRE
CT
DIR
EC
TO
RS
’ RE
PO
RO
RS
’ RE
PO
RO
RS
’ RE
PO
RO
RS
’ RE
PO
RO
RS
’ RE
PO
RTT TTT

38
Estbd. 1919
fn U;w bafM;k ,';ksjUl da- fy-THE NEW INDIA ASSURANCE CO. LTD.
the annual report of the company for the financial year 2008-09 along with the directors’ report wasplaced before Rajya Sabha on 1st December 2009 and Lok Sabha on 4th December 2009 as per therequirement of section 619A read with section 619B of the Companies Act, 1956.
XXXIV. DIRECTORS’ RESPONSIBILITY STATEMENT
Pursuant to the requirements under section 217(2AA) of the Companies Act, 1956, the Board of Directorsof the company hereby state and confirm that :
a) in the preparation of the annual accounts, the applicable accounting standards have been followedalong with proper explanation relating to material departures.
b) the directors have selected accounting policies and applied them consistently and made judgmentsand estimates that are reasonable and prudent so as to give a true and fair view of the state ofaffairs of the company at the end of financial year and of the profit of the company for the yearunder review.
c) the directors have taken proper and sufficient care for the maintenance of adequate accountingrecords in accordance with the provisions of the companies Act, 1956, for safeguarding theassets of the company and for preventing and detecting fraud and other irregularities.
d) the directors have arranged preparation of the accounts for the financial year ended 31st March,2010 on ‘going concern’ basis.
XXXV. ADDITIONAL INFORMATION REQUIRED UNDER THE COMPANIES (DISCLOSURE OFPARTICULARS IN THE REPORT OF THE BOARD OF DIRECTORS) RULES, 1988
The company is not engaged in any manufacturing activity and as such no particulars are required tobe disclosed under the companies (Disclosure of particulars in the report of board of directors) rules,1988 as regards conservation of energy or technology absorption.
XXXVI.ACKNOWLEDGEMENT
Your directors place on record their appreciation of the valuable contribution made by all the employeesand their hard work and commitment for achieving the corporate goals.
Directors are grateful to the Ministry of Finance, Department of Financial Services (Insurance Division),Insurance Regulatory and Development Authority (IRDA), General Insurers’ (Public Sector) Associationof India (GIPSA), and the Principal Director of Commercial Audit & Ex-officio Member, Audit Board - I,Mumbai, for their continued guidance and support.
Directors would also like to take this opportunity to thank the customers, individuals and corporateagents, surveyors, re-insurance brokers, bankers and all others associated with company for theircontinuous support and co-operation.
For and on behalf of the Board
M. RAMADOSS
CHAIRMAN-CUM-MANAGING DIRECTOR
Place : Mumbai
Dated : 13 August 2010
DIR
EC
TD
IRE
CT
DIR
EC
TD
IRE
CT
DIR
EC
TO
RS
’ R
EP
OR
OR
S’
RE
PO
RO
RS
’ R
EP
OR
OR
S’
RE
PO
RO
RS
’ R
EP
OR
TTTT T

okf"kZd fjiksVZANNUAL REPORT 2009-10
39
ANNEXURE I TO DIRECTORS’ REPORTSRURAL INSURANCE, SOCIAL SECTOR INSURANCE AND SPECIAL SCHEMES
The details of various major products under this sector in short is as below for the past five years:
(RS. IN CRORE)
COUNTRY Exch GROSS NET CLAIMS COMMISSION MGT. HO R/I RES. STR. INCOME U/W INVTMENT NETRate PREMIUM PREMIUM EXP. XL PROFIT INCOME PROFIT
Avg COST
Rs. Rs. Rs. % Rs. % Rs. % Rs. % Rs. % Rs. % Rs. % Rs. % Rs. %
ABU DHABI C.Y. 12.89 52.30 44.44 25.39 57.1 13.09 29.5 0.81 1.8 0.20 0.5 0 0.0 4.95 11.1 2.67 6.0 7.62 17.1
P.Y. 12.46 50.10 43.21 21.46 49.7 11.49 26.6 0.49 1.1 0 0.0 4.78 11.1 0 0.0 4.99 11.5 1.59 3.7 6.58 15.2
DUBAI C.Y. 12.89 142.34 115.84 59.11 51.0 34.87 30.1 5.61 4.8 2.91 2.5 0.11 0.1 13.45 11.6 4.71 4.1 18.16 15.7
P.Y. 12.46 128.49 110.15 18.87 17.1 32.24 29.3 0.99 0.9 0 0.0 18.00 16.3 0.02 0.0 40.07 36.4 2.79 2.5 42.86 38.9
BAHRAIN C.Y. 125.59 49.94 39.69 21.21 53.4 10.50 26.5 1.27 3.2 0.41 1.0 0.03 0.1 6.33 15.9 0.96 2.4 7.29 18.4
P.Y. 121.43 46.74 39.00 26.43 67.8 9.71 24.9 1.22 3.1 0 0.0 5.34 13.7 0 0.0 -3.70 -9.5 1.42 3.6 -2.28 -5.8
KUWAIT C.Y. 164.73 50.04 46.14 22.01 47.7 15.64 33.9 1.10 2.4 0.41 0.9 -0.15 -0.3 6.83 14.8 1.20 2.6 8.03 17.4
P.Y. 167.41 47.24 44.41 23.84 53.7 14.71 33.1 1.59 3.6 0 0.0 5.74 12.9 -0.12 -0.3 -1.59 -3.6 1.81 4.1 0.22 0.5
MUSCAT C.Y. 122.99 214.33 171.24 92.29 53.9 41.00 23.9 1.51 0.9 8.94 5.2 0.01 0.0 27.51 16.1 13.41 7.8 40.92 23.9
P.Y. 118.92 161.74 145.78 11.77 8.1 33.91 23.3 1.69 1.2 0 0.0 34.13 23.4 0.04 0.0 64.32 44.1 7.82 5.4 72.14 49.5
SAUDI ARABIA C.Y. 12.62 -0.30 -1.45 -5.68 391.7 -0.06 4.1 0.09 -6.2 -5.26 362.8 0 0.0 9.46 -652.4 0.00 0.0 9.46 -652.4
P.Y. 12.20 11.01 8.09 20.22 249.9 2.85 35.2 0.78 9.6 0 0.0 -6.82 -84.3 -0.34 -4.2 -9.28 -114.7 0.02 0.2 -9.26 -114.5
ARUBA C.Y. 26.60 43.46 38.77 15.97 41.2 13.13 33.9 1.45 3.7 0.14 0.4 0.19 0.5 8.27 21.3 4.24 10.9 12.51 32.3
P.Y. 25.71 41.69 38.52 25.41 66.0 14.01 36.4 1.31 3.4 0 0.0 3.14 8.2 0.19 0.5 -5.16 -13.4 3.06 7.9 -2.10 -5.5
CURACAO C.Y. 26.99 18.75 16.57 2.49 15.0 4.90 29.6 0.66 4.0 0.45 2.7 -0.03 -0.2 8.04 48.5 0.74 4.5 8.78 53.0
P.Y. 25.74 17.11 15.59 3.45 22.1 4.46 28.6 0.80 5.1 0 0.0 1.57 10.1 -0.05 -0.3 5.26 33.7 0.94 6.0 6.20 39.8
TOTAL FOR C.Y. 570.86 471.24 232.79 49.4 133.07 28.2 12.50 2.7 0.00 0.00 8.20 1.7 0.16 0.0 84.84 18.0 27.93 5.9 112.77 23.9AGENCIES P.Y. 504.12 444.75 151.45 34.1 123.38 27.7 8.87 2.0 0.00 0.00 65.88 14.8 -0.26 -0.1 94.91 21.3 19.45 4.4 114.36 25.7
MAURITIUS C.Y. 1.54 52.71 43.19 22.39 51.8 6.63 15.4 4.58 10.6 2.91 6.7 0.12 0.3 6.80 15.7 8.49 19.7 15.29 35.4
P.Y. 1.56 44.15 37.41 21.88 58.5 5.60 15.0 1.56 4.2 0 0.0 5.39 14.4 0.04 0.1 3.02 8.1 8.08 21.6 11.10 29.7
HONGKONG C.Y. 6.11 40.29 39.57 13.58 34.3 15.83 40.0 2.83 7.2 5.65 14.3 0.00 0.0 1.68 4.2 0.77 1.9 2.45 6.2
P.Y. 5.89 27.31 26.78 13.73 51.3 10.56 39.4 2.61 9.7 0 0.0 5.29 19.8 0.00 0.0 -5.41 -20.2 1.16 4.3 -4.25 -15.9
PHILIPPINES C.Y. 1.01 19.68 12.97 9.75 75.2 3.02 23.3 1.20 9.3 1.92 14.8 0.12 0.9 -2.80 -21.6 3.54 27.3 0.74 5.7
P.Y. 0.99 15.30 9.34 7.39 79.1 1.90 20.3 1.31 14.0 0 0.0 2.78 29.8 0.03 0.3 -4.01 -42.9 3.54 37.9 -0.47 -5.0
THAILAND C.Y. 1.41 7.18 5.05 3.69 73.1 1.35 26.7 2.15 42.6 -0.74 -14.7 0.65 12.9 -0.75 -14.9 0.54 10.7 -0.21 -4.2
P.Y. 1.32 9.51 6.73 4.25 63.2 1.69 25.1 1.62 24.1 0 0.0 0.18 2.7 0.01 0.1 -1.00 -14.9 1.19 17.7 0.19 2.8
AUSTRALIA C.Y. 40.24 63.65 34.25 25.01 73.0 7.30 21.3 2.79 8.1 6.10 17.8 -0.36 -1.1 -7.31 -21.3 5.51 16.1 -1.80 -5.3
P.Y. 35.89 36.45 22.22 7.67 34.5 4.31 19.4 2.87 12.9 0 0.0 6.93 31.2 -1.53 -6.9 -1.09 -4.9 7.51 33.8 6.42 28.9
FIJI C.Y. 24.63 61.26 52.85 38.54 72.9 5.42 10.3 3.69 7.0 -3.14 -5.9 -2.87 -5.4 5.47 10.4 5.04 9.5 10.51 19.9
P.Y. 26.55 66.05 58.79 27.42 46.6 5.95 10.1 3.63 6.2 0 0.0 2.06 3.5 0.09 0.2 19.82 33.7 3.83 6.5 23.65 40.2
AUCKLAND C.Y. 32.07 16.87 13.02 7.44 57.1 1.60 12.3 2.25 17.3 1.58 12.1 0.03 0.2 0.18 1.4 0.53 4.1 0.71 5.5
P.Y. 29.54 11.94 9.85 4.40 44.7 1.08 11.0 1.82 18.5 1.79 18.2 0.09 0.9 0.85 8.6 0.47 4.8 1.32 13.4
JAPAN C.Y. 0.51 205.33 167.13 89.22 53.4 33.73 20.2 58.21 34.8 8.46 5.1 -0.04 0.0 -22.53 -13.5 2.18 1.3 -20.35 -12.2
P.Y. 0.46 180.94 148.85 80.09 53.8 28.01 18.8 51.88 34.9 0 0.0 15.95 10.7 0.22 0.1 -26.86 -18.0 2.17 1.5 -24.69 -16.6
UNITED C.Y. 75.59 389.96 318.80 236.19 74.1 83.19 26.1 26.28 8.2 -40.38 -12.7 -0.98 -0.3 12.54 3.9 63.24 19.8 75.78 23.8
KINGDOM P.Y. 78.02 481.11 399.56 227.57 57.0 104.38 26.1 28.46 7.1 0 0.0 14.92 3.7 -0.57 -0.1 23.66 5.9 68.38 17.1 92.04 23.0
TOTAL FOR C.Y. 856.93 686.83 445.81 64.9 158.07 23.0 103.98 15.1 0.00 0.00 -17.64 -2.6 -3.33 -0.5 -6.72 -1.0 89.84 13.1 83.12 12.1
BRANCHES P.Y. 872.77 719.53 394.40 54.8 163.48 22.7 95.76 13.3 0.00 0.00 55.29 7.7 -1.62 -0.2 8.98 1.2 96.33 13.4 105.31 14.6
RUN-OFF & C.Y. – – 0.44 – – – -23.16 – – – – – -0.21 – 22.51 – 0.21 – 22.72 –
OTHERS P.Y. 0.00 0.00 -0.02 24.96 0.21 0 0.00 -0.66 -0.7 -25.81 0.30 -25.51
TOTAL (RS). C.Y. 1427.79 1158.07 679.04 58.6 291.14 25.1 93.32 8.1 0.00 0.00 -9.44 -0.8 -3.38 -0.3 100.63 8.7 117.98 10.2 218.61 18.9
TOTAL (RS). P.Y. 1376.89 1164.28 545.83 46.9 311.82 26.8 104.84 9.0 0.00 0.00 121.17 10.4 -2.54 -0.2 78.08 6.7 116.08 10.0 194.16 16.7
DIR
EC
TD
IRE
CT
DIR
EC
TD
IRE
CT
DIR
EC
TO
RS
’ RE
PO
RO
RS
’ RE
PO
RO
RS
’ RE
PO
RO
RS
’ RE
PO
RO
RS
’ RE
PO
RTT TTT

40
Estbd. 1919
fn U;w bafM;k ,';ksjUl da- fy-THE NEW INDIA ASSURANCE CO. LTD.
ANNEXURE II TO DIRECTORS’ REPORTS
RURAL INSURANCE, SOCIAL SECTOR INSURANCE AND SPECIAL SCHEMES
The details of various major products under this sector in short is as below for the past five years:
Policy Year No.of No. of Amount of No. of No. of Amount of ClaimsDetails Policies Persons Premium Claims Claims Claim Settled Ratio
Sold Covered (Rs.In Lacs) Reported Settled (Rs.In Lacs) (%)
Cattle Insurance 2005-06 175612 594380 3842.76 35158 31397 2483.22 53.292006-07 181054 635092 4128.10 39926 42631 3055.25 74.012007-08 152999 536683 3488.44 33739 36252 2162.87 62.002008-09 223287 753223 4519.34 23319 23478 2705.29 59.862009-10 237431 880935 4805.61 14816 15497 2906.84 60.49
Livestock Insurance 2005-06 71520 245306 676.73 7520 5737 183.19 50.342006-07 77058 320332 896.93 9975 10761 350.00 39.022007-08 71318 292230 818.27 9102 9817 540.72 66.082008-09 94313 386456 1082.11 12035 11987 684.75 63.282009-10 110999 454828 1273.56 13259 15756 916.96 71.99
Agricultural Pumpset 2005-06 36525 57320 163.58 3025 2555 56.20 43.542006-07 40220 58306 166.19 4115 4022 75.25 45.232007-08 21853 31680 90.30 2236 2147 39.79 44.062008-09 15917 109616 65.77 1628 1598 28.07 42.682009-10 12062 83066 49.84 510 508 8.79 17.64
Janata Personal Accident 2005-06 682025 6542400 1308.48 7592 5250 2260.00 156.90
2006-07 685520 7278901 1400.72 5020 5966 1820.93 130.352007-08 608708 6463304 1243.77 4458 4012 1187.96 95.512008-09 781527 7647701 1317.89 1701 1698 1805.60 137.012009-10 846569 8284173 1427.57 4790 2131 1357.21 95.07
Gramin Personal Accident 2005-06 4250 117895 33.33 315 195 17.73 163.132006-07 18671 121295 50.98 675 546 34.50 67.712007-08 16521 107329 45.11 597 483 24.24 53.742008-09 18341 1045261 51.10 243 212 65.60 128.382009-10 21683 1235698 60.41 182 159 49.23 81.49
Universal Health 2005-06 2150 4884 5.07 150 88 4.16 82.05Insurance Scheme 2006-07 5291 23098 38.14 851 476 32.79 85.97
2007-08 6936 32170 46.96 508 460 32.14 64.332008-09 4212 51903 60.05 1064 912 31.71 52.812009-10 5791 493968 575.86 10553 10477 361.74 62.81
Mediclaim 2005-06 1221880 5711438 590.83.40 977121 757391 70376.26 119.112006-07 1130913 6232431 74841.55 613463 552623 74105.50 99.022007-08 1234554 8560474 113929.10 813463 752623 93213.00 81.822008-09 1437947 5982784 133767.00 671877 610973 127189.00 99.102009-10 2040720 6095223 152695.80 743754 734492 149597.25 97.97
Jan Arogya Bima Policy 2005-06 20061 83631 62.56 3461 47132 88.85 142.022006-07 17669 105393 96.14 2796 2332 91.15 94.812007-08 8230 20637 21.27 1022 1072 36.39 171.092008-09 9689 16152 16.26 1089 804 20.31 121.502009-10 14049 25258 30.09 1069 945 31.26 103.88
DIR
EC
TD
IRE
CT
DIR
EC
TD
IRE
CT
DIR
EC
TO
RS
’ R
EP
OR
OR
S’
RE
PO
RO
RS
’ R
EP
OR
OR
S’
RE
PO
RO
RS
’ R
EP
OR
TTTT T

okf"kZd fjiksVZANNUAL REPORT 2009-10
41
INF
OR
MA
TIO
N R
EG
AR
DIN
G E
MP
LO
YE
ES
D
RA
WIN
G A
RE
MU
NE
RA
TIO
N O
F R
S.2
4,00
,000
AN
D A
BO
VE
FO
R T
HE
YE
AR
EN
DE
D 3
1ST
MA
RC
H, 2
010
(IN
FO
RM
AT
ION
U/s
217
(2A
) o
f C
OM
PAN
IES
AC
T 1
956)
NAM
E O
F TH
ESE
RVIC
EDE
SIG
NATI
ON
REM
UNER
ATIO
NQ
UALI
FICA
TIO
NDA
TE O
FAG
ELA
ST E
MPL
OYM
ENT
PLAC
E O
FEM
PLO
YEES
IN Y
EARS
JOIN
ING
HELD
PRES
ENT
POST
ING
AISH
IBAS
HI
2AS
ST.S
BM 2
,552
,255
------
-17
/7/2
007
48N
AH
IRO
SHIM
AAB
E M
.31
MAN
AGER
5,1
35,6
28B,
CO
M.
13/2
/79
54N
.ATO
KYO
AGR
AWAL
R.
23M
ANAG
ER 2
,605
,184
MC
OM
,FIII
,PG
DM
M19
8746
STAT
E BA
NK
OF
IND
IALO
ND
ON
AOKI
T.
5AS
ST. M
ANAG
ER 3
,440
,687
B.C
OM
01/
2/20
0539
GEN
ERAL
IN
AGO
YAAR
OR
A K.
G.
36C
.E.O
. 3
,376
,844
M.C
om, C
IP,F
III,A
CI,
1974
54G
OVT
. OF
IND
IALO
ND
ON
FBM
S, M
BIM
,CPC
UAS
AOKA
H.
9M
ANAG
ER 3
,265
,004
------
-9/
1/20
0155
N.A
.TO
KYO
BABU
K.L
.R.
29C
EO 3
,997
,835
MA,
FIII
1/1/
1981
55---
----
TOKY
OBO
RG
OH
AIN
A.C
.25
MAN
AGER
3,2
83,6
30M
VSC
, AIII
30/4
/85
54---
----
TOKY
OBU
AM L
.22
DIV
L.M
ANAG
ER 2
,544
,426
M.A
., AI
II18
/9/1
988
45LO
ND
ON
CH
AKR
ABO
RTY
R.
21M
ANAG
ER 2
,977
,384
I.T. D
IPLO
MA
27/1
1/89
47---
----
OSA
KAD
OI H
.4
MAN
AGER
3,4
28,5
83---
----
1/5/
2005
46TA
IYO
F &
MTO
KYO
EBIS
UD
A M
.2
ASST
.MAN
AGER
2,5
97,9
17---
----
1/6/
2007
41N
AH
IRO
SHIM
AEN
DO
S.
4SU
B. B
M 2
,560
,563
------
-1/
4/20
0563
NA
HIR
OSH
IMA
FUKU
ZUM
I M.
2SU
B. B
M.
2,5
51,5
20---
----
1/9/
2007
44---
----
GIF
UH
AMAO
KA Y
.11
SR. C
LER
K 2
,689
,318
------
-1/
5/19
9844
N.A
.H
IRO
SHIM
AH
IRAO
KA K
.14
SUB
B.M
. 3
,077
,338
------
-17
/8/9
545
N.A
.H
IRO
SHIM
AIC
HIN
OH
E Y.
8M
ANAG
ER 3
,113
,562
------
-1/
1/20
0248
N.A
TOKY
OIT
O K
.6
DY.
BM 3
,786
,650
B.C
OM
16/4
/200
356
SAIS
ON
NAG
OYA
IWAT
ANI K
.10
B.M
. 4
,167
,895
B.C
OM
.1/
4/19
9948
N.A
.O
KAYA
MA
KAN
AMO
RI H
.1
DY.
MAN
AGER
2,6
36,0
06---
----
24/6
/200
843
CO
RN
ESTO
KYO
KAN
AMO
RI T
.5
MAN
AGER
3,7
58,8
09B.
CO
M13
/1/2
005
53G
ENER
ALI
NAG
OYA
KATO
S.
31D
Y.BM
4,2
74,2
48B.
A.1/
4/19
7857
N.A
.SA
PPO
RO
KAW
AZO
E K.
5M
ANAG
ER 2
,650
,171
------
-1/
7/20
0461
------
-O
SAKA
KOTE
RAZ
AWA.
M.
34BR
.MAN
AGER
4,6
64,6
48B.
CO
M.
15/3
/76
56N
.A.
HIM
EJI
KRIS
HN
A M
.V.
2C
HIE
F EX
ECU
TIVE
2,9
06,8
28B.
CO
M,F
III18
/9/2
007
52TH
E O
RIE
NTA
L IN
SU.
LON
DO
NC
O.L
TD.
MAC
KEN
NEY
N.
10SR
. U/W
MAN
AGER
. 5
,208
,350
ACII
1999
64SU
N A
LLIA
NC
ELO
ND
ON
MAT
SUO
Y.
7SR
.CLE
RK
2,4
33,4
77---
----
1/5/
2002
30N
AH
IRO
SHIM
A
Con
td...
DIR
EC
TD
IRE
CT
DIR
EC
TD
IRE
CT
DIR
EC
TO
RS
’ RE
PO
RO
RS
’ RE
PO
RO
RS
’ RE
PO
RO
RS
’ RE
PO
RO
RS
’ RE
PO
RTT TTT
AN
NE
XU
RE
III T
O D
IRE
CTO
RS
’ RE
PO
RT

42
Estbd. 1919
fn U;w bafM;k ,';ksjUl da- fy-THE NEW INDIA ASSURANCE CO. LTD.
INF
OR
MA
TIO
N R
EG
AR
DIN
G E
MP
LO
YE
ES
D
RA
WIN
G A
RE
MU
NE
RA
TIO
N O
F R
S.2
4,00
,000
AN
D A
BO
VE
FO
R T
HE
YE
AR
EN
DE
D 3
1ST
MA
RC
H, 2
010
(IN
FO
RM
AT
ION
U/s
217
(2A
) o
f C
OM
PAN
IES
AC
T 1
956)
NAM
E O
F TH
ESE
RVIC
EDE
SIG
NATI
ON
REM
UNER
ATIO
NQ
UALI
FICA
TIO
NDA
TE O
FAG
ELA
ST E
MPL
OYM
ENT
PLAC
E O
FEM
PLO
YEES
IN Y
EARS
JOIN
ING
HELD
PRES
ENT
POST
ING
MEK
AWA
H9
MAN
AGER
3,6
60,1
78B.
CO
M.
4/9/
2000
50N
ITAN
CAP
ITAL
GR
OU
PTO
KYO
NAK
AJIM
A S.
19SR
. CLE
RK
2,7
13,0
67---
----
6/1/
1990
44---
----
TOKY
ON
AMIK
I K.
36SE
CR
ETAR
Y 4
,538
,022
B.A.
25/2
/74
56N
.A.
TOKY
ON
ARU
SE S
.1
MAN
AGER
2,5
23,9
25---
----
6/1/
2008
42---
----
TOKY
ON
OG
UC
HI H
.9
B. M
ANAG
ER 3
,053
,712
B.C
OM
5/1/
2000
67N
.A.
NAG
OYA
OSH
IUM
A.
24AS
ST. M
ANAG
ER 3
,354
,828
B.C
OM
12/8
/198
548
N.A
.TO
KYO
OTS
UKA
M.
8M
ANAG
ER 2
,809
,885
------
-1/
2/20
0259
N.A
.SA
PPO
RO
PAN
NA
SHAH
17AS
ST. A
CCOU
NTAN
T 2
,842
,291
BOO
K KE
EPIN
G19
9355
P S
J A
LEXA
ND
ER &
CO
LON
DO
NR
ANI S
UD
HAK
AR22
DY.
MAN
AGER
2,4
81,9
07B.
SC,F
III19
/9/1
988
44---
----
MAN
ILA
RAVI
RAJ
PUR
OH
IT33
MAN
AGER
4,9
83,0
21B.
SC,D
BM,F
lll3/
1/19
7753
N.A
.H
ON
GKO
NG
RIC
HAR
D C
LAR
K2
UN
DER
WR
ITIN
G 3
,874
,135
B.Sc
, AC
II C
harte
red
2007
49KI
NETI
C IN
SC.B
ROKE
RSLO
ND
ON
ASSI
STAN
TIn
sure
rSA
BA R
ATNA
SABA
PATH
Y15
CHI
EF A
CCOU
NTAN
T 3
,832
,557
FCEA
1995
56H
ENLE
Y IN
DU
STR
IES.
LON
DO
NSA
ITO
M.
8M
ANAG
ER 3
,440
,621
------
-1/
9/20
0154
N.A
.TO
KYO
SAKO
H.
26SR
. CLA
RK
2,7
41,6
47---
----
1/12
/198
346
N.A
.N
AGO
YASA
SAO
KA H
.30
MAN
AGER
3,7
47,6
19G
RAD
UAT
E1/
4/19
7951
N.A
.SA
PPO
RO
SAW
ADA
M.
10SR
.CLE
RK
2,4
79,7
43---
----
1/4/
1999
35N
AH
IRO
SHIM
ASH
IMO
DA
N.
20M
ANAG
ER.
3,7
89,3
30H
IGH
SC
HO
OL
10/4
/198
957
N.A
.H
IRO
SHIM
ASU
JAY
BAN
ARJI
27M
ANAG
ER 8
,361
,821
M.A
., AI
II1/
6/19
8252
N.A
.SY
DN
EYTA
KASE
O.
18D
EPU
TY B
R.
4,6
12,0
70B.
CO
M1/
10/1
991
54N
.A.
OSA
KAC
64M
ANAG
ERTA
NAK
A O
.20
ASST
. MAN
AGER
2,9
54,7
17---
----
20/7
/198
945
N.A
.N
AGO
YATE
RAM
OTO
K.
37BR
.MAN
AGER
. 3
,484
,641
B.C
OM
1/3/
1973
62N
.A.
HIR
OSH
IMA
VEN
KATA
IAH
G. D
R.
24M
ANAG
ER 2
,779
,846
BVSC
, BL,
AIII
8/7/
1985
55ST
ATE
BANK
OF
MYS
ORE
KUW
AIT
WAT
ANAB
E M
.5
ASST
.MAN
AGER
2,6
84,2
19---
----
4/1/
2004
38N
ASA
PPO
RA
YAM
AGU
CH
I S.
23 M
ANAG
ER 3
,264
,179
------
-1/
4/19
8646
N.A
.SA
PPO
RO
YASU
HAR
A Y.
6SU
B B.
M.
2,8
10,9
87---
----
1/9/
2003
57N
.A.
HIR
OSH
IMA
YOKO
YAM
A K.
1BR
.MAN
AGER
3,8
60,0
32---
----
15/0
6/20
0849
TAIY
O F
& M
TOKY
OYO
SHIM
ARA
S.30
GEN
. MAN
AGER
3,8
15,8
40B.
Com
.1/
8/19
7955
N.A
.H
IMEJ
I
DIR
EC
TD
IRE
CT
DIR
EC
TD
IRE
CT
DIR
EC
TO
RS
’ R
EP
OR
OR
S’
RE
PO
RO
RS
’ R
EP
OR
OR
S’
RE
PO
RO
RS
’ R
EP
OR
TTTT T

okf"kZd fjiksVZANNUAL REPORT 2009-10
43
AD
DE
ND
UM
TA
DD
EN
DU
M T
AD
DE
ND
UM
TA
DD
EN
DU
M T
AD
DE
ND
UM
TO
DIR
EC
TO
DIR
EC
TO
DIR
EC
TO
DIR
EC
TO
DIR
EC
TO
RS
’ RE
PO
RO
RS
’ RE
PO
RO
RS
’ RE
PO
RO
RS
’ RE
PO
RO
RS
’ RE
PO
RTT TTT
Addendum to Directors’ Report dated 13th August, 2010As per Section 217(3) of the Companies Act -1956
Response to qualifications in Auditors’ Report dated 29th June, 2010
The Management’s explanation for qualifications mentioned in the above report, which are not explained byway of notes are as follows.
1. Para 1 of Auditors’ Report regarding non compliance of IRDA Regulations
Note 8 (a)
i. Returns prescribed by regulation 6 with respect to compliance report for exposure of investments anddelay in submission of returns.
In the absence of ready facility available in the existing software, we have been ensuring the compliancewith the regulations by generating the statements manually. The software is expected to be ready bythe end of 2010. Though the investment returns are filed in time, but there are a few cases of delayswhich we will try to avoid in future. But all care is taken to ensure that the exposures limits are notexceeded.
ii. Before each and every investment proposal is put up for approval Company verifies the exposurelimits to see that the prescribed limits are not exceeded. In view of this care having been taken, thecompany has not exceeded the prescribed limits of exposure set by IRDA at any point of time.
Note 8(b)
i) The segment reporting of Indian Business has been perfectly in accordance with the requirements ofthe regulations. However due to differing practices and soft wares in different countries it has not beenpossible to get certain segment details separately. However a beginning has already been made bysepearately disclosing health insurance business of offices outside India during 2009-10. During theyear 2010-11 we will ensure separate disclosure for the remaining segments of public and productliability insurance business outside India.
ii) Provisions against Investments Loans etc.
The practice followed by the company consistently is in conformity with the formats prescribed by theIRDA and with the practice of all other public sector General Insurers. The details of NPA/doubtfulamounts are indicated as footnotes to relevant schedules.
iii) Large internal network, differing environment in our external operations, limitations of the presentsoftware have been causing problems in preparing a meaningful cash flow statement on direct method.We have been preparing correct cash flow statement on indirect method. We are in the process ofswitching over to our new software and we propose to have this facility of Direct Cash Flow in the newsoftware.
1. Para 2.
a) Note 9) Confirmations of some loans and investments:
Company regularly follows up with the state governments for repayments. Demand notices to stategovernment for outstanding dues are sent on half yearly basis, indicating, balances outstanding onaccount of principal as well as over dues of interest. These have not been disputed by the respectivestate governments. Though the confirmations about loans have not come care has been taken tomake necessary provisions as per the regulations/guidelines. As regards term loan accounts, whichare restructured reconciliation of balances as per the company records and borrowers’ records is

44
Estbd. 1919
fn U;w bafM;k ,';ksjUl da- fy-THE NEW INDIA ASSURANCE CO. LTD.
AD
DE
ND
UM
TA
DD
EN
DU
M T
AD
DE
ND
UM
TA
DD
EN
DU
M T
AD
DE
ND
UM
TO
DIR
EC
TO
DIR
EC
TO
DIR
EC
TO
DIR
EC
TO
DIR
EC
TO
RS
’ R
EP
OR
OR
S’
RE
PO
RO
RS
’ R
EP
OR
OR
S’
RE
PO
RO
RS
’ R
EP
OR
TTTT T
carried out and accounts are suitably modified already. Hence no material impact is foreseen on thefinancial statements
b) of Auditor’s Report – Regarding historical /weighted average cost of listed equity/equity relatedinstruments, the value of which were impaired on or before 31.03.2000.
The company has prepared accounts as per IRDA regulations for the first time for the year 2001-02.IRDA Regulations on preparations of financial statements requires insurers to assess at each balancesheet date whether any impairment in value of specified assets has occurred and to recognize thesame in revenue. Further the regulations also require to incorporate any reversal of impairment lossrecognized in earlier years.
The company as per its own internal guidelines as also guidelines issued by GIC has been working outimpairment value in respect of equity and preference shares. The exercise has been carried out formore than 25 years before notification of the same by IRDA in 2000-01. Further over the years thehistorical cost has undergone changes on account of subscription to rights shares allotment of bonusshares, conversion of other security into equity etc. More over the company did not have the practiceof working out reversal of impairment loss recognized in the earlier years and hence the details ofamounts impaired prior to 31.03.2000 is not available. This has been clearly stated in company’saccounting policies.
c) of Auditors’ Report – Non Reconciliation of Re-insurers’ and Coinsurer’s balances and Inter OfficeAccounts
The Motor TP Pool and Terrorism Pool Balances constitute a major portion of our reinsurance balances,and these balances stand reconciled and confirmed as on 31.03.2010.
All Inter Group Treaty balances as on 31.03.2010 stand reconciled and confirmed.
Outward treaty statements of accounts have been drawn up as on 31.02.2010 and sent to all respectiveparties. We have received confirmation in some cases and in other cases clarification sought by themhave been given. Settlement is also in progress for all confirmed balances.
Reconciliation of other balances is in progress.
As far as coinsurance balances are concerned we have been organising the coinsurance meeting inwestern zone for reconciliation and settlement of coinsurance balances. Similarly we are activelyparticipating in the similar meetings organised in other zones by other insurers. In these meetings thecoinsurance balances are reconciled and agreed balances are accordingly settled.
Further, other inter-office reconciliations were fully carried out as at 31.03.2010 and pending entriesidentified. Reconciliation of inter office accounts is a continuous process and necessary care has beentaken to minimize the pending entries. These efforts will continue.
Para 2
d) Of Auditors’ Report – Non-provision of tax liability on income in Foreign Countries.
Our major operations are in London and Japan. During the year 2009-10 the London office has alreadymade provision for corporation tax in their books. During 2010-11 we will take up with other overseasoffice/ branches (wherever possible) to ensure that provisions for taxes is done on accrual basis.
1. Para 3 of the Auditors’ Report – Substantial strengthening in the areas of internal audit and coverageand compliance.
Audit Committee has been closely monitoring the internal audit system of the Company. The Committeehas interacted with audit in-charges and regional in-charges to improve the effectiveness of the audit

okf"kZd fjiksVZANNUAL REPORT 2009-10
45
and compliance. Directions are also issued to reduce the time gap between the conduct of the auditand issuance of report to maximum of two weeks. During the year 2009-10, 25 audit workshops wereconducted to resolve the queries as against 12 conducted during 2008-09. In addition two zonalworkshops to address the CAG queries were also organised. The working of the department andanalysis of outstanding queries is continuously monitored by the Board. Thus the internal audit hasbeen a major thrust area for the Board and the Management.
Para 4 In view of the precautions being taken we do not expect material impact on revenue accounts,profit and loss account and reserve and surplus.
For and on behalf of the Board
M. RAMADOSS
CHAIRMAN-CUM-MANAGING DIRECTOR
Place : Mumbai
Dated : 13th August, 2010
AD
DE
ND
UM
TO
DIR
EC
TO
RS
’ RE
PO
RT
Certificate of Compliance of the Corporate Governance Guidelines
I, A.R. SEKAR, hereby certify that the company has complied with the Corporate Governance
guidelines for Insurance Companies as amended from time to time and nothing has been
concealed or suppressed.
A.R. SEKAR
Director & Company Secretary
Place : Mumbai
Dated : 30th July 2010
CO
RP
OR
AT
E G
OV
ER
NA
NC
E C
ER
TIF
ICA
TE

46
Estbd. 1919
fn U;w bafM;k ,';ksjUl da- fy-THE NEW INDIA ASSURANCE CO. LTD.
MA
NM
AN
MA
NM
AN
MA
NAAAA A
GE
ME
NT
RE
PO
RG
EM
EN
T R
EP
OR
GE
ME
NT
RE
PO
RG
EM
EN
T R
EP
OR
GE
ME
NT
RE
PO
RTTTT T
MANAGEMENT REPORT1. We confirm that the registration granted by the Insurance Regulatory & Development Authority is valid
during the year. The same is renewed for the year 2009-2010
2. We confirm that all the dues payable to the statutory authorities have been duly paid.
3. We confirm that the shareholding pattern and transfer of shares during the year are in accordance with thestatutory or regulatory requirements.
4. We confirm that the funds of the holders of policies issued in India have not been directly or indirectlyinvested outside India.
5. We confirm that the required solvency margins have been maintained.
6. We certify that the values of all the assets have been reviewed on the date of the Balance Sheet and in thebest of our belief the assets set forth in the Balance Sheet are shown in the aggregate at amounts notexceeding their realizable or market value under the several headings- “Loans”, “Investments”, “Agentsbalances”, “Outstanding Premiums”, “Interest, Dividends and Rents outstanding”, “Interest, Dividends andRents accruing but not due”, “Amounts due from other persons or Bodies carrying on insurance business”,“Sundry Debtors”, “Bills Receivable”, “Cash” and several items specified under “Other Account”.
7. The overall risk exposure for the risks accepted by us is limited to Rs.200 Crore per risk except in respectof certain risks in which case there is an exposure of Rs.300 Crore PML per policy. The same has beenapproved by the Board. We have made adequate reinsurance arrangements to mitigate the loss arisingout of any major claim.
8. We have overseas operations in 27 countries. The foreign branches have their own reinsurancearrangements to protect their exposure. Over and above there is an excess of loss protection available,which takes care of the exposure risk of the Company as a whole, including domestic and foreign branches.The foreign branches/agencies generate enough revenue in local currencies to meet their liabilities arisingout of their operations. Hence there is no major currency risk in the countries we operate.As regards thecountry risk, by and large all the countries in which we operate are politically stable. We also have welldefined acceptance limits for foreign operations, which limits our exposure in these countries.
9. The average claim settlement time during the preceding five years is as under:
Year No. of days
2009-10 88
2008-09 137
2007-08 138
2006-07 132
2005-06 134
10. We certify that the investments have been valued as per the Accounting Regulations of the InsuranceRegulatory and Development Authority and shown in the balance sheet.
11. All investment assets are reviewed periodically and assets are classified into performing and non-performingbased on IRDA norms.
12. It is hereby confirmed:
(i) That in preparation of financial statements, the applicable accounting standards, principles and policieshave been followed, except

okf"kZd fjiksVZANNUAL REPORT 2009-10
47
MA
NM
AN
MA
NM
AN
MA
NAA AAA
GE
ME
NT
RE
PO
RG
EM
EN
T R
EP
OR
GE
ME
NT
RE
PO
RG
EM
EN
T R
EP
OR
GE
ME
NT
RE
PO
RTT TTT
a) The accounting of Tax Liability in Foreign Countries is made on cash basis, except London Branch,which is not in conformity with AS – 22 on Accounting for Taxes on Income.
b) Amortisation of additional actuarial liability for Pension, Gratuity and Leave Encashment on accountof Special Voluntary Retirement Scheme as per guidelines given by I.R.D.A.
(ii) That the management has adopted accounting policies and applied them consistently and madejudgments and estimates that are reasonable and prudent so as to give a true and fair view of the stateof affairs of the Company at the end of the financial year and of the operating profit of the Company forthe year except as mentioned in Para 12 (i) above.
(iii) That the management has taken proper and sufficient care for the maintenance of adequate accountingrecords in accordance with the applicable provisions of the Insurance Act 1938(4 of 1938) andCompanies Act 1956(1of 1956) for safeguarding the assets of the Company and for preventing anddetecting fraud and other irregularities.
(iv) That the management has prepared the financial statements on a going concern basis.
(v) That the management has ensured that the internal audit system commensurate with the size andnature of business exists and is operating effectively.
13. There are no payments made to individuals, firms, companies and organizations in which directors of the
Company are interested.
A. R. Sekar I. S. Phukela M. RamadossDirector and Company Secretary Director Chairman-cum-Managing Director
Place : MumbaiDate : June 29, 2010

48
Estbd. 1919
fn U;w bafM;k ,';ksjUl da- fy-THE NEW INDIA ASSURANCE CO. LTD.
AAAA AU
DIT
UD
ITU
DIT
UD
ITU
DIT
OR
S’
RE
PO
RO
RS
’ R
EP
OR
OR
S’
RE
PO
RO
RS
’ R
EP
OR
OR
S’
RE
PO
RTTTT T
AUDITORS’ REPORTTo the Members,
The New India Assurance Company Limited
We have audited the attached Balance Sheet of The New India Assurance Company Limited (the Company)as at 31st March, 2010 and the annexed the revenue accounts of Fire, Marine and Miscellaneous InsuranceRevenue Accounts (collectively known as ‘Revenue Accounts’), Profit and Loss Account and Receipts andPayments Account of the Company for the year ended on that date, in which are incorporated (a) Returns fromtwenty-six Regional Offices, three hundred and ninety five Divisional Offices and eight Foreign Branchesaudited by other firms of Auditors appointed by the Central Government; (b) Return of one unaudited ForeignBranch; (c) Returns from seven foreign agencies audited by local auditors appointed by the Company; (d)Return of one unaudited foreign agency; and (e) Returns of two unaudited run-off foreign agencies.
The Balance Sheet, the Revenue Accounts and the Profit and Loss Account have been drawn up in accordancewith the Insurance Act, 1938, Insurance Regulatory and Development Authority (‘IRDA’) (Preparations ofFinancial Statements and Auditor’s Report of Insurance Companies) Regulations, 2002 (‘the Regulations’)read with Section 211 of the Companies Act, 1956 (‘the Act’).
These financial statements are the responsibility of the Company’s management. Our responsibility is to expressan opinion on these financial statements based on our audit. We conducted our audit in accordance withauditing standards generally accepted in India. Those Standards require that we plan and perform the audit toobtain reasonable assurance about whether the financial statements are free of material misstatement. Anaudit includes examining, on a test basis, evidence supporting the amounts and disclosures in the financialstatements. An audit also includes assessing the accounting principles used and significant estimates madeby management, as well as evaluating the overall financial statement presentation. We believe that our auditprovides a reasonable basis for our opinion.
We report that:
1. Attention is invited to Notes to Accounts note number 8(a)(i) & (ii) & 8(b)(i) to (iii)) in Schedule 16 Bregarding non-compliance of Insurance Regulatory and Development Authority (IRDA) Regulations duringthe year. However, these non-compliances do not have any impact on the working results of the Company.
2. a. In view of non-availability of balance confirmations of some loans and investments (Refer Notenumber 9, notes to accounts in Schedule 16 B), we are unable to comment on the impact ofadjustments arising out of reconciliation / confirmation of such balances on the financialstatements.
b. The historical/weighted average cost of listed and unlisted equity / equity related instruments/ preference shares, the value of which were impaired on or before 31.03.2000 is not availablewith the Company. As a result, the reversal of impairment losses recognized in Profit and Loss/ Revenue account prior to 01.04.2000 has not been accounted for. The impact of the same isnot ascertainable.
(Refer Significant Accounting Policy in schedule 16 under 13 L and M(II)).
c. Balances due to/from persons or bodies carrying on Insurance Business and balances of interoffice accounts are pending for reconciliation/confirmation as stated in Note number 3 (a),(c)and (d) Notes to accounts, in schedule 16 B . Consequential effect, if any, of adjustments inrespect of above will be made upon confirmation/ analysis / reconciliation.
d. The accounting of Tax Liability in Foreign Countries is not in accordance with AccountingStandard 22 - Accounting for Taxes on Income for not recognizing deferred tax assets and

okf"kZd fjiksVZANNUAL REPORT 2009-10
49
liabilities for operations in foreign branches. (Refer Notes to accounts note number 11 C 2(iii)in schedule 16 B)
3. The Company’s internal audit system requires substantial strengthening in the areas of audit coverageand compliance.
4. Overall impact of the above Para 2 (a) to (d) and the consequential effects on Revenue Accounts, Profitand Loss Accounts and Reserve and Surplus as on 31st of March, 2010 are not ascertainable.
SUBJECT TO ABOVE
a. We have obtained all the information and explanations, which, to the best of our knowledge and beliefwere necessary for the purposes of our audit and found them satisfactory.
b. In our opinion, proper books of account, as required by law, have been kept by the Company so far asappears from our examination of those books.
c. The Balance Sheet, Revenue Accounts, Profit and Loss Account and Receipts and Payments Account arein agreement with the books of account.
d. The actuarial valuations of liability in respect of claims Incurred But Not Reported (IBNR) and those IncurredBut Not Enough Reported (IBNER) as at 31st March, 2010, has been duly certified by the Company’sAppointed Actuary and relied upon by us. The Appointed Actuary has also certified that the assumptionsconsidered by him for such valuations are in accordance with guidelines and norms prescribed by theInsurance Regulatory and Development Authority (IRDA) and the Actuarial Society of India in concurrencewith the IRDA.
e. As per Circular Number 8/2002 dated 22.03.2002 of the Department of Company Affairs, the directors ofthe Government Companies are exempted from applicability of the provisions of section 274 (1)(g) of theCompanies Act, 1956.
f. The reports of the regional auditors consolidating divisional auditors’ reports, reports of the foreign branchesand foreign agencies auditors have been forwarded to us and considered by us and were adequate for thepurposes of our audit.
In our opinion and to the best of our information and according to the information and explanation given to uswe further report that :
a. The Balance Sheet, Profit and Loss Account and Receipts and Payment Account comply with the accountingstandards referred to in Section 211 (3C) of the Companies Act, 1956 to the extent applicable to theCompany and are also in conformity with the accounting principles as prescribed in the IRDA Regulations,except preparation of Receipts and Payments Account has been drawn by “Indirect Method” instead of“Direct Method” as required by Part I of Schedule B.
b. The investments have been valued in accordance with the provisions of the Insurance Act, 1938, theregulations and orders/ directions issued by IRDA in this regard.
c. The said accounts read together with significant accounting policies and notes to accounts thereon havebeen drawn up in accordance with the applicable provisions of the Insurance Act, 1938, the InsuranceRegulatory and Development Authority Act, 1999 and the Companies Act, 1956, to the extent applicableand in the manner so required and subject to paragraph 2(a) to (d) above give a true and fair view inconformity with the accounting principles generally accepted in India as applicable to insurance companies:
(i) of the state of affairs of the Company in so far it relates to the Balance Sheet as at 31st March, 2010;
(ii) of the surplus/deficit in so far it relates to the Revenue Accounts of Fire, Marine and MiscellaneousBusiness for the financial year ended on that date;
AA AAAU
DIT
UD
ITU
DIT
UD
ITU
DIT
OR
S’ R
EP
OR
OR
S’ R
EP
OR
OR
S’ R
EP
OR
OR
S’ R
EP
OR
OR
S’ R
EP
OR
TT TTT

50
Estbd. 1919
fn U;w bafM;k ,';ksjUl da- fy-THE NEW INDIA ASSURANCE CO. LTD.
(iii) of the profit in so far it relates to the Profit and Loss Account for the financial year ended on that date,and
(iv) for the receipts and payments in so far it relates to the Receipts and Payments Account for the financialyear ended on that date.
Further on the basis of our examination of books and records of the Company and according to the informationand explanations given to us and to the best of our knowledge and belief, we certify that:
a. We have reviewed the management report attached to the financial statements for the year ended 31stMarch, 2010 and there is no apparent mistake or material inconsistency with the financial statements; and
b. Based on the information and explanations received during the normal course of our audit and managementrepresentation by officer of the Company charged with the compliance, nothing has come to our attentionwhich causes to believe that the Company has not complied with the terms and conditions of registrationas stipulated by the IRDA.
For CHATURVEDI & SHAH For KARNAVAT & CO. For FORD,RHODES, PARKS & CO.Firm Registration no:101720W Firm Registration no:104863W Firm Registration no:102860W
Chartered Accountants Chartered Accountants Chartered Accountants
Vitesh D. Gandhi Sameer B. Doshi Shrikant B. PrabhuPartner Partner Partner
Membership No. 110248 Membership No.117987 Membership No. 35296
Place : MumbaiDate : 29th June 2010
AAAA AU
DIT
UD
ITU
DIT
UD
ITU
DIT
OR
S’
RE
PO
RO
RS
’ R
EP
OR
OR
S’
RE
PO
RO
RS
’ R
EP
OR
OR
S’
RE
PO
RTTTT T

okf"kZd fjiksVZANNUAL REPORT 2009-10
51
COMMENTS OF THE COMPTROLLER AND AUDITOR GENERAL OFINDIA UNDER SECTION 619(4) OF THE COMPANIES ACt, 1956 ON THEACCOUNTS OF THE NEW INDIA ASSURANCE COMPANY LIMITED FORTHE YEAR ENDED 31 MARCH 2010.The preparation of financial statements of the New India Assurance Company Limited for the year ended 31March 2010 in accordance with the financial reporting framework prescribed under the Insurance Act, 1938read with the Insurance Regulatory and Development Authority (Preparation of Financial Statements andAuditor’s Report of Insurance Companies) Regulations, 2002 and the Companies Act, 1956 is the responsibilityof the management of the company. The statutory auditors appointed by the Comptroller and Auditor Generalof India under section 619(2) of the Companies Act, 1956 are responsible for expressing opinion on thesefinancial statements under section 227 of the Companies Act 1956 based on independent audit in accordancewith the auditing and assurance standards prescribed by their professional body the Institute of CharteredAccountants of India. This is stated to have been done by them vide their Audit Report dated 29 June 2010.
I on, the behalf of the Comptroller and Auditor General of India have conducted a supplementary audit undersection 619(3) (b) of the Companies Act, 1956 of the financial statements of the New India Assurance Companylimited, for the year ended 31 March 2010. This supplementary audit has been carried out independentlywithout access to the working papers of the statutory auditors and is limited primarily to inquiries of the statutoryauditors and company personnel and a selective examination of some of the accounting records. On the basisof my audit nothing significant has come to my knowledge which would give rise to any comment upon orsupplement to Statutory Auditor’s report under section 619 (4) of the Companies Act, 1956.
For and on the behalf of theComptroller and Auditor General of India
(ALKA R. BHARDWAJ)Principal Director of Commercial Audit andEx-Officio Member, Audit Board-I, Mumbai
Place : MumbaiDate: 11 August 2010
CO
MM
EN
TS
OF
CA
CO
MM
EN
TS
OF
CA
CO
MM
EN
TS
OF
CA
CO
MM
EN
TS
OF
CA
CO
MM
EN
TS
OF
CA
GG GGG

52
Estbd. 1919
fn U;w bafM;k ,';ksjUl da- fy-THE NEW INDIA ASSURANCE CO. LTD.
CE
RC
ER
CE
RC
ER
CE
RT
IFIC
AT
IFIC
AT
IFIC
AT
IFIC
AT
IFIC
AT
E -
SC
HE
DU
LE
CT
E -
SC
HE
DU
LE
CT
E -
SC
HE
DU
LE
CT
E -
SC
HE
DU
LE
CT
E -
SC
HE
DU
LE
C
CERTIFICATE FOR THE YEAR ENDED 31ST MARCH, 2010 AS REQUIRED BY SCHEDULE ‘C’OF INSURANCE REGULATORY & DEVELOPMENT AUTHORITY REGULATIONS, 2002 FORPREPARATION OF FINANCIAL STATEMENTS AND AUDITOR’S REPORT OF INSURANCECOMPANIES IN CASE OF THE NEW INDIA ASSURANCE COMPANY LIMITED.
We certify that:
1 (a) We have verified Cash balances, to the extent considered necessary, and securities related to theCompany’s Loans and Investments, subject to paragraph (b) herein mentioned below, on followingbasis:
Sr. No. Asset Nature of Verification
i) Cash Physical verification, Management Certificateand Regional / Branch Auditor’s reports.
ii) Investments Custodians’ Certificate (RBI, HDFC Bank & SHCIL)and Management’s Certificate.
iii) Securities relating to loan Management’s Certificate.
(b) i) No confirmations were available from custodian in respect of following:
a) Investments in equity shares having book value of Rs.1.32 lakh are under objection.
b) Equity shares, and Debentures/ Bonds amounting to Rs.1.13 Lakh, and Rs.55.01 lakh respectivelyfor which no evidence of ownership was available.
ii) The number of equity shares, preference shares, other approved securities and Debentures /Bondsactually held by Stock Holding Corporation of India Ltd. (Custodian) on behalf of the Company are inexcess of the number of equity shares, preference and Debentures/ Bonds held as per the books of theCompany. The book value of such excess is Rs.17.02 lakh, Rs. 2.29 lakh, and Rs.8.67 lakh respectively.
iii) Investment in Term Loans, Loans to State Government for the purpose of Housing & Fire FightingEquipments, Investments in Pass Through Certificates (PTC) and Balances on account of restructuring/rescheduling of debts are subject to confirmations/ reconciliations.
iv) No confirmations were available in respect of foreign investments amounting to Rs.18.27 lakhs.
2 To the best of our information and explanations given to us, the Company has not undertaken any trust astrustee.
3 No part of the assets of Policyholders’ funds has been directly or indirectly applied in contravention of theprovision of the Insurance Act, 1938 relating to the application and Investments of the Policy Holders’ funds.
As per our report of even date
For CHATURVEDI & SHAH For KARNAVAT & CO. For FORD,RHODES, PARKS & CO.Firm Registration no:101720W Firm Registration no:104863W Firm Registration no:102860W
Chartered Accountants Chartered Accountants Chartered Accountants
Vitesh D. Gandhi Sameer B. Doshi Shrikant B. PrabhuPartner Partner Partner
Membership No. 110248 Membership No.117987 Membership No. 35296
Place : MumbaiDate : 29th June 2010

okf"kZd fjiksVZANNUAL REPORT 2009-10
53
FIRE INSURANCE REVENUE ACCOUNT FOR THE YEAR ENDED 31ST MARCH, 2010[Registration No.190, Renewal Date 10.03.2010]
Particulars Schedule Current year Previous yearRs (000) Rs (000)
1. Premium earned (net) 1 10675820 9629244
2. Profit on sale or redemption of investments (policyholders) - 784746 361649
Loss on sale or redemption of investments (policyholders) - 0 0
3. Interest dividend and rent (gross) - 1050607 968074—————— ——————
Total (A) 12511173 10958967—————— ——————
1. Claims incurred (net) 2 10687797 6066838
2. Commission 3 1282719 1370519
3. Operating expenses related to insurance business 4 3596707 2933957
4. Others - Foreign taxes 194 186
Amortisation, writeoff, provisions - investments 973 (7901)—————— ——————
Total (B) 15568390 10363599—————— ——————
Operating profit/loss(-) C=(A-B) (3057217) 595368—————— ———————————— ——————
Appropriations
Transfer to share holders account (profit and loss account) - (3057217) 595368
Transfer to catastrophic reserves - 0 0
Transfer to other reserves - 0 0—————— ——————
Total (3057217) 595368—————— ———————————— ——————
Significant accounting policies and notes to accounts 16
As required by section 40C(2) of the Insurance Act 1938, we certify that, to the best of our knowledge andaccording to the information and explanations given to us, and so far as appears from our examination of theCompany’s books of account, all expenses of management, wherever incurred, whether directly or indirectly inrespect of fire insurance business have been fully debited in the fire insurance revenue account as expenses.
The Schedules referred to above form integral part of the revenue account.
RE
VE
NU
E A
RE
VE
NU
E A
RE
VE
NU
E A
RE
VE
NU
E A
RE
VE
NU
E A
CC
OU
NT
CC
OU
NT
CC
OU
NT
CC
OU
NT
CC
OU
NT
A. R. Sekar I. S. Phukela M. RamadossDirector and Company Secretary Director Chairman-Cum-Managing Director
As per our report of even date
For CHATURVEDI & SHAH For KARNAVAT & CO. For FORD, RHODES, PARKS & CO.Chartered Accountants Chartered Accountants Charterted Accountants
Vitesh D. Gandhi Sameer B. Doshi Shrikant B. PrabhuPartner Partner Partner
Membership No. 110248 Membership No. 117987 Membership No. 35296
MumbaiJune 29, 2010

54
Estbd. 1919
fn U;w bafM;k ,';ksjUl da- fy-THE NEW INDIA ASSURANCE CO. LTD.
RE
VE
NU
E A
RE
VE
NU
E A
RE
VE
NU
E A
RE
VE
NU
E A
RE
VE
NU
E A
CC
OU
NT
CC
OU
NT
CC
OU
NT
CC
OU
NT
CC
OU
NT
MARINE INSURANCE REVENUE ACCOUNT FOR THE YEAR ENDED 31ST MARCH, 2010[Registration No.190, Renewal Date 10.03.2010]
Particulars Schedule Current year Previous yearRs (000) Rs (000)
1. Premium earned (net) 1 2376571 2317695
2. Profit on sale or redemption of investments (policyholders) - 302214 128731Loss on sale or redemption of investments (policyholders) - 0 0
3. Interest dividend and rent (gross) - 404600 344593—————— ——————
Total (A) 3083385 2791019—————— ——————
1. Claims incurred (net) 2 1907526 2771112
2. Commission 3 190709 145463
3. Operating expenses related to insurance business 4 865810 778043
4. Others - Foreign taxes 104 131
Amortisation, writeoff, provisions - investments 375 (2813)—————— ——————
Total (B) 2964524 3691936—————— ——————
Operating profit/loss(-) C=(A-B) 118861 (900917)—————— ———————————— ——————
AppropriationsTransfer to share holders account (profit and loss account) - 118861 (900917)Transfer to catastrophic reserves - 0 0Transfer to other reserves - 0 0
—————— ——————Total 118861 (900917)
—————— ———————————— ——————
Significant accounting policies and notes to accounts 16
As required by section 40C(2) of the Insurance Act 1938, we certify that, to the best of our knowledge andaccording to the information and explanations given to us, and so far as appears from our examination of theCompany’s books of account, all expenses of management, wherever incurred, whether directly or indirectly inrespect of marine insurance business have been fully debited in the marine insurance revenue account asexpenses.
The Schedules referred to above form integral part of the revenue account.
A. R. Sekar I. S. Phukela M. RamadossDirector and Company Secretary Director Chairman-Cum-Managing Director
As per our report of even date
For CHATURVEDI & SHAH For KARNAVAT & CO. For FORD, RHODES, PARKS & CO.Chartered Accountants Chartered Accountants Charterted Accountants
Vitesh D. Gandhi Sameer B. Doshi Shrikant B. PrabhuPartner Partner Partner
Membership No. 110248 Membership No. 117987 Membership No. 35296
MumbaiJune 29, 2010

okf"kZd fjiksVZANNUAL REPORT 2009-10
55
MISCELLANEOUS INSURANCE REVENUE ACCOUNT FOR THE YEAR ENDED 31ST MARCH, 2010[Registration No.190, Renewal Date 10.03.2010]
Particulars Schedule Current year Previous yearRs (000) Rs (000)
1. Premium earned (net) 1 44056179 40546023
2 Profit on sale or redemption of investments (policyholders) - 4115806 2042894
Loss on sale or redemption of investments (policyholders) - 0 03. Interest dividend and rent (gross) - 5510182 5468490
—————— ——————Total (A) 53682167 48057407
—————— ——————1. Claims incurred (net) 2 38729174 37880746
2. Commission 3 4140249 4092281
3. Operating expenses related to insurance business 4 12898123 10838118
4. Others - Foreign taxes 6960 14128
Amortisation, writeoff, provisions - investments 5106 (44629)—————— ——————
Total (B) 55779612 52780644—————— ——————
Operating profit/loss(-) C=(A-B) (2097445) (4723237)—————— ———————————— ——————
Appropriations
Transfer to share holders account (profit and loss account) - (2097445) (4723237)
Transfer to catastrophic reserves - 0 0
Transfer to other reserves - 0 0—————— ——————
Total (2097445) (4723237)—————— ———————————— ——————
Significant accounting policies and notes to accounts 16
As required by section 40C(2) of the Insurance Act 1938, we certify that, to the best of our knowledge andaccording to the information and explanations given to us, and so far as appears from our examination of theCompany’s books of account, all expenses of management, wherever incurred, whether directly or indirectly inrespect of miscellaneous insurance business have been fully debited in the miscellaneous insurance revenueaccount as expenses.
The Schedules referred to above form integral part of the revenue account.
A. R. Sekar I. S. Phukela M. RamadossDirector and Company Secretary Director Chairman-Cum-Managing Director
As per our report of even date
For CHATURVEDI & SHAH For KARNAVAT & CO. For FORD, RHODES, PARKS & CO.Chartered Accountants Chartered Accountants Charterted Accountants
Vitesh D. Gandhi Sameer B. Doshi Shrikant B. PrabhuPartner Partner Partner
Membership No. 110248 Membership No. 117987 Membership No. 35296
MumbaiJune 29, 2010
RE
VE
NU
E A
RE
VE
NU
E A
RE
VE
NU
E A
RE
VE
NU
E A
RE
VE
NU
E A
CC
OU
NT
CC
OU
NT
CC
OU
NT
CC
OU
NT
CC
OU
NT

56
Estbd. 1919
fn U;w bafM;k ,';ksjUl da- fy-THE NEW INDIA ASSURANCE CO. LTD.
PROFIT AND LOSS ACCOUNT FOR THE YEAR ENDED 31ST MARCH, 2010[Registration No.190, Renewal Date 10.03.2010]
Particulars Schedule Current year Previous yearRs (000) Rs (000)
1. Operating profit/loss (-)a. Fire insurance - (3057217) 595368b. Marine insurance - 118861 (900917)c. Miscellaneous insurance (2097445) (4723237)
2. Income from investmentsa. Interest dividend and rent (gross) - shareholders 5289263 5426859
b. Profit on sale of investment - shareholders - 3950791 2027342Less: Loss on sale of investment - shareholders - 0 0
3. Other income misc receipts - credit balances written back 159244 497838—————— ——————Total (A)=1+2+3 4363497 2923253—————— ———————————— ——————
4. Provisions(other than taxation)a. Others - amortisation, provision for thinly traded
shares - shareholders - 45517 47638b. For doubtful debts - investments(shareholders) - (37245) (74422)c. For doubtful debts - operations 775134 0d. For dimunition in value of investments (shareholders) - (3371) (17505)
5. Other expenses(other than those related to insurance business)a. Others - interest on income/service tax - 3380 48b. (Profit)/loss on sale of assets (13658) (4970)c. Penalty for breach of tariff 1000 200—————— ——————
Total (B)=(4+5) 770757 (49011)—————— ———————————— ——————Profit before tax (A-B) - 3592740 2972264—————— ——————Provision for taxation - current tax - 537954 690665
fringe benefit tax 0 405000deferred tax (712735) (131491)earlier years tax 0 106536wealth tax 5800 5100MAT Credit entitlement (285000) (345000)—————— ——————
Profit after tax 4046721 2241454—————— ——————Appropriations
a. Proposed final dividend - 850000 450000b. Dividend distribution tax. - 144458 76478c. Contingency Reserves for Unexpired Risks
(refer note number 17 to notes to accounts in Schedule 16 B) 0 449500d. Transfer to general reserves 3052263 1265476—————— ——————
Profit/loss (-) carried forward to the balance sheet - 0 0—————— ——————Basic and diluted earnings per share (Rs.){Refer Note 11 B to notes to accounts in Schedule 16 B} 20.23 11.21Significant accounting policies and notes to accounts 16The Schedules referred to above form integral part of the Profit and Loss Account.
PR
OF
IT &
LP
RO
FIT
& L
PR
OF
IT &
LP
RO
FIT
& L
PR
OF
IT &
LO
SS
AO
SS
AO
SS
AO
SS
AO
SS
AC
CO
UN
TC
CO
UN
TC
CO
UN
TC
CO
UN
TC
CO
UN
T
A. R. Sekar I. S. Phukela M. RamadossDirector and Company Secretary Director Chairman-Cum-Managing Director
As per our report of even date
For CHATURVEDI & SHAH For KARNAVAT & CO. For FORD, RHODES, PARKS & CO.Chartered Accountants Chartered Accountants Charterted Accountants
Vitesh D. Gandhi Sameer B. Doshi Shrikant B. PrabhuPartner Partner Partner
Membership No. 110248 Membership No. 117987 Membership No. 35296
MumbaiJune 29, 2010

okf"kZd fjiksVZANNUAL REPORT 2009-10
57
BALANCE SHEET AS AT 31ST MARCH, 2010[Registration No.190, Renewal Date 10.03.2010]
Particulars Schedule Current year Previous yearRs (000) Rs (000)
A. Sources of Funds
1. Share Capital 5 & 5A 2000000 2000000
2. Reserves and Surplus 6 72302068 71221519
3. Fair Value Change Account - 156417365 74172943
4. Borrowings 7 0 0—————— ——————
Total A 230719433 147394462—————— ———————————— ——————
B. Application of Funds
1. Investments 8 262032190 177675725
2. Loans 9 5593472 5938624
3. Fixed Assets 10 1621507 1581706
4. Deferred Tax Assets 945789 233054
5. Current Assets
a. Cash and Bank Balances 11 43651882 33208377
b. Advances and Other Assets 12 54484215 50670163—————— ——————
Sub total(a+b) 98136097 83878540—————— ——————
c. Current Liabilities 13 94805749 86217083
d. Provisions 14 42803873 35696104—————— ——————
Sub total(c+d) 137609622 121913187—————— ——————
Net Current Assets (a+b-c-d) (39473525) (38034647)
6. Misclleaneous Expenditure(to the extent not written off or adjusted) 15 0 0
—————— ——————Total B 230719433 147394462
—————— ——————Significant accounting policies and notes to accounts 16
The Schedules referred to above form integral part of the Balance Sheet
BA
LB
AL
BA
LB
AL
BA
LA
NC
E S
HE
ET
AN
CE
SH
EE
TA
NC
E S
HE
ET
AN
CE
SH
EE
TA
NC
E S
HE
ET
A. R. Sekar I. S. Phukela M. RamadossDirector and Company Secretary Director Chairman-Cum-Managing Director
As per our report of even date
For CHATURVEDI & SHAH For KARNAVAT & CO. For FORD, RHODES, PARKS & CO.Chartered Accountants Chartered Accountants Charterted Accountants
Vitesh D. Gandhi Sameer B. Doshi Shrikant B. PrabhuPartner Partner Partner
Membership No. 110248 Membership No. 117987 Membership No. 35296
MumbaiJune 29, 2010

58
Estbd. 1919
fn U;w bafM;k ,';ksjUl da- fy-THE NEW INDIA ASSURANCE CO. LTD.S
CH
ED
UL
ES
SC
HE
DU
LE
SS
CH
ED
UL
ES
SC
HE
DU
LE
SS
CH
ED
UL
ES
SCHEDULES TO FIRE INSURANCE REVENUE ACCOUNT FOR THE YEAR ENDED 31ST MARCH, 2010[Registration No.190, Renewal Date 10.03.2010]
Particulars Current year Previous yearRs (000) Rs (000)
SCHEDULE 1 - FIRE
Premium Earned(net)
Premium from direct business - in India 9237825 7733267
- outside India 2881379 2250493—————— ——————
Total 12119204 9983760
Add: Premium on reinsurance accepted 4887509 5100461
Less: Premium on reinsurance ceded 6036542 4702755—————— ——————
Net premium 10970171 10381466
Adjustment for change in reserve for un-expired risks 294351 752222—————— ——————
Total premium earned (net) 10675820 9629244—————— ———————————— ——————
SCHEDULE 2 - FIRE
Claims Incurred (Net)
Claims Paid Direct 5991657 5310381
Add: Claims on reinsurance accepted 3322733 2111806
Less: Claims on reinsurance ceded 3533475 2708633—————— ——————
Net claims paid 5780915 4713554
Add:Claims outstanding at end (net) 14260144 9353262
Less :Claims outstanding at beginning (net) 9353262 7999978—————— ——————
Total incurred claims (net) 10687797 6066838—————— ———————————— ——————
SCHEDULE 3- FIRE
Commission (Net)
Commission - Direct 1321263 1129829
Add : Commission on reinsurance accepted 897403 939021
Less : Commission on reinsurance ceded 935947 698331—————— ——————
Commission (net) 1282719 1370519—————— ———————————— ——————
Break-up of Commission Direct
Direct Commission 1003542 896069
Direct Brokerage 173296 132807
Corporate Agency Commission 144424 100953
Referrals 0 0—————— ——————
Total Commission 1321262 1129829—————— ———————————— ——————

okf"kZd fjiksVZANNUAL REPORT 2009-10
59
SCHEDULES TO MARINE INSURANCE REVENUE ACCOUNT FOR THE YEAR ENDED 31ST MARCH, 2010[Registration No.190, Renewal Date 10.03.2010]
Particulars Current year Previous yearRs (000) Rs (000)
SCHEDULE 1 - MARINE
Premium Earned (Net)
Premium from direct business - in India 4743022 4460973
- outside India 503682 654877—————— ——————
Total 5246704 5115850
Add: Premium on reinsurance accepted 211840 217639
Less: Premium on reinsurance ceded 3168630 2956919—————— ——————
Net premium 2289914 2376570
Adjustment for change in reserve for un-expired risks (86657) 58875—————— ——————
Total premium earned (net) 2376571 2317695—————— ———————————— ——————
SCHEDULE 2 - MARINE
Claims Incurred (Net)
Claims paid direct 3704177 2037690
Add: Claims on reinsurance accepted 185081 129426
Less: Claims on reinsurance ceded 1787818 510617—————— ——————
Net claims paid 2101440 1656499
Add:Claims outstanding at end (net) 3030569 3224483
Less :Claims outstanding at beginning (net) 3224483 2109870—————— ——————
Total incurred claims (net) 1907526 2771112—————— ———————————— ——————
SCHEDULE 3 - MARINE
Commission (Net)
Commission - Direct 412821 441040
Add : Commission on reinsurance accepted 32955 25929
Less : Commission on reinsurance ceded 255067 321506—————— ——————
Commission (net) 190709 145463—————— ———————————— ——————
Break-up of Commission Direct
Direct Commission 310767 361213
Direct Brokerage 100034 77249
Corporate Agency Commission 2020 2578
Referrals 0 0—————— ——————
Total Commission (net) 412821 441040—————— ———————————— ——————
SC
HE
DU
LE
SS
CH
ED
UL
ES
SC
HE
DU
LE
SS
CH
ED
UL
ES
SC
HE
DU
LE
S

60
Estbd. 1919
fn U;w bafM;k ,';ksjUl da- fy-THE NEW INDIA ASSURANCE CO. LTD.
SCHEDULES TO MISCELLANEOUS INSURANCE REVENUE ACCOUNT FOR THE YEAR ENDED 31ST MARCH, 2010[Registration No.190, Renewal Date 10.03.2010]
Particulars Current year Previous yearRs (000) Rs (000)
SCHEDULE 1 - MISCELLANEOUS
Premium Earned (Net)
Premium from direct business - in India 46444289 42894086
- outside India 7181214 6564194—————— ——————
Total 53625503 49458280
Add: Premium on reinsurance accepted 7362151 6263251
Less: Premium on reinsurance ceded 14221143 13476514—————— ——————
Net premium 46766511 42245017
Adjustment for change in reserve for un-expired risks 2710332 1698994—————— ——————
Total premium earned (net) 44056179 40546023—————— ———————————— ——————
SCHEDULE 2 - MISCELLANEOUS
Claims Incurred (Net)
Claims paid direct 42877183 40892153
Add: Claims on reinsurance accepted 2525695 1157699
Less: Claims on reinsurance ceded 9037981 8486973—————— ——————
Net claims paid 36364897 33562879
Add:Claims outstanding at end (net) 57971065 55606788
Less :Claims outstanding at beginning (net) 55606788 51288921—————— ——————
Total incurred claims (net) 38729174 37880746—————— ———————————— ——————
SCHEDULE 3 - MISCELLANEOUS
Commission (Net)
Commission - Direct 5472449 5360117
Add : Commission on reinsurance accepted 932969 781081
Less : Commission on reinsurance ceded 2265169 2048917—————— ——————
Commission (net) 4140249 4092281—————— ———————————— ——————
Break-up of Commission Direct
Direct Commission 4507461 4450712
Direct Brokerage 496123 471096
Corporate Agency Commission 468865 438309
Referrals 0 0—————— ——————
Total Commission 5472449 5360117—————— ———————————— ——————
SC
HE
DU
LE
SS
CH
ED
UL
ES
SC
HE
DU
LE
SS
CH
ED
UL
ES
SC
HE
DU
LE
S

okf"kZd fjiksVZANNUAL REPORT 2009-10
61
SCHEDULES FOR THE YEAR ENDED 31ST MARCH, 2010[Registration No.190, Renewal Date 10.03.2010]
Particulars Current year Previous yearRs (000) Rs (000)
SCHEDULE - 4
Operating expenses related to insurance business
1. Employees remuneration and welfare benefits 11626294 10954031
2. Travel conveyance and vehicle running expenses 424465 405897
3. Training expenses 25671 24541
4. Rent rates and taxes 672114 553050
5. Repairs and maintenance 454485 444071
6. Printing and stationery 334902 302170
7. Communication expenses 451057 308385
8. Legal and professional charges 318539 351710
(Outsourcing expenses) -TPA Fees (Refer Note No.16 in Sch 16B) 0 697502
9. Auditors fees, expenses etc. as Auditor 39389 37129
Auditors fees, expenses etc. as Advisor or other Capacity - Taxation 0 0
Auditors fees, expenses etc. as Advisor or other Capacity - Insurance 0 0
Auditors fees, expenses etc. as Advisor or other Capacity - Mgt Services 0 0
Auditors fees, expenses etc. in other Capacity 0 0
10. Advertisement and publicity 283423 225307
11. Interest and bank charges 53193 83381
12. Others -
Exchange gain(-)/loss 102882 (100645)
Provision for bad and doubtful debts 2129 (15382)
IT implementation 120482 101039
Input service tax recovery 852267 (1102342)
Other taxes 213429 230607
Others 766026 567813
13. Depreciation 619893 481854—————— ——————
Total 17360640 14550118—————— ———————————— ——————
Apportioned to fire segment 3596707 2933957
Apportioned to marine segment 865810 778043
Apportioned to miscellaneous segment 12898123 10838118—————— ——————
Total 17360640 14550118—————— ———————————— ——————
SC
HE
DU
LE
SS
CH
ED
UL
ES
SC
HE
DU
LE
SS
CH
ED
UL
ES
SC
HE
DU
LE
S

62
Estbd. 1919
fn U;w bafM;k ,';ksjUl da- fy-THE NEW INDIA ASSURANCE CO. LTD.
SCHEDULES FOR THE YEAR ENDED 31ST MARCH, 2010[Registration No.190, Renewal Date 10.03.2010]
Particulars Current year Previous yearRs (000) Rs (000)
Schedule - 5
Share Capital
1. Authorised capital30,00,00,000 (Previous Year 30,00,00,000)Equity shares of Rs 10 each 3000000 3000000
2. Issued capital20,00,00,000 (Previous Year 20,00,00,000)Equity shares of Rs 10 each 2000000 2000000
3. Subscribed capital20,00,00,000 (Previous Year 20,00,00,000)Equity shares of Rs 10 each 2000000 2000000
4. Called up capital20,00,00,000 (Previous Year20,00,00,000)Equity shares of Rs 10 each 2000000 2000000
—————— ——————Total 2000000 2000000
—————— ———————————— ——————Note : Of the above 19,61,49,366 shares are issued as
fully paid up bonus shares by capitalisation of General Reserves.
SCHEDULE 5A
PATTERN OF SHAREHOLDING
(As Certified by Management)Numbers in (000)
Share holder Current year Previous yearNumbers % of holding Numbers % of holding
Promoters - Indian 200000 100 200000 100
- Foreign - - - -
Others - - - -—————— —————— —————— ——————
Total 200000 100 200000 100—————— —————— —————— ———————————— —————— —————— ——————
SC
HE
DU
LE
SS
CH
ED
UL
ES
SC
HE
DU
LE
SS
CH
ED
UL
ES
SC
HE
DU
LE
S

okf"kZd fjiksVZANNUAL REPORT 2009-10
63
SCHEDULES FOR THE YEAR ENDED 31ST MARCH, 2010[Registration No.190, Renewal Date 10.03.2010]
Particulars Current year Previous yearRs (000) Rs (000)
SCHEDULE 6
Reserves and surplus
1. Capital reserve (Op. balance) 575 575
Addition during the year 0 0
Deduction during the year 0 0—————— ——————
(Cl.balance) 575 575—————— ——————
2. Capital redemption reserve 0 0
3. Share premium 0 0
4. General reserves (Op. balance) 68987199 67721719
Addition during the year - balance transferred from P & L account 3052263 1265476
Transfer from Investment Reserve 0 0
Net deduction during the year (refer note no 11 D) 0 0—————— ——————
(Cl. balance) 72039462 68987195—————— ——————
5. Catastrophe reserve 0 0
6. Other reserves
a. Foreign currency translation reserve
Opening balance 1784249 5741
Addition during the year 0 0
(Refer note no 18 to notes to accounts in schedule 16 B) (1971718) 1778508
Deduction during the year—————— ——————
(Cl.balance) (187469) 1784249—————— ———————————— ——————
b. Contingency reserves for unexpired risks
(refer note number 17 to notes to accounts in Schedule 16 B) 449500 449500
7. Balance of profit in profit and loss account 0 0—————— ——————
Total 72302068 71221519—————— ———————————— ——————
SCHEDULE 7
Borrowings
1. Debentures / bonds - -
2. Banks - -
3. Financial institutions - -
4. Others - -—————— ——————
Total Nil Nil—————— ———————————— ——————
SC
HE
DU
LE
SS
CH
ED
UL
ES
SC
HE
DU
LE
SS
CH
ED
UL
ES
SC
HE
DU
LE
S

64
Estbd. 1919
fn U;w bafM;k ,';ksjUl da- fy-THE NEW INDIA ASSURANCE CO. LTD.
SCHEDULES FOR THE YEAR ENDED 31ST MARCH, 2010[Registration No.190, Renewal Date 10.03.2010]
Particulars Current year Previous yearRs (000) Rs (000)
SCHEDULE 8
Investments
Long term investments
1. Government securities
Central Government securities 28714927 29985499
State Government securities 10535199 10956967
Foreign Government Securities 1598977 2233531
2. Other approved securities 359516 372474
3. Other investments
a Shares
aa. Equity 178032651 94524937
Equity share odd lots 0 0
bb. Preference
Preference shares 8 795319
Preference shares of railways in India 0 0
b. Mutual funds 0 0
c. Derivative instruments 0 0
d Debentures/Bonds/PTCs
Debentures in India 11204373 7987138
Other Debentures - Foreign 67827 123849
e. Other Securities (to be specified)
Foreign shares 0 0
Foreign preference shares 17 17
Foreign securities 0 0
Special deposit with Government of India 0 0f. Subsidiaries 595564 595564
g. Investment properties (real estate) 0 0
4. Investment in infrastructure and social sector 16021047 16673417
5. Investment in housing bonds 3624904 4780646
6. Other than approved investments 3549255 4178175
—————— ——————Total 254304265 173207533
—————— ———————————— ——————
SC
HE
DU
LE
SS
CH
ED
UL
ES
SC
HE
DU
LE
SS
CH
ED
UL
ES
SC
HE
DU
LE
S

okf"kZd fjiksVZANNUAL REPORT 2009-10
65
SCHEDULES FOR THE YEAR ENDED 31ST MARCH, 2010[Registration No.190, Renewal Date 10.03.2010]
Particulars Current year Previous yearRs (000) Rs (000)
SCHEDULE 8 CONTINUED
Short term investments1. Government securities
Central Government. securities 2162253 328001State Government. securities 488831 855253Government Guaranteed securities 0 0Foreign Government securities 345448 84299
2. Other approved securities 11467 4734613. Other investments
a Sharesaa. Equity
Equity share odd lots 0 0bb. Preference 0 0
b. Mutual funds 0 0c. Derivative instrument 0 0d. Debentures/Bonds/PTCs 0 1067445
Debentures in India 0 0Other debentures Foreign 0 0
e. Other securities 0 0Special deposit with Government of India 0 0
f. Subsidiaries 0 0g. Investment properties (real estate) 0 0
4. Investment in infrastructure and social sector 1903848 11433225. Investment in housing bonds 1748633 15838566. Other than approved investments 0 0
—————— ——————Total 7727925 4468192
—————— ——————Grand Total 262032190 177675725—————— ———————————— ——————
Investments1. India 259213782 1744268872. Outside India 2818408 3248838
Investment in Associates included in equity above 182509 182509Aggregate amount of Companies Investments in other than listed equity shares Book Value 638400 620024
Market value 665568 594248FITL Preference Shares (LTUA) amounting to Rs.31806328 (P.Y. Rs.32299278) is netted against interest suspenseof an equal amount. FITL Debentures amounting to Rs.28341975 (P.Y. Rs.46329791) are netted against interestsuspense of an equal amount. Equity Shares (LTUA) amounting to Rs.6481537 (P.Y. Rs.6205687) is nettedagainst interest suspense of an equal amount. Preference Shares (LTUA) amounting toRs.122693109 (P.Y. Rs.123055576) is netted against interest suspense of an equal amount.Provision made for bad and doubtful debts shown underSchedule 14.5 against assets in Schedule 8Debentures - Standard Provisions 50961 34055Housing Sector Bonds - Standard Provisions 21503 25465Infrastructure Investments - Standard Provisions 71769 71323Investments in OAS - Standard Provisions 1484 3384Other than approved Investments 598040 651552Equity - Thinly traded and unlisted equity - dimunistion in value 26881 25776Equity - Long Term Unapproved Thinly traded and unlisted equity - dimunistion in value (F)account 6034/12 292 292Equity Subsidiary - Long Term Unapproved Thinly traded and unlisted equity -dimunistion in value (F)account 6039/12 1535 1535Investments in France Agency (Foreign & France) 1838 1838
—————— ——————Total 774303 815220
SC
HE
DU
LE
SS
CH
ED
UL
ES
SC
HE
DU
LE
SS
CH
ED
UL
ES
SC
HE
DU
LE
S

66
Estbd. 1919
fn U;w bafM;k ,';ksjUl da- fy-THE NEW INDIA ASSURANCE CO. LTD.
SCHEDULES FOR THE YEAR ENDED 31ST MARCH, 2010[Registration No.190, Renewal Date 10.03.2010]
Particulars Current year Previous yearRs (000) Rs (000)
SCHEDULE 9Loans1. Security-wise classification
Secureda. On mortgage of property
aa. In IndiaLoan against mortgage of property 0 0Housing, vehicle and computer loans to employees 2321693 2451200Direct Term Loans 1316027 1375848
bb. Outside India housing, vehicle loan to employees 5846 6740b. On shares, bonds, Government securities 0 0c. Others
Loans guaranteed by banks/governments-loans toState Government housing, FFE Loans to Hudco 1771827 1921643Unsecured (Term loans, bridge loans, short-term loans, Term Loan PFPS) 178079 183193—————— ——————
Total 5593472 5938624—————— ———————————— ——————2. Borrower-wise classification
a. Central and State Governments(term loans, housing and FFE) 1499493 1649309b. Banks and financial institutions 0 0c. Subsidiaries 0 0d. Industrial undertakings(term loans,bridge loans,
short-term loans, loans to PFPS) 1322335 1361413e. Others - Housing loans,vehicle loans, computer loans to employees 2327539 2457940
HUDCO, Term loans and PFPS 444105 469962—————— ——————Total 5593472 5938624—————— ———————————— ——————
3. Performance-wise classificationa. Loans classified as standard
aa. In India:Term loans, bridge loans,State Government housing and FF, loans to HUDCO, PFPS 1872604 2053499Housing, vehicle and computer loans to employees 2321693 2451200
bb. Outside India (loans to employees) 5846 6740b. Non-performing loans less provisions
aa. In India (term loans, bridge loans, short-term loans, loans PFPS) 1393329 1427185bb. Outside India 0 0
—————— ——————Total 5593472 5938624—————— ———————————— ——————
4. Maturity-wise classificationsa. Short-term (term loans, direct bridge loans, short-term loans, term loans PFPS) 0 0b. Long-term
(term loans direct, loans State Government housing and FF,loans to HUDCO and loans PFPS) 3265933 3480684Housing, vehicle, and computer loans to employees. 2327539 2457940
—————— ——————Total 5593472 5938624—————— ———————————— ——————
FITL PFPS amounting to Rs.1017014127 (P.Y. Rs.909784970) and FITL Short Term Loan amounting toRs.1675199 (P.Y. Rs.1675199) and Direct Term Loans amounting to Rs.46799876 (P.Y. Rs.84517150)are netted against interest suspense of an equal amount.Provision made for bad and doubtful debts shown under Schedule 14.5 against assets in Schedule 9Direct Term Loans (Investments) std.provision 558 650Direct Term Loans (Investments) 26453 32259Bridge Loan Investments 400 400Term Loans PFPS std.provision 161 193Term Loans PFPS 1035520 1065683Short Term Loans Investments 89469 97503Loans to HUDCO std. Provision 1089 1089Housing Loans to State Govts. - std.provision 5378 5892Housing Loans to State Govts. 74059 73401FFE Loans to State Govts. - std.provision 304 390FFE Loans to State Govts. 4858 4858—————— ——————
Total 1238249 1282318
SC
HE
DU
LE
SS
CH
ED
UL
ES
SC
HE
DU
LE
SS
CH
ED
UL
ES
SC
HE
DU
LE
S

okf"kZd fjiksVZANNUAL REPORT 2009-10
67
SCHE
DULE
FO
R TH
E YE
AR E
NDED
31-
03-2
010
[Reg
istr
atio
n N
o.19
0, R
enew
al D
ate
10.0
3.20
10]
Sch
edu
le 1
0
Fix
ed A
sset
s
Par
ticu
lars
GR
OS
S B
LO
CK
DE
PR
EC
IAT
ION
/AM
OR
TIS
AT
ION
Net
Blo
ck
Ope
ning
Add
ition
sD
elet
ions
*Clo
sin
gO
peni
ngA
dditi
ons
Del
etio
ns*C
losi
ng
Clo
sin
gO
peni
ngB
alan
ceB
alan
ceB
alan
ceB
alan
ce
01/0
4/20
09D
urin
g 20
09-2
010
31/0
3/20
1001
/04/
2009
Dur
ing
2009
-201
031
/03/
2010
31/0
3/20
1001
/04/
2009
Int
angi
bles
4146
9329
9717
071
4410
1036
7320
3579
030
7252
4071
5831
1020
Lan
d F
reeh
old
1489
211
990
1609
10
00
016
091
1489
2
Bui
ldin
gs12
9051
449
449
1613
1338
350
6877
4136
120
1218
7226
4361
5707
6027
73
Fur
nitu
res
& F
ittin
gs43
9756
1434
257
5944
8339
3691
3715
218
2538
3818
1766
522
7061
9
Inf
orm
atio
n &
Tech
nolo
gy E
quip
men
ts20
8829
921
4857
6306
722
4008
918
1273
027
8741
5965
720
3181
420
8275
2755
69
Veh
icle
s58
5395
1005
7379
160
6068
0833
4516
7494
852
335
3571
2924
9679
2508
79
Offi
ce E
quip
men
ts11
6685
1817
2568
1159
3410
1575
2949
3649
1008
7515
059
1511
0
Oth
er A
sset
s23
8926
1524
889
9924
5175
1980
8283
3842
6120
2159
4301
640
844
Gra
nd
To
tal
5189
160
6972
0216
1166
5725
196
3607
454
6198
9312
3658
4103
689
1621
507
1581
706
Pre
vio
us
Yea
r43
2620
397
5569
1126
1251
8916
031
7377
448
1854
4817
336
0745
515
8170
511
5242
9
*The
Fig
ures
are
incl
usiv
e of
app
reci
atio
n/de
prec
iatio
n du
e to
for
eign
cur
renc
y flu
ctua
tion
Rs.
(00
0)
SC
HE
DU
LE
SS
CH
ED
UL
ES
SC
HE
DU
LE
SS
CH
ED
UL
ES
SC
HE
DU
LE
S

68
Estbd. 1919
fn U;w bafM;k ,';ksjUl da- fy-THE NEW INDIA ASSURANCE CO. LTD.
SCHEDULES FOR THE YEAR ENDED 31ST MARCH, 2010[Registration No.190, Renewal Date 10.03.2010]
Particulars Current year Previous yearRs (000) Rs (000)
SCHEDULE 11
Cash and Bank balances
1. Cash (including cheques ,drafts and stamps) 2369001 1423502
2. Bank balances
a. Deposit accounts
aa. Short - term (due within 12 months) 7321538 3560028
bb. Others 22140702 21929250
b. Current accounts 5731458 3972118
3. Money at call and short notice
With banks 1120386 956351
With other institutions 4968797 1367128—————— ——————
Total 43651882 33208377—————— ———————————— ——————
Cash and bank balances IN INDIA 18022143 8266722
Cash and bank balances OUTSIDE INDIA 25629739 24941655—————— ——————
Total 43651882 33208377—————— ———————————— ——————
1 above includes remittance in transit 5796 12754
Balances with non scheduled banks included in 2b above 173053 437442
Provision made for bad and doubtful debts shown under
Schedule 14.5 against assets in Schedule 11
Foreign balances included in 2abb above (France 911897) 27830 31113
Foreign balances included in 2b above (France 911897) 8602 9616
Indian balances included in 2b above 94745 70868
—————— ——————Total 131177 111597
—————— ——————
SC
HE
DU
LE
SS
CH
ED
UL
ES
SC
HE
DU
LE
SS
CH
ED
UL
ES
SC
HE
DU
LE
S

okf"kZd fjiksVZANNUAL REPORT 2009-10
69
SCHEDULES FOR THE YEAR ENDED 31ST MARCH, 2010[Registration No.190, Renewal Date 10.03.2010]
Particulars Current year Previous yearRs (000) Rs (000)
SCHEDULE 12
Advances and other assets
A. Advances1. Reserve deposits with ceding companies 151072 1597042. Application money for investments 50000 03. Pre-payments 320363 3179124. Advances to directors / officers 0 05. Advance tax paid and taxes deducted at source
(net of provision for taxation) 13530555 121450886. Others 573967 182151
—————— ——————Total (A) 14625957 12804855
—————— ——————B. Other assets
1. Income accrued on investments 2724594 25035842. Outstanding premiums 908726 8986443. Agents balances 899830 7808004. Foreign agencies balances 649244 11612965. Due from other entities carrying insurance business
(including reinsurers) 32025404 296262146. Due from subsidiaries/holding companies 494 5247. Deposit with R B I persuant to section 7 of Insurance Act 1938 107518 1075208. Others - a. Other accrued income 506789 610319
b. Others including sundry debtors 2035659 2176407—————— ——————
Total (B) 39858258 37865308—————— ——————
TOTAL(A+B) 54484215 50670163—————— ——————
Sundry Debtors amounting to Rs 22056782(P.Y. Rs.38447275)are netted against interest suspense of an equal amount.Provision made for Bad and Doubtful debts shown under Schedule 14.5 against assets in Schedule 12Reinsurance balances included in A1 above 93984 93984Reinsurance balances included in B5 above 902108 902108Reinsurance balances included in B8b above 494 494Foreign balances included in A1 above (France 911871 & 873) 10137 11333Foreign balances included in B1 above (France 911897) 123 137Foreign balances included in B3 above (Fiji, Japan, Hongkong, Mauritus, Bangkok) 26431 20314Foreign balances included in B4 above (Manila & Dubai) 12676 12840Foreign balances included in B5 above (Mauritius, Singapore, France) 1843 1909Foreign balances included in B6 above (Ghana, T&T, Kualalumpur) 453 556Foreign balances included in B8b above (Equitorial Bank London) 4144 2152Indian /Miscellaneous debtors included in B3 above 8144 0Indian Reinsurance Balances/Miscellaneous debtors included in B5 above 600000 19706Indian Coinsurance Balances/Miscellaneous debtors included in B5 above 15219 0Indian miscellaneous debtors included in B8b above 82323 59136Indian miscellaneous debtors included in B4 above 175134 0Indian miscellaneous debtors included in B8b above (TCS) 18554 0Sundry debtors (account 5192) investments Indian included in B8 above - Std. provision 0 200Sundry debtors (account 5192) investments Indian included in B8 above 3851 3851Sundry debtors(account 5192) investments(F) Indian included in B8 above 664 756Income accrued on Investments(account 5131) Indian included in B1 above 5 4
—————— ——————Total 1956287 1129480
SC
HE
DU
LE
SS
CH
ED
UL
ES
SC
HE
DU
LE
SS
CH
ED
UL
ES
SC
HE
DU
LE
S

70
Estbd. 1919
fn U;w bafM;k ,';ksjUl da- fy-THE NEW INDIA ASSURANCE CO. LTD.
SCHEDULES FOR THE YEAR ENDED 31ST MARCH, 2010[Registration No.190, Renewal Date 10.03.2010]
Particulars Current year Previous yearRs (000) Rs (000)
SCHEDULE 13
Current Liabilities
1. Agents balances 465286 5580612. Balances due to other insurance companies 11211214 122093383. Deposits held on reinsurance ceded 14787 602244. Premium received in advance 535671 7471515. Un-allocated premium 0 06. Sundry creditors - Other than service tax payable 5803549 3865395
Service tax payable 98375 27357. Due to subsidiaries / holding company 0 607808. Claims outstanding 75261778 681845349. Due to officers/directors 0 010. Others 1415089 528865
—————— ——————
Total 94805749 86217083—————— ———————————— ——————
Provision made for bad and doubtful debts shown under Schedule 14.5 against assets in Schedule 13Indian balances included in 1 above 443 7513Indian balances included in 4 above 16663 31053Indian balances included in 6 above 8419 4495Reinsurance balances included in 8 above 1123 1123Foreign balances included in 2 above (Singapore, France) 2307 2512—————— ——————
Total 28955 46696
SCHEDULE 14
Provisions
1. Resreve for un-expired risks 31158340 282403132. Provision for taxation (net of payment of taxes) 0 03. Provision for proposed dividend 850000 4500004. Provision for dividend distribution tax 144458 764785. Others - Reserve for bad and doubtful debts. 4100266 3357710
Provision for diminution in value of thinly traded/unlisted shares 28709 27603Provision for Wage Arrears 3645000 1225000Provision for Leave Encashment 2877100 2319000
—————— ——————Total 42803873 35696104
—————— ———————————— ——————
Schedule 15
Miscellaneous Expenditure
1. Discount allowed in issue of shares and debentures 0 02. Others 0 0
(Deferred expenses to the extent not written off)—————— ——————
Total 0 0—————— ———————————— ——————
SC
HE
DU
LE
SS
CH
ED
UL
ES
SC
HE
DU
LE
SS
CH
ED
UL
ES
SC
HE
DU
LE
S

okf"kZd fjiksVZANNUAL REPORT 2009-10
71
RECEIPTS & PAYMENTS ACCOUNT/CASH FLOW STATEMENT FOR THE PERIOD 01.04.2009 TO 31.03.2010[Registration No.190, Renewal Date 10.03.2010]
Particulars Current year Previous yearRs (000) Rs (000)
Operating ActivitiesProfit Appropriated to General Reserve 3052263 1265476Adjustments for Non-Cash ItemsUnexpired Risks Reserves 2918026 2510091Sp. Cont. Reserves - 449500Provisions -Outstanding Claims 7077245 6785764Depreciation 619893 481854Provision- Dividend and Dividend tax 994458 526478Provision for Taxes - Indian 258754 862301Deferred Tax (712735) (131491)Earlier Year Tax - (106536)Reserve for Doubtful debts 979350 108320Foreign Currency Translation Reserve (1971718) 1778508Other Provisions - Outstanding Exps 2865864 802682Prepaid Expenses (2451) (116966)Profit or Loss on Sale of Asset (13658) (4970)Balances Written Back (145017) (564923)
15920274 14646088Items considered separatelyInvestment Items - Interest Dividend & Rent (12254652) (12208016)Investment Items - Profit on sale of Investments (9153557) (4560616)Provision for thinly traded shares 1105 2654Provision for Bad Debts (86292) (167422)Impairment (7811) (39380)Amortisation 104353 104516
Total (5476580) (2222176)Net Increase /Decrease in Current assets (1300707) (7961987)Net Cash Flow from Operating Activities Before Tax (6777287) (10184163)Net Tax Expense - Indian (1016752) (1699977)Net Cash Flow from Operating Activities After Tax (7794039) (11884140)Investing ActivitiesInterest, Dividend and Rent 12033642 12362688Net Increase/decrease in Investments (Adj amortisation/ impairment) 7031264 7728648Net Increase/decrease in Loans 345152 639023Net Additions to Assets (646036) (906159)Net Cash Flow from Investing Activities 18764022 19824200Financing ActivitiesDividend Paid (526478) (3310959)Increase/Decrease in Cash and Bank Balances during the year 10443505 4629101Cash and Bank Balances as per Schedule 11 at the end of the period 43651882 33208377Cash and Bank Balances as per Schedule 11 at the beginning of the period 33208377 28579276
A. R. Sekar I. S. Phukela M. RamadossDirector and Company Secretary Director Chairman-Cum-Managing Director
As per our report of even date
For CHATURVEDI & SHAH For KARNAVAT & CO. For FORD, RHODES, PARKS & CO.Chartered Accountants Chartered Accountants Charterted Accountants
Vitesh D. Gandhi Sameer B. Doshi Shrikant B. PrabhuPartner Partner Partner
Membership No. 110248 Membership No. 117987 Membership No. 35296
MumbaiJune 29, 2010
RE
CE
IPT
S &
PR
EC
EIP
TS
& P
RE
CE
IPT
S &
PR
EC
EIP
TS
& P
RE
CE
IPT
S &
PAA AAA
YM
EN
TS
AY
ME
NT
S A
YM
EN
TS
AY
ME
NT
S A
YM
EN
TS
AC
CO
UN
TC
CO
UN
TC
CO
UN
TC
CO
UN
TC
CO
UN
T

72
Estbd. 1919
fn U;w bafM;k ,';ksjUl da- fy-THE NEW INDIA ASSURANCE CO. LTD.
SE
GM
EN
T R
EP
OR
SE
GM
EN
T R
EP
OR
SE
GM
EN
T R
EP
OR
SE
GM
EN
T R
EP
OR
SE
GM
EN
T R
EP
OR
TIN
G S
CH
ED
UL
ES
TIN
G S
CH
ED
UL
ES
TIN
G S
CH
ED
UL
ES
TIN
G S
CH
ED
UL
ES
TIN
G S
CH
ED
UL
ES
SE
GM
EN
T R
EP
OR
TIN
G S
CH
ED
UL
E F
OR
TH
E Y
EA
R E
ND
ED
31S
T M
AR
CH
, 20
10 -
IN
DIA
NR
s. (
000)
Fire
Mar
ine
Carg
oM
arin
e Hu
llTo
tal M
arin
eTo
tal M
isc.
Segm
ent
C.Y.
P.Y.
C.Y.
P.Y.
C.Y.
P.Y.
C.Y.
P.Y.
C.Y.
P.Y.
Prem
ium
Dire
ct92
3782
577
3326
819
6013
117
5172
827
8289
127
0924
647
4302
244
6097
446
4442
9042
8940
87Pr
emiu
m A
ccep
ted
6866
3459
3297
2510
8954
010
7330
654
035
7439
563
5844
757
9700
0Pr
emiu
m C
eded
-411
8279
-312
8488
-533
023
-484
398
-253
6450
-236
8175
-306
9473
-285
2573
-134
6579
7-1
2966
578
Net P
rem
ium
5806
180
5198
077
1427
133
1268
419
3004
5141
4377
1727
584
1682
796
3933
8235
3572
4509
Une
xpire
d R
isk
Res
erve
Ope
ning
2599
039
2475
709
1268
419
1442
078
4143
7734
5662
1682
796
1787
740
1741
2750
1621
8686
Une
xpire
d R
isk
Res
erve
Clo
sing
-290
3090
-259
9039
-142
7132
-126
8419
-300
452
-414
377
-172
7584
-168
2796
-196
6920
3-1
7412
750
Net E
arne
d Pr
emiu
m55
0212
950
7474
712
6842
014
4207
841
4376
3456
6216
8279
617
8774
037
0817
8234
5304
45Pr
ofit
on R
ealis
atio
n of
Inve
stm
ent
7836
6736
1115
1741
6291
114
1276
3637
427
3017
9812
8541
4113
576
2042
023
Oth
er In
com
e/Ex
pens
e (A
ppor
tione
d)0
00
00
00
00
0In
tere
st D
ivid
end
and
Ren
t94
3698
8695
0220
9728
2193
8715
3701
9011
836
3429
3095
0552
8924
453
0760
6In
vest
men
t Pro
visi
ons
-898
7974
-200
2012
-146
826
-346
2838
-495
044
748
Tota
l Inv
estm
ent I
ncom
e17
2646
712
3859
138
3690
3125
1328
1191
1283
7166
4881
4408
8493
9787
173
9437
7C
laim
s Pa
id D
irect
4528
370
4314
281
1396
020
1350
856
1773
335
4478
2131
6935
517
9867
738
5783
7836
9185
72C
laim
s Pa
id A
ccep
ted
5757
8123
0364
1552
3427
1416
8080
518
1432
3283
945
2035
671
7950
23C
laim
s Pa
id C
eded
-167
7319
-131
5633
-357
585
-230
356
-104
0508
-146
832
-139
8093
-377
188
-862
3615
-815
9909
Net C
laim
Pai
d34
2683
232
2901
210
3998
711
2392
787
4507
3815
0719
1449
415
0543
431
9904
3429
5536
86C
l O/S
Cla
ims
Dire
ct15
8325
7112
7595
8121
0810
119
9350
549
2539
047
6462
070
3349
167
5812
558
0630
4956
9703
71C
l O/S
Cla
ims
Acce
pted
1001
876
1189
025
00
2494
3114
3989
2494
3114
3989
1335
9179
8316
543
Cl O
/S C
laim
s C
eded
-713
7299
-934
5428
-764
945
-790
660
-392
4822
-334
1223
-468
9767
-413
1883
-193
9453
1-1
5593
328
Net C
l. O
/S C
laim
9697
148
4603
178
1343
156
1202
845
1249
999
1567
386
2593
155
2770
231
5202
7697
4969
3586
Op
O/S
Cla
ims
Dire
ct-1
2759
581
-996
6235
-199
3505
-186
9728
-476
4620
-246
3662
-675
8125
-433
3390
-569
7037
1-5
7287
413
Op
O/S
Cla
ims
Acce
pted
-118
9025
-102
4990
00
-143
989
-476
10-1
4398
9-4
7610
-831
6543
-280
0612
Op
O/S
Cla
ims
Ced
ed93
4542
875
2891
379
0660
8012
1433
4122
319
1155
841
3188
327
1277
215
5933
2814
5194
76Ne
t Op.
O/S
Cla
im-4
6031
78-3
4623
12-1
2028
45-1
0685
14-1
5673
86-5
9971
4-2
7702
31-1
6682
28-4
9693
586
-455
6854
9In
curre
d C
laim
s D
irect
7601
360
7107
628
1510
617
1474
633
1934
104
2748
779
3444
721
4223
412
3967
1056
3660
1533
Incu
rred
Cla
ims
Acce
pted
3886
3239
4398
1552
3427
2471
2217
6897
2486
7418
0324
7078
307
6310
953
Incu
rred
Cla
ims
Ced
ed53
0811
-313
2148
-331
870
-219
802
-162
4106
-157
6497
-195
5976
-179
6299
-124
2482
0-9
2337
62Ne
t Inc
urre
d Cl
aim
s85
2080
343
6987
811
8029
912
5825
855
7120
1349
179
1737
419
2607
437
3432
4543
3367
8724
Com
mis
sion
Dire
ct62
2895
5093
0925
7332
2367
8033
774
3235
329
1106
2691
3338
5553
937
2316
2C
omm
issi
on A
ccep
ted
3536
445
173
372
9890
1336
798
9313
439
7532
4469
2796
Com
miss
ion
Ced
ed-7
8801
8-5
6935
0-8
4705
-759
49-1
5036
5-2
2286
4-2
3507
0-2
9881
3-2
2178
34-1
9941
54Ne
t Inc
urre
d Co
mm
issi
on-1
2975
9-1
4868
1726
3016
0903
-106
701
-177
144
6592
9-1
6241
2390
950
2421
804
Fore
ign
Taxe
s0
00
00
00
022
250
Ope
ratin
g Ex
pens
es R
elat
ed to
Insu
ranc
e33
6918
627
4121
835
4841
3207
7345
6200
4061
5881
1041
7269
3112
3107
7010
5145
25Re
venu
e Ac
coun
ts R
esul
t-4
5316
34-7
8289
0-5
5660
1465
7-2
1105
2-1
1041
60-2
6671
2-1
0895
03-2
5488
35-4
6902
31

okf"kZd fjiksVZANNUAL REPORT 2009-10
73
SE
GM
EN
T R
EP
OR
TIN
G S
CH
ED
UL
E F
OR
TH
E Y
EA
R E
ND
ED
31S
T M
AR
CH
, 20
10 -
IN
DIA
NR
s. (
000)
Mot
or O
DM
otor
TP
Mot
or T
P Po
olSe
gmen
tC.
Y.P.
Y.C.
Y.P.
Y.C.
Y.P.
Y.Pr
emiu
m D
irect
1172
0609
1088
4328
3584
175
3592
343
5404
609
5526
260
Prem
ium
Acc
epte
d0
00
050
7444
449
6085
6Pr
emiu
m C
eded
-234
4122
-217
6951
-357
760
-359
234
-540
4609
-552
6260
Net P
rem
ium
9376
487
8707
377
3226
415
3233
109
5074
444
4960
856
Une
xpire
d R
isk
Res
erve
Ope
ning
4353
688
4662
229
1616
554
1464
774
2480
428
1940
693
Une
xpire
d R
isk
Res
erve
Clo
sing
-468
8244
-435
3688
-161
3208
-161
6554
-253
7222
-248
0428
Net E
arne
d Pr
emiu
m90
4193
190
1591
832
2976
130
8132
950
1765
044
2112
1Pr
ofit
on R
ealis
atio
n of
Inve
stm
ent
5866
3929
7023
1816
147
1054
633
5414
8712
5265
Oth
er In
com
e/Ex
pens
e (A
ppor
tione
d)0
00
00
0In
tere
st D
ivid
end
and
Ren
t70
6435
7151
7924
3143
228
2307
772
4935
3353
13In
vest
men
t Pro
visi
ons
-672
6559
-225
323
039
-672
2737
Tota
l Inv
estm
ent I
ncom
e12
9240
210
1876
142
4532
639
0074
912
6575
146
3315
Cla
ims
Paid
Dire
ct75
8219
372
3041
599
0002
911
5105
8019
8454
077
1160
Cla
ims
Paid
Acc
epte
d0
00
014
7815
529
0435
Cla
ims
Paid
Ced
ed-1
6574
89-1
4525
37-1
8599
37-2
5358
25-1
9845
40-7
7116
0Ne
t Cla
im P
aid
5924
704
5777
878
8040
092
8974
755
1478
155
2904
35C
l O/S
Cla
ims
Dire
ct28
3329
126
7182
935
4860
5740
0476
0277
3185
141
7292
9C
l O/S
Cla
ims
Acce
pted
00
00
1243
5914
7555
162
Cl O
/S C
laim
s C
eded
-514
530
-469
591
-752
6948
-800
4810
-773
1851
-417
2929
Net C
l. O
/S C
laim
2318
761
2202
238
2795
9109
3204
2792
1243
5914
7555
162
Op
O/S
Cla
ims
Dire
ct-2
6718
29-2
5689
97-4
0047
602
-442
5396
1-4
1729
29-5
3791
9O
p O
/S C
laim
s Ac
cept
ed0
00
0-7
5551
62-2
3676
45O
p O
/S C
laim
s C
eded
4695
9150
7449
8004
810
9445
886
4172
929
5379
19Ne
t Op.
O/S
Cla
im-2
2022
38-2
0615
48-3
2042
792
-348
0807
5-7
5551
62-2
3676
45In
curre
d C
laim
s D
irect
7743
655
7333
248
5338
483
7304
221
5543
462
4406
170
Incu
rred
Cla
ims
Acce
pted
00
00
6358
907
5477
952
Incu
rred
Cla
ims
Ced
ed-1
7024
27-1
4146
79-1
3820
76-1
0947
49-5
5434
62-4
4061
70Ne
t Inc
urre
d Cl
aim
s60
4122
859
1856
939
5640
762
0947
263
5890
754
7795
2C
omm
issi
on D
irect
1204
418
1197
225
-132
80
-216
20
Com
mis
sion
Acc
epte
d0
00
050
7444
4960
86C
omm
issio
n C
eded
-527
427
-489
795
-718
15-7
1847
-539
803
-552
626
Net I
ncur
red
Com
mis
sion
6769
9170
7430
-731
43-7
1847
-345
20-5
6540
Fore
ign
Taxe
s14
040
00
00
Ope
ratin
g Ex
pens
es R
elat
ed to
Insu
ranc
e32
9262
427
7197
575
8008
6987
2922
1618
820
3979
7Re
venu
e Ac
coun
ts R
esul
t32
2086
6367
0528
3381
514
5724
-225
7174
-257
6773
SE
GM
EN
T R
EP
OR
SE
GM
EN
T R
EP
OR
SE
GM
EN
T R
EP
OR
SE
GM
EN
T R
EP
OR
SE
GM
EN
T R
EP
OR
TIN
G S
CH
ED
UL
ES
TIN
G S
CH
ED
UL
ES
TIN
G S
CH
ED
UL
ES
TIN
G S
CH
ED
UL
ES
TIN
G S
CH
ED
UL
ES

74
Estbd. 1919
fn U;w bafM;k ,';ksjUl da- fy-THE NEW INDIA ASSURANCE CO. LTD.
SE
GM
EN
T R
EP
OR
TIN
G S
CH
ED
UL
E F
OR
TH
E Y
EA
R E
ND
ED
31S
T M
AR
CH
, 20
10 -
IN
DIA
NR
s. (
000)
Tota
l Mot
orHe
alth
*Lia
blity
Pers
onal
Acc
iden
tSe
gmen
tC.
Y.P.
Y.C.
Y.P.
Y.C.
Y.P.
Y.C.
Y.P.
Y.Pr
emiu
m D
irect
2070
9393
2000
2931
1552
4733
1355
6734
1268
768
1046
817
1031
994
9711
93Pr
emiu
m A
ccep
ted
5074
444
4960
856
00
2153
427
638
1172
924
593
Prem
ium
Ced
ed-8
1064
91-8
0624
45-1
5534
15-1
3556
73-5
1357
1-2
0255
2-2
1954
6-2
0606
9Ne
t Pre
miu
m17
6773
4616
9013
4213
9713
1812
2010
6177
6731
8719
0382
4177
7897
17U
nexp
ired
Ris
k R
eser
ve O
peni
ng84
5067
080
6769
656
5103
051
4001
743
5951
3366
8139
4859
3926
00U
nexp
ired
Ris
k R
eser
ve C
losi
ng-8
8386
74-8
4506
70-6
9856
59-5
6510
30-3
8836
5-4
3595
1-4
1208
8-3
9485
9Ne
t Ear
ned
Prem
ium
1728
9342
1651
8368
1263
6689
1169
0048
8243
1777
2633
8069
4878
7458
Prof
it on
Rea
lisat
ion
of In
vest
men
t29
4427
314
7692
142
5213
1989
4517
5444
1019
7862
303
2575
3O
ther
Inco
me/
Expe
nse
(App
ortio
ned)
00
00
00
00
Inte
rest
Div
iden
d an
d R
ent
3862
802
3873
569
5120
4553
2543
2112
7124
5547
7502
662
008
Inve
stm
ent P
rovi
sion
s-3
597
3233
5-4
8743
46-2
0122
51-7
156
8To
tal I
nves
tmen
t Inc
ome
6803
479
5382
825
9367
7173
5834
3865
1434
9776
1372
5888
329
Cla
ims
Paid
Dire
ct19
4667
6219
5121
5515
5654
2812
8050
2219
8198
1818
1976
8159
6848
42C
laim
s Pa
id A
ccep
ted
1478
155
2904
350
098
319
3919
340
2246
5C
laim
s Pa
id C
eded
-550
1966
-475
9522
-170
9859
-787
127
-109
559
-369
29-3
6262
7-1
3851
0Ne
t Cla
im P
aid
1544
2951
1504
3068
1385
5569
1201
7895
8962
214
6829
4248
7256
8797
Cl O
/S C
laim
s D
irect
4605
1199
4689
2360
2844
839
2416
983
1643
692
5843
9282
6235
7644
79C
l O/S
Cla
ims
Acce
pted
1243
5914
7555
162
00
1405
026
414
5C
l O/S
Cla
ims
Ced
ed-1
5773
329
-126
4733
0-1
9896
8-1
7652
3-6
4018
2-2
7051
1-2
4503
0-1
0724
9Ne
t Cl.
O/S
Cla
im42
7137
8441
8001
9226
4587
122
4046
010
0491
531
3881
5814
6965
7375
Op
O/S
Cla
ims
Dire
ct-4
6892
360
-473
6087
7-2
4169
83-1
8912
00-5
8439
2-2
5238
1-7
6447
9-6
4200
0O
p O
/S C
laim
s Ac
cept
ed-7
5551
62-2
3676
450
00
0-1
45-3
841
Op
O/S
Cla
ims
Ced
ed12
6473
3010
4912
5417
6523
1887
3027
0511
5061
910
7249
2483
99Ne
t Op.
O/S
Cla
im-4
1800
192
-392
3726
8-2
2404
60-1
7024
70-3
1388
1-2
0176
2-6
5737
5-3
9744
2In
curre
d C
laim
s D
irect
1862
5600
1904
3639
1599
3285
1333
0806
1257
498
5138
3082
9916
8073
21In
curre
d C
laim
s Ac
cept
ed63
5890
754
7795
20
023
8719
3919
458
1876
9In
curre
d C
laim
s C
eded
-862
7965
-691
5598
-173
2304
-774
921
-479
231
-256
821
-500
409
2640
Net I
ncur
red
Clai
ms
1635
6542
1760
5993
1426
0981
1255
5885
7806
5425
8948
3489
6582
8730
Com
mis
sion
Dire
ct12
0092
811
9722
515
9164
715
6831
415
2119
1226
2712
5114
1135
27C
omm
issi
on A
ccep
ted
5074
4449
6086
00
2153
2488
1313
1103
4C
omm
issi
on C
eded
-113
9045
-111
4268
-276
079
-271
135
-843
08-4
7212
-358
50-3
9511
Net I
ncur
red
Com
mis
sion
5693
2857
9043
1315
568
1297
179
6996
477
903
9057
785
050
Fore
ign
Taxe
s14
040
320
187
044
0O
pera
ting
Expe
nses
Rel
ated
to In
sura
nce
6266
820
5510
501
3104
835
2636
853
3926
3335
8511
2411
5620
8454
Reve
nue
Acco
unts
Res
ult
8987
27-1
7943
44-5
1079
56-4
0640
35-3
2607
4270
4726
3464
-246
447
SE
GM
EN
T R
EP
OR
SE
GM
EN
T R
EP
OR
SE
GM
EN
T R
EP
OR
SE
GM
EN
T R
EP
OR
SE
GM
EN
T R
EP
OR
TIN
G S
CH
ED
UL
ES
TIN
G S
CH
ED
UL
ES
TIN
G S
CH
ED
UL
ES
TIN
G S
CH
ED
UL
ES
TIN
G S
CH
ED
UL
ES

okf"kZd fjiksVZANNUAL REPORT 2009-10
75
SE
GM
EN
T R
EP
OR
SE
GM
EN
T R
EP
OR
SE
GM
EN
T R
EP
OR
SE
GM
EN
T R
EP
OR
SE
GM
EN
T R
EP
OR
TIN
G S
CH
ED
UL
ES
TIN
G S
CH
ED
UL
ES
TIN
G S
CH
ED
UL
ES
TIN
G S
CH
ED
UL
ES
TIN
G S
CH
ED
UL
ES
SE
GM
EN
T R
EP
OR
TIN
G S
CH
ED
UL
E F
OR
TH
E Y
EA
R E
ND
ED
31S
T M
AR
CH
, 20
10 -
IN
DIA
NR
s. (
000)
Avia
tion
Engi
neer
ing
Cred
it Sh
ield
Tota
l Oth
er M
isc.
Gra
nd T
otal
Segm
ent
C.Y.
P.Y.
C.Y.
P.Y.
C.Y.
P.Y.
C.Y.
P.Y.
C.Y.
P.Y.
Prem
ium
Dire
ct64
3957
7820
0629
1827
324
7736
527
8304
3295
4340
6886
837
2749
860
4251
3655
0883
29Pr
emiu
m A
ccep
ted
4687
911
750
5842
4639
6259
3072
3820
5292
3123
7717
0612
7099
118
6464
692
Prem
ium
Ced
ed-4
7062
5-7
4041
1-1
6156
55-1
3026
77-1
9415
5-2
3105
4-7
9233
9-8
6569
7-2
0653
548
-189
4763
9Ne
t Pre
miu
m22
0211
5334
518
8686
415
7094
739
1387
3037
8135
9020
130
3241
346
8707
0642
6053
82U
nexp
ired
Ris
k R
eser
ve O
peni
ng26
672
5977
7854
7363
3873
1518
9030
7229
1516
205
1334
613
2169
4585
2048
2135
Une
xpire
d R
isk
Res
erve
Clo
sing
-110
105
-266
72-9
4343
2-7
8547
3-1
9569
4-1
5189
0-1
7951
86-1
5162
05-2
4299
877
-216
9458
5Ne
t Ear
ned
Prem
ium
1367
7832
650
1728
905
1419
347
3475
8345
9120
3311
220
2850
821
4426
6707
4139
2932
Prof
it on
Rea
lisat
ion
of In
vest
men
t58
815
2838
613
1531
5734
425
032
1628
829
0965
1364
0851
9904
125
3167
9O
ther
Inco
me/
Expe
nse
(App
ortio
ned)
00
00
00
00
00
Inte
rest
Div
iden
d an
d R
ent
7082
568
349
1583
9113
8073
3351
243
600
3653
7234
3917
6596
371
6486
613
Inve
stm
ent P
rovi
sion
s-6
762
7-1
5112
67-3
135
6-3
4529
98-6
194
5556
0To
tal I
nves
tmen
t Inc
ome
1295
7397
362
2897
7119
6684
5851
360
244
6559
9248
3323
1178
9219
9073
852
Cla
ims
Paid
Dire
ct21
7555
2676
9693
3541
1769
573
5373
283
205
1375
003
1614
260
4627
6103
4303
1530
Cla
ims
Paid
Acc
epte
d27
659
5156
4754
411
9605
2724
1224
1895
1895
7811
3528
2754
684
1109
332
Cla
ims
Paid
Ced
ed-1
3602
3-1
5934
7-2
7958
2-8
9812
3-3
9554
-638
54-4
8444
5-1
3164
97-1
1699
027
-985
2730
Net C
laim
Pai
d10
9191
1135
0570
1503
9910
5528
6590
2612
4610
8013
641
1291
3733
1760
3428
8132
Cl O
/S C
laim
s D
irect
7196
2685
8929
2176
467
1859
292
5355
7440
2358
3265
417
3191
578
8092
9111
7648
8077
Cl O
/S C
laim
s Ac
cept
ed61
1010
369
2791
4612
9949
4130
4718
0105
2232
9344
0813
1461
0486
9649
557
Cl O
/S C
laim
s C
eded
-396
010
-512
163
-949
476
-943
969
-355
076
-270
433
-836
460
-665
150
-312
2159
7-2
9070
639
Net C
l. O
/S C
laim
3297
2635
7135
1506
137
1045
272
5935
4531
2030
2652
250
2967
241
6431
8000
5706
6995
Op
O/S
Cla
ims
Dire
ct-8
5892
9-1
1101
19-1
8592
92-2
6899
54-4
0235
8-5
3369
-319
1578
-328
7513
-764
8807
7-7
1587
038
Op
O/S
Cla
ims
Acce
pted
-103
69-9
300
-129
949
-152
655
-180
105
-226
462
-440
813
-407
09-9
6495
57-3
8732
12O
p O
/S C
laim
s C
eded
5121
6361
4431
9439
6919
0296
927
0433
2685
866
5150
9962
1629
0706
3924
7611
61Ne
t Op.
O/S
Cla
im-3
5713
5-5
0498
8-1
0452
72-9
3964
0-3
1203
0-2
5297
3-2
9672
41-2
3320
06-5
7066
995
-506
9908
9In
curre
d C
laim
s D
irect
7825
316
506
1250
716
9389
1218
6948
4321
9414
4884
015
1832
550
7171
3747
9325
73In
curre
d C
laim
s Ac
cept
ed23
399
6225
1967
4196
898
5053
5519
5538
-279
4051
3632
7715
613
6885
675
Incu
rred
Cla
ims
Ced
ed-1
9870
-570
79-2
8508
960
877
-124
197
-307
429
-655
755
-985
431
-138
4998
5-1
4162
209
Net I
ncur
red
Clai
ms
8178
2-3
4348
1162
368
1096
687
5681
0632
0303
7651
4510
4652
644
5827
6540
6560
39C
omm
issi
on D
irect
1044
675
6420
0708
1593
5818
763
3239
555
5814
5221
5247
6954
045
0160
4C
omm
issi
on A
ccep
ted
4976
796
1024
1283
006
6662
645
569
6832
053
817
7985
0175
1408
Com
mis
sion
Ced
ed-1
9379
-346
03-4
7897
1-2
7672
0-4
7509
-321
20-1
3669
3-1
7858
5-3
2409
22-2
8623
17Ne
t Inc
urre
d Co
mm
issi
on-3
957
-262
43-1
7585
1-3
4356
3788
045
844
4874
4139
7384
2327
120
2390
695
Fore
ign
Taxe
s19
30
145
00
022
00
2225
0O
pera
ting
Expe
nses
Rel
ated
to In
sura
nce
2649
1618
1727
8053
1162
6434
1238
3510
4028
1111
264
8880
1716
4909
9713
9826
74Re
venu
e Ac
coun
ts R
esul
t-7
6583
8876
2267
03-7
2734
-323
725
4918
916
0314
210
0221
7-7
3471
81-6
5626
24*
Sub
Segm
ent
Prem
ium
Cla
ims
Paid
Cla
ims
O/s
at e
ndC
laim
s O
/s a
t beg
inni
ngIn
curr
ed C
laim
sC
.Y.
P.Y.
C.Y
.P.
Y.C
.Y.
P.Y.
C.Y
.P.
Y.C
.Y.
P.Y.
Wor
kmen
s’ C
ompe
nsat
ion
(Sub
Seg
men
t of l
iabl
ity In
sura
nce)
7785
411
5492
816
9769
1245
6726
6986
1429
1214
2912
1887
7229
3842
7870
7Ex
port
cred
it In
sura
nce
(Sub
Seg
men
t of c
redi
t shi
eld
Insu
ranc
e )
4208
944
343
1818
741
920
020
828
2082
80
-264
162
748
Not
e : P
revi
ous
year
figu
res
whe
reve
r req
uire
d ar
e re
grou
ped

76
Estbd. 1919
fn U;w bafM;k ,';ksjUl da- fy-THE NEW INDIA ASSURANCE CO. LTD.
SE
GM
EN
T R
EP
OR
TIN
G S
CH
ED
UL
E F
OR
TH
E Y
EA
R E
ND
ED
31S
T M
AR
CH
, 20
10 -
FO
RE
IGN
Rs.
(00
0)
Fire
Mar
ine
Carg
oM
arin
e Hu
llTo
tal M
arin
eTo
tal M
isc.
Segm
ent
C.Y.
P.Y.
C.Y.
P.Y.
C.Y.
P.Y.
C.Y.
P.Y.
C.Y.
P.Y.
Prem
ium
Dire
ct28
8137
922
5049
338
5615
5613
0011
8067
9357
750
3682
6548
7771
8121
265
6419
4
Prem
ium
Acc
epte
d42
0087
545
0716
442
412
3939
511
5394
1038
4915
7806
1432
4410
0240
846
6252
Prem
ium
Ced
ed-1
9182
63-1
5742
67-1
2192
-432
46-8
6965
-611
00-9
9157
-104
346
-755
347
-509
934
Net P
rem
ium
5163
991
5183
390
4158
3555
7449
1464
9613
6326
5623
3169
3775
7428
273
6520
512
Une
xpire
d R
isk
Res
erve
Ope
ning
2591
695
1962
803
5574
4946
3645
1363
2566
311
6937
7452
9956
3260
257
2755
332
Une
xpire
d R
isk
Res
erve
Clo
sing
-258
1995
-259
1695
-415
835
-557
449
-146
495
-136
325
-562
330
-693
774
-371
4138
-326
0256
Net E
arne
d Pr
emiu
m51
7369
145
5449
855
7449
4636
4513
6326
6631
269
3775
5299
5769
7439
260
1558
8Pr
ofit
on R
ealis
atio
n of
Inve
stm
ent
1079
534
240
135
176
5541
619
022
3187
2
Oth
er In
com
e/Ex
pens
e (A
ppor
tione
d)0
00
00
00
00
0
Inte
rest
Div
iden
d an
d R
ent
1069
0998
573
2375
924
871
1741
210
216
4117
135
087
2209
3616
0883
Inve
stm
ent P
rovi
sion
s-7
6-7
3-1
6-1
8-1
3-8
-29
-26
-156
-121
Tota
l Inv
estm
ent I
ncom
e10
7912
9903
423
983
2498
817
575
1026
341
558
3525
122
3011
1616
34C
laim
s Pa
id D
irect
1463
287
9961
0072
778
1583
9246
2044
8062
153
4822
2390
1342
9880
739
7358
1
Cla
ims
Paid
Acc
epte
d27
4695
218
8144
219
656
1659
222
194
2888
941
850
4548
149
0023
3626
76
Cla
ims
Paid
Ced
ed-1
8561
56-1
3930
00-3
60-4
7014
-389
366
-864
15-3
8972
6-1
3342
9-4
1436
5-3
2706
3
Net C
laim
Pai
d23
5408
314
8454
292
074
1279
7094
872
2309
518
6946
1510
6543
7446
540
0919
4C
l O/S
Cla
ims
Dire
ct26
5016
728
1929
623
3973
2404
1116
8648
2217
0440
2621
4621
1556
4277
654
0085
3
Cl O
/S C
laim
s Ac
cept
ed44
3394
041
3740
155
633
6231
573
904
2925
612
9537
9157
160
9969
8929
37
Cl O
/S C
laim
s C
eded
-252
1111
-220
6613
-945
92-9
9177
-152
-257
-947
44-9
9434
-309
378
-380
589
Net C
l. O
/S C
laim
4562
996
4750
084
1950
1420
3549
2424
0025
0703
4374
1445
4252
5943
367
5913
201
Op
O/S
Cla
ims
Dire
ct-2
8192
96-2
5103
63-2
4041
1-1
9642
1-2
2170
4-1
7342
5-4
6211
5-3
6984
6-5
4008
53-5
5223
80
Op
O/S
Cla
ims
Acce
pted
-413
7401
-334
7439
-623
15-5
5643
-292
56-1
0421
2-9
1571
-159
855
-892
937
-606
771
Op
O/S
Cla
ims
Ced
ed22
0661
313
2013
599
177
8790
725
715
299
434
8805
938
0588
4087
80
Net O
p. O
/S C
laim
-475
0084
-453
7667
-203
549
-164
157
-250
703
-277
485
-454
252
-441
642
-591
3202
-572
0371
Incu
rred
Cla
ims
Dire
ct12
9415
913
0503
366
340
2023
8240
8988
1288
9947
5328
3312
8145
4072
638
5205
6
Incu
rred
Cla
ims
Acce
pted
3043
491
2671
404
1297
323
264
6684
2-4
6067
7981
5-2
2803
2070
5764
8842
Incu
rred
Cla
ims
Ced
ed-2
1706
55-2
2794
7742
26-5
8284
-389
262
-865
20-3
8503
6-1
4480
4-3
4315
5-2
9887
4
Net I
ncur
red
Clai
ms
2166
995
1696
960
8353
916
7362
8656
8-3
688
1701
0716
3674
4404
628
4202
024
Com
mis
sion
Dire
ct69
8368
6205
2199
872
1543
8621
843
1752
212
1715
1719
0816
1690
916
3695
6
Com
mis
sion
Acc
epte
d86
2039
8938
4811
990
1083
511
072
1655
2306
212
490
1793
6988
285
Com
mis
sion
Ced
ed-1
4792
9-1
2898
1-3
197
-111
83-1
6800
-115
10-1
9997
-226
93-4
7335
-547
63
Net I
ncur
red
Com
mis
sion
1412
478
1385
388
1086
6515
4038
1611
576
6712
4780
1617
0517
4894
316
7047
8Fo
reig
n Ta
xes
194
186
7710
527
2610
413
147
3514
127
Ope
ratin
g Ex
pens
es R
elat
ed to
Insu
ranc
e22
7520
1927
3923
962
2255
430
807
2855
854
769
5111
258
7353
3235
93
Rev
enue
Acc
ount
s R
esul
t14
7441
613
7825
936
5189
1445
7420
384
4401
238
5573
1885
8645
1744
-330
00
SE
GM
EN
T R
EP
OR
SE
GM
EN
T R
EP
OR
SE
GM
EN
T R
EP
OR
SE
GM
EN
T R
EP
OR
SE
GM
EN
T R
EP
OR
TIN
G S
CH
ED
UL
ES
TIN
G S
CH
ED
UL
ES
TIN
G S
CH
ED
UL
ES
TIN
G S
CH
ED
UL
ES
TIN
G S
CH
ED
UL
ES

okf"kZd fjiksVZANNUAL REPORT 2009-10
77
SE
GM
EN
T R
EP
OR
TIN
G S
CH
ED
UL
E F
OR
TH
E Y
EA
R E
ND
ED
31S
T M
AR
CH
, 20
10 -
FO
RE
IGN
Rs.
(00
0)
Mot
orHe
alth
Liab
lity
(W.C
)Pe
rson
al A
ccid
ent
Avia
tion
Segm
ent
C.Y.
P.Y.
C.Y.
P.Y.
C.Y.
P.Y.
C.Y.
P.Y.
C.Y.
P.Y.
Prem
ium
Dire
ct47
8670
942
5059
414
7610
069
0627
8977
0516
4698
1423
44-2
0
Prem
ium
Acc
epte
d11
2933
1185
470
097
463
588
6889
4064
6386
2062
40
Prem
ium
Ced
ed-2
1204
6-1
7522
4-4
1004
0-6
7594
-100
140
-252
09-1
6665
-198
8-1
707
Net P
rem
ium
4687
596
4193
917
1066
060
6240
0779
8200
1483
5713
4619
6443
9620
4533
Une
xpire
d R
isk
Res
erve
Ope
ning
2096
959
1608
634
00
3991
0055
4386
6730
965
687
1022
6729
381
Une
xpire
d R
isk
Res
erve
Clo
sing
-234
3797
-209
6959
-533
030
-312
005
-399
100
-741
79-6
7309
-322
198
-102
266
Net E
arne
d Pr
emiu
m44
4075
837
0559
253
303
071
1102
9534
8614
1487
1329
9742
4465
1316
48Pr
ofit
on R
ealis
atio
n of
Inve
stm
ent
808
439
586
024
215
186
3881
42
Oth
er In
com
e/Ex
pens
e (A
ppor
tione
d)0
00
00
00
00
0
Inte
rest
Div
iden
d an
d R
ent
8003
081
078
5800
80
2393
427
836
8499
7030
8024
7749
Inve
stm
ent P
rovi
sion
s-5
7-6
1-4
10
-17
-21
-6-5
-6-6
Tota
l Inv
estm
ent I
ncom
e80
781
8145
658
553
024
159
2796
685
7970
6380
9977
85C
laim
s Pa
id D
irect
2948
058
2561
862
1332
900
7059
8386
6346
6448
538
240
-213
111
1
Cla
ims
Paid
Acc
epte
d14
2477
1361
500
011
3546
3860
8027
2708
1817
1103
Cla
ims
Paid
Ced
ed-2
2478
7-1
3361
2-4
7586
0-1
3642
-200
24-5
102
-441
30
-430
1
Net C
laim
Pai
d28
6574
825
6440
085
704
069
3476
8463
6863
243
4185
426
8687
1669
13C
l O/S
Cla
ims
Dire
ct24
4057
620
6972
012
90
2153
163
2274
589
3346
427
311
1290
0012
1000
Cl O
/S C
laim
s Ac
cept
ed68
474
2817
810
061
024
535
1033
530
9048
4844
66
Cl O
/S C
laim
s C
eded
-559
83-1
1700
90
0-1
8117
2-1
6747
4-3
88-9
140
0
Net C
l. O
/S C
laim
2453
067
2234
492
129
019
7205
221
0711
557
611
3673
243
8048
6054
66O
p O
/S C
laim
s D
irect
-206
9720
-190
1428
00
-227
4589
-266
2876
-273
11-2
4597
-121
000
-875
00
Op
O/S
Cla
ims
Acce
pted
-281
781
-936
360
00
0-1
0335
-772
7-4
8446
6-3
4991
0
Op
O/S
Cla
ims
Ced
ed11
7009
9662
00
016
7473
2430
9391
410
000
0
Net O
p. O
/S C
laim
-223
4492
-189
8444
00
-210
7116
-241
9783
-367
32-3
1324
-605
466
-437
410
Incu
rred
Cla
ims
Dire
ct33
1891
427
3015
413
3417
058
4555
4780
5970
638
4095
458
7033
612
Incu
rred
Cla
ims
Acce
pted
-708
3032
4295
00
1197
4618
061
1063
595
401
3056
59
Incu
rred
Cla
ims
Ced
ed-1
6376
1-1
5400
2-4
7586
0-2
7340
5559
5-4
576
-432
70
-430
2
Net I
ncur
red
Clai
ms
3084
323
2900
447
8583
10
5584
1253
3700
8412
347
262
1012
7133
4969
Com
mis
sion
Dire
ct11
3638
510
9252
428
087
016
3077
2174
9239
737
3357
30
0
Com
mis
sion
Acc
epte
d46
7547
540
022
114
327
3630
0611
8385
3485
4
Com
mis
sion
Ced
ed-2
90-1
527
-42
0-1
338
-170
9-4
796
-690
0-8
6-8
1
Net I
ncur
red
Com
mis
sion
1140
770
1095
751
2804
50
1619
6021
5926
3767
729
679
1182
9934
773
Fore
ign
Taxe
s29
8790
8668
039
817
2995
292
411
443
Ope
ratin
g Ex
pens
es R
elat
ed to
Insu
ranc
e22
2350
1949
0120
9669
026
515
2520
716
285
1465
717
889
1277
7
Reve
nue
Acco
unts
Res
ult
7110
9-4
1313
7-2
1175
70
-120
2420
4890
1188
648
170
1946
94-2
4352
9
SE
GM
EN
T R
EP
OR
SE
GM
EN
T R
EP
OR
SE
GM
EN
T R
EP
OR
SE
GM
EN
T R
EP
OR
SE
GM
EN
T R
EP
OR
TIN
G S
CH
ED
UL
ES
TIN
G S
CH
ED
UL
ES
TIN
G S
CH
ED
UL
ES
TIN
G S
CH
ED
UL
ES
TIN
G S
CH
ED
UL
ES

78
Estbd. 1919
fn U;w bafM;k ,';ksjUl da- fy-THE NEW INDIA ASSURANCE CO. LTD.
SE
GM
EN
T R
EP
OR
TIN
G S
CH
ED
UL
E F
OR
TH
E Y
EA
R E
ND
ED
31S
T M
AR
CH
, 20
10 -
FO
RE
IGN
Rs.
(00
0)
Engi
neer
ing
Mis
c. T
BTo
tal O
ther
Mis
c.G
rand
Tot
alC
.Y.
P.Y.
C.Y
.P.
Y.C
.Y.
P.Y.
C.Y
.P.
Y.Pr
emiu
m D
irect
4061
1743
2624
9854
5384
0927
9854
5384
0927
1056
6273
9469
564
Prem
ium
Acc
epte
d15
6348
1408
5776
899
-896
778
194
-896
753
6108
951
1666
0Pr
emiu
m C
eded
-791
95-1
1853
8-3
2831
1-9
7660
-328
311
-976
60-2
7727
67-2
1885
47Ne
t Pre
miu
m48
3270
4549
4373
4041
7343
0073
5336
7343
0013
1545
9512
3976
77U
nexp
ired
Ris
k R
eser
ve O
peni
ng22
7472
1615
0836
7150
3357
3636
7150
3357
3665
4572
652
4809
1U
nexp
ired
Ris
k R
eser
ve C
losi
ng-2
4163
5-2
2747
2-3
6702
1-3
6715
0-3
6702
1-3
6715
0-6
8584
63-6
5457
25Ne
t Ear
ned
Prem
ium
4691
0738
8979
7341
7070
2886
7354
6570
2886
1284
1858
1110
0043
Prof
it on
Rea
lisat
ion
of In
vest
men
t18
185
247
117
247
117
3726
1596
Oth
er In
com
e/Ex
pens
e (A
ppor
tione
d)0
00
00
00
0In
tere
st D
ivid
end
and
Ren
t17
943
1565
324
498
2153
724
498
2153
736
9016
2945
43In
vest
men
t Pro
visi
ons
-12
-12
-17
-16
-17
-16
-261
-220
Tota
l Inv
estm
ent I
ncom
e18
112
1572
624
728
2163
824
728
2163
837
2481
2959
19C
laim
s Pa
id D
irect
1324
1182
818
3167
1142
4204
3167
1142
4204
6296
916
5208
694
Cla
ims
Paid
Acc
epte
d44
880
3544
226
853
1190
826
853
1190
7.6
3278
825
2289
599
Cla
ims
Paid
Ced
ed-2
5765
-167
44-9
7483
-147
969
-974
83-1
4796
9-2
6602
47-1
8534
92Ne
t Cla
im P
aid
1515
2610
1516
2460
8128
8143
2460
8128
8143
6915
494
5644
801
Cl O
/S C
laim
s D
irect
3755
1637
7320
5109
2853
0913
5109
2853
0913
8695
564
8682
264
Cl O
/S C
laim
s Ac
cept
ed15
3899
9624
453
952
2011
153
952
2011
151
7344
651
2190
9C
l O/S
Cla
ims
Ced
ed-7
1150
-907
08-6
85-4
484
-685
-448
4-2
9252
33-2
6866
36Ne
t Cl.
O/S
Cla
im45
8265
3828
5656
4195
5465
4056
4195
5465
4010
9437
7711
1175
37O
p O
/S C
laim
s D
irect
-377
320
-194
760
-530
913
-651
219
-530
913
-651
219
-868
2264
-840
2589
Op
O/S
Cla
ims
Acce
pted
-962
44-8
9077
-201
11-6
6421
-201
11-6
6421
-512
1909
-411
4065
Op
O/S
Cla
ims
Ced
ed90
708
4367
744
8424
390
4484
2439
026
8663
518
1697
4Ne
t Op.
O/S
Cla
im-3
8285
6-2
4016
0-5
4654
0-6
9325
0-5
4654
0-6
9325
0-1
1117
538
-106
9968
0In
curre
d C
laim
s D
irect
1306
0626
5378
2967
2630
3899
2967
2330
3899
6310
213
5488
370
Incu
rred
Cla
ims
Acce
pted
1025
3542
609
6069
3-3
4402
6069
3-3
4402
3330
363
3297
443
Incu
rred
Cla
ims
Ced
ed-6
207
-637
75-9
3685
-128
063
-936
85-1
2806
3-2
8988
46-2
7231
55Ne
t Inc
urre
d Cl
aim
s22
6934
2442
1226
3734
1414
3426
3731
1414
3467
4173
060
6265
8C
omm
issi
on D
irect
8139
344
536
1682
3024
8831
1682
3024
8831
2436
992
2429
385
Com
mis
sion
Acc
epte
d39
661
3397
013
691
1155
814
047
1155
810
6447
099
4623
Com
miss
ion
Ced
ed-1
5043
-181
00-2
5740
-264
46-2
5740
-264
46-2
1526
1-2
0643
7Ne
t Inc
urre
d Co
mm
issi
on10
6011
6040
615
6181
2339
4315
6537
2339
4332
8620
132
1757
1Fo
reig
n Ta
xes
308
986
468
1591
469
1591
5033
1444
4O
pera
ting
Expe
nses
Rel
ated
to In
sura
nce
5438
244
045
4026
332
006
4026
332
006
8696
4256
7444
Reve
nue
Acco
unts
Res
ult
9958
455
056
2982
5231
5550
2991
9431
5550
2311
733
1533
845
* Sub
Seg
men
tPr
emiu
mCl
aim
s Pa
idCl
aim
s O
/s a
t end
Clai
ms
O/s
at b
egin
ning
Incu
rred
Cla
ims
C.Y.
P.Y.
C.Y.
P.Y.
C.Y.
P.Y.
C.Y.
P.Y.
C.Y.
P.Y.
Healt
h In
sura
nce
(Sub
Seg
men
t of O
ther
Misc
. Ins
uran
ce)
1230
81N
.A.
7242
8N
.A.
348
N.A
.21
37N
.A.
7063
9N
.A.
SE
GM
EN
T R
EP
OR
SE
GM
EN
T R
EP
OR
SE
GM
EN
T R
EP
OR
SE
GM
EN
T R
EP
OR
SE
GM
EN
T R
EP
OR
TIN
G S
CH
ED
UL
ES
TIN
G S
CH
ED
UL
ES
TIN
G S
CH
ED
UL
ES
TIN
G S
CH
ED
UL
ES
TIN
G S
CH
ED
UL
ES

okf"kZd fjiksVZANNUAL REPORT 2009-10
79
SE
GM
EN
T R
EP
OR
TIN
G S
CH
ED
UL
E F
OR
TH
E Y
EA
R E
ND
ED
31S
T M
AR
CH
, 20
10 -
GL
OB
AL
Rs.
(00
0)
Fire
Mar
ine
Car
goM
arin
e H
ull
Tota
l Mar
ine
Tota
l Mis
c.
Segm
ent
C.Y
.P.
Y.C
.Y.
P.Y.
C.Y
.P.
Y.C
.Y.
P.Y.
C.Y
.P.
Y.
Prem
ium
Dire
ct12
1192
0499
8376
123
4574
623
1302
829
0095
828
0282
352
4670
451
1585
153
6255
0349
4582
81
Prem
ium
Acc
epte
d48
8750
951
0046
142
437
4048
416
9404
1771
5521
1841
2176
3973
6215
162
6325
2
Prem
ium
Ced
ed-6
0365
42-4
7027
55-5
4521
5-5
2764
4-2
6234
15-2
4292
75-3
1686
30-2
9569
19-1
4221
143
-134
7651
2
Net P
rem
ium
1097
0171
1038
1467
1842
968
1825
868
4469
4755
0703
2289
915
2376
571
4676
6511
4224
5021
Une
xpire
d R
isk
Res
erve
Ope
ning
5190
734
4438
512
1825
868
1905
723
5507
0241
1973
2376
570
2317
696
2067
3006
1897
4018
Une
xpire
d R
isk
Res
erve
Clo
sing
-548
5085
-519
0734
-184
2967
-182
5868
-446
947
-550
702
-228
9914
-237
6570
-233
8333
8-2
0673
006
Net E
arne
d Pr
emiu
m10
6758
2096
2924
518
2586
919
0572
355
0702
4119
7423
7657
123
1769
744
0561
7740
5460
33
Prof
it on
Rea
lisat
ion
of In
vest
men
t78
4746
3616
4917
4402
9124
912
7812
3748
230
2214
1287
3141
1580
720
4289
5
Oth
er In
com
e/Ex
pens
e (A
ppor
tione
d)0
00
00
00
00
0
Inte
rest
Div
iden
d an
d R
ent
1050
607
9680
7523
3487
2442
5817
1113
1003
3440
4600
3445
9255
1018
054
6848
9
Inve
stm
ent
Prov
isio
ns-9
7479
01-2
1619
94-1
5981
8-3
7528
12-5
106
4462
7
Tota
l Inv
estm
ent I
ncom
e18
3437
913
3762
540
7673
3375
0129
8766
1386
3470
6439
4761
3596
2088
275
5601
1
Cla
ims
Paid
Dire
ct59
9165
753
1038
114
6879
815
0924
822
3537
952
8442
3704
177
2037
690
4287
7183
4089
2153
Cla
ims
Paid
Acc
epte
d33
2273
321
1180
621
208
2001
916
3874
1094
0718
5082
1294
2625
2569
511
5769
9
Cla
ims
Paid
Ced
ed-3
5334
75-2
7086
33-3
5794
5-2
7737
0-1
4298
74-2
3324
7-1
7878
19-5
1061
7-9
0379
81-8
4869
72
Net
Cla
im P
aid
5780
915
4713
554
1132
061
1251
897
9693
7940
4602
2101
440
1656
499
3636
4897
3356
2880
Cl O
/S C
laim
s D
irect
1848
2738
1557
8877
2342
074
2233
916
5094
038
4986
324
7436
112
7220
240
6370
5825
6237
1224
Cl O
/S C
laim
s Ac
cept
ed54
3581
653
2642
655
633
6231
532
3335
1732
4537
8968
2355
6013
9691
4892
0948
0
Cl O
/S C
laim
s C
eded
-965
8410
-115
5204
1-8
5953
7-8
8983
7-3
9249
74-3
3414
80-4
7845
11-4
2313
17-1
9703
909
-159
7391
7
Net
Cl.
O/S
Cla
im14
2601
4493
5326
215
3817
014
0639
414
9239
918
1808
930
3056
932
2448
357
9710
6455
6067
87
Op
O/S
Cla
ims
Dire
ct-1
5578
877
-124
7659
8-2
2339
16-2
0661
49-4
9863
24-2
6370
87-7
2202
40-4
7032
36-6
2371
224
-628
0979
3
Op
O/S
Cla
ims
Acce
pted
-532
6426
-437
2429
-623
15-5
5643
-173
245
-151
822
-235
560
-207
465
-920
9480
-340
7383
Op
O/S
Cla
ims
Ced
ed11
5520
4188
4904
888
9837
8891
2133
4148
019
1171
042
3131
728
0083
115
9739
1614
9282
56
Net
Op.
O/S
Cla
im-9
3532
62-7
9999
79-1
4063
94-1
2326
71-1
8180
89-8
7719
9-3
2244
83-2
1098
70-5
5606
788
-512
8892
0
Incu
rred
Cla
ims
Dire
ct88
9551
984
1266
115
7695
716
7701
523
4309
228
7767
839
2004
945
5469
344
2117
8340
4535
89
Incu
rred
Cla
ims
Acce
pted
3432
123
3065
802
1452
526
691
3139
6413
0830
3284
8915
7521
7285
363
6959
795
Incu
rred
Cla
ims
Ced
ed-1
6398
44-5
4116
25-3
2764
4-2
7808
6-2
0133
68-1
6630
17-2
3410
12-1
9411
03-1
2767
973
-953
2636
Net
Incu
rred
Cla
ims
1068
7798
6066
838
1263
838
1425
620
6436
8813
4549
119
0752
627
7111
138
7291
7437
8807
48
Com
mis
sion
Dire
ct13
2126
311
2983
035
7204
3911
6655
617
4987
541
2821
4410
4154
7244
853
6011
8
Com
mis
sion
Acc
epte
d89
7403
9390
2111
993
1090
720
962
1502
232
955
2592
993
2969
7810
81
Com
mis
sion
Ced
ed-9
3594
7-6
9833
1-8
7902
-871
32-1
6716
5-2
3437
4-2
5506
7-3
2150
6-2
2651
69-2
0489
17
Net
Incu
rred
Com
mis
sion
1282
719
1370
520
2812
9531
4941
-905
86-1
6947
719
0709
1454
6441
4024
940
9228
2
Fore
ign
Taxe
s19
418
677
105
2726
104
131
6960
1412
7
Ope
ratin
g Ex
pens
es R
elat
ed to
Insu
ranc
e35
9670
629
3395
737
8803
3433
2748
7007
4347
1686
5810
7780
4312
8981
2310
8381
18
Rev
enue
Acc
ount
s R
esul
t-3
0572
1859
5369
3095
2915
9231
-190
668
-106
0148
1188
61-9
0091
7-2
0974
45-4
7232
31
SE
GM
EN
T R
EP
OR
SE
GM
EN
T R
EP
OR
SE
GM
EN
T R
EP
OR
SE
GM
EN
T R
EP
OR
SE
GM
EN
T R
EP
OR
TIN
G S
CH
ED
UL
ES
TIN
G S
CH
ED
UL
ES
TIN
G S
CH
ED
UL
ES
TIN
G S
CH
ED
UL
ES
TIN
G S
CH
ED
UL
ES

80
Estbd. 1919
fn U;w bafM;k ,';ksjUl da- fy-THE NEW INDIA ASSURANCE CO. LTD.
SE
GM
EN
T R
EP
OR
SE
GM
EN
T R
EP
OR
SE
GM
EN
T R
EP
OR
SE
GM
EN
T R
EP
OR
SE
GM
EN
T R
EP
OR
TIN
G S
CH
ED
UL
ES
TIN
G S
CH
ED
UL
ES
TIN
G S
CH
ED
UL
ES
TIN
G S
CH
ED
UL
ES
TIN
G S
CH
ED
UL
ES
SE
GM
EN
T R
EP
OR
TIN
G S
CH
ED
UL
E F
OR
TH
E Y
EA
R E
ND
ED
31S
T M
AR
CH
, 20
10 -
GL
OB
AL
Rs.
(00
0)
Mot
or O
DM
otor
TP
Mot
or T
P Po
olTo
tal M
otor
TP
C.Y
.P.
Y.C
.Y.
P.Y.
C.Y
.P.
Y.C
.Y.
P.Y.
Prem
ium
Dire
ct16
5073
1815
1349
2235
8417
535
9234
354
0460
955
2626
089
8878
491
1860
3Pr
emiu
m A
ccep
ted
1129
3311
8547
00
5074
444
4960
856
5074
444
4960
856
Prem
ium
Ced
ed-2
5561
68-2
3521
75-3
5776
0-3
5923
4-5
4046
09-5
5262
60-5
7623
69-5
8854
94Ne
t Pre
miu
m14
0640
8312
9012
9432
2641
532
3310
950
7444
449
6085
683
0085
981
9396
5U
nexp
ired
Ris
k R
eser
ve O
peni
ng64
5064
762
7086
316
1655
414
6477
424
8042
819
4069
340
9698
234
0546
7U
nexp
ired
Ris
k R
eser
ve C
losi
ng-7
0320
41-6
4506
47-1
6132
08-1
6165
54-2
5372
22-2
4804
28-4
1504
30-4
0969
82Ne
t Ear
ned
Prem
ium
1348
2689
1272
1510
3229
761
3081
329
5017
650
4421
121
8247
411
7502
450
Prof
it on
Rea
lisat
ion
of In
vest
men
t58
7447
2974
6218
1614
710
5463
354
1487
1252
6523
5763
411
7989
8O
ther
Inco
me/
Expe
nse
(App
ortio
ned)
00
00
00
00
Inte
rest
Div
iden
d an
d R
ent
7864
6579
6257
2431
432
2823
077
7249
3533
5313
3156
367
3158
390
Inve
stm
ent P
rovi
sion
s-7
2964
98-2
253
2303
9-6
7227
37-2
925
2577
6To
tal I
nves
tmen
t Inc
ome
1373
183
1100
217
4245
326
3900
749
1265
751
4633
1555
1107
743
6406
4C
laim
s Pa
id D
irect
1053
0251
9792
277
9900
029
1151
0580
1984
540
7711
6011
8845
6912
2817
40C
laim
s Pa
id A
ccep
ted
1424
7713
6150
00
1478
155
2904
3514
7815
529
0435
Cla
ims
Paid
Ced
ed-1
8822
76-1
5861
49-1
8599
37-2
5358
25-1
9845
40-7
7116
0-3
8444
77-3
3069
85Ne
t Cla
im P
aid
8790
452
8342
278
8040
092
8974
755
1478
155
2904
3595
1824
792
6519
0C
l O/S
Cla
ims
Dire
ct52
7386
747
4154
935
4860
5740
0476
0277
3185
141
7292
943
2179
0844
2205
31C
l O/S
Cla
ims
Acce
pted
6847
428
1781
00
1243
5914
7555
162
1243
5914
7555
162
Cl O
/S C
laim
s C
eded
-570
513
-586
600
-752
6948
-800
4810
-773
1851
-417
2929
-152
5879
9-1
2177
739
Net C
l. O
/S C
laim
4771
828
4436
730
2795
9109
3204
2792
1243
5914
7555
162
4039
5023
3959
7954
Op
O/S
Cla
ims
Dire
ct-4
7415
49-4
4704
25-4
0047
602
-442
5396
1-4
1729
29-5
3791
9-4
4220
531
-447
9188
0O
p O
/S C
laim
s Ac
cept
ed-2
8178
1-9
3636
00
-755
5162
-236
7645
-755
5162
-236
7645
Op
O/S
Cla
ims
Ced
ed58
6600
6040
6980
0481
094
4588
641
7292
953
7919
1217
7739
9983
805
Net O
p. O
/S C
laim
-443
6730
-395
9992
-320
4279
2-3
4808
075
-755
5162
-236
7645
-395
9795
4-3
7175
720
Incu
rred
Cla
ims
Dire
ct11
0625
6910
0634
0253
3848
373
0422
155
4346
244
0617
010
8819
4511
7103
91In
curre
d C
laim
s Ac
cept
ed-7
0830
3242
950
063
5890
754
7795
263
5890
754
7795
2In
curre
d C
laim
s C
eded
-186
6188
-156
8681
-138
2076
-109
4749
-554
3462
-440
6170
-692
5538
-550
0919
Net I
ncur
red
Clai
ms
9125
551
8819
016
3956
407
6209
472
6358
907
5477
952
1031
5314
1168
7424
Com
mis
sion
Dire
ct23
4080
322
8974
9-1
328
0-2
162
0-3
490
0C
omm
issi
on A
ccep
ted
4675
4754
00
5074
4449
6086
5074
4449
6086
Com
miss
ion
Ced
ed-5
2771
7-4
9132
2-7
1815
-718
47-5
3980
3-5
5262
6-6
1161
8-6
2447
3Ne
t Inc
urre
d Co
mm
issi
on18
1776
118
0318
1-7
3143
-718
47-3
4520
-565
40-1
0766
3-1
2838
7Fo
reig
n Ta
xes
4391
9086
00
00
00
Ope
ratin
g Ex
pens
es R
elat
ed to
Insu
ranc
e35
1497
429
6687
675
8008
6987
2922
1618
820
3979
729
7419
627
3852
6Re
venu
e Ac
coun
ts R
esul
t39
3195
2235
6828
3381
514
5724
-225
7174
-257
6773
5766
41-2
4310
49

okf"kZd fjiksVZANNUAL REPORT 2009-10
81
SE
GM
EN
T R
EP
OR
TIN
G S
CH
ED
UL
E F
OR
TH
E Y
EA
R E
ND
ED
31S
T M
AR
CH
, 20
10 -
GL
OB
AL
Rs.
(00
0)
Hea
lthLi
ablit
yPe
rson
al A
ccid
ent
Avia
tion
C.Y
.P.
Y.C
.Y.
P.Y.
C.Y
.P.
Y.C
.Y.
P.Y.
Prem
ium
Dire
ct15
6723
4313
5567
3419
5939
519
4452
211
9669
211
1353
764
3955
7820
06Pr
emiu
m A
ccep
ted
00
2250
828
273
2059
733
533
6932
6521
7990
Prem
ium
Ced
ed-1
5944
19-1
3556
73-5
8116
5-3
0269
2-2
4475
5-2
2273
4-4
7261
3-7
4211
8Ne
t Pre
miu
m14
0779
2412
2010
6114
0073
816
7010
397
2534
9243
3686
4607
2578
78U
nexp
ired
Ris
k R
eser
ve O
peni
ng56
5103
051
4001
783
5051
8910
6746
2168
4582
8712
8939
3535
8U
nexp
ired
Ris
k R
eser
ve C
losi
ng-7
0389
62-5
6510
30-7
0037
0-8
3505
1-4
8626
7-4
6216
8-4
3230
3-1
2893
8Ne
t Ear
ned
Prem
ium
1268
9992
1169
0048
1535
419
1726
119
9484
3592
0455
5612
4316
4298
Prof
it on
Rea
lisat
ion
of In
vest
men
t42
5799
1989
4517
5686
1021
2962
389
2579
158
896
2842
8O
ther
Inco
me/
Expe
nse
(App
ortio
ned)
00
00
00
00
Inte
rest
Div
iden
d an
d R
ent
5700
5353
2543
2352
0527
3383
8352
569
038
7884
976
098
Inve
stm
ent P
rovi
sion
s-5
2843
46-2
1822
30-7
756
3-7
362
1To
tal I
nves
tmen
t Inc
ome
9953
2473
5834
4106
7337
7742
1458
3795
392
1376
7210
5147
Cla
ims
Paid
Dire
ct15
6987
1812
8050
2290
4181
1048
165
8326
4472
3082
2154
2426
7807
Cla
ims
Paid
Acc
epte
d0
021
1819
8523
200
3049
229
8477
1762
59C
laim
s Pa
id C
eded
-175
7445
-787
127
-123
201
-569
53-3
6772
9-1
4292
3-1
3602
3-1
6364
8Ne
t Cla
im P
aid
1394
1273
1201
7895
7830
9899
3197
4881
1561
0651
3778
7828
0418
Cl O
/S C
laim
s D
irect
2844
968
2416
983
3796
855
2858
981
8596
9979
1790
8486
2697
9929
Cl O
/S C
laim
s Ac
cept
ed0
014
660
2479
910
480
3151
5849
4835
Cl O
/S C
laim
s C
eded
-198
968
-176
523
-821
354
-437
985
-245
418
-108
163
-396
010
-512
163
Net C
l. O
/S C
laim
2646
000
2240
460
2976
967
2420
996
6390
8069
4107
7677
7496
2601
Op
O/S
Cla
ims
Dire
ct-2
4169
83-1
8912
00-2
8589
81-2
9152
57-7
9179
0-6
6659
7-9
7992
9-1
1976
19O
p O
/S C
laim
s Ac
cept
ed0
00
0-1
0480
-115
68-4
9483
5-3
5921
0O
p O
/S C
laim
s C
eded
1765
2318
8730
4379
8429
3712
1081
6324
9399
5121
6361
4431
Net O
p. O
/S C
laim
-224
0460
-170
2470
-242
0997
-262
1545
-694
107
-428
766
-962
601
-942
398
Incu
rred
Cla
ims
Dire
ct16
1267
0213
3308
0618
4205
399
1889
9005
5484
8275
8412
350
118
Incu
rred
Cla
ims
Acce
pted
00
3584
1985
3751
929
404
1188
0031
1884
Incu
rred
Cla
ims
Ced
ed-1
7798
90-7
7492
1-5
0657
1-2
0122
6-5
0498
5-1
687
-198
70-6
1381
Net I
ncur
red
Clai
ms
1434
6812
1255
5885
1339
066
7926
4843
3088
8759
9218
3053
3006
21C
omm
issi
on D
irect
1619
734
1568
314
3151
9634
0119
1648
5114
7100
1044
675
64C
omm
issi
on A
ccep
ted
00
2374
2631
4049
1404
012
3361
3565
0C
omm
issio
n C
eded
-276
121
-271
135
-856
46-4
8921
-406
46-4
6411
-194
65-3
4684
Net I
ncur
red
Com
mis
sion
1343
613
1297
179
2319
2429
3829
1282
5411
4729
1143
4285
30Fo
reig
n Ta
xes
100
058
517
2913
929
260
444
3O
pera
ting
Expe
nses
Rel
ated
to In
sura
nce
3314
504
2636
853
4191
4838
3718
2574
4122
3111
2828
0519
4504
Reve
nue
Acco
unts
Res
ult
-531
9713
-406
4035
-446
3163
1937
2753
50-1
9827
711
8111
-234
653
SE
GM
EN
T R
EP
OR
SE
GM
EN
T R
EP
OR
SE
GM
EN
T R
EP
OR
SE
GM
EN
T R
EP
OR
SE
GM
EN
T R
EP
OR
TIN
G S
CH
ED
UL
ES
TIN
G S
CH
ED
UL
ES
TIN
G S
CH
ED
UL
ES
TIN
G S
CH
ED
UL
ES
TIN
G S
CH
ED
UL
ES

82
Estbd. 1919
fn U;w bafM;k ,';ksjUl da- fy-THE NEW INDIA ASSURANCE CO. LTD.
SE
GM
EN
T R
EP
OR
TIN
G S
CH
ED
UL
E F
OR
TH
E Y
EA
R E
ND
ED
31S
T M
AR
CH
, 20
10 -
GL
OB
AL
Rs.
(00
0)
Engi
neer
ing
Cred
it Sh
ield
Tota
l Oth
er M
isc.
Gra
nd T
otal
C.Y
.P.
Y.C
.Y.
P.Y.
C.Y
.P.
Y.C
.Y.
P.Y.
Prem
ium
Dire
ct33
2439
029
0998
927
8304
3295
4350
5432
145
6842
570
9914
1164
5578
93Pr
emiu
m A
ccep
ted
7405
9453
7116
3072
3820
5292
3905
7116
1645
1246
1500
1158
1352
Prem
ium
Ced
ed-1
6948
50-1
4212
15-1
9415
5-2
3105
4-1
1206
50-9
6335
7-2
3426
316
-211
3618
6Ne
t Pre
miu
m23
7013
420
2589
039
1387
3037
8143
2424
237
6671
360
0265
9655
0030
59U
nexp
ired
Ris
k R
eser
ve O
peni
ng10
1294
579
5381
1518
9030
7229
1883
355
1670
349
2824
0311
2573
0226
Une
xpire
d R
isk
Res
erve
Clo
sing
-118
5067
-101
2945
-195
694
-151
890
-216
2207
-188
3355
-311
5834
0-2
8240
310
Net E
arne
d Pr
emiu
m21
9801
218
0832
634
7583
4591
2040
4539
035
5370
757
1085
6752
4929
75Pr
ofit
on R
ealis
atio
n of
Inve
stm
ent
1317
1257
429
2503
216
288
2912
1213
6525
5202
767
2533
275
Oth
er In
com
e/Ex
pens
e (A
ppor
tione
d)0
00
00
00
0In
tere
st D
ivid
end
and
Ren
t17
6334
1537
2633
512
4360
038
9870
3654
5469
6538
767
8115
6In
vest
men
t Pro
visi
ons
-163
1255
-31
356
-362
2982
-645
555
340
Tota
l Inv
estm
ent I
ncom
e30
7883
2124
1058
513
6024
468
0720
5049
6112
1617
0093
6977
1C
laim
s Pa
id D
irect
1065
952
1852
391
5373
283
205
1691
714
2038
464
5257
3018
4824
0224
Cla
ims
Paid
Acc
epte
d92
424
1550
4727
2412
2418
9521
6431
1254
3660
3350
933
9893
1C
laim
s Pa
id C
eded
-305
347
-914
867
-395
54-6
3854
-581
928
-146
4466
-143
5927
4-1
1706
222
Net C
laim
Pai
d85
3029
1092
571
2865
9026
1246
1326
217
6994
3444
2472
5439
9329
33C
l O/S
Cla
ims
Dire
ct25
5198
322
3661
253
5574
4023
5837
7634
537
2249
189
6246
7585
1703
41C
l O/S
Cla
ims
Acce
pted
4330
4522
6193
4130
4718
0105
2772
4546
0924
1978
3931
1477
1466
Cl O
/S C
laim
s C
eded
-102
0626
-103
4677
-355
076
-270
433
-837
145
-669
634
-341
4682
9-3
1757
275
Net C
l. O
/S C
laim
1964
402
1428
128
5935
4531
2030
3216
445
3513
781
7526
1778
6818
4532
Op
O/S
Cla
ims
Dire
ct-2
2366
12-2
8847
14-4
0235
8-5
3369
-372
2491
-393
8732
-851
7034
3-7
9989
627
Op
O/S
Cla
ims
Acce
pted
-226
193
-241
732
-180
105
-226
462
-460
924
-107
130
-147
7146
6-7
9872
77O
p O
/S C
laim
s C
eded
1034
677
1946
646
2704
3326
858
6696
3410
2060
631
7572
7426
5781
35Ne
t Op.
O/S
Cla
im-1
4281
28-1
1798
00-3
1203
0-2
5297
3-3
5137
81-3
0252
56-6
8184
534
-613
9876
9In
curre
d C
laim
s D
irect
1381
322
1204
290
1869
4743
2194
1745
564
1822
224
5702
7351
5342
0943
Incu
rred
Cla
ims
Acce
pted
2992
7613
9507
5053
5519
5538
3275
347
9230
1104
5975
1018
3118
Incu
rred
Cla
ims
Ced
ed-2
9129
6-2
898
-124
197
-307
429
-749
440
-111
3494
-167
4882
9-1
6885
364
Net I
ncur
red
Clai
ms
1389
302
1340
899
5681
0532
0303
1028
877
1187
960
5132
4497
4671
8697
Com
mis
sion
Dire
ct28
2101
2038
9418
763
3239
572
4044
7709
8372
0653
369
3098
9C
omm
issi
on A
ccep
ted
1420
7311
6976
6662
645
569
8236
765
375
1863
326
1746
031
Com
miss
ion
Ced
ed-4
9401
4-2
9482
0-4
7509
-321
20-1
6243
3-2
0503
1-3
4561
83-3
0687
54Ne
t Inc
urre
d Co
mm
issi
on-6
9840
2605
037
880
4584
464
3978
6313
2756
1367
756
0826
6Fo
reig
n Ta
xes
453
986
00
689
1591
7259
1444
4O
pera
ting
Expe
nses
Rel
ated
to In
sura
nce
8596
9367
0479
1238
3510
4028
1151
527
9200
2317
3606
3914
5501
18Re
venu
e Ac
coun
ts R
esul
t32
6287
-176
78-3
2372
449
189
1901
039
1317
767
-503
5802
-502
8779
SE
GM
EN
T R
EP
OR
SE
GM
EN
T R
EP
OR
SE
GM
EN
T R
EP
OR
SE
GM
EN
T R
EP
OR
SE
GM
EN
T R
EP
OR
TIN
G S
CH
ED
UL
ES
TIN
G S
CH
ED
UL
ES
TIN
G S
CH
ED
UL
ES
TIN
G S
CH
ED
UL
ES
TIN
G S
CH
ED
UL
ES

okf"kZd fjiksVZANNUAL REPORT 2009-10
83
SH
AR
EH
OL
DE
RS
’ AN
D P
OL
ICY
HO
LD
ER
S’
FU
ND
S
Sh
areh
old
ers’
Fu
nd
s
Bala
nces
Perc
enta
geB
alan
ces
Perc
enta
geas
on
as o
n01
.04.
2009
31.0
3.20
10
Shar
e C
apita
l20
0000
0000
2000
0000
00
Cap
ital R
eser
ves
5750
8857
5088
Gen
eral
Res
erve
s68
9871
9868
572
0394
6062
6
Mis
cella
neou
s R
eser
ves
/Sp
ecia
l Res
erve
s22
3374
8167
2620
3058
7
Tota
l73
2215
2194
043
.16
7430
2066
301
41.1
1
Polic
yhol
ders
í Fun
ds
Une
xpire
dO
utst
andi
ngTo
tal
Perc
enta
geU
nexp
ired
Out
stan
ding
Tota
lPe
rcen
tage
Ris
ksC
laim
sR
eser
ves
Ris
ksC
laim
sR
eser
ves
Res
erve
sR
eser
ves
as o
nR
eser
ves
Res
erve
sas
on
as o
nas
on
01.0
4.20
09as
on
as o
n31
.03.
2010
01.0
4.20
0901
.04.
2009
31.0
3.20
1031
.03.
2010
Fire
5190
7339
9093
5326
2061
1454
3996
051
5485
0854
1414
2601
4366
719
7452
2908
1
Mar
ine
2376
5703
6332
2448
3466
5601
0538
2922
8991
3814
3030
5693
4753
2048
3161
Mis
cella
neou
s20
6730
0870
655
6067
8818
576
2797
9689
123
3833
4102
057
9710
6474
481
3544
0576
4
Tota
l28
2403
1305
968
1845
3371
296
4248
4677
156
.84
3115
8340
248
7526
1777
758
1064
2011
8006
58.8
9
Tota
l Fun
ds16
9646
3687
1110
0.00
1807
2218
4307
100.
00
The
bal
ance
s as
on
01.0
4.20
09 a
re u
sed
as b
asis
for
app
ortio
nmen
t of
inve
stm
ent
inco
me
of 2
009-
10 b
etw
een
polic
yhol
ders
and
sha
reho
lder
s
Ave
arge
Sha
reho
lder
s’ F
unds
(R
s in
cro
res)
(732
2.15
+74
30.2
1)/2
7376
.18
Ave
arge
Pol
icyh
olde
rs’ F
unds
(R
s in
cro
res)
(964
2.48
+10
642.
01)/
210
142.
25
Ave
rag
e To
tal
Fu
nd
s (R
s. i
n c
rore
s)17
518.
43
SH
AR
EH
OL
DE
RS
’ & P
OL
ICY
HO
LD
ER
S’ F
UN
DS
SH
AR
EH
OL
DE
RS
’ & P
OL
ICY
HO
LD
ER
S’ F
UN
DS
SH
AR
EH
OL
DE
RS
’ & P
OL
ICY
HO
LD
ER
S’ F
UN
DS
SH
AR
EH
OL
DE
RS
’ & P
OL
ICY
HO
LD
ER
S’ F
UN
DS
SH
AR
EH
OL
DE
RS
’ & P
OL
ICY
HO
LD
ER
S’ F
UN
DS

84
Estbd. 1919
fn U;w bafM;k ,';ksjUl da- fy-THE NEW INDIA ASSURANCE CO. LTD.
SCHEDULE 16
Significant Accounting Policies and Notes forming part ofFinancial Statements as on 31st March, 2010
16 A. Significant Accounting Policies
1. Accounting Convention
The financial statements are drawn up in accordance with the provisions of section 11 (1) of theInsurance Act, 1938, Regulations framed under Insurance Regulatory & Development AuthorityAct, 1999, read with the provisions of sub-sections (1), (2) and (5) of Section 211, sub-section(5) of Section 227 of the Companies Act, 1956. The said statements prepared on historical costconvention and on accrual basis, comply with accounting standards referred in section 211(3C) of the Companies Act, 1956, and Insurance Regulatory and Development Authority(Preparation of Financial Statements and Auditors’ Report of Insurance Companies) Regulations2002 to the extent applicable, and conform to practices prevailing in the general insuranceindustry except as otherwise stated.
2. Use of Estimates
The preparation of financial statements in conformity with generally accepted accountingprinciples requires management to make estimates and assumptions that affect the reportedamount of assets, liabilities, revenues and expenses and disclosure of contingent liabilities onthe date of the financial statements. Actual results may differ from those estimates andassumptions. The estimates and assumptions used in the accompanying financial statementsare based upon management’s evaluation of the relevant facts and circumstances as on thedate of the financial statements. Any revision to accounting estimates is recognized prospectivelyin current and future periods.
3. Revenue Recognition
A. Premium
Premium income is recognized on assumption of risk. A reserve for Unearned Premiumfor each segment, representing that part of the recognized premium attributable to thesucceeding accounting periods, calculated on time apportionment basis is created.This forms part of the un-expired risk reserves.
Reinsurance premium is recognized as per the terms of the reinsurance contracts. Areserve for Unearned Premium for each segment, representing that part of therecognized reinsurance premium attributable to the succeeding accounting periods, iscreated in the ratio, in which unearned premium of the direct business bears to therecognized premium of such business. This also forms part of the un-expired riskreserves.
Any subsequent revisions to or cancellations of premium are recognised in the year inwhich they occur.
B. Commission
Commission Income on Reinsurance cessions is recognized as income in the year inwhich reinsurance Premium is ceded.
AAAA AC
CO
UN
TIN
G P
OLIC
YC
CO
UN
TIN
G P
OLIC
YC
CO
UN
TIN
G P
OLIC
YC
CO
UN
TIN
G P
OLIC
YC
CO
UN
TIN
G P
OLIC
Y

okf"kZd fjiksVZANNUAL REPORT 2009-10
85
Profit Commission under reinsurance treaties wherever applicable, is recognized on accrual. Anysubsequent revisions of profit commission are recognized for in the year in which final determinationof the profits are intimated by reinsurers.
4. Premium Received in Advance
Premium received in advance represents premium received in respect of policies issued during theyear, where the risk commences subsequent to the balance sheet date.
5. Reserves for Un-expired Risk/s
Reserve for un-expired risk is made on the amount representing that part of the net premiumwritten which is attributable to, and to be allocated to the succeeding accounting periods. Reservefor un-expired risks are made at 100% of net premium for marine business and 50% of netpremium for other classes of business except Health segment.
In case of Health segment, the reserve for unexpired risk is created at the end of the accountingyear based on 1/365 method as per IRDA circular no.IRDA/F&I/CIR/F&A//081/12/2009 datedDecember 17, 2009.
6. Reinsurance Accepted
Reinsurance returns have been incorporated for the advices received up to the date of finalisationof accounts and on estimation basis wherever advices are not received.
7. Reinsurance Ceded
Reinsurance cessions are accounted for on the basis of actuals or estimates wherever actualsare not available.
8. Premium Deficiency
Premium deficiency is calculated where the sum of expected claims costs, related expensesand maintenance costs exceed the related unearned premiums. The deficiency is recognised,only to the extent of excess of unearned premium plus premium deficiency so calculated overthe un-expired risk reserves at the percentages mentioned herein above. For the purpose ofrecognition of Premium deficiency only three major segments viz., Fire, Marine and Miscellaneousare considered as directed by IRDA vide circular no. F & A/CIR/017/MAY -04 dated 18th May2004. Premium deficiency forms part of the un-expired risk reserves.
9. Acquisition Costs.
Acquisition costs are primarily related to acquisition of insurance contracts and have beenexpensed in the year in which they are incurred.
10. Outstanding Claims
Claims include all expenses directly incurred in relation to their assessment and are net ofsalvage realized. Claims reported and outstanding at the year-end are provided based on surveyreports, information provided by clients and other sources, past experience and applicablelaws and includes:
AC
CO
UN
TIN
G P
OL
IC
YA
CC
OU
NT
IN
G P
OL
IC
YA
CC
OU
NT
IN
G P
OL
IC
YA
CC
OU
NT
IN
G P
OL
IC
YA
CC
OU
NT
IN
G P
OL
IC
Y

fn U;w bafM;k ,';ksjUl da- fy-THE NEW INDIA ASSURANCE CO. LTD.
86
Estbd. 1919
AC
CO
UN
TIN
G P
OL
IC
YA
CC
OU
NT
IN
G P
OL
IC
YA
CC
OU
NT
IN
G P
OL
IC
YA
CC
OU
NT
IN
G P
OL
IC
YA
CC
OU
NT
IN
G P
OL
IC
Y
� In respect of direct business, claim intimations received up to the year-end.
� In respect of reinsurance accepted, advices received as of different dates of subsequentyear up to the date of finalisation of accounts and on estimation basis wherever advicesare not received.
� Provision for claims incurred but not reported (IBNR) and provision for claims incurredbut not enough reported (IBNER). The said provisions have been determined byAppointed Actuary, which is in accordance with accepted actuarial practice, requirementof Insurance Act 1938, IRDA Regulations and stipulations of the Institute of Actuariesof India.
All the outstanding claims for direct business are provided net of estimated salvage (if any).
In respect of motor third party claims where court summons have been served on the Companywithout adequate policy particulars to establish liability of the Company, provision is made asunder:
� 100% of the estimated liability, where such claims are outstanding for more than oneyear.
� 1/3rd of the estimated liability, for all such claims for which court summons have beenserved on the Company during the year.
Interest on motor accident claims tribunal (MACT) claims is provided based on the prevailingtrends in the motor third party claim awards.
11. Salvage and Claim Recoveries
Recoveries of claims and sale proceeds on disposal of salvage are accounted on realisationand credited to claims.
12. Provisions, Contingent Liabilities & Contingent Assets
Provisions involving substantial degree of estimation in measurement are recognized whenthere is a present obligation as a result of past events and it is probable that there will be anoutflow of resources and reliable estimate can be made of the amount of obligation. ContingentLiabilities are not recognized but are disclosed in the notes. Contingent Assets are neitherrecognized nor disclosed in the financial statements.
13. Loans and Investments
A Loans are measured at historical cost subject to impairment. Company reviews thequality of its loan assets and provides for impairment if any.
B Short Term Money Market Instruments such as Commercial Papers and Certificate ofDeposits are shown at their discounted value and the difference between the acquisitioncost and the redemption value is apportioned on time basis and recognised as accruedincome.
C Contracts for purchase and sale of shares, bonds, debentures are accounted for as“Investments” as on date of transaction.

okf"kZd fjiksVZANNUAL REPORT 2009-10
87
D The cost of investments includes premium on acquisition, brokerage, transfer stamps,transfer charges and is net of incentive/ fee if any, received thereon.
E Dividend income (other than interim dividend) is accounted for as income in the year ofdeclaration. Dividend on shares/interest on debentures under objection/pending deliveryis accounted for on realisation. Interim dividend is accounted where the warrants aredated 31st March or earlier.
Dividend on foreign investments is accounted for net of withholding tax.
Interest Income on Investments is recognized on accrual basis on time proportion.
Amount received towards compensation for future loss of interest is recognised asincome only to the extent attributable to the accounting year and balance is kept ininterest received in advance account for apportionment in the relevant year.
F Profit/Loss on realisation of investments is computed by taking weighted average bookvalue as cost of investments except:
� In respect of Government Securities/Debentures/Bonds under Trading Portfolio, theprofit/loss is worked out specific scrip wise.
� In respect of Government Securities sold from Investment Portfolio, the profit/loss isworked out on first in first out basis (FIFO).
G The Company follows the prudential norms prescribed by the Insurance Regulatoryand Development Authority as regards asset classification, recognition of income andprovisioning pertaining to loans/advances.
H Investment in government securities, debt securities and redeemable preference sharesare considered as held till maturity and valued at cost. However, in terms of InsuranceRegulatory and Development Authority Regulations the premium paid at the time ofacquisition of securities is amortised over the residual period of maturity.
I Investments in Mutual Fund/s/Venture Fund/s are valued at Net Asset Value (NAV) atthe year-end and the difference between cost/book value and NAV is accounted in FairValue Change Account. However, if there is reduction in NAV in case of venture fund,the same is charged to revenue and the book value of investment is reduced accordingly.Any appreciation in NAV to the extent of loss earlier recognised, is taken to revenue.
In case of non-availability of NAV as at the balance sheet date, investment is shown atcost.
J Investment Portfolio in respect of equity/ equity related instruments is segregated intoactively traded and thinly traded as prescribed by Insurance Regulatory andDevelopment Authority Regulations. The shares are treated as thinly traded by takinginto consideration transactions in the month of March on both National Stock Exchange(NSE) and Bombay Stock Exchange (BSE).
Actively traded equity/ equity related instruments are valued at lowest of the lastquoted closing price in March at National Stock Exchange or Bombay StockExchange. If the shares are traded/ listed only on either of the stock exchanges
AC
CO
UN
TIN
G P
OL
IC
YA
CC
OU
NT
IN
G P
OL
IC
YA
CC
OU
NT
IN
G P
OL
IC
YA
CC
OU
NT
IN
G P
OL
IC
YA
CC
OU
NT
IN
G P
OL
IC
Y

fn U;w bafM;k ,';ksjUl da- fy-THE NEW INDIA ASSURANCE CO. LTD.
88
Estbd. 1919
then the quotation available on the respective stock exchange is considered. Thedifference between weighted average cost and quoted value is accounted in FairValue Change Account.
K Investment in thinly traded equity shares and unlisted equity shares are shown at cost.However, difference between cost and break-up value is provided for as diminution invalue. If the break-up value is negative then the provision is made for the entire cost.Further, if the published accounts of an unlisted Company are not available for lastthree accounting years ending on or immediately preceding the date of working outdiminution in value, then the provision is made for the entire cost.
L In case of investment in listed and unlisted equity/ equity related instruments / preferenceshares where the value has been impaired on or before 31.03.2000, the historical/weighted average costs are not available with the Company. As a consequence, thecarrying value of such investments as on 01.04.2000 is presumed to be the historical/weighted average cost
M Investments in listed equity/ equity related instruments/ preference shares made inthose companies, which are making losses continuously for last 3 years and wherecapital is eroded, are considered to have impairment in value. Further, if the publishedaccounts of a Company are not available for last three accounting years ending on orimmediately preceding the date of working out impairment in value, it is presumed thatthe value of investment is fully impaired and is written off to a nominal value of Re.1/-per Company.
I. Valuation of such investments is done as under:
i) In respect of actively traded equity shares: - least of cost price, marketprice or break-up value provided break-up value is positive. However,if the break-up value is negative the nominal value is taken at Re. 1/-per Company
ii) In respect of other than actively traded equity shares: - lower of costprice or break-up value provided break-up value is positive. However,if break-up value is negative the nominal value is taken at Re.1/- perCompany.
iii) In respect of preference shares, if the dividend is not received for thelast three years, such preference shares are written down to a valuewhich will bear to its face value, the same proportion as value taken/which would have been taken for writing down equity shares bears tothe face value of the equity shares. However, if the equity shares arewritten down to Re.1/- per Company, preference shares are also writtendown to a nominal value of Re.1/- per Company.
II. Once the value of investment in listed equity/ equity related instruments/preference share is impaired in accordance with the above mentioned policy,then the reversal of such impairment losses are recognised in revenue/ profitand loss until only when the accumulated losses of such investee companiesare completely wiped out and capital is fully restored as per the latest available
AC
CO
UN
TIN
G P
OL
IC
YA
CC
OU
NT
IN
G P
OL
IC
YA
CC
OU
NT
IN
G P
OL
IC
YA
CC
OU
NT
IN
G P
OL
IC
YA
CC
OU
NT
IN
G P
OL
IC
Y

okf"kZd fjiksVZANNUAL REPORT 2009-10
89
published accounts on or immediately preceding the date of working out thereversal. However, in respect of investments where the historical or weightedaverage cost is not available as mentioned in Policy No.13-L, reversal ofimpairment loss is carried out and recognised only to the extent of impairmentlosses accounted after 31st March 2000.
N REVERSE REPO transactions are treated as secured lending transactions and accordinglydisclosed in the financial statements. The difference between total consideration at the 1st
and 2nd leg of the transaction is treated as interest income.
O “Collateralized Borrowing and Lending Obligation” (CBLO), which is issued at discount tothe face value, is treated as money market instrument as per Reserve Bank of IndiaNotification. Discount earned at the time of lending through CBLO is shown as income,which is apportioned on time basis.
P Un-realised gains / losses arising due to changes in the fair value of listed equity sharesother than enumerated in Accounting Policy 13-L are taken under the head “Fair ValueChange Account” and on realisation reported in profit and loss account.
Pending realisation, the credit balance in the “Fair Value Change Account” is not availablefor distribution.
14. Foreign Currency Transactions
� Reinsurance operations:
Revenue transactions of re-insurance in foreign currencies are converted at the averageof buying and selling rates of exchange of each quarter in which they are accounted.
� Foreign operations:
� As per the Accounting Standard (AS) 11 “The Effects of Changes in ForeignExchange Rates”, foreign branches/agencies are classified as ‘non-integralforeign operations’.
� The assets and liabilities (including contingent liabilities), both monetary andnon-monetary of the non-integral foreign operations are translated at the closingrate,
� Income and expense items of the non-integral foreign operations are translatedat the average exchange rate of the year.
� Provision for outstanding claims of non-integral foreign operations are convertedat the closing rate.
� Depreciation on fixed assets held in foreign branches and agencies is providedon written down rupee value at the year-end at the rates and in the manner asstated in “Depreciation” policy stated herein below.
� All resulting exchange difference is accumulated in a foreign currency translationreserve until the disposal of the net investment.
AC
CO
UN
TIN
G P
OL
IC
YA
CC
OU
NT
IN
G P
OL
IC
YA
CC
OU
NT
IN
G P
OL
IC
YA
CC
OU
NT
IN
G P
OL
IC
YA
CC
OU
NT
IN
G P
OL
IC
Y

fn U;w bafM;k ,';ksjUl da- fy-THE NEW INDIA ASSURANCE CO. LTD.
90
Estbd. 1919
� Foreign investments transactions during the year are converted at the exchangerates prevailing as on the last day of the month of purchase or sale.
� Other assets and liabilities in foreign currencies are converted at the average ofbuying and selling rates of exchange prevailing at the year end.
� The exchange gain/loss due to conversion of foreign currencies other than relatingto non-integral foreign operations is taken to revenue(s) account and profit andloss account as applicable.
15. Fixed Assets
� Fixed assets are stated at cost less depreciation.
� The fixed assets are assessed for any indication that an asset is impaired. In case therecoverable amount of the fixed assets is lower than its carrying amount a provision ismade for the impairment loss.
� Lease payment for assets taken on operating lease are recognized as an expense inthe revenue(s) accounts and profit and loss account over the lease term.
16. Depreciation
� Depreciation on fixed assets is charged on written down value method at the ratesprescribed in the schedule XIV of the Companies Act, 1956. However, wherecorresponding rates are higher under the Income Tax Rules, 1962, the same are adopted.In case of leasehold properties amortisation is made over the leased period.
� Depreciation is provided at 50% of the applicable rates as above on additions made tofixed assets, which are put into use for less than six months.
� No depreciation is provided on assets sold/ discarded/destroyed during the year.
17. Intangible Assets
Intangible assets are stated at cost of acquisition less accumulated amortisation. The same isamortised over a period of four years on straight line basis. Software development / acquisitioncosts, except those which meet the recognition criteria as laid down in Accounting Standard 26(AS 26), are charged to revenue.
18. Employee Benefits
Employee benefits comprise of both defined contributions and defined benefit plans.
Provident Fund is a defined contribution plan. Company’s contribution towards provident fundis charged to the Profit and Loss Account and Revenue Accounts as applicable. Further Companyhas no further obligation beyond the periodic contributions.
Pension, Gratuity and Leave Encashment are defined benefit plans. The Company has incorporateda Pension Trust and Gratuity Trust. The Company’s liability towards pension, gratuity and leaveencashment is accounted for on the basis of an actuarial valuation done at the year end and ischarged to revenue accounts and profit and loss account as applicable except in case of pensionfor the employee who joined from 1st January, 2004 which is defined contribution plan wherein
AC
CO
UN
TIN
G P
OL
IC
YA
CC
OU
NT
IN
G P
OL
IC
YA
CC
OU
NT
IN
G P
OL
IC
YA
CC
OU
NT
IN
G P
OL
IC
YA
CC
OU
NT
IN
G P
OL
IC
Y

okf"kZd fjiksVZANNUAL REPORT 2009-10
91
contribution towards pension fund is charged to the Profit and Loss Account and Revenue Accountsas applicable. Further, Company has no further obligation beyond the periodic contributions.
All short term employee benefits are accounted on undiscounted basis during the accountingperiod based on service rendered by the employees.
19. Expenses of Management-Basis of Apportionment
Expenses of management including provision for bad and doubtful debts and exchange gain/loss,are apportioned to the revenue accounts on the basis of gross direct premium plus reinsurancesaccepted giving weightage of 75% for marine business and 100% each for fire and miscellaneousbusiness.
20. Income from Investments -Basis of Apportionment
Investment Income (net of expenses) is apportioned between Shareholders’ Fund and Policyholders’Fund in proportion to the balance of these funds at the beginning of the year.
Investment income (net of expenses) belonging to Policyholders is further apportioned to Fire,Marine and Miscellaneous segments in proportion to respective technical reserves balance atthe beginning of the year.
Shareholders’ Funds for this purpose consist of Share Capital, General Reserves, CapitalReserves and Foreign Currency Translation Reserve.
Policyholders’ Funds consist of Technical Reserves i.e. Un-expired Risk Reserve plus Provisionsfor Outstanding Claims.
21. Taxation.
� Tax expense for the year, comprises current tax and deferred tax.
� Current income tax expense comprises taxes on income from operations in India and inforeign jurisdiction. Income tax payable in India is determined in accordance with theprovisions of the Income Tax Act 1961. Tax expense relating to foreign operations isdetermined in accordance with tax laws applicable in countries where such operationsare domiciled.
� Minimum Alternative Tax (MAT) paid in accordance to the tax laws, which gives rise tofuture economic benefits in the form of adjustment of future income tax liability, is consideredas an asset if there is convincing evidence that the Company will pay normal income taxon future income. Accordingly, MAT is recognized as an asset in the Balance sheet whenit is probable that the future economic benefit associated with it will flow to the Companyand the asset can be measured reliably.
� A provision is made for deferred tax for all timing differences arising between taxableincome and accounting income at currently enacted tax rates.
� Deferred tax assets are recognized only if there is a virtual certainty backed by convincingevidence that they will be realized and are reviewed for the appropriateness of their respectivecarrying values at each balance sheet date.
� Refund of income tax is accounted on realisation basis.
AC
CO
UN
TIN
G P
OL
IC
YA
CC
OU
NT
IN
G P
OL
IC
YA
CC
OU
NT
IN
G P
OL
IC
YA
CC
OU
NT
IN
G P
OL
IC
YA
CC
OU
NT
IN
G P
OL
IC
Y

fn U;w bafM;k ,';ksjUl da- fy-THE NEW INDIA ASSURANCE CO. LTD.
92
Estbd. 1919
NO
NO
NO
NO
NO
TE
ST
ES
TE
ST
ES
TE
S
16 B. Notes Forming Part of Financial Statements
1. The accounts incorporate audited accounts of Branches in Fiji and Thailand on calendar year basisprepared as per local laws. No material changes have been reported after the finalization of accountsof these branches. Further the accounts of Australia branch and Riyadh, France and Canada agencieswere incorporated on the basis of unaudited accounts.
2. Buildings include Rs. 249.89 Lakh (Previous Year Rs.308.98 Lakh) in respect of which the deeds ofconveyance are yet to be executed.
3. a Reinsurers’ and Coinsurers' balances are subject to confirmations / reconciliations andconsequential adjustments if any.
b Reinsurance acceptance transactions pertaining to the year have been booked for advices receivedupto 15th June 2010.
c Some of the inter-office accounts are subject to reconciliations and consequential adjustments ifany.
d In respect of old reinsurance balances amounting to Rs 12005 lakh (Net), the company has madean additional estimated provision in the current year of Rs 6000 lakh towards non-recovery ofthese balances.
4. As certified by the Custodian, securities are held in the name of the Company as on 31.03.2010. Variationsand other differences are under reconciliation and are not expected to have a material impact on the stateof affairs of the Company.
5. Certificates of confirmation are awaited for earlier years’ Foreign Investments amounting to Rs.18.27 lakh(Previous Year Rs.18.27 lakh). However, the same are fully provided for.
6. a Provision for standard assets @ 0.40% amounting to Rs.1532.07 Lakh (Previous Year Rs.1426.41Lakh) has been made as per Insurance Regulatory and Development Authority guidelines on(i) Term Loan (PFPS/DTL), (ii) Debentures, (iii) Infrastructure Investments, (iv) Bonds/Debenturesof HUDCO, (v) Bonds/Debentures of Institutions accredited to NHB and (vi) Loans to HUDCO forHousing (vii) Govt. Guaranteed Bonds/Securities (viii) Housing and Fire fighting Loans to StateGovernments.
b During the year, the Company has undertaken restructuring of corporate debt/loans etc. as under:
Sr. No. Particulars Current Year Previous Year(Rs in Lakh) (Rs in Lakh)
Total amount of assets subjected to restructuring 4,289.74 467.55
The break up of the same is given here under:
(i) Total amount of standard assets subjected torestructuring
(ii) Total amount of sub-standard assets subjected to -restructuring
(iii) Total amount of doubtful assets subjected to -restructuring
(iv) Total amount of loss assets subjected to 4,289.74 467.55restructuring
Total 4,289.74 467.55

okf"kZd fjiksVZANNUAL REPORT 2009-10
93
c Details of Non Performing Assets (NPA).
I) Details of Non Performing Assets (NPA)
II) Details of Provisions
Sr. No. Particulars Current Year Previous Year(Rs in Lakh) (Rs in Lakh)
(i) Opening Balance 19295.08 20862.37
(ii) Incremental Provision During the Year -968.58 -1567.29
(iii) Closing Balance 18326.50 19295.08
7. Short-term Investments (Schedule - 8) in debentures and other guaranteed securities include those, whichare fully repayable in the next year. As regards those debentures and other guaranteed securities, whichhave fallen due and remain unpaid as on 31.03.2010, they have been shown under long-term investments,as their realisability is unascertainable. However, necessary provision, wherever required, has been made.
8. a There are following cases of non-compliance/contravention of Insurance Regulatory & DevelopmentAuthority (Investment) Regulations, 2000:
i) Return prescribed by Regulation 6 with respect to Compliance Report for exposure ofinvestment have been submitted although not in the prescribed format
ii) The Company is in the process of improving the system to ensure that the investmentexposure at any point of time does not exceed the prescribed limits under Regulation5. However, there is no case of violation of the prescribed exposure limits.
b There are following cases of non-compliance/contravention of Insurance Regulatory &Development Authority (Preparation of Financial Statements and Auditor’s Report of InsuranceCompanies) Regulations, 2002:
i) Segmental reporting in respect of Public and Product Liability is not disclosed separatelyfor foreign business.
ii) The provisions against the Investment is Rs.7437.56 Lakh (Previous Year Rs.7857.80Lakh), loans is Rs.12382.50 Lakh (Previous Year Rs.12823.18 Lakh) and Sundry Debtorsis Rs.38.51 Lakh (Previous Year Rs.40.51 Lakh) have been shown in Schedule 14“Provisions”. Consequently, the “Investment”, “Loans” and “Advance & Other Assets”shown in the Schedules 8, 9 and 12 respectively have not been reduced to the extentof provisions made against thereof, as required by Part V of Schedule B of the Regulation.
iii) Receipts & Payments Account/(Cash Flow Statement) has been drawn by “IndirectMethod” instead of “Direct Method” as required by Part I of Schedule B of the regulation.
Sr. No. Particulars Current Year Previous Year(Rs in Lakh) (Rs in Lakh)
(i) Opening Balance 21560.36 21534.19
(ii) Additions During the Year 23.55 2565.30
(iii) Reductions During the Year 1091.40 2539.13
(iv) Closing Balance 20492.51 21560.36
Percentage of Net NPAs to Net Assets 1.73% 2.00%
NO
NO
NO
NO
NO
TE
ST
ES
TE
ST
ES
TE
S

fn U;w bafM;k ,';ksjUl da- fy-THE NEW INDIA ASSURANCE CO. LTD.
94
Estbd. 1919
9 Investment in term loans, loans to State Government for the purpose of Housing & Fire fighting equipments,investments in Pass Through Certificates (PTC) and balances on account of restructuring/rescheduling ofdebts are subject to confirmations and reconciliations. The impact of adjustments if any, arising out ofconfirmations / reconciliations of such balances on financial statements are unascertainable.
10 Prior period items have been included in the respective heads amounting to Rs.30018.52 Lakhs (Debit)(Previous Year Rs. 1581.66 Lakhs (Debit) consisting of the following: -
Sr. No. Particulars Rs in Lakhs
Current Year Previous Year
Debit Amount Credit Amount Debit Amount Credit Amount
1 Premium 534.00 3.21 573.53 32.94
2 Commission 1.32 168.08 0.39 -
3 Claims 22,806.88 4,108.14 0.94 -
4 Expenses 14,264.80 3,309.07 1,040.65 0.90
Total 37607.01 7,588.49 1,615.51 33.84
11 Disclosure as required by Accounting Standards (AS) issued by the Institute of Chartered Accountants ofIndia (ICAI): -
A Related party disclosures as per Accounting Standard 18
1 Company’s related parties
a Subsidiaries
i) The New India Assurance Co. (T & T) Ltd. – Port of Spain, Trinidad & Tobago
ii) The New India Assurance Co. (S.L.) Ltd. – Free Town, Sierra Leone
iii) Prestige Assurance Plc. – Nigeria
b Associates
i) India International Insurance Pvt. Ltd., Singapore
ii) Kenindia Assurance Co. Ltd., Kenya
iii) United Insurance Co. Ltd., Jordan
iv) Saudi Indian Company for Co Operative Insurance, Riyadh
c Entities over which control exist
i) The New India Assurance Company (Employees) Pension Fund
ii) The New India Assurance Company Limited Employee Gratuity Fund
iii) The New India Assurance Company Limited Staff Provident Fund
d Key management personnel of the Company
i) Mr. M Ramadoss
ii) Mr. B. Chakrabarti till 30.09.2009
iii) Mr. N. S. R. Chandra Prasad till 01.06.2009
iv) Mr. A. R. Sekar
v) Mr. I S Phukela
NO
NO
NO
NO
NO
TE
ST
ES
TE
ST
ES
TE
S

okf"kZd fjiksVZANNUAL REPORT 2009-10
95
2 Transactions with related parties:
Sr. No. Nature of Nature of Transaction Current Year Previous YearRelationship (Rs. in Lakh) (Rs. in Lakh)
i) Subsidiaries Management fees earned 34.43 30.84
Premium on Reinsurance Accepted 393.91 138.99
Commission on Reinsurance Accepted (79.41) (26.12)
Claims Paid (76.89) (111.10)
Dividend income received 703.75 764.70
Other Amount Due (From Prestige - -Assurance PLC-out of RightsSubscription)
ii) Associates Premium on Reinsurance Accepted 342.46 58.37
Commission on Reinsurance Accepted (118.92) (0.86)
Claims Paid (473.92) 0.59
Dividend income received 132.63 96.85
Investment in shares - 30.34
Dividend receivable 0.05 0.04
iii) Entity over which Sale of investment Other - -control exits amount payable
iv) Key management Salary and allowances 39.85 35.02personnel
B Disclosure as per Accounting Standard 20-“Earnings Per Share”:
Particulars Current Year Previous Year(Rs in Lakh) (Rs in Lakh)
Net profit attributable to shareholders (Rs. In Lakh) 40,467.21 22,414.53
Weighted average number of equity shares issued 200,000,000 200,000,000
Basic and diluted earnings per share of Rs.10/- each 20.23 11.21
The company does not have any outstanding diluted potential equity share. Consequently, the basic anddiluted earnings per share of the company remain the same.
C Taxation
Income Tax
I Income Tax provision has been made as per Section 115JB of Income Tax Act, 1961. Further,disalloawnce in respect of exempt income under section 14A of Income Tax Act, 1961 is notconsidered while calculating provision for tax under Section 115JB of Income Tax Act, 1961, asthe Company has contested issues before appellate authorities.
II The Income Tax Assessments of the Company have been completed up to assessment year2007-08. Major disputed demands are in respect of capital gain taxes, disallowance under Section40(a) and in respect of Section 14A of the Income Tax Act, 1961. Based on the decisions of the
NO
NO
NO
NO
NO
TE
ST
ES
TE
ST
ES
TE
S

fn U;w bafM;k ,';ksjUl da- fy-THE NEW INDIA ASSURANCE CO. LTD.
96
Estbd. 1919
appellate authority and the interpretations of the relevant provisions, the Company has beenlegally advised that the demands are likely to be either deleted or substantially reduced andaccordingly no provisions have been made for the same.
Deferred Taxes
The major components of temporary differences resulting into deferred tax assets are as under
Particulars Current Year Previous Year(Rs in Lakh) (Rs in Lakh)
i) Depreciation and Fixed Assets (355.36) 943.07
ii) Leave Encashment 9,779.26 1,353.48
iii) Estimated Disallowance u/s 40(a) (ia) 33.99 33.99
Total 9,457.89 2,330.54
Notes
1 A sum of Rs.7127.35 lakh (Previous year Rs 1,314.91 Lakh) has been credited to the Profit& Loss Account on account of increase in deferred assets during the year.
2 On prudence basis recognition of deferred tax asset on unabsorbed depreciation and carryforward losses has not been given effect in the books of account.
3 Above deferred tax asset does not include impact of deferred tax in respect of operations offoreign branches.
D Accounting Standard 15 – Employee Benefits
The details of employee benefits for the year on account of gratuity, superannuation whichare funded defined employee benefit plans and leave encashment which is an unfunded definedbenefit plan are as under.
(Rs. in Lakh)
I Components of employer expense Pension Gratuity Leave Encashment
C.Y. P.Y. C.Y. P.Y. C.Y. P.Y.Funded Unfunded
A Current Service Cost 7,229 6,208 2,067 1,381 1,054 961
B Interest Cost 14,224 13,859 2,786 2,581 1,766 1,616
C Expected Return on Plan Assets (13,682) (13,464) (2,547) (2,769) -
D Curtailment Cost/(Credit) - - - - - -
E Settlement Cost/(Credit) - - - - - -
F Past Service Cost - - - - - -
G Actuarial Losses/(Gains) 6,080 14,456 (2,200) 2,881 4,170 2,584
H Total expense recognized in the 13,851 21,059 106 4,074 6,990 5,161statement of Profit and LossAccount
Pension Gratuity and Leave Encashmentexpenses have been recognized in“Employee Remuneration and WelfareBenefits” under schedule 4.
NO
NO
NO
NO
NO
TE
ST
ES
TE
ST
ES
TE
S

okf"kZd fjiksVZANNUAL REPORT 2009-10
97
Pension Gratuity Leave Encashment
C.Y. P.Y. C.Y. P.Y. C.Y. P.Y.Funded Unfunded
II Actual Returns for the year 31.03.2010 15,464 14,303 3,143 3,032 - -
III Net Asset/(Liability) recognized inBalance Sheet at 31.03.2010
A Present Value of Defined Benefit Obligation 205,915 177,603 40,460 34,728 28,771 23,190
B Fair Value of Plan Assets 209,275 176,314 39,939 34,313 - -
C Status (Surplus/Deficit) (3,360) 1,289 521 415 28,771 23,190
D Un recognized Past Service Cost - - - - - -
E Net Asset / (Liability) recognized in (3,360) 1,289 521 415 28,771 23,190Balance Sheet
IV Change in Defined Benefit Obligation during the year ended 31.03.2010
A Past value of the Defined Benefit Obligation 177,603 157,403 34,728 30,362 23,190 19,208at the beginning of the period
B Current Service Cost 7,229 6,208 2,067 1,381 1,054 961
C Interest Cost 14,224 13,859 2,786 2,581 1,766 1,616
D Curtailment Cost/(Credit) - - - - - -
E Settlement Cost/(Credit) - - - - - -
F Plan Amendments - - - - - -
G Acquisitions - - - - - -
H Actuarial Losses/(Gains) 18,092 8,895 1,593 1,300 4,170 2,584
I Asset Loss / (Gain) - - - - - -
J Benefits Paid (11,233) (8,762) (714) (896) (1,409) (1,179)
K Present Value of Defined Benefit Obligation 205,915 177,603 40,460 34,728 28,771 23,190at the end of the period
V Change in the Fair Value of Assetsduring the year ended 31.03.2010
A Plan Assets at the beginning of the period 176,314 153,146 34,313 34,021 - -
B Acquisition Adjustment - - - - - -
C Expected return on Plan Assets 13,682 13,464 2,547 2,769 - -
D Asset (Losses)/Gains 9,632 (5,561) 3,793 (1,581) - -
E Actual Company Contributions 20,880 24,027 - - - -
F Benefits Paid (11,233) (8,762) (714) (896) - -
G Plan Assets at the end of the period 209,275 176,314 39,939 34,313 - -
NO
NO
NO
NO
NO
TE
ST
ES
TE
ST
ES
TE
S

fn U;w bafM;k ,';ksjUl da- fy-THE NEW INDIA ASSURANCE CO. LTD.
98
Estbd. 1919
VI Actuarial Assumptions - -
A Discount Rate (%) 7.50% 7.50% 7.50% 7.50% - -
B Expected Return on Plan Assets (%) 8.25% 8.25% 8.25% 8.25% - -
C Rate of escalation in salary 6.75% 6.75% 6.75% 6.75% - -
VII Major Category of Plan Assets as % of the Total Plan Assets as at 31.03.2010- -
A Government Securities 40.00% 40.00% 40.00% 40.00% - -
B High Quality Corporate Bonds 57.00% 57.00% 57.00% 57.00% - -
C Others 3.00% 3.00% 3.00% 3.00% - -
VIII Basis used to determine the expected The expected rate of return on plan assets is based on therate of return on plan assets current portfolio of the assets, investment strategy and
the market scenario, in order to protect capital andoptimize returns within acceptable risk parameters, theplan assets are well diversified.
Pension Gratuity Leave Encashment
C.Y. P.Y. C.Y. P.Y. C.Y. P.Y.Funded Unfunded
12. During the year, the Company has reviewed its fixed assets for impairment of loss as required by AccountingStandard 28 on impairment of assets. In the opinion of the management no provision for impairment loss isconsidered necessary.
13. Pre-payment premium received in present value terms on account of restructuring/reduction of interestrates in respect of loans/debentures is spread over the remaining tenure of such loans/debentures.Accordingly Rs.170.24 Lakh (P.Y Rs.268.08 Lakh) has been considered as income received in advanceand shown in Schedule – 13 Current Liabilities under the head “Others”.
14. The management is currently in the process of identifying enterprises which have been provided goodsand services to the Company which qualify under the definition of medium and small enterprises asdefined under Micro, Small and Medium Enterprises Development Act, 2006. Accordingly, the disclosurein respect of the amount payable to such Micro, Small, and Medium Enterprises as at 31st March 2010has not been made in the financial statements. However, in view of the management, the impact ofinterest, if any, that may be payable in accordance with the provisions of the Act is not expected to bematerial.
15. Indian Motor Third Party Insurance Pool (IMTPIP)In accordance with the directions of IRDA, the company,together with other insurance companies, participates in the Indian Motor Third Party Insurance Pool(IMTPIP). The IMTPIP is a multilateral reinsurance arrangement, in which all member companies arecompulsorily required to participate. The IMTPIP is administered by the General Insurance CorporationOf India (‘GIC’). The IMTPIP covers reinsurance of third party risks of specified motor vehicles (“specifiedrisks”). Amounts collected as premium in respect of specified risks are ceded at 100% of such premium,100% of claims incurred against specified risks ceded being recoverable from the pool.
In accordance with the terms of the agreement, each participant Company, is compulsorily required toshare in the revenues, expenses, assets and liabilities of the IMTPIP, including unexpired risks reserve, inthe proportion, that the Company’s Gross Direct Premium Written in India (GDPI), bears to the total GrossDirect Premium Written in India of all participant companies. The Company’s share as specified above, is
NO
NO
NO
NO
NO
TE
ST
ES
TE
ST
ES
TE
S

okf"kZd fjiksVZANNUAL REPORT 2009-10
99
recorded based on the returns submitted by GIC, under the respective heads. Accordingly, such share hasbeen recorded by the Company, only up to 28th February 2010, the date up to which the return is submittedby GIC.
16. During the current year the company has reclassified the TPA Assistance Fees as a Claim ManagementExpenses and has been considered as Claims Expenses. Obligatory recovery towrads the claimmanagement fees amounting to Rs 4100 lakh pertaining to the earlier years has been accounted asrecovery from the General Insurance Corporation, hence included in prior period income. Further theseparate disclosure requirement as per IRDA circular dated 28.03.2008 in respect of outsourcingexpenses has not been complied.
17. During the previous year the Company has created the Reserve for Unexpired Risk as at the end of theaccounting period based on the 1/365 method in the Health segment as per IRDA circular No.IRDA/F&I/CIR/F&A/CIR/081/12/2009 dated December 17, 2009. Accordingly contingency reserve amountingto Rs 4495 lakh has been created. The said contingency reserve is not available for distribution toShareholders and its utilisation, at any future date would require prior approval of the Authority.
18. Foreign Exchange Reserve Account has decreased by Rs.19720.24 (Debit) Lakh due to depreciation offoreign currency under the following heads (Previous Year Rs.17785.08 Lakh (Credit) consisting of thefollowing.
(Rs. In Lakh)
Sr. No. Particulars Current Year Previous Year
Debit Amount Credit Amount Debit Amount Credit Amount
1 Head Office Account 15,020.01 - - 14,629.27
2 Outstanding claims 4,686.84 - - 3,149.56
3 Fixed assets and 10.33 - - 6.25depreciation
Total 19,717.18 - - 17,785.08
19. Previous year figures have been regrouped wherever required to make the figures comparable with currentyears figures.
Previous year 2008-09 2008-09 Regrouped in Current year
Line Items Schedule Old Grouping Schedule New AmountGrouping Rs. (000)
TPA Assistance Sch 4 Legal and Sch 2 Claims Paid 697502Fees Professional (Direct)
Charges
Provisions for Sch 13 Sundry Creditors - Sch 14 Provisions -wage arrears and Other than Serviceleave encashment Tax Payable Others 3544000
20. As per IRDA Circular No 005/IRDA/F&A/CIR/MAY-09 dated May 07, 2009, below table mentions the detailsof the penalty imposed by various regulators and Government authorities:
NO
NO
NO
NO
NO
TE
ST
ES
TE
ST
ES
TE
S

fn U;w bafM;k ,';ksjUl da- fy-THE NEW INDIA ASSURANCE CO. LTD.
100
Estbd. 1919
Sr. Authority Non-Compliance/ Amount in Rs. (000)No. Violation
1 Insurance Regulatory Violation of the File 1000 1000 -and Development and Use GuidelinesAuthority
2 Service Tax Authorities Non Payment of 3347 3347 -Service Tax onTransfer andDuplication Fees
3 Income Tax Authorities Nil - - -
4 Any other Tax Nil - - -Authorities
5 Enforcement Directorate/ Nil - - -Adjudicating Authority/Tribunal or any Authorityunder FEMA
6 Registrar of Companies/ Nil - - -NCLT/CLB/ Departmentof Corporate Affairs orany Authority underCompanies Act, 1956
7 Penalty awarded by any Nil - - -Court/ Tribunal for anymatter including claimsettlement but excludingcompensation
8 Competition Commission Nil - - -of India
9 Any other Central/State/ Nil - - -Local Government /Statutory Authority
PenaltyAwarded
PenaltyPaid
Penalty Waived/Reduced
21. The Company's Office Premises and Residential flats for employees are obtained on operating lease andare renewable / cancellable at mutual consent. There are no restrictions imposed by lease agreements.Lease terms are based on individual agreements.significant leasing arrangements arein respect of operating lease for premises. Aggregate lease rentals amounting to Rs.5325.36(PY Rs.5015.05) in respect of obligation under operating lease are charged to Revenue Account.
NO
NO
NO
NO
NO
TE
ST
ES
TE
ST
ES
TE
S

okf"kZd fjiksVZANNUAL REPORT 2009-10
101
16 C. Disclosures Forming Part of Financial Statements
(Rs in Lakh)
Sr. No. Particulars Current Year Previous Year
1 The details of contingent liabilities are as under:(a) Partly-paid up investments 20.62 20.62(b) Underwriting commitments outstanding - -(c) Claims, other than those under policies, not 21,388.30 20,898.30
acknowledged as debts(d) Guarantees given by or on behalf of the Company 1,106.77 1,242.38(e) Statutory demands/liabilities in dispute not provided for 127,478.00 53,396.69(f) Reinsurance obligations to the extent not provided for - -
in accounts(g) Others (matters under litigation) to the extent quantifiable 470.27 551.82
2 The details of encumbrances to the assets of the Companyare as under:(a) In India 2,525.62 2,525.62(b) Outside India 1,277.32 2,218.15
3 Commitment made and outstanding for Loans Investments 11,410.60 10,765.24and Fixed Assets
4 Claims, less reinsurance, paid to claimants:(a) In India 318,965.02 338,131.04(b) Outside India 44,683.95 61,198.30
5 Claim liabilities where claim payment period exceeds four years. - -6 Amount of claims outstanding for more than six months 539,790.09 548,975.47
(Gross Indian)No. of Claims 318,212 272,289Amount of claims outstanding for less than six months(Gross Indian) 201,721.08 162,005.28No. of Claims 154,873 105,042Total amount of claims outstanding (Gross Indian) 741,511.17 710,980.76Total No. of claims outstanding 473,085 377,331
7 Premiums, less reinsurances, written from businessa) In India 468,707.06 426,052.39b) Outside India 131,558.90 123,978.17
8 The details of contracts in relation to investments, fora) Purchases where deliveries are pending 443.92 -b) Sales where payments are overdue 3,892.72 -
9 Amount of Claims settled and remaining unpaid for a period of - -more than six months as on balance sheet date are as under:No. of claims - -
10 Investments made in accordance with statutory requirementsare as under:
(a) In India- Under Sec.7 of Insurance Act 1938 1,075.18 1,075.20(b) Outside India- Statutory Deposits under local laws 21,095.71 23,121.48
DIS
CL
OS
UR
ES
DIS
CL
OS
UR
ES
DIS
CL
OS
UR
ES
DIS
CL
OS
UR
ES
DIS
CL
OS
UR
ES

fn U;w bafM;k ,';ksjUl da- fy-THE NEW INDIA ASSURANCE CO. LTD.
102
Estbd. 1919
DIS
CL
OS
UR
ES
DIS
CL
OS
UR
ES
DIS
CL
OS
UR
ES
DIS
CL
OS
UR
ES
DIS
CL
OS
UR
ES
(Rs in Lakh)
Sr. No. Particulars Current Year Previous Year
11 Segregation of investments into performing and non-performing investments where NPA Provision is requiredas per IRDA Guidelines is as under:Performing (Standard) Investments 383,016.50 356,602.27
Non Performing Investments 20,492.51 21,560.35
Total Book Value (Closing Value) 403,509.01 378,162.62
12 All significant accounting policies forming part of the financial statements are disclosed separately.
13 Premium is recognized as income on assumption of the risk. A reserve for unexpired risks is created @100% of net premium for marine business and @ 50% of net premium for other classes of business.
14 Operating expenses relating to insurance business are apportioned to the revenue account on the basis ofgross direct premium plus reinsurance accepted giving weightage of 75% for marine business and 100%each for fire and miscellaneous business.
15 The historical/weighted average cost of investments in equity shares / venture funds, is Rs.237437.53 lakh(Previous year Rs.229520.12 Lakh) and Rs.1119.55 Lakh (Previous year Rs.1231.41 Lakh) respectively.However, the historical/weighted average cost in respect of investment in listed equity/equity relatedinstruments/preference shares, the value of which had impaired on or before 31st March, 2000 is notavailable with the Company, and hence, the carrying value of the same as on 01.04.2000 is presumed to bethe historical/weighted average cost.
16 Computation of managerial remuneration: Being a Government owned Company, the Company is exemptedvide notification: GSR 235, dated 31st January 1978 u/s 620 of the Companies Act, 1956.
17 Amortisation of debt securities is done from the date of investment on the basis of actual number of daysupto the date of Sale/ Redemption/ 31st March, 2010 While working out amortisation put/call option is notconsidered. However, partial redemption if any, is taken into account.
18 a) Unrealised gains / losses arising due to change in the Fair Value of listed equity shares and equityrelated instruments have been taken to “Fair Value Change Account” and on realisation will be transferredto profit and loss account.
b) Pending realisation, the credit balance in the “Fair Value Change Account” is not available for distribution.
19 The Company does not have Real Estate Investment Property.
20 Sector-wise break-up of gross direct premium written in India (Details of number of policies sector wiseissued not available) is as under:
Sector Current Year Previous Year
(Rs. in Percentage Number of (Rs. in Percentage Number ofCrores) Policies/Live Crores) Policies/Live
Rural 380.07 6.29 1429540 394.32 7.16 1065132
Social 200.16 3.31 9548803 230.68 4.19 32389489
Others 5462.28 90.40 - 4,883.83 88.65 -
Total 6,042.51 100.00 - 5,508.83 100.00 -

okf"kZd fjiksVZANNUAL REPORT 2009-10
103
21 Performance Ratios (Rs in Crore)
i) Gross Premium Growth rates
(Rs. in Crore)
SEGMENT Current Previous Current PreviousYear Year Year (%) Year (%)
Fire 1211.92 998.38 21.39 1.73
Marine Cargo 234.57 231.30 1.41 1.60
Marine Hull 290.10 280.28 3.50 4.91
Marine Total 524.67 511.58 2.56 3.39
Motor 2549.61 2425.36 5.12 2.60
Personal Accident 119.67 111.35 7.47 14.17
Aviation 64.40 78.20 -17.65 0.09
Engineering 332.44 291.00 14.24 12.62
Health 1567.23 1355.67 15.61 12.09
Liability* 195.94 194.45 0.77 -10.67
Others 533.26 489.79 8.88 8.76
Misc sub Total 5362.55 4945.82 8.43 5.79
Grand Total 7099.14 6455.78 9.97 4.95
*Liability includes Workmens’ compensation
ii) Gross Premium to Share Holders Funds Ratio(Rs. in Crore)
Particulars Current PreviousYear Year
Gross Premium 7099.14 6455.78
Share Holders Funds(beginning of the year) 7322.15 6972.80
Ratio (Times) 0.97 0.93
iii) Growth Rate of Shareholders Funds
(Rs. in Crore)
Current Previous Growth Growth GrowthYear Year Amount % CY % PY
Share Holders 7430.21 7322.15 108.06 1.48 5.09Funds
DIS
CL
OS
UR
ES
DIS
CL
OS
UR
ES
DIS
CL
OS
UR
ES
DIS
CL
OS
UR
ES
DIS
CL
OS
UR
ES

fn U;w bafM;k ,';ksjUl da- fy-THE NEW INDIA ASSURANCE CO. LTD.
104
Estbd. 1919
iv) Net Retention Ratios
(Rs. in Crore)
Segment Premium Premium Retention PreviousGross Year Ratio CY (%) Ratio PY (%)
Fire 1211.92 1097.02 90.52 103.98
Marine Cargo 234.57 184.30 78.57 78.94
Marine Hull 290.10 44.69 15.41 19.65
Marine Total 524.67 228.99 43.64 46.46
Motor 2549.61 2236.49 87.72 86.98
Personal Accident 119.67 97.25 81.27 83.01
Aviation 64.40 86.46 134.25 32.98
Engineering 332.44 237.01 71.29 69.62
Health 1567.23 1407.79 89.83 90.00
Liability* 195.94 140.07 71.49 85.89
Others 533.26 471.58 88.43 83.11
Misc Sub Total 5362.55 4676.65 87.21 85.42
Grand Total 7099.14 6002.66 84.55 85.20
*Liability includes Workmens’ compensation
v) Net Commission Ratio
(Rs. in Crore)
Segment Commission Commission Commission CommissionNet Net Ratio CY (%) Ratio PY (%)
Fire 128.27 1097.02 11.69 13.20
Marine Cargo 28.13 184.30 15.26 17.25
Marine Hull -9.06 44.69 -20.27 -30.78
Marine Total 19.07 228.99 8.33 6.12
Motor 171.02 2236.49 7.65 7.94
Personal Accident 12.83 97.25 13.19 12.41
Aviation 11.43 86.46 13.22 3.30
Engineering -6.98 237.01 -2.95 1.29
Health 134.36 1407.79 9.54 10.63
Liability* 23.19 140.07 16.56 17.59
Others 68.18 471.58 14.46 16.64
Misc Sub Total 414.03 4676.65 8.85 9.69
Grand Total 561.37 6002.66 9.35 10.20
*Liability includes Workmens’ compensation
DIS
CL
OS
UR
ES
DIS
CL
OS
UR
ES
DIS
CL
OS
UR
ES
DIS
CL
OS
UR
ES
DIS
CL
OS
UR
ES

okf"kZd fjiksVZANNUAL REPORT 2009-10
105
vi) Expenses of Management to Gross Premium Ratio(Rs. in Crore)
Particulars 2009-10 2008-09
Expenses 1736.06 1455.01
Gross Premium 7099.14 6455.78
Ratio (%) 24.45 22.54
vii) Combined RatioParticulars 2009-10 2008-09
Claims 5132.45 4671.87
Expenses 1736.06 1455.01
Commission 561.37 560.83
Sub Total 7429.88 6687.71
Net Premium 6002.66 5500.31
Ratio (%) 123.78 121.59
viii) Technical Reserves (at End) to Net Premium Ratio
Particulars 2009-10 2008-09
Unexpired Risks Reserves 3115.83 2824.03
Reserves for Premium Deficiency 0.00 0.00
Outstanding Claims 7526.18 6818.45
Total Technical Reserves 10642.01 9642.48
Net Premium 6002.66 5500.31
Ratio – (No. of Times) 1.77 1.75
ix) Underwriting Balance Ratios (after credit of policy holders Investment income)
Segment U/W Profit Net Ratio Ratio
Net Premium Current Previous Year (%) Year (%)
Fire -305.72 1097.02 -27.87 5.74
Marine Cargo 30.95 184.30 16.79 8.72
Marine Hull -19.06 44.69 -42.65 -192.50
Marine Total 11.89 228.99 5.19 -37.91
Motor 96.98 2236.49 4.34 -10.46
Personal Accident 27.54 97.25 28.32 -21.45
Aviation 11.81 86.46 13.66 -91.00
Engineering 32.63 237.01 13.77 -0.87
Health -531.97 1407.79 -37.79 -33.31
Liability* -4.46 140.07 -3.18 37.84
Others 157.72 471.58 33.45 33.58
Misc Sub Total -209.75 4676.65 -4.49 -11.18
Grand Total -503.58 6002.66 -8.39 -9.14
*Liability includes Workmens’ compensation
DIS
CL
OS
UR
ES
DIS
CL
OS
UR
ES
DIS
CL
OS
UR
ES
DIS
CL
OS
UR
ES
DIS
CL
OS
UR
ES

fn U;w bafM;k ,';ksjUl da- fy-THE NEW INDIA ASSURANCE CO. LTD.
106
Estbd. 1919
x) Operating Profit Ratio(Rs. in Crore)
Particulars 2009-10 2008-09
Underwriting Result -503.58 -1439.84
Investment Income 923.52 1686.82
Others -60.66 50.24
Sub Total 359.28 297.22
Net Premium 6002.66 5500.31
Ratio (%) 5.99 5.40
xi) Liquid Assets to Liabilities Ratio
Particulars 2009-10 2008-09
Liquid Assets 9813.61 8387.85
Policy holders Liabilities 10642.01 9642.48
Ratio (%) 92.22 86.99
xii) Net Earnings Ratio
Particulars 2009-10 2008-09
Profit After Tax 404.67 224.15
Net Premium 6002.66 5500.31
Ratio (%) 6.74 4.08
xiii) Return on Net Worth
Particulars 2009-10 2008-09
Profit After Tax 404.67 224.15
Net Worth 7430.21 7328.00
Ratio (%) 5.45 3.06
xiv) Reinsurance Ratio
Particulars 2009-10 2008-09
Risks Reinsured (Premium) 2342.63 2113.61Gross Premium 7099.14 6455.78Ratio (%) 33.00 32.74
22. Summary of Financial Statements for Last Five Years
(Rs. In Crore)
Sr. Operating Results 2009-10 2008-09 2007-08 2006-07 2005-06No.
1 Gross Premium Written 7099.14 6455.78 6151.46 5936.78 5675.54
2 Net Premium Income# 6002.66 5500.31 4914.28 4751.77 4342.65
3 Income from Investments (Net) @ 2139.69 1686.82 2344.62 2251.35 2010.79
4 Other Income -60.66 50.24 21.23 15.85 44.10
5 Total Income 8081.69 7237.37 7280.13 7018.97 6397.54
DIS
CL
OS
UR
ES
DIS
CL
OS
UR
ES
DIS
CL
OS
UR
ES
DIS
CL
OS
UR
ES
DIS
CL
OS
UR
ES

okf"kZd fjiksVZANNUAL REPORT 2009-10
107
Sr. Operating Results 2009-10 2008-09 2007-08 2006-07 2005-06No.
6 Commissions/Brokerage 561.37 560.82 459.23 390.89 376.28
7 Brokerage - - - - -(included in commissions)
8 Operating Expenses 1736.06 1455.01 1019.10 1153.89 1306.89
9 Claims, Increase in Unexpired Risk 5424.97 4924.32 4280.32 3860.27 3858.80Reseraves and Other Out-Go
10 Operating Profit/Loss 359.29 297.22 1521.48 1613.92 855.57
11 Total Income under - - - - -Shareholders a/c
12 Profit/(Losss)before Tax 359.29 297.22 1521.48 1613.92 855.57
13 Provision for Tax -45.40 73.08 120.33 153.98 139.19
14 Net Profit/(Loss) after Tax 404.69 224.14 1401.15 1459.94 716.38Miscellaneous
15 Policy Holders' Account (Beginning)
Total Funds 9642.48 8712.89 8229.39 7758.91 6876.43
Total Investments * * * * *
Yield on Investments * * * * *
16 Shareholders' Account (Beginning)
Total Funds 7322.15 6972.80 5972.55 4706.87 4161.69
Total Investments 11851.03 10771.71 11236.00 11009.61 9397.55
Yield on Investments * * * * *
17 Paid up equity capital 200.00 200.00 200.00 200.00 200.00
18 Net Worth 7430.21 7328.00 6972.80 5972.55 4706.87
19 Total Assets 36832.91 26931.58 31944.14 27444.57 27025.58
20 Yield on Total Investments( %) 15.91 13.18 19.54 20.74 21.11
21 Earning per Share (Rs) 20.23 11.21 70.06 73.00 35.82
22 Book value per Share(Rs) 371.51 366.40 348.64 298.63 235.34
23 Total Dividend 85.00 45.00 283.00 292.00 130.00
24 Dividend per Share (Rs) 4.25 2.25 14.15 14.60 6.50
# Net of Re-insurance
@ Net of losses
* Points 15 & 16 may be given separately, if feasible
DIS
CL
OS
UR
ES
DIS
CL
OS
UR
ES
DIS
CL
OS
UR
ES
DIS
CL
OS
UR
ES
DIS
CL
OS
UR
ES

fn U;w bafM;k ,';ksjUl da- fy-THE NEW INDIA ASSURANCE CO. LTD.
108
Estbd. 1919
23. Age wise analysis of outstanding claims as on 31.03.2010(Gross Indian excluding provision for IBNR)
Department Less than 3 months 3 – 6 months 6 months – 1 year
No. Amount No. Amount No. Amount(In Lakh) (In Lakh) (In Lakh)
Fire 983 23,528.91 781 32,888.51 940 19,350.79
Marine Cargo 2,007 3,870.58 1,290 1,929.96 1,307 3,653.58Marine Hull 60 3,585.37 17 21,747.31 76 2,507.28Motor OD 12,604 7,540.34 16,563 7,730.27 10,693 5,597.30Motor TP 11,885 14,603.99 10,975 16,902.40 21,522 30,743.99Health 51,356 15,248.70 8,240 1,446.15 7,838 1,372.38Liability 398 593.50 226 3,390.07 370 961.85Motor TP Pool 5,288 9,604.96 5,915 14,510.81 10,303 18,559.20Personal Accident 2,530 3,685.90 1,200 508.24 1,053 1,143.04Aviation 17 644.60 62 2,943.95 6 287.12Engineering 1,890 5,631.92 929 2,562.51 1,039 2,791.24Credit Guarantee 1 2.06 - - - -Misc - Traditional 1,575 1,664.24 763 2,620.35 1,132 2,081.19Rural 6,286 441.60 3,945 537.08 4,491 697.71Urban Non-Traditional 4,365 810.81 2,722 545.99 2,735 613.74Credit Shield - - - - 5 1,483.17
Total 101,245 91,457.48 53,628 110,263.60 63,510 91,843.58
Department 1 – 2 years 2 – 3 years 3 – 5 years
No. Amount No. Amount No. Amount(In Lakh) (In Lakh) (In Lakh)
Fire 435 20,591.06 273 4,816.09 209 3,391.17Marine Cargo 788 3,715.02 433 1,129.70 205 373.99Marine Hull 47 10,696.17 57 2,993.50 32 1,570.72Motor OD 2,521 2,271.29 1,834 1,844.59 558 756.69Motor TP 40,555 57,444.64 32,769 50,515.15 79,190 118,368.59Health 4,434 1,286.21 1,862 190.68 373 105.81Liability 330 3,903.63 191 3,624.18 379 473.64Motor TP Pool 10,508 21,046.95 3,379 6,910.65 2,422 3,324.46Personal Accident 528 277.56 228 139.98 91 57.11Aviation 3 29.79 25 1,651.84 14 747.80Engineering 396 2,209.22 300 3,345.05 86 206.74Credit Guarantee 9 36.85 - - - -Misc - Traditional 868 2,749.06 715 2,221.95 371 893.89Rural 3,726 999.30 3,211 574.66 3,887 1,008.66Urban Non-Traditional 1,921 491.36 1,597 336.18 1,125 183.48Credit Shield 3 70.96 5 24.67 27 3,494.29
Total 67,072 127,819.07 46,879 80,318.87 88,969 134,957.04
DIS
CL
OS
UR
ES
DIS
CL
OS
UR
ES
DIS
CL
OS
UR
ES
DIS
CL
OS
UR
ES
DIS
CL
OS
UR
ES

okf"kZd fjiksVZANNUAL REPORT 2009-10
109
24. Interest, Dividends and Rent is apportioned between Revenue Accounts and Profit and Loss account inproportion to the balance in shareholders funds and policyholders’ funds at the beginning of the year.The same is further apportioned to fire, marine and miscellaneous Revenue Accounts in proportion tothe technical reserve balance at the beginning of the year.
25. The details of premium deficiecy as required by IRDA circular no. F&A/CIR/017/May-04 dated 18.05.2004are furnished below. (in Lakh)
Department 5 years and above Total
No. Amount No. Amount(In Lakh) (In Lakh)
Fire 232 34,509.19 3,853 139,075.72Marine Cargo 291 5,128.19 6,321 19,801.02Marine Hull 68 3,843.54 357 46,943.89Motor OD 166 272.44 44,939 26,012.92Motor TP 33,443 46,711.82 230,339 335,290.58Health 312 148.46 74,415 19,798.39Liability 235 310.06 2,129 13,256.93Motor TP Pool 1,716 3,361.48 39,531 77,318.51Personal Accident 111 340.51 5,741 6,152.34Aviation 11 31.15 138 6,336.25Engineering 138 2,367.99 4,778 19,114.67Credit Guarantee 9 100.46 19 139.37Misc - Traditional 500 4,841.31 5,924 17,071.99Rural 10,236 2,576.83 35,782 6,835.84Urban Non-Traditional 4,313 305.45 18,778 3,287.01Credit Shield 1 2.65 41 5,075.74
Total 51,782 104,851.53 473,085 741,511.17
Segment Relevant Expected claim cost and Expected Surplus DeficiencyPremium related expenses (based Maintenace provision in
on incurred claim ratio of cost Uneranedpreceding 3 years) Premium
Motor 111,824.71 (111,068.52) (11,298.18) - (10,541.99)
Health 70,389.62 (74,065.85) (5,770.82) - (9,447.05)
Marine Hull 4,469.47 (8,873.56) (1,695.84) 2,279.43 (3,820.50)
A. R. Sekar I. S. Phukela M. RamadossDirector and Company Secretary Director Chairman-cum-Managing Director
As per our Report of even date
For CHATURVEDI & SHAH For KARNAVAT & CO. For FORD, RHODES, PARKS & CO.Chartered Accountants Chartered Accountants Chartered Accountants
Vitesh D. Gandhi Sameer B. Doshi Shrikant B. PrabhuPartner Partner Partner
Membership No.110248 Membership No.117987 Membership No.35296
Place : MumbaiDate : June 29, 2010
DIS
CL
OS
UR
ES
DIS
CL
OS
UR
ES
DIS
CL
OS
UR
ES
DIS
CL
OS
UR
ES
DIS
CL
OS
UR
ES
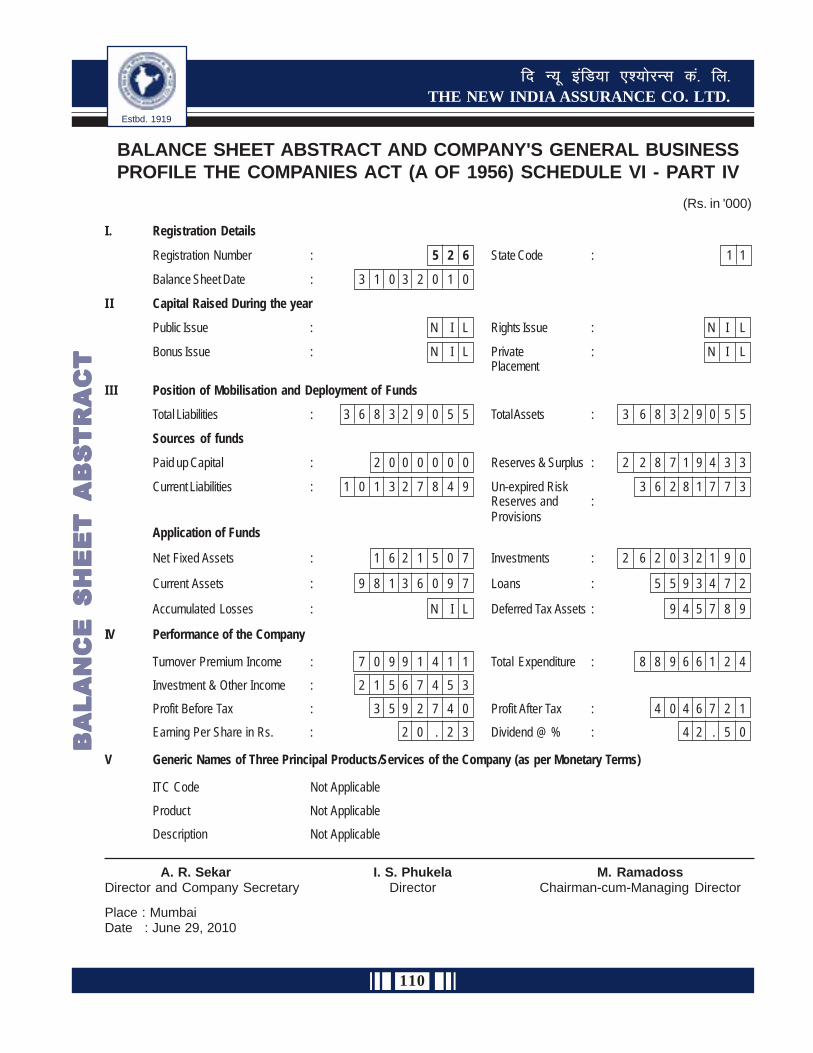
fn U;w bafM;k ,';ksjUl da- fy-THE NEW INDIA ASSURANCE CO. LTD.
110
Estbd. 1919
BALANCE SHEET ABSTRACT AND COMPANY'S GENERAL BUSINESSPROFILE THE COMPANIES ACT (A OF 1956) SCHEDULE VI - PART IV
(Rs. in '000)
I . Registration Details
Registration Number : 5 2 6 State Code : 1 1
Balance Sheet Date : 3 1 0 3 2 0 1 0
I I Capital Raised During the year
Public Issue : N I L Rights Issue : N I L
Bonus Issue : N I L Private : N I LPlacement
I I I Position of Mobilisation and Deployment of Funds
Total Liabilities : 3 6 8 3 2 9 0 5 5 Total Assets : 3 6 8 3 2 9 0 5 5
Sources of funds
Paid up Capital : 2 0 0 0 0 0 0 Reserves & Surplus : 2 2 8 7 1 9 4 3 3
Current Liabilities : 1 0 1 3 2 7 8 4 9 Un-expired Risk 3 6 2 8 1 7 7 3Reserves and :Provisions
Application of Funds
Net Fixed Assets : 1 6 2 1 5 0 7 Investments : 2 6 2 0 3 2 1 9 0
Current Assets : 9 8 1 3 6 0 9 7 Loans : 5 5 9 3 4 7 2
Accumulated Losses : N I L Deferred Tax Assets : 9 4 5 7 8 9
IV Performance of the Company
Turnover Premium Income : 7 0 9 9 1 4 1 1 Total Expenditure : 8 8 9 6 6 1 2 4
Investment & Other Income : 2 1 5 6 7 4 5 3
Profit Before Tax : 3 5 9 2 7 4 0 Profit After Tax : 4 0 4 6 7 2 1
Earning Per Share in Rs. : 2 0 . 2 3 Dividend @ % : 4 2 . 5 0
V Generic Names of Three Principal Products/Services of the Company (as per Monetary Terms)
ITC Code Not Applicable
Product Not Applicable
Description Not Applicable
A. R. Sekar I. S. Phukela M. RamadossDirector and Company Secretary Director Chairman-cum-Managing Director
Place : MumbaiDate : June 29, 2010
BA
LA
NC
E S
HE
ET
A
BS
TR
AC
TB
AL
AN
CE
S
HE
ET
A
BS
TR
AC
TB
AL
AN
CE
S
HE
ET
A
BS
TR
AC
TB
AL
AN
CE
S
HE
ET
A
BS
TR
AC
TB
AL
AN
CE
S
HE
ET
A
BS
TR
AC
T

okf"kZd fjiksV
ZA
NN
UA
L R
EP
OR
T 2009-10
111
STATEMENT OF INTEREST IN THE SUBSIDIARY COMPANIES AS ON 31ST MARCH 2010
UNDER SECTION 212 OF THE COMPANIES ACT, 1956Particulars of Interest The New India Assurance The New India Assurance Prestige Assurance Plc.,in the Subsidiaries Company (Trinidad & Company (Sierra Leone) Limited
Tobago) Limited Limited
a (i) Paid up Capital of the TT$ 17418000 consisting of Le 500000 divided into N 1074992500 consisting ofSubsidiary 17418946 shares of 250000 ordinary shares of 2149985000 shrares of
no par value Le 2.00 each 50 kobos each(ii) New India’s share in 83.90% 100% 51%
the Subsidiaryb (i) Net Aggregate amount C.Y. : TT$ 52927 (thousands) C.Y. : Le 5019 (thousands) C.Y. : N 960795 (thousands)
of the Subsidiary's P.Y. : TT$ 40175 (thousands) P.Y. : Le 1576 (thousands) P.Y. : N 972403 (thousands)profits after deductinglosses or vice versa sofar as it concernsmembers of theCompany and is notdealt with in theCompany's accounts
(ii) Net Aggregate amount C.Y. : Nil C.Y. : Nil C.Y. : Nilof Subsidiary’s profits P.Y. : Nil P.Y. : Nil P.Y. : Nilafter deductinglosses or vice versa orso far as these are dealtwith in the Company’saccounts
c (i) Dividend Proposed by C.Y. : TT$ 1741 (thousands) C.Y. : Nil C.Y. : N 214998 (thousands)the Subsidiary P.Y. : TT$ 1741 (thousands) P.Y. : Nil P.Y. : N 429006 (thousands)
(ii) New India’s Share of C.Y. : TT$ 1461 (thousands) C.Y. : Nil C.Y. : N 109649 (thousands)Dividend (Dividend for P.Y. : TT$ 1461 (thousands) P.Y. : Nil P.Y. : N 219299 (thousands)the current year will beaccounted during2009-10 on receipt)
A. R. SEKAR I. S. PHUKELA M. RAMADOSSDirector & Company Secretary Director Chairman-cum-Managing Director
Mumbai,29th June 2009
INTEREST IN INTEREST IN INTEREST IN INTEREST IN INTEREST IN THE SUBSIDIAR THE SUBSIDIAR THE SUBSIDIAR THE SUBSIDIAR THE SUBSIDIARYYYYY

fn U;w bafM;k ,';ksjUl da- fy-THE NEW INDIA ASSURANCE CO. LTD.
112
Estbd. 1919

okf"kZd fjiksVZANNUAL REPORT 2009-10
113
INDEPENDENT AUDITORS’ REPORT
TO THE SHAREHOLDERS OF THE NEW INDIA ASSURANCE COMPANY(TRINIDAD AND TOBAGO) LIMITED
Report on the Financial Statements
We have audited the financial statements of The New India Assurance Company (Trinidad and Tobago) Limited (theCompany) which comprise the statement of financial position as at December 31, 2009 the statements ofcomprehensive income, changes in equity and cash flows for the year then ended, and a summary of significantaccounting policies and other explanatory notes.
Management’s Responsibility for the Financial Statements
Management is responsible for the preparation and fair presentation of the financial statements in accordancewith International Financial Reporting Standards. This responsibility includes: designing, implementing andmaintaining internal controls relevant to the preparation and fair presentation of financial statements that arefree from material misstatement, whether due to fraud or error; selecting and consistently applying appropriateaccounting policies; and making accounting estimates that are reasonable in the circumstances.
Auditors’ Responsibility
Our responsibility is to express an opinion on the financial statements based on our audit. We conducted ouraudit in accordance with International Standards on Auditing. Those standards require that we comply withethical requirements and plan and perform the audit to obtain reasonable assurance about whether the financialstatements are free from material misstatement.
An audit involves performing procedures to obtain audit evidence about the amounts and disclosures in thefinancial statements. The procedures selected depend on the auditor’s judgment, including the assessmentof the risks of material misstatement of the financial statements, whether due to fraud or error. In makingthose risk assessments, the auditor considers internal controls relevant to the entity’s preparation and fairpresentation of the financial statements in order to design audit procedures that are appropriate in thecircumstances, but not for the purpose of expressing an opinion on the effectiveness of the entity’s internalcontrols. An audit also includes evaluating the appropriateness of accounting policies used and thereasonableness of accounting estimates made by management, as well as evaluating the overall presentationof the financial statements.
We believe that the audit evidence we have obtained is sufficient and appropriate to provide a basis for our auditopinion.
Opinion
In our opinion the financial statements present fairly, in all material respects, the financial position of the Companyas at December 31, 2009 and its financial performance, changes in equity and cash flows for the year thenended in accordance with International Financial Reporting Standards.
Chartered AccountantsTrinidad and Tobago, W.I.
SU
BS
ID
IA
RIE
SS
UB
SID
IA
RIE
SS
UB
SID
IA
RIE
SS
UB
SID
IA
RIE
SS
UB
SID
IA
RIE
S

fn U;w bafM;k ,';ksjUl da- fy-THE NEW INDIA ASSURANCE CO. LTD.
114
Estbd. 1919
SU
BS
ID
IA
RIE
SS
UB
SID
IA
RIE
SS
UB
SID
IA
RIE
SS
UB
SID
IA
RIE
SS
UB
SID
IA
RIE
S
THE NEW INDIA ASSURANCE COMPANY (TRINIDAD AND TOBAGO) LIMITED
STATEMENT OF FINANCIAL POSITION - DECEMBER 31, 2009(Expressed in thousands of Trinidad and Tobago dollars)
Note 2009 2008
ASSETS
Property, plant and equipment 4 $ 1,096 1,152
Investment property 5 16,300 16,300
Deferred tax asset 6(i) 8,209 6,265
Reinsurance assets 11 39,668 29,703
Trade and other receivables 7 29,886 24,906
Investments 8 47,311 38,645
Term deposits 30,003 28,196
Cash and cash equivalents 9 39,519 37,738
Total assets $ 211,992 182,905
EQUITY AND LIABILITIES
EQUITY
Stated capital 10 $ 17,617 17,617
Capital reserve 7,020 6,563
Catastrophe reserve fund 1,600 1,600
Statutory surplus reserve 8,552 8,552
Retained earnings 52,927 40,175
87,716 74,507
LIABILITIES
Insurance contracts 11 107,150 89,871
Deferred tax liability 6(ii) 1,863 2,226
Provision for taxation 1,765 1,141
Trade and other payables 12 13,498 15,160
124,276 108,398
Total equity and liabilities $ 211,992 182,905
The accompanying notes form an integral part of these financial statements.
Signed on behalf of the Board
Director Director

okf"kZd fjiksVZANNUAL REPORT 2009-10
115
SU
BS
ID
IA
RIE
SS
UB
SID
IA
RIE
SS
UB
SID
IA
RIE
SS
UB
SID
IA
RIE
SS
UB
SID
IA
RIE
S
THE NEW INDIA ASSURANCE COMPANY (TRINIDAD AND TOBAGO) LIMITED
STATEMENT OF COMPREHENSIVE INCOME - DECEMBER 31, 2009(Expressed in thousands of Trinidad and Tobago dollars)
Note 2009 2008
Insurance contracts premium revenue $ 95,190 88,613
Reinsurers' share of insurance contracts premium revenue (35,621) (33,449)
Net insurance contracts premium revenue 59,569 55,164
Gross change in unearned premium provision andunexpired risks (4,493) (9,089)
Reinsurers' share of change in unearnedpremium provision and unexpired risks 800 2,890
Net change in unearned premium provisionand unexpired risks (3,693) (6,199)
Net insurance revenue 55,876 48,965
Reinsurance commissions 8,024 8,053
Investment and other income 13 7,191 5,134
Total revenue 71,091 62,152
Gross claims incurred (40,782) (30,116)
Reinsurers' share of gross claims incurred 12,821 3,533
Net insurance claims incurred (27,961) (26,583)
Agents and brokers commissions (14,909) (14,283)
Other operating and administrative expenses (11,639) (10,609)
Total claims incurred and other expenses (54,509) (51,475)
Profit before tax 16,582 10,677
Taxation 6(iv) 401 (2,197)
Net profit for the year $ 16,983 8,480
The accompanying notes form an integral part of these financial statements.

fn U;w bafM;k ,';ksjUl da- fy-THE NEW INDIA ASSURANCE CO. LTD.
116
Estbd. 1919
THE NEW INDIA ASSURANCE COMPANY (TRINIDAD AND TOBAGO) LIMITED
STATEMENT OF COMPREHENSIVE INCOME - DECEMBER 31, 2009 (Contd.,)(Expressed in thousands of Trinidad and Tobago dollars)
Note 2009 2008
Net profit for the year $ 16,983 8,480
Other comprehensive income
Foreign currency translation differences $ (2,490) 336for foreign operations
Net change in fair value of available for 457 102sale financial assets
Total comprehensive income for the year $ 14,950 8,918
Profit attributable to shareholders $ 16,983 8,480
Total comprehensive income $ 14,950 8,918attributable to shareholders
The accompanying notes form an integral part of these financial statements.
SU
BS
ID
IA
RIE
SS
UB
SID
IA
RIE
SS
UB
SID
IA
RIE
SS
UB
SID
IA
RIE
SS
UB
SID
IA
RIE
S

okf"kZd fjiksVZANNUAL REPORT 2009-10
117
THE NEW INDIA ASSURANCE COMPANY (TRINIDAD AND TOBAGO) LIMITED
STATEMENT OF CHANGES IN EQUITY- DECEMBER 31, 2009(Expressed in thousands of Trinidad and Tobago dollars)
Stated Capital Catastrophe Statutory Retained TotalCapital Reserves Reserve Surplus Earnings
Reserve
Balance atJanuary 1, 2008 $ 17,617 6,461 1,300 8,552 33,400 67,330
Total comprehensive income
for the year
Net profit for the year - - - - 8,480 8,480
Other comprehensive income
Foreign currency translation
differences - - - - 336 336
Net unrealised gain on revaluation
of available-for-sale investments
net of deferred taxation - 102 - - - 102
Total other comprehensive income - 102 - - 336 438
Total comprehensive income
for the year - 102 - - 8,816 8,918
Transactions with owners,
recorded directly in equity
Transfer to catastrophe reserve - - 300 - (300) -
Dividends paid - - - - (1,741) (1,741)
Total transactions with owners - - 300 - (2,041) (1,741)
Balance atDecember 31, 2008 $ 17,617 6,563 1,600 8,552 40,175 74,507
The accompanying notes form an integral part of these financial statements.
SU
BS
ID
IA
RIE
SS
UB
SID
IA
RIE
SS
UB
SID
IA
RIE
SS
UB
SID
IA
RIE
SS
UB
SID
IA
RIE
S

fn U;w bafM;k ,';ksjUl da- fy-THE NEW INDIA ASSURANCE CO. LTD.
118
Estbd. 1919
THE NEW INDIA ASSURANCE COMPANY (TRINIDAD AND TOBAGO) LIMITED
STATEMENT OF CHANGES IN EQUITY- DECEMBER 31, 2009(Expressed in thousands of Trinidad and Tobago dollars)
Stated Capital Catastrophe Statutory Retained TotalCapital Reserves Reserve Surplus Earnings
Reserve
Balance atJanuary 1, 2009 $ 17,617 6,563 1,600 8,552 40,175 74,507
Total comprehensive income
for the year
Net profit for the year - - - - 16,983 16,983
Other comprehensive income
Foreign currency translation - - - - (2,490) (2,490)
differences
Net unrealised gain on revaluation - 457 - - - 457
of available-for-sale investments
net of deferred taxation
Total other comprehensive income - 457 - - (2,490) (2,033)
Total comprehensive income
for the year - 457 - - 14,493 14,950
Transaction with owners,
recorded directly in equity
Dividends paid - - - - (1,741) (1,741)
Total transaction with owners - - - - (1,741) (1,741)
Balance at
December 31, 2009 $ 17,617 7,020 1,600 8,552 52,927 87,716
The accompanying notes form an integral part of these financial statements.
SU
BS
ID
IA
RIE
SS
UB
SID
IA
RIE
SS
UB
SID
IA
RIE
SS
UB
SID
IA
RIE
SS
UB
SID
IA
RIE
S

okf"kZd fjiksVZANNUAL REPORT 2009-10
119
THE NEW INDIA ASSURANCE COMPANY (TRINIDAD AND TOBAGO) LIMITED
STATEMENT OF CASH FLOWS - DECEMBER 31, 2009(Expressed in thousands of Trinidad and Tobago dollars)
2009 2008
CASH FLOWS FROM OPERATING ACTIVITIES
Profit before taxation $ 16,582 10,677Adjustments for:
Depreciation 295 239Foreign currency translation (loss) gain (2,490) 336Interest income (5,306) (5,275)Dividend income (586) (393)
Operating profit before working capital changes 8,495 5,584Increase in other receivables and reinsurance assets (14,945) (2,475)Increase in insurance contracts liabilities 17,279 7,043(Decrease) increase in other creditors (1,662) 398
9,167 10,550
Corporation taxes paid (1,423) (907)
Net cash from operating activities 7,744 9,643
CASH FLOWS FROM (USED IN) INVESTING ACTIVITIES
Interest received 3,610 3,761
Dividends received 586 393
Additions to property, plant and equipment (239) (544)
Purchase of investments and term deposits (15,970) (18,205)
Redemption of investments and term deposits 7,791 8,632
Net cash used in investing activities (4,222) (5,963)
CASH FLOWS USED IN FINANCING ACTIVITIES
Dividends paid (1,741) (1,741)
Net cash used in financing activities $ (1,741) (1,741)
NET INCREASE IN CASH AND CASH EQUIVALENTS $ 1,781 1,939
CASH AND CASH EQUIVALENTS AT BEGINNING OF YEAR 37,738 35,799
Cash and cash equivalents at end of year $ 39,519 37,738
Represented by:Cash in hand and at bank $ 39,519 33,695Short-term treasury bills - 4,043
$ 39,519 37,738
The accompanying notes form an integral part of these financial statements.
SU
BS
ID
IA
RIE
SS
UB
SID
IA
RIE
SS
UB
SID
IA
RIE
SS
UB
SID
IA
RIE
SS
UB
SID
IA
RIE
S

fn U;w bafM;k ,';ksjUl da- fy-THE NEW INDIA ASSURANCE CO. LTD.
120
Estbd. 1919
THE NEW INDIA ASSURANCE COMPANY (TRINIDAD AND TOBAGO) LIMITED
NOTES TO FINANCIAL STATEMENTS - DECEMBER 31, 2009
1. Incorporation and principal activity
The New India Assurance Company (Trinidad and Tobago) Limited (the Company) is incorporated in theRepublic of Trinidad and Tobago and is a subsidiary of The New India Assurance Company Limited, Mumbai,India. The Company carries on general insurance business in Trinidad and Tobago, Dominica, St. Lucia, St.Maarten and Anguilla. The Company also maintains run-off portfolios in the islands of Antigua and Barbados.The registered office and principal place of business is located at 22 St Vincent Street, Port of Spain.
These financial statements were authorized for issue by the Board of Directors.
2. Statement of accounting policies
(a) Statement of compliance
These financial statements are prepared in accordance with International Financial Reporting Standards(IFRS) and its interpretations adopted by the International Accounting Standards Board.
(b) Basement of measurement
These financial statements are prepared on the historical cost basis except for the measurement atfair value of available for sale investments and investment property. No account is taken of the effectsof inflation.
(c) Functional and presentation currency
Items included in these financial statements are measured using the currency of the primary economicenvironment in which the entity operates ("the functional currency").
These financial statements are presented in Trinidad and Tobago dollars which is the Company'sfunctional and presentation currency. All financial information presented in Trinidad and Tobago dollarshas been rounded to the nearest thousand. Some financial information in the prior year have beenupdated to conform with current year's presentation.
(d) Use of estimates, assumptions and judgements
The preparation of financial statements in conformity with IFRS requires management to makejudgements, estimates and assumptions that affect the application of policies and reported amountsof assets and liabilities, income and expenses and contingent assets and liabilities. The estimatesand associated assumptions are based on historical experience and various other factors that arebelieved to be reasonable under the circumstances, the results of which form the basis of making thejudgements about carrying values of assets and liabilities that are not readily apparent from othersources. Actual results may differ from these estimates.
The estimates and underlying assumptions are reviewed on an ongoing basis. Revisions to accountingestimates are recognised in the period in which the estimate is revised if the revision affects only thatperiod, or in the period of the revision and future periods if the revision affects both current and futureperiods.
Judgements made by management in the application of IFRS that have a significant effect on thefinancial statements and estimates with a significant risk of material adjustment in the next year arediscussed in notes 2(s) and (t) and note 21.
SU
BS
ID
IA
RIE
SS
UB
SID
IA
RIE
SS
UB
SID
IA
RIE
SS
UB
SID
IA
RIE
SS
UB
SID
IA
RIE
S

okf"kZd fjiksVZANNUAL REPORT 2009-10
121
THE NEW INDIA ASSURANCE COMPANY (TRINIDAD AND TOBAGO) LIMITED
NOTES TO FINANCIAL STATEMENTS - DECEMBER 31, 2009 (contd...)
(e) Foreign currency
(i) Transactions and balances
Transactions in foreign currencies are translated at the foreign exchange rate ruling at the dateof the transaction. Monetary assets and liabilities denominated in foreign currencies at thestatement of financial position date are translated to Trinidad and Tobago dollars at the foreignexchange rate ruling at that date. Foreign exchange differences arising on translation arerecognised in the statement of comprehensive income. There are no non-monetary assets andliabilities that are measured in terms of historical cost in a foreign currency.
(ii) Foreign operations
The assets and liabilities and income and expenses of foreign operations are translated toTrinidad and Tobago dollars at exchange rates at the reporting date.
(f) Segmental reporting
A geographical segment is one engaged in providing products or services within a particulareconomic environment that is subject to risks and returns that are different from those of segmentsoperating in other economic environments.
(g) Impairment of assets
Judgement is required to determine whether there are indicators of impairment. If impairment isindicated then the amount is determined using the techniques described in accounting policy(n)(i).
(h) Property, plant and equipment
Property, plant and equipment are stated at historical cost less accumulated depreciation andimpairment losses. Subsequent costs are included in the asset's carrying amount or recognisedas a separate asset, only when it is probable that future economic benefits associated with theitem will flow to the Company and the cost of the item can be measured reliably. All other repairsand maintenance are charged to the statement of comprehensive income during the financialperiod in which they are incurred.
Depreciation is provided at rates sufficient to write-off the cost of the assets over their estimateduseful lives.
The rates and methods used are as follows:
Leasehold improvements 20% on costMotor vehicles 20 - 25% on costOffice equipment 10 - 25% on reducing balance
The asset's residual value, useful lives and depreciation methods are reviewed and adjusted, ifappropriate, at each statement of financial position date.
(i) Investment property
Property held for capital appreciation is classified as investment property and is stated at fair value.Investment properties are valued annually either by way of Directors valuation or an external professional
SU
BS
ID
IA
RIE
SS
UB
SID
IA
RIE
SS
UB
SID
IA
RIE
SS
UB
SID
IA
RIE
SS
UB
SID
IA
RIE
S
fn U;w bafM;k ,';ksjUl da- fy-THE NEW INDIA ASSURANCE CO. LTD.
122
Estbd. 1919
valuer. The property is externally valued at least once every three (3) years. Fair value is theestimated amounts for which a property can be exchanged on the date of valuation between a willingbuyer and a willing seller in an arm's length transaction. Investment properties are derecognizedwhen either its use has changed or it has been disposed off or when the investment property ispermanently withdrawn from use and no future benefit is expected from its disposal.
Gains or losses arising from changes in the fair values are recognized in the statement of comprehensiveincome in the period in which they arise.
(j) Reinsurance assets
The Company assumes and cedes reinsurance in the normal course of business. Reinsuranceassets primarily include balances due from reinsurance companies for ceded insurance liabilities.Premiums on reinsurance assumed are recognized as revenue in the same manner as theywould be if the reinsurance were considered direct business, taking into account the productclassification of the reinsured business. Amounts due to reinsurers are estimated in a mannerconsistent with the associated reinsured policies and in accordance with the reinsurance contract.Premiums ceded and claims reimbursed are presented on a gross basis.
An impairment review is performed on all reinsurance assets when an indication of impairmentoccurs. Reinsurance assets are impaired only if there is objective evidence that the companymay not receive all amounts due to it under the terms of the contract and that this can be measuredreliably.
(k) Insurance receivables
Insurance receivables are recognized when due and measured at amortised cost, using theeffective interest rate method. The carrying value of insurance receivables is reviewed forimpairment whenever events or circumstances indicate that the carrying amount may not berecoverable, with the impairment loss recorded in the statement of comprehensive income.
(l) Financial instruments
i) Classification
The Company classifies its investments as either held to maturity financial assets or availablefor sale financial assets. The classification depends on the purpose for which the investmentswere acquired or originated.
Held-to-maturity financial assets comprise fixed or determinable income securities that thecompany has the positive intention and ability to hold until maturity.
Available-for-sale financial assets are financial assets that are not financial assets at fairvalue through profit and loss, originated by the Company, or held-to-maturity.
ii) Recognition
All regular way purchases and sales of financial assets are recognized on the settlementdate. From this date, any gains and losses arising from changes in fair value of assets arerecognised.
iii) Measurement
THE NEW INDIA ASSURANCE COMPANY (TRINIDAD AND TOBAGO) LIMITED
NOTES TO FINANCIAL STATEMENTS - DECEMBER 31, 2009 (contd...)
SU
BS
ID
IA
RIE
SS
UB
SID
IA
RIE
SS
UB
SID
IA
RIE
SS
UB
SID
IA
RIE
SS
UB
SID
IA
RIE
S

okf"kZd fjiksVZANNUAL REPORT 2009-10
123
THE NEW INDIA ASSURANCE COMPANY (TRINIDAD AND TOBAGO) LIMITED
NOTES TO FINANCIAL STATEMENTS - DECEMBER 31, 2009 (contd...)
Financial instruments are initially measured at cost, being the fair value plus the transactioncosts that are directly attributable to the acquisition of the instrument. A financial asset isderecognized when the contractual right to receive cash flows expire or when the asset istransferred.
Subsequent to initial recognition all available-for-sale assets are measured at fair value,based on if readily available market prices at the close of business on the statement offinancial position date for listed instruments are available or by reference to current marketvalues of another instrument which is substantially the same. If prices are not readily available,the fair value is based on either valuation models or management's estimate of amountsthat could be realised under current market conditions. Where discounted cash flowtechniques are used, estimated future cash flows are based on management's best estimatesand the discount rate is a market related rate at the statement of financial position date foran instrument with similar terms and conditions.
Any available-for-sale asset that does not have a quoted market price in an active marketand where fair value cannot be reliably measured is stated at cost, including transactioncosts, less impairment losses.
Gains and losses arising from the change in the fair value of available-for-sale investmentssubsequent to initial recognition are accounted for as changes in the capital reserve until theinvestment is derecognized or the investment is determined to be impaired. On derecognitionor impairment, the cumulative gain or loss previously reported in equity is transferred to thestatement of comprehensive income.
All non-trading financial liabilities and held-to-maturity assets are measured at amortisedcosts less impairment losses. Amortised cost is calculated on the effective interest ratemethod. Premiums and discounts, including initial transaction costs, are included in thecarrying amount of the related instrument and amortised based on the effective interest rateof the instrument. The amortisation of premiums and discounts is taken to the statement ofcomprehensive income.
(m) Cash and cash equivalents
Cash and cash equivalents are short-term, highly liquid investments readily convertible to knownamounts of cash and subject to insignificant risks of change in value. These are shown at cost.
(n) Impairment
The carrying amounts of the Company's assets, other than deferred tax assets (see accountingpolicy (z)), are reviewed at each statement of financial position date to determine whether there isany indication of impairment. If any such indication exists, the asset's recoverable amount isestimated (see accounting policy (n)(i)) and an impairment loss is recognised whenever the carryingamount of an asset exceeds its recoverable amount. In order to determine whether negativerevaluations on investment securities correctly represent impairment, all investment securities forwhich the market value has been significantly below cost price for a considerable period of time,are individually reviewed. A distinction is made between negative revaluations due to general marketfluctuations and due to issuer specific developments. The impairment review focuses on issuerspecific developments regarding financial condition and future prospects, taking into account the
SU
BS
ID
IA
RIE
SS
UB
SID
IA
RIE
SS
UB
SID
IA
RIE
SS
UB
SID
IA
RIE
SS
UB
SID
IA
RIE
S

fn U;w bafM;k ,';ksjUl da- fy-THE NEW INDIA ASSURANCE CO. LTD.
124
Estbd. 1919
THE NEW INDIA ASSURANCE COMPANY (TRINIDAD AND TOBAGO) LIMITED
NOTES TO FINANCIAL STATEMENTS - DECEMBER 31, 2009 (contd...)
intent and ability to hold the securities under the Company's long-term investment strategy. Impairmentlosses are recognised in the statement of comprehensive income.
When a decline in the fair value of an available-for-sale financial asset has been recognised directlyin equity and there is objective evidence that the asset is impaired, the cumulative loss that hadbeen recognised directly in equity is recognised in the statement of comprehensive income eventhough the financial asset has not been derecognised. The amount of the cumulative loss that isrecognised in the statement of comprehensive income is the difference between the acquisition costand current fair value, less any impairment loss on that financial asset previously recognised in thestatement of comprehensive income.
i) Calculation of recoverable amount
The recoverable amount of the Company's held-to-maturity financial assets carried at amortisedcost is calculated as the present value of estimated future cash flows, discounted at theoriginal effective interest rate (i.e. the effective interest rate computed at initial recognition ofthese financial assets). Receivables with a short duration are not discounted.
The recoverable amount of other assets is the greater of their net selling price and value in use.In assessing value in use, the estimated future cash flows are discounted to their present valueusing a pre-tax discount rate that reflects current market assessments of the time value ofmoney and the risks specific to the asset. For an asset that does not generate largelyindependent cash inflows, the recoverable amount is determined for the cash-generating unit towhich the asset belongs.
ii) Reversals of impairment
An impairment loss in respect of a receivable carried at amortised cost is reversed if thesubsequent increase in recoverable amount can be related objectively to an event occurringafter the impairment loss was recognised.
An impairment loss in respect of an investment in an equity instrument classified as available-for-sale is not reversed through the statement of comprehensive income. If the fair value ofa debt instrument classified as available-for-sale increases and the increase can be objectivelyrelated to an event occurring after the impairment loss was recognised in the statement ofcomprehensive income, the impairment loss shall be reversed, with the amount of the reversalrecognised in the statement of comprehensive income.
In respect of other assets, an impairment loss is reversed if there has been a change in theestimates used to determine the recoverable amount.
An impairment loss is reversed only to the extent that the asset's carrying amount does notexceed the carrying amount that would have been determined, net of depreciation oramortisation, if no impairment loss had been recognised.
(o) Capital reserve
All unrealized gains and losses arising from the revaluation of available-for-sale investments arerecognized as part of shareholders equity in the capital reserve.
SU
BS
ID
IA
RIE
SS
UB
SID
IA
RIE
SS
UB
SID
IA
RIE
SS
UB
SID
IA
RIE
SS
UB
SID
IA
RIE
S

okf"kZd fjiksVZANNUAL REPORT 2009-10
125
THE NEW INDIA ASSURANCE COMPANY (TRINIDAD AND TOBAGO) LIMITED
NOTES TO FINANCIAL STATEMENTS - DECEMBER 31, 2009 (contd...)
(p) Catastrophe reserve
On an annual basis, the Directors determine an amount that is transferred to a catastrophe reserve.This is treated as an appropriation of retained earnings and is included as a separate componentof equity.
(q) Statutory surplus reserve
As required by Section 171 of the Insurance Act, 1980 of Trinidad and Tobago at least 25% of theCompany's profit from general insurance business, for the preceding year is to be appropriatedtowards a Statutory Surplus Reserve until such surplus equals or exceeds the reserves in respectof its outstanding unexpired policies. This reserve is not distributable.
(r) Product classification
Insurance contracts
Insurance contracts are defined as those containing significant insurance risk at the inception ofthe contract. The significance of insurance risk is dependant on both the probability of an insuredevent and the magnitude of its potential effect.
Once a contract has been classified as an insurance contract, it remains an insurance contractfor the remainder of its lifetime, even if the insurance risk reduces significantly during this period.
Investment contracts
Any contracts not considered insurance contracts under IFRS are classified as investmentcontracts.
All contracts held by the Company as at December 31, 2009 have been classified as insurancecontracts.
(s) Benefits and claims
Reported outstanding general insurance claims comprise the estimated costs of all claims incurredbut not settled at the statement of financial position date, less any reinsurance recoveries. Inestimating the liability for the cost of reported claims not yet paid, the Company considers anyinformation available from adjusters and information on the cost of settling claims with similarcharacteristics in previous periods. Provision is made for claims incurred but not reported untilafter the statement of financial position date. Differences between the provisions for outstandingclaims and subsequent revisions and settlement are included in the statement of comprehensiveincome in the year the claims are settled.
The estimation of claims incurred but not reported ("IBNR") is generally subject to a greater degreeof uncertainty than the estimation of the cost of settling claims already notified to the company,where more information about the claim event is generally available. Claims IBNR may often not beapparent to the insurer until many years after the event giving rise to the claims has happened.
(t) Insurance contract liabilities
General insurance contract liabilities
General insurance contract liabilities are based on the estimated ultimate cost of all claims incurredbut not settled at the statement of financial position date, whether reported or not. Significantdelays can be experienced in the notification and settlement of certain type of general insurance
SU
BS
ID
IA
RIE
SS
UB
SID
IA
RIE
SS
UB
SID
IA
RIE
SS
UB
SID
IA
RIE
SS
UB
SID
IA
RIE
S

fn U;w bafM;k ,';ksjUl da- fy-THE NEW INDIA ASSURANCE CO. LTD.
126
Estbd. 1919
THE NEW INDIA ASSURANCE COMPANY (TRINIDAD AND TOBAGO) LIMITED
NOTES TO FINANCIAL STATEMENTS - DECEMBER 31, 2009 (contd...)
claims, therefore the ultimate cost of which cannot be known with certainty at the statement offinancial position date.
Provision for unearned premiums
The proportion of written premiums attributable to subsequent periods is deferred as unearnedpremium. The change in the provision for unearned premium is taken to the income statement inthe order that revenue is recognized over the period of risk.
(t) Insurance contract liabilities
Provision for unexpired risks
Provision for unexpired risks represents the amount set aside at the end of the year in respect ofsubsequent risks to be borne by the company under contracts of insurance in force at the end ofthe year and are computed as a percentage of the provision for unearned premiums at the end ofthe year.
(u) Provision for other insurance financial liabilities
A provision is recognised when the Company has a present legal or constructive obligation, as aresult of past events, which it is probable, will result in an outflow of resources and when a reliableestimate of the amount of the obligation can be made.
(v) Employee benefits
The directors have agreed to pay a gratuity to managerial employees on retirement after tenyears or more of service. For non-managerial employees, a discretionary gratuity on retirementafter ten years or more of service will be paid. The liability arising is adequately provided for inthese financial statements.
(w) Revenue recognition
Premium income
Premiums written are recognized on policy inception and earned on a pro rata basis over the termof the related policy coverage.
Commission income
The fee is recognized as revenue in the period in which it is received unless these relate toservice to be provided in future periods. If the fees are for services to be provided in futureperiods, these are deferred and recognized in the income statement as the service is providedover the term of the contract. Initiation and other front-end fees are also deferred and recognizedover the term of the contract.
Investment income
Interest income is recognized in the income statement as it accrues, taking into account the effectiveyield of the asset or an applicable floating rate. Interest income includes the amortization of anydiscount or premium. Investment income also includes dividends, which are recognized as received.
Realised gains and losses recorded in the income statement
Realised gains and losses on the sale of property and equipment and of available for sale financial
SU
BS
ID
IA
RIE
SS
UB
SID
IA
RIE
SS
UB
SID
IA
RIE
SS
UB
SID
IA
RIE
SS
UB
SID
IA
RIE
S

okf"kZd fjiksVZANNUAL REPORT 2009-10
127
assets are calculated as the difference between net sales proceeds and the original cost. Realisedgains and losses are recognized in the statement of comprehensive income when the sale transactionoccurs.
(x) Expenses of management
Expenses of management are apportioned to the various business segments on the basis of grosspremium income written for each class of business with the exception of Barbados, which aredirectly allocated.
(y) Other income and expenditure
Other income and expenditure items are accounted for on the accrual basis.
(z) Taxation
Tax on income comprises current tax from business inside and outside of Trinidad and Tobago andthe change in deferred tax. Current tax comprises tax payable calculated on the basis of theexpected taxable income for the year, using the tax rate enacted by the statement of financialposition date, business levy and green fund levy, charged on worldwide income, and any adjustmentof tax payable for the previous years.
Premium taxes in overseas territories are deducted from the relevant premium income recognised.
Deferred tax is provided using the statement of financial position liability method on all temporarydifferences between the carrying amounts for financial reporting purposes and the amounts usedfor taxation purposes, except differences relating to the initial recognition of assets or liabilitieswhich affect neither accounting nor taxable income (loss).
Deferred tax is calculated on the basis of the tax rate that is expected to apply to the period whenthe asset is realised or the liability is settled. The effect on the deferred tax of any changes in thetax rate is charged to the statement of comprehensive income, except to the extent that it relatesto items previously charged or credited directly to equity.
Deferred tax assets relating to the carry forward of unused tax losses are recognised to theextent that it is probable that future taxable profit will be available against which the unused taxlosses can be utilised.
3. New standards adopted and new standards and interpretations not yet adopted
New standards adopted
The Company applied revised IAS 1Presentation of Financial Statements (2007), which became effectiveas of January 1, 2009. As a result the company now presents a statement of comprehensive incomewhich replaces the statement of income.
Comparative information has been re-presented so that it also is in conformity with the revised standard.
New standards and interpretations not yet adopted
A number of new standards, amendments to standards and interpretations are not yet effective for the yearended December 31, 2009, and have not been applied in preparing these financial statements. None ofthese will have an effect on the financial statements of the company, except:
THE NEW INDIA ASSURANCE COMPANY (TRINIDAD AND TOBAGO) LIMITED
NOTES TO FINANCIAL STATEMENTS - DECEMBER 31, 2009 (contd...)
SU
BS
ID
IA
RIE
SS
UB
SID
IA
RIE
SS
UB
SID
IA
RIE
SS
UB
SID
IA
RIE
SS
UB
SID
IA
RIE
S

fn U;w bafM;k ,';ksjUl da- fy-THE NEW INDIA ASSURANCE CO. LTD.
128
Estbd. 1919
IFRS 9 Financial Instruments, published on November 12, 2009 as part of phase 1 of the IASB'scomprehensive project to replace IAS 39. The requirements of this standard represent a significantchange from the existing requirements in IAS39 in respect of financial assets. The standard containstwo primary measurement categories for financial assets: amortised cost and fair value. A financialasset would be measured at amortised cost if it is held within a business model whose objective is tohold assets in order to collect contractual cash flows and the asset's contractual terms give rise onspecified dates to cash flows that are solely payments of principal and interest on the principal outstanding.All other financial assets would be measured at fair value. The standard eliminates the existing IAS 39categories of held to maturity, available for sale and loans and receivables. For an investment in anequity instrument which is not held for trading, the standard permits an irrevocable election, on initialrecognition, on an individual share-by-share basis, to present all fair value changes from the investmentin other comprehensive income. No amount recognised in other comprehensive income would ever bereclassified to profit or loss at a later date. However, dividends on such investments are recognised inprofit or loss, rather than other comprehensive income unless they clearly represent a partial recoveryof the cost of the investment. Investments in equity instruments in respect of which an entity does notelect to present fair value changes in other comprehensive income would be measured at fair valuewith changes in fair value recognised in profit or loss.
The standard is effective for annual periods beginning on or after January 1, 2013. Earlier applicationis permitted.
4. Property, plant and equipment
OfficeLeasehold Equipment Total Total
Improvements & MotorVehicles 2009 2008
Cost
At beginning of year $ 460 3,564 4,024 3,480Addition 55 184 239 544Disposals - - - -Write-offs - - - -At end of year $ 515 3,748 4,263 4,024
DepreciationAt beginning of year $ 364 2,508 2,872 2,633Current year 57 238 295 239At end of year $ 421 2,746 3,167 2,872
Net written down value $ 94 1,002 1,096 1,152
5. Investment property
Investment property comprises properties at 6A Victoria Avenue and 47 New Street, Port of Spain not inuse at present. Raymond & Pierre Limited completed a valuation as at March 5, 2008 on the basis ofmarket value for existing use. The properties were valued at $16.3 million and the revaluation surplusof $9.8 million was credited to the statement of comprehensive income in the previous year.
THE NEW INDIA ASSURANCE COMPANY (TRINIDAD AND TOBAGO) LIMITED
NOTES TO FINANCIAL STATEMENTS - DECEMBER 31, 2009 (contd...)
SU
BS
ID
IA
RIE
SS
UB
SID
IA
RIE
SS
UB
SID
IA
RIE
SS
UB
SID
IA
RIE
SS
UB
SID
IA
RIE
S

okf"kZd fjiksVZANNUAL REPORT 2009-10
129
6. Taxation
2009 2008(i) Deferred tax asset
Unutilised tax losses $ 676 6,256
Foreign currency translation 623 -
Claims 6,910 9
$ 8,209 6,265
The Company has unutilised tax losses in Trinidad and Tobago of approximately $2,278 as at December31, 2009 (2008: $25,028).
Deferred tax assets have been recognized in these financial statements for carried forward unutilisedtax losses. This position will be re-assessed at the next financial year-end.
(ii) Deferred tax liability
The deferred tax liabilities are attributable to the following items:
Unrealised gains on revaluation of available-for-sale investments $ (1,790) (2,188)
Property, plant and equipment (73) (38)
$ (1,863) (2,226)
(iii) The movement in the deferred tax account comprised:
Balance at beginning of year $ (2,226) (2,156)Unrealised gains on revaluation of availablefor sale investments 398 (34)
Foreign currency translation - (75)
Claims - 46
Property, plant and equipment (35) (7)
$ (1,863) (2,226)
(iv) Tax charge for the year
Current year - Business levy $ 152 143
- Green fund levy 76 71
- Provision for taxation in St Maarten,Dominica and St Lucia 1982 1,095
Deferred tax expense relating to theorigination/reversal of temporary differences (1,655) 13
THE NEW INDIA ASSURANCE COMPANY (TRINIDAD AND TOBAGO) LIMITED
NOTES TO FINANCIAL STATEMENTS - DECEMBER 31, 2009 (contd...)
SU
BS
ID
IA
RIE
SS
UB
SID
IA
RIE
SS
UB
SID
IA
RIE
SS
UB
SID
IA
RIE
SS
UB
SID
IA
RIE
S

fn U;w bafM;k ,';ksjUl da- fy-THE NEW INDIA ASSURANCE CO. LTD.
130
Estbd. 1919
THE NEW INDIA ASSURANCE COMPANY (TRINIDAD AND TOBAGO) LIMITED
NOTES TO FINANCIAL STATEMENTS - DECEMBER 31, 2009 (contd...)
2009 2008
Utilisation of tax losses 4,247 805
Prior year under provision (163) 98
Prior year under provision of deferred tax asset (5,040) (28)
$ (401) 2,197The following is a reconciliation between tax andaccounting profit multiplied by the applicable tax rate.
Profit before tax $ 16,582 10,677
Tax at the applicable rate 4,991 3,259
Expenses not deductible for tax purposes 30 42
Income exempt from tax (447) (1,388)
Business levy 152 143
Green fund 76 71
Prior year under provision (163) 98
Prior year under provision of deferred tax asset (5,040) (28)
$ (401) 2,197
7. Trade and other receivables
Insurance receivables $ 23,969 18,121Amounts due from reinsurers
- New India, Mumbai 2,281 2,134
- Other reinsurers 1,217 2,443
Other receivables 2,419 2,208
$ 29,886 24,9068. Investments
Available-for-saleBonds and other securities $ 30,062 21,016Quoted shares 12,418 12,431Unquoted shares 315 315
$ 42,795 33,762Held to maturity
Bonds 4,516 4,883
Total investments $ 47,311 38,645
Bonds and securities pledged with the Inspector of Financial Institutions amount to $31,837 at December31, 2009 (2008: $31,972).
In addition $3,995 (2008: $8,597)of the term deposits of totalling $30,004 (2008: $28,196) at December31, 2009 are pledged with the Inspector of Financial Institutions.
SU
BS
ID
IA
RIE
SS
UB
SID
IA
RIE
SS
UB
SID
IA
RIE
SS
UB
SID
IA
RIE
SS
UB
SID
IA
RIE
S

okf"kZd fjiksVZANNUAL REPORT 2009-10
131
9. Cash and cash equivalents
2009 2008
Cash in hand and at bank $ 39,519 33,695
Short-term treasury bills - 4,043
$ 39,519 37,738
10. Stated capital
Authorised22,000,000 shares of no par value
Issued and fully paid17,418,946 shares of no par value $ 17,418 17,418Share premium 199 199
$ 17,617 17,617
11. Insurance contracts liabilities
2009 2008
Insurance Reinsurers' Insurance Reinsurers'Contracts Share of Contracts Share of
Notes Liabilities Liabilities Net Liabilities Liabilities Net
Provision for claimsreported by policyholders $ 43,048 (19,650) 23,398 31,876 (11,814) 20,062
Provision for claimsincurred but not reported(IBNR) 7,302 (3,059) 4,243 5,041 (1,524) 3,517
Total claims reportedand IBNR 11 (a) 50,350 (22,709) 27,641 36,917 (13,338) 23,579
Provision for unearnedPremiums 11 (b) 51,636 (15,418) 36,218 48,140 (14,877) 33,263
Provision for unexpiredRisk 11 (c) 5,164 (1,541) 3,623 4,814 (1,488) 3,326
Total insurance contractsLiabilities $ 107,150 (39,668) 67,482 89,871 (29,703) 60,168
THE NEW INDIA ASSURANCE COMPANY (TRINIDAD AND TOBAGO) LIMITED
NOTES TO FINANCIAL STATEMENTS - DECEMBER 31, 2009 (contd...)
SU
BS
ID
IA
RIE
SS
UB
SID
IA
RIE
SS
UB
SID
IA
RIE
SS
UB
SID
IA
RIE
SS
UB
SID
IA
RIE
S

fn U;w bafM;k ,';ksjUl da- fy-THE NEW INDIA ASSURANCE CO. LTD.
132
Estbd. 1919
THE NEW INDIA ASSURANCE COMPANY (TRINIDAD AND TOBAGO) LIMITED
NOTES TO FINANCIAL STATEMENTS - DECEMBER 31, 2009 (contd...)
(a) The provision for claims reported by policy holders may be analysed as follows:
2009 2008
Insurance Reinsurers' Insurance Reinsurers'Contracts Share of Contracts Share ofLiabilities Liabilities Net Liabilities Liabilities Net
At January 1 $ 36,917 (13,338) 23,579 38,963 (16,662) 22,301
Claims incurred 40,782 (12,821) 27,961 30,116 (3,533) 26,583
Claims paidDuring the year (27,181) 3,412 (23,769) (31,969) 6,733 (25,236)
Foreign exchange (168) 38 (130) (193) 124 (69)
At December 31 $ 50,350 (22,709) 27,641 36,917 (13,338) 23,579(b)
The provision for unearned premiums may be analysed as follows:
2009 2008
Insurance Reinsurers' Insurance Reinsurers'Contracts Share of Contracts Share ofLiabilities Liabilities Net Liabilities Liabilities Net
At January 1 $ 48,140 (14,877) 33,263 39,877 (12,250) 27,627
Premium written inthe year 95,190 (34,746) 60,444 88,613 (33,449) 55,164
Premium earnedduring the year (91,694) 34,205 (57,489) (80,350) 30,822 (49,528)
At December 31 $ 51,636 (15,418) 36,218 48,140 (14,877) 33,263
(c) The provision for unexpired risk may be analysed as follows:
2009 2008
Insurance Reinsurers' Insurance Reinsurers'Contracts Share of Contracts Share ofLiabilities Liabilities Net Liabilities Liabilities Net
At January 1 $ 4,814 (1,488) 3,326 3,988 (1,225) 2,763
Net incurred andutilised during 350 (53) 297 826 (263) 563the year
At December 31 $ 5,164 (1,541) 3,623 4,814 (1,488) 3,326
SU
BS
ID
IA
RIE
SS
UB
SID
IA
RIE
SS
UB
SID
IA
RIE
SS
UB
SID
IA
RIE
SS
UB
SID
IA
RIE
S

okf"kZd fjiksVZANNUAL REPORT 2009-10
133
THE NEW INDIA ASSURANCE COMPANY (TRINIDAD AND TOBAGO) LIMITED
NOTES TO FINANCIAL STATEMENTS - DECEMBER 31, 2009 (contd...)
12. Trade and other payables
2009 2008
Sundry creditors and accruals $ 4,541 4,350
Amounts due to reinsurers
- New India, Mumbai 2,981 2,047
- Other reinsurers 5,976 8,763
$ 13,498 15,160
13. Investment and other income
Investment and other income include the following:
2009 2008
Interest income $ 5,306 5,275
Dividend income 586 393
Foreign exchange gain (loss) 1,299 (534)
$ 7,191 5,134
14. Profit before taxation
Profit before taxation is arrived at after charging:
2009 2008
Depreciation $ 295 239
Staff costs 4,707 4,348
Directors' fees 108 98
Interest expense 43 49
15. Insurance contracts liabilities and reinsurance assets - terms, assumptions and sensitivities
Terms and conditions
The major classes of general insurance written by the Company include motor, property, and othermiscellaneous types of general insurance. Risks under these policies usually cover a 12 month duration.
For these insurance contracts, claims provisions (comprising provisions for claims reported bypolicyholders and claims incurred but not yet reported) are established to cover the ultimate cost ofsettling the liabilities in respect of claims that have occurred and are estimated based on known facts atthe statement of financial position date.
The provisions are refined as part of a regular ongoing process and as claims experience develops, certainclaims are settled and further claims are reported. Outstanding claims provisions are not discounted forthe time value of money.
SU
BS
ID
IA
RIE
SS
UB
SID
IA
RIE
SS
UB
SID
IA
RIE
SS
UB
SID
IA
RIE
SS
UB
SID
IA
RIE
S

fn U;w bafM;k ,';ksjUl da- fy-THE NEW INDIA ASSURANCE CO. LTD.
134
Estbd. 1919
THE NEW INDIA ASSURANCE COMPANY (TRINIDAD AND TOBAGO) LIMITED
NOTES TO FINANCIAL STATEMENTS - DECEMBER 31, 2009 (contd...)
Assumptions
The principal assumption underlying the estimates is the Company's past claims development experience.This includes assumptions in respect of average claim costs and claim numbers for each accident year.Claims provisions are separately analysed by geographical area and class of business. In addition,larger claims are usually separately assessed by loss adjusters. Judgement is used to assess theextent to which external factors such as judicial decisions and government legislation affect the estimates.
16. Financial instruments
Sensitivities
The general insurance claims provision is sensitive to the above key assumptions. The sensitivity ofcertain assumptions like legislative change, uncertainty in the estimation process, etc, is not possible toquantify. Furthermore, because of delays that arise between occurrence of a claim and its subsequentnotification and eventual settlement, the outstanding claim provisions are not known with certainty atthe statement of financial position date.
Consequently, the ultimate liabilities will vary as a result of subsequent developments. Differencesresulting from reassessment of the ultimate liabilities are recognized in subsequent financial statements.
Fair values
With the exception of insurance contracts which are specifically excluded under IAS 32, the estimatedfair values of certain financial instruments have been determined using available market information orother appropriate valuation methodologies that require judgement in interpreting market data anddeveloping estimates. Consequently, estimates made do not necessarily reflect the amounts that theCompany would realize in a current market exchange. The use of different assumptions and/or differentmethodologies may have a material effect on the fair values estimated.
The fair value information is based on information available to management as at the dates presented.Although management is not aware of any factors that would significantly affect the fair value amounts,such amounts have not been comprehensively revalued for the purposes of these financial statementssince those dates and, therefore the current estimates of the fair value may be significantly differentfrom the amounts presented herein.
(i) Short-term financial assets and liabilities
The carrying amount of short-term financial assets and liabilities comprising cash and short-termfunds, trade and other receivables and trade and other payables are a reasonable estimate oftheir fair values because of the short maturity of these instruments.
(ii) Investments
The fair value of trading investments is based on market quotations when available. When marketquotations are not readily available, fair values are based on discounted cash flows or estimatedusing quoted market prices of similar investments. In the absence of a market value, discountedcash flows will approximate fair value.
17. Insurance and risk management
a. Introduction and overview
The Company has exposure to the following risks from its use of financial instruments:
SU
BS
ID
IA
RIE
SS
UB
SID
IA
RIE
SS
UB
SID
IA
RIE
SS
UB
SID
IA
RIE
SS
UB
SID
IA
RIE
S

okf"kZd fjiksVZANNUAL REPORT 2009-10
135
� Insurance risk
� Credit risk
� Liquidity
� Interest rate
� Foreign currency
This note presents information about the Company's exposure to each of the above risks, theCompany's objectives, policies and processes for measuring and managing risks and theCompany's management of capital. The Board of Directors has overall responsibility for theestablishment and oversight of the Company's risk management framework.
b. Insurance risk
The risk under an insurance contract is the risk that an insured event will occur including theuncertainty of the amount and timing of any resulting claim. The principal risk the Company facesunder such contracts is that the actual claims and benefit payments exceed the premiums writtenor the carrying amount of insurance liabilities. This is influenced by the frequency of claims,severity of claims, actual benefits paid being greater than originally estimated and subsequentdevelopment of long-term claims.
Management of insurance risk
The variability of risks is improved by careful selection and implementation of underwriting strategyand guidelines as well as the use of reinsurance arrangements. The majority of reinsurancebusiness ceded is placed on a quota share basis with retention limits varying by product line.
Although the Company has reinsurance arrangements, it is not relieved of its direct obligations toits policyholders and thus a credit exposure exists with respect to reinsurance ceded, to theextent that any reinsurer is unable to meet its obligations assumed under such reinsuranceagreements.
c. Credit risk
Credit risk is the risk that one party to a financial instrument will cause a financial loss for theother party by failing to discharge an obligation. Credit risk arises on reinsurance assets,investment securities and insurance receivables.
Management of credit risk
Reinsurance
Reinsurance is placed with high rated counterparties and concentration of risk is avoided byfollowing policy guidelines in respect of counterparties' limits that are set each year and aresubject to regular reviews. At each year end, management performs assessment ofcreditworthiness of reinsurers to update reinsurance purchase strategy and ascertains suitableallowance for impairment of reinsurance assets.
Investment securities
The Company limits its exposure by setting maximum limits of portfolio securities with a singleissuer or group of issuers. The Company also only makes use of institutions with highcreditworthiness.
THE NEW INDIA ASSURANCE COMPANY (TRINIDAD AND TOBAGO) LIMITED
NOTES TO FINANCIAL STATEMENTS - DECEMBER 31, 2009 (contd...)
SU
BS
ID
IA
RIE
SS
UB
SID
IA
RIE
SS
UB
SID
IA
RIE
SS
UB
SID
IA
RIE
SS
UB
SID
IA
RIE
S

fn U;w bafM;k ,';ksjUl da- fy-THE NEW INDIA ASSURANCE CO. LTD.
136
Estbd. 1919
Insurance receivables
The credit risk in respect of customer balances, incurred on non payment of premiums or contributionswill only persist during the grace period specified in the policy document on the expiry of which thepolicy is either repaid up or terminated. Commission paid to intermediaries is netted off againstamounts receivable from them to reduce the risk of doubtful debts.
An estimate of the fair value of collateral and other security enhancements held against financialassets is nil.
Exposure to credit risk
The carrying amount of financial assets represents the maximum credit exposure. The maximumexposure to credit risk at the reporting date was:
Carrying Amount
2009 2008
Available for sale investments $ 42,795 33,762Held-to-maturity investments 4,516 4,883Trade and other receivables 29,886 24,906Reinsurance assets 39,668 29,703Term deposits 30,003 28,196Cash and cash equivalents 39,519 37,738
$ 186,387 159,188Impairment losses
The aging of receivables at the reporting date was:
Gross Impairment Gross Impairment
2009 2009 2008 2008
Not past due $ 9,435 - 8,450 -
Past due 0-30 days 6,953 - 4,631 -
Past due 31-120 days 6,412 - 3,366 -
More than one year 2,612 1,443 2,864 1,190
$ 25,412 1,443 19,311 1,190
The movement in the allowance for impairment in respect of receivables during the year was asfollows:
2009 2008
Balance at 1 January $ 1,190 1,190
Impairment loss recognized 254 -
Balance at 31 December $ 1,443 1,190
THE NEW INDIA ASSURANCE COMPANY (TRINIDAD AND TOBAGO) LIMITED
NOTES TO FINANCIAL STATEMENTS - DECEMBER 31, 2009 (contd...)
SU
BS
ID
IA
RIE
SS
UB
SID
IA
RIE
SS
UB
SID
IA
RIE
SS
UB
SID
IA
RIE
SS
UB
SID
IA
RIE
S

okf"kZd fjiksVZANNUAL REPORT 2009-10
137
THE NEW INDIA ASSURANCE COMPANY (TRINIDAD AND TOBAGO) LIMITED
NOTES TO FINANCIAL STATEMENTS - DECEMBER 31, 2009 (contd...)
d. Liquidity
Liquidity risk is the risk that an entity will encounter difficulty in meeting obligations associatedwith financial liabilities.
Management of liquidity risk
The major liquidity risk confronting the Company is the daily calls on its available cash resourcesin respect of claims arising from insurance contracts and the maturity of investment securities.The Company sets limits on the minimum portion of maturing funds available to meet such callsand on the minimum level of borrowing facilities that should be in place to cover claims atunexpected levels of demand.
The table below shows the maturity profile of financial assets and liabilities:
MaturingBetween
Within 1 yr 1 to 5 yrs Over 5 yrs Total
2009
Liabilities
Insurance contracts $ 107,150 - - 107,150Trade and other payables 13,498 - - 13,498
$ 120,648 - - 120,648
2008
Liabilities
Insurance contracts $ 89,871 - - 89,871Trade and other payables 15,160 - - 15,160
$ 105,031 - - 105,031
e. Interest rates
Interest rate risk is the risk that the fair value or future cash flows of a financial instrument willfluctuate because of changes in market interest rates. Interest rate risk arises on interest-bearingfinancial instruments recognized in the balance sheet.
Management of interest rate risk
The investment committee comprises of three non-executive members and is responsible for reviewingthe investment portfolio of the company and setting the general direction as to the types of investmentsthat would comprise the company's portfolio. The aim is to balance the risk and returns with anobjective of maximizing investment income.
At the reporting date the interest rate profile of the interest-bearing financial instruments was:
SU
BS
ID
IA
RIE
SS
UB
SID
IA
RIE
SS
UB
SID
IA
RIE
SS
UB
SID
IA
RIE
SS
UB
SID
IA
RIE
S

fn U;w bafM;k ,';ksjUl da- fy-THE NEW INDIA ASSURANCE CO. LTD.
138
Estbd. 1919
THE NEW INDIA ASSURANCE COMPANY (TRINIDAD AND TOBAGO) LIMITED
NOTES TO FINANCIAL STATEMENTS - DECEMBER 31, 2009 (contd...)
Carrying Amount
2009 2008
Fixed rate instrumentals
Term deposits $ 30,003 28,196
Investments 34,578 25,899
Short term treasury bills - 4,043
$ 64,581 58,138
Variable rate instruments
Cash and cash equivalents $ 39,519 37,738
f. Foreign currency
Foreign currency risk is the risk that the fair value or future cash flows of a financial instrument willfluctuate because of changes in foreign exchange rates. Currency risk arises on financialinstruments that are denominated in a foreign currency, that is, in a currency other than thefunctional currency in which they are measured. The company carries on general insurancebusiness in Trinidad and Tobago, Dominica, St. Lucia, St. Maarten and Anguilla. The functionaland presentation currency is Trinidad and Tobago dollars. Foreign currency risk arises in theislands of operation.
Management of foreign currency risk
The table below summarises the exposure to foreign currency exchange rate risk.
Details BDOS TT$ EC$ FLS Total
AssetsCash and cash equivalents $ 25 35,708 3,234 552 39,519Term deposits - 15,981 11,172 2,850 30,003Investments 606 43,296 3,409 - 47,311Trade and other receivables 5,229 10,632 13,689 336 29,886Reinsurance assets 4,273 23,197 10,392 1,806 39,668Other assets - 25,525 80 - 25,605
Total assets $ 10,133 154,339 41,976 5,544 211,992
Liabilities and equityEquity $ (14,045) 58,693 35,565 7,503 87,716Insurance contracts 6,369 70,622 27,915 2,244 107,150Deferred tax liability - 1,863 - - 1,863Provision for taxation - 72 1,200 493 1,765
Trade and other payables 17,809 23,089 (22,704) (4,696) 13,498
Total liabilities and equity $ 10,133 154,339 41,976 5,544 211,992
SU
BS
ID
IA
RIE
SS
UB
SID
IA
RIE
SS
UB
SID
IA
RIE
SS
UB
SID
IA
RIE
SS
UB
SID
IA
RIE
S

okf"kZd fjiksVZANNUAL REPORT 2009-10
139
2009
Details BDOS TT$ EC$ FLS Total
Assets
Cash and cash equivalents $ 59 35,574 1,894 211 37,738
Term deposits - 14,403 11,073 2,720 28,196
Investments 590 34,495 3,560 - 38,645
Trade and other receivables 5,092 7,574 12,149 91 24,906
Reinsurance assets 4,206 15,400 8,348 1,749 29,703
Other assets (17,146) 28,266 1,133 11,464 23,717
Total assets $ (7,199) 135,712 38,157 16,235 182,905
Liabilities and equity
Equity $ (12,892) 48,570 31,952 6,877 74,507
Insurance contracts 6,496 58,029 23,129 2,217 89,871
Deferred tax liability - 2,226 - - 2,226
Provision for taxation - 9 733 399 1,141
Trade and other payables (803) 26,878 (17,657) 6,742 15,160
Total liabilities and equity $ (7,199) 135,712 38,157 16,235 182,905
18. Segmental reporting
The relevant segmental information for the Company is as follows:
2009
Details Trinidad & Tobago Other islands Total
Total revenue $ 50,970 20,121 71,091
Profit before tax 11,137 5,445 16,582
Total assets 154,339 57,653 211,992
Total liabilities 95,646 28,630 124,276
Purchase of fixed assets 238 1 239
Depreciation 260 35 295
THE NEW INDIA ASSURANCE COMPANY (TRINIDAD AND TOBAGO) LIMITED
NOTES TO FINANCIAL STATEMENTS - DECEMBER 31, 2009 (contd...)
SU
BS
ID
IA
RIE
SS
UB
SID
IA
RIE
SS
UB
SID
IA
RIE
SS
UB
SID
IA
RIE
SS
UB
SID
IA
RIE
S

fn U;w bafM;k ,';ksjUl da- fy-THE NEW INDIA ASSURANCE CO. LTD.
140
Estbd. 1919
2008
Details Trinidad & Tobago Other islands Total
Total revenue $ 42,239 19,913 62,152
Profit before tax 4,764 5,913 10,677
Total assets 135,712 47,193 182,905
Total liabilities 87,142 21,256 108,398
Purchase of fixed assets 541 3 544
Depreciation 201 38 239
19. Operating leases
2009 2008
Non-cancellable operating lease rentals are payable as follows:
Less than one year $ 51 1,128
Between one and five years $ 13 326
The company leases the facilities under operating leases. The leases typically run for a period of 1-3years, with an option to renew the lease after that date. Lease payments are increased on renewal toreflect market rentals.
During the year ended December 31, 2009 $1,430 (2008: $1,133) were recognised as an expense inthe statement of comprehensive income in respect of operating leases.
20. Related party transactions
(a) Identity of related party
The Company has a related party relationship with its parent and with its directors and executiveofficers.
(b) Related party transactions
A number of transactions have been entered into with related parties in the normal course ofbusiness. These transactions were conducted at market rates, on commercial terms and condition.
2009 2008(i) Income and expenses
Management fees $ 500 500
Reinsurance premiums $ 3,675 2,809
Directors' fees $ 108 98
Amounts due from related parties are disclosed in note 7.
THE NEW INDIA ASSURANCE COMPANY (TRINIDAD AND TOBAGO) LIMITED
NOTES TO FINANCIAL STATEMENTS - DECEMBER 31, 2009 (contd...)
SU
BS
ID
IA
RIE
SS
UB
SID
IA
RIE
SS
UB
SID
IA
RIE
SS
UB
SID
IA
RIE
SS
UB
SID
IA
RIE
S

okf"kZd fjiksVZANNUAL REPORT 2009-10
141
(c) Transactions with key management personnel
In addition to their salaries, the Company also provides non-cash benefits to executive officers.The key management personnel compensation is as follows:
2009 2008Short-term employee benefits
Accommodation $ 137 121
Vehicle $ - 29
21. Use of accounting estimates and judgments
The preparation of financial statements in conformity with IFRS requires management to make estimatesand assumptions that affect the reported amount of assets, liabilities, contingent assets and contingentliabilities at the date of the financial statements and income and expenses during the reporting period.Actual results could differ from these estimates.
Judgments made by management in the application of IFRS that have significant effect on the financial statementsand estimates with a significant risk of material adjustment in the next financial year are discussed below:
� Held-to-maturity investments
The company follows the guidance of IAS 39 on classifying non-derivative financial assets with fixed ordeterminable payments and fixed maturity as held-to-maturity. This classification requires judgement.In making this judgement, the company evaluates its intention and ability to hold such investments tomaturity. If the company fails to keep these investments to maturity other than for the specificcircumstances for example, selling other than an insignificant amount close to maturity it will berequired to reclassify the entire class as available-for-sale. The investments would therefore be measuredat fair value, not amortised cost. If the entire class of held-to-maturity investments is compromised,the fair value would be recorded in investments with a corresponding entry in the capital reserve inshareholders' equity
� Determining fair values
Fair value reflects the present value of future cash flows associated with a financial asset or liabilitywhere an active market exists. Observable market prices or rates are used to determine fair value.For financial instruments with no active market or a lack of price transparency, fair values are estimatedusing calculation techniques based on factors such as discount rates, credit risk and liquidity. Theassumptions and judgements applied here affect the derived fair value of the instruments.
� Impairment of assets
The identification of impairment and the determination of recoverable amounts is an intently uncertainprocess involving various assumptions and factors, including the financial condition of the counterparty,expected future cash flows, observable market prices and expected net selling prices.
� Litigation
There are certain legal proceedings outstanding against the Company. Appropriate provision hasbeen made in these financial statements to reflect the loss that in management's opinion is likely tooccur.
THE NEW INDIA ASSURANCE COMPANY (TRINIDAD AND TOBAGO) LIMITED
NOTES TO FINANCIAL STATEMENTS - DECEMBER 31, 2009 (contd...)
SU
BS
ID
IA
RIE
SS
UB
SID
IA
RIE
SS
UB
SID
IA
RIE
SS
UB
SID
IA
RIE
SS
UB
SID
IA
RIE
S

fn U;w bafM;k ,';ksjUl da- fy-THE NEW INDIA ASSURANCE CO. LTD.
142
Estbd. 1919
THE NEW INDIA ASSURANCE COMPANY (SIERRA LEONE) LIMITED
DIRECTORS’ REPORT
The directors present their annual report together with the financial statements for the year ended 31 December2009.
STATEMENT OF DIRECTORS RESPONSIBILITIES
Company law requires the directors to prepare financial statements for each year which give a true and fairview of the state of affairs of the Company and of the profit or loss of the Company for the period. In preparingthose financial statements, the Directors are required to:
- select suitable accounting policies and then apply them consistently;
- make judgements and estimates that are reasonable and prudent;
- state whether applicable accounting standards have been followed, subject to any material departuresdisclosed and explained in the financial statements;
- prepare the financial statements on the going concern basis unless it is inappropriate to presume thatthe Company will continue in business.
The Directors are responsible for keeping proper accounting records which disclose with reasonable accuracyat any time the financial position of the Company and to enable them to ensure that the financial statementscomply with the Companies Act Cap 249. They are also responsible for safeguarding the assets of the Companyand hence for taking reasonable steps for the prevention and detection of fraud and other irregularities.
PRINCIPAL ACTIVITY
The principal activity of the Company continued to be that of carrying on insurance business. However, theCompany has ceased business operations with effect from 1 January 2003.
The liabilities include ‘Dues to Insurance Companies’ which is due to New India in Mumbai as the reinsurer ofthe company’s operations in certain areas.
DIRECTORS
The directors as at 31 December 2009, and their interests in the Share Capital of the Company were asfollows:
Shares ofEnd of year Beginning of year
I.S. Phukela - -M Vasnatha Krishna - -
AUDITORS
In accordance with Section 130 of the Companies Act Cap 249 of the Laws of Sierra Leone a resolution for the re-appointment of PKF, as Auditors of the Company is to be proposed at the forthcoming Annual General Meeting.
TRADING RESULTS
The results for the year and other key indicators are set out in the attached financial statements. The Companymade a profit for the financial year of Le4,917,971, which resulted in an accumulated profit of Le 5,019,348.
The Directors do not recommend the payment of dividend for the year.
BY ORDER OF THE BOARD
26.5.2010 SECRETARY
SU
BS
ID
IA
RIE
SS
UB
SID
IA
RIE
SS
UB
SID
IA
RIE
SS
UB
SID
IA
RIE
SS
UB
SID
IA
RIE
S

okf"kZd fjiksVZANNUAL REPORT 2009-10
143
AUDITORS' REPORT TO THE SHAREHOLDERS OFTHE NEW INDIA ASSURANCE COMPANY (SIERRA LEONE) LIMITED
We have audited the financial statements on pages 144 to 147 which have been prepared under the accountingpolicies set out on page 145.
Respective responsibilities of Directors and Auditors
As described on page 142 the Company's Directors are responsible for the preparation of financial statements. Itis our responsibility to form an independent opinion, based on our audit, on those statements and to report ouropinion to you.
Basis of Opinion
We conducted our audit in accordance with Auditing Standards. An audit includes examination, on a test basis, ofevidence relevant to the amounts and disclosures in the financial statements. It also includes an assessment ofthe significant estimates and judgements made by the directors in the preparation of the financial statements, andof whether the accounting policies are appropriate to the Company's circumstances, consistently applied andadequately disclosed.
We planned and performed our audit so as to obtain all the information and explanations which we considerednecessary in order to provide us with sufficient evidence to give reasonable assurance that the financial statementsare free from material misstatement, whether caused by fraud or other irregularity or error. In forming ouropinion we also evaluated the overall adequacy of the presentation of information in the financial statements.
Going Concern
We draw attention to note 10 which states that the Company has turned in to a deficiency of net assets amountingto Le 3,177,000 this year.
Opinion
In our opinion the financial statements give a true and correct view of the state of the Company's affairs as at 31December 2009 and of its results for the year then ended and have been properly prepared in accordance withthe Companies Act Cap 249, and the Insurance Act 2000.
FREETOWN26.4.2010 Chartered Accountants
SU
BS
ID
IA
RIE
SS
UB
SID
IA
RIE
SS
UB
SID
IA
RIE
SS
UB
SID
IA
RIE
SS
UB
SID
IA
RIE
S

fn U;w bafM;k ,';ksjUl da- fy-THE NEW INDIA ASSURANCE CO. LTD.
144
Estbd. 1919
THE NEW INDIA ASSURANCE COMPANY (SIERRA LEONE) LIMITED
PROFIT AND LOSS ACCOUNT – 31 DECEMBER 2009
Notes 2009 2008Le 000 Le 000
Investment Income 20,245 35,563
Other Income - -
20,245 35,563
Operating Expenses (15,327) (13,114)
Profit Before Taxation 4,918 22,449
Taxation 3 (1,475) -
Profit After Taxation 2 3,443 22,449
Movement on reserves is set out in note 9.
BALANCE SHEET – 31 DECEMBER 2009
Notes 2009 2008
Le 000 Le 000 Le 000 Le 000
Fixed Assets
Tangible assets 4 - -
Investments 5 240,000 300,000
Current Assets
Debtors 6 18,978 31,598
Deposits, bank and cash balances 104,163 24,625
123,141 56,223Creditors
Amounts falling due within one year 7 (366,318) (362,843)
(366,318) (362,843)
Net Current Liabilities (243,177) (306,620)
Total Assets Less Current Liabilities (3,177) (6,620)
Capital And Reserves
Called up share capital 8 500 500
Profit and loss account 9 5,019 1,576
Exchange equalisation account (20,910) (20,910)
Contingency reserve 12,214 12,214
(3,177) (6,620)
Approved by the Board on 26th April, 2010
I.S. Phukela (Director) M. Vasantha Krishna (Director )
SU
BS
ID
IA
RIE
SS
UB
SID
IA
RIE
SS
UB
SID
IA
RIE
SS
UB
SID
IA
RIE
SS
UB
SID
IA
RIE
S

okf"kZd fjiksVZANNUAL REPORT 2009-10
145
THE NEW INDIA ASSURANCE COMPANY (SIERRA LEONE) LIMITED
CASH FLOW STATEMENT YEAR ENDED 31 DECEMBER 2009
Notes 2009 2008
Le 000 Le 000 Le 000 Le 000
OPERATING ACTIVITIES
Operating profit before taxation 4,918 22,449
Decrease/(Increase) in debtors 12,620 (22,764)
Net cash inflow/(outflow) from operating activities 17,538 (315)
FINANCING ACTIVITIES
Exchange gain - -
Net cash inflow/(outflow) from financing activities - -
Net cash inflow/(outflow) 17,538 (315)
Analysis of changes in cash and cashequivalents during the year: 2,000 -
Beginning of year 24,625 2,054
Net cash outflow/(outflow) 17,538 (315)
Less: Transfer from Fixed deposits 60,000 22,886
End of year 104,163 24,625
NOTES TO THE FINANCIAL STATEMENTS YEAR ENDED 31 DECEMBER 2009
1. ACCOUNTING POLICIES
The following accounting policies have been used consistently in dealing with items which are consideredmaterial to the Company's affairs:
(a) Accounting convention
The financial statements set out on pages 4 to 11 are prepared under the historical costconvention.
2. PROFIT FOR THE FINANCIAL YEAR
Profit for the financial year is stated after charging the following:
2009 2008
Le 000 Le 000Auditors' remuneration 7,000 5,000
3. TAXATION
No provision has been made for taxation as there was an adjusted loss for the year.
SU
BS
ID
IA
RIE
SS
UB
SID
IA
RIE
SS
UB
SID
IA
RIE
SS
UB
SID
IA
RIE
SS
UB
SID
IA
RIE
S

fn U;w bafM;k ,';ksjUl da- fy-THE NEW INDIA ASSURANCE CO. LTD.
146
Estbd. 1919
THE NEW INDIA ASSURANCE COMPANY (SIERRA LEONE) LIMITED
NOTES TO THE FINANCIAL STATEMENTS YEAR ENDED 31 DECEMBER 2009
4. TANGIBLE FIXED ASSETS
Motor Office Residential Totalvehicles fixtures equipment
and fittings
COST Le 000 Le 000 Le 000 Le 000Beginning and end of year - - - -
________ ________ ________ ________DEPRECIATIONBeginning of year and end of year - - - -
________ ________ ________ ________Charge - - - -Disposals - - - -
________ ________ ________ ________End of year - - - -
________ ________ ________ ________NET BOOK AMOUNTEnd of year and beginning of year - - - -
________ ________ ________ ________
5. INVESTMENTS
Investments comprised : 2009 2008Le000 Le000
Treasury Bill - 52,733
Deposit with the Bank of Sierra Leone - 7,267
Deposit with Rokel Commercial Bank Sierra Leone Ltd 240,000 240,000
240,000 300,0006. DEBTORS
Debtors comprised :
Taxation 8,669 8,669
Sundry debtors 165 165
Interest receivable 10,144 22,764
18,978 31,5987. CREDITORS
Amounts falling due within one year comprised:Sundry creditors 12,343 8,868
Amounts due to Insurance Companies 353,975 353,975
366,318 362,843
8. CALLED UP SHARE CAPITALCalled up share capital comprised allotted, called up and fully paid ordinary shares of Le2.00 each. Theauthorised share capital of the company throughout the year was Le500,000 divided into 250,000ordinary shares of Le2.00 each.
SU
BS
ID
IA
RIE
SS
UB
SID
IA
RIE
SS
UB
SID
IA
RIE
SS
UB
SID
IA
RIE
SS
UB
SID
IA
RIE
S

okf"kZd fjiksVZANNUAL REPORT 2009-10
147
THE NEW INDIA ASSURANCE COMPANY (SIERRA LEONE) LIMITED
NOTES TO THE FINANCIAL STATEMENTS YEAR ENDED 31 DECEMBER 2009
9. PROFIT AND LOSS ACCOUNT
The movement on this account during the year was as follows:
Le 000Beginning of year 1,576Profit for the year 3,443End of year 5,019
10. GOING CONCERNThe Directors have confirmed their intention to maintain financial support for the foreseeable future toenable the Company to continue normal operations. The financial statements are therefore drawn on agoing concern basis.
11. LIBERIA BRANCHIn view of the current situation in Liberia, the financial statements for 2008 as in the case of 2002 to2007 represent only the transactions of the Freetown office.
12. CAPITAL COMMITMENTSThere were no capital commitments at 31 December 2009.
13. CONTINGENT LIABILITIESThe Company had denied liability for claims amounting to 8,679,769 United States Dollars and 7,770,556Liberian Dollars on the Liberia Branch arising from the situation in Liberia. There is pending litigation forwhich the Company has obtained legal opinion that it will incur no liability on these claims.
SHORT TERM BUSINESS REVENUE ACCOUNT YEAR ENDED 31 DECEMBER 2009
Notes 2009 2008
Le 000 Le 000 Le 000 Le 000
Premiums written less reinsurance - -Less increase/decrease in provision for unearned premiums - -
Premiums earned - -Commission received from reinsurers - -
- -Claims incurred - -Commission paid - -Expenses 15,327 13,114Contigency reserve - -
15,327 13,114
Underwriting (loss) 15,327 13,114
Underwriting (loss) comprised:Fire - -Marine - -Motor - -Miscellaneous accident - -Expenses 15,327 12,329
15,327 12,329
SU
BS
ID
IA
RIE
SS
UB
SID
IA
RIE
SS
UB
SID
IA
RIE
SS
UB
SID
IA
RIE
SS
UB
SID
IA
RIE
S

fn U;w bafM;k ,';ksjUl da- fy-THE NEW INDIA ASSURANCE CO. LTD.
148
Estbd. 1919
REPORT OF THE AUDITORS TO THE MEMBERS OF
PRESTIGE ASSURANCE PLC
REPORT ON THE FINANCIAL STATEMENTS
We have audited the accompanying financial statements of Prestige Assurance Plc, as at 31 December 2009,set out on pages 154 to 162 which have been prepared on the basis of the significant accounting policies on pages149 to 153 and other explanatory notes on pages 163 to 173.
DIRECTORS’ RESPONSIBILITY FOR THE FINANCIAL STATEMENTS
The Directors are responsible for the preparation and fair presentation of these financial statements in accordancewith the Companies and Allied Matters Act CAP C20 LFN 2004. This responsibility includes: designing,implementing and maintaining internal control relevant to the preparation and fair presentation of financialstatements that are free from material misstatement, whether due to fraud or error; selecting and applyingappropriate accounting policies; and making accounting estimates that are reasonable in the circumstances.
AUDITORS’ RESPONSIBILITY
Our responsibility is to express an opinion on these financial statements based on our audit. We conducted ouraudit in accordance with International Standards on Auditing. Those standards require that we comply withethical requirements and plan and perform the audit to obtain reasonable assurance as to whether the financialstatements are free from material misstatement.
An audit involves performing procedures to obtain audit evidence about the amounts and disclosures in thefinancial statements. The procedures selected depend on the auditors’ judgement, including the assessment ofthe risks of material misstatement of the financial statements, whether due to fraud or error. In making thoserisk assessments, the auditors consider internal control relevant to the entity’s preparation and fair presentationof the financial statements in order to design audit procedures that are appropriate in the circumstances, but notfor the purpose of expressing an opinion on the effectiveness of the entity’s internal control. An audit alsoincludes evaluating the appropriateness of accounting policies used and the reasonableness of accountingestimates made by management, as well as evaluating the overall presentation of the financial statements.
We believe that the audit evidence we have obtained is sufficient and appropriate to provide a basis for our auditopinion.
OPINION
In our opinion, the Company has kept proper accounting records and the financial statements are in agreementwith the records in all material respects and give in the prescribed manner, information required by the Companiesand Allied Matters Act CAP C20 LFN 2004, the applicable provisions of the Insurance Act CAP 117 LFN 2004and relevant guidelines issued by the National Insurance Commission. The financial statements give a true andfair view of the financial position of Prestige Assurance Plc as at 31 December 2009, and of its financialperformance and its Cash flows for the year then ended in accordance with the Statement of Accounting Standardsissued by the Nigerian Accounting Standards Board.
Chartered AccountantsLagos, Nigeria
SU
BS
ID
IA
RIE
SS
UB
SID
IA
RIE
SS
UB
SID
IA
RIE
SS
UB
SID
IA
RIE
SS
UB
SID
IA
RIE
S

okf"kZd fjiksVZANNUAL REPORT 2009-10
149
PRESTIGE ASSURANCE PLC
STATEMENT OF ACCOUNTING POLICIES YEAR ENDED 31 DECEMBER, 2009
The following are the significant accounting policies adopted by the Company in the preparation of its financialstatements. These policies have been constantly applied to all year's presentations, unless otherwise stated.
1. BASIS OF ACCOUNTING
The financial statements are prepared in compliance with Nigerian Statements of Accounting Standards(SAS). The financial statements are presented in the functional currency, Nigeria naira and preparedunder the historical cost convention.
The preparation of financial statements in conformity with generally accepted accounting principlesrequires the use of estimates and assumptions that affect the reported amounts of assets and liabilitiesand disclosure of contingent assets and liabilities at the date of the financial statements and the reportedamounts of revenues and expenses during the reporting period.
The Annual accounting basis is used to determine the underwriting result of each class of insurancebusiness written.
2. PROPERTY, PLANT & EQUIPMENT
Property, plant and equipment are stated at the cost, less depreciation on a straight-line basis over theestimated useful life of the assets, taking into consideration any residual value, excluding the costs ofday-to-day servicing.
An item of property, plant and equipment is derecognised upon disposal or when no future economicbenefits are expected from its use. Any gain or loss arising on derecognition of the asset (calculated asthe difference between the net disposal proceeds and the carrying amount of the asset) is included inthe income statement in the year the asset is derecognised.
Assets on lease are accounted for in accordance with the substance and financial reality of the transaction.Depreciation is provided to write off the related assets over the period of the lease.
Income from assets on lease is accrued evenly over the respective period of the leases.
3. DEPRECIATION OF PROPERTY, PLANT & EQUIPMENT
Depreciation is calculated to write off the cost of property, plant & equipment during their expecteduseful lives on a straight-line basis. In the case of revalued property, plant & equipment, depreciation iscalculated by reference to the enhanced value of the assets concerned. The principal annual rates ofdepreciation, which are consistent with those of previous years, are:
Leasehold Land & Buildings - 2% or amortised over the life of lease if less than50 years
Furniture, Fittings & Equipment - 10%
Computers - 331/3%
Motor Vehicles - 25%
Plant & Machinery - 121/2%
SU
BS
ID
IA
RIE
SS
UB
SID
IA
RIE
SS
UB
SID
IA
RIE
SS
UB
SID
IA
RIE
SS
UB
SID
IA
RIE
S

fn U;w bafM;k ,';ksjUl da- fy-THE NEW INDIA ASSURANCE CO. LTD.
150
Estbd. 1919
Depreciation is not calculated on property, plant & equipment until they are brought into use. Gains orlosses on disposal of property, plant and equipment are determined by reference to their carrying amountand are taken into account in determining operating profit or loss.
4. PROVISION FOR UNEXPIRED RISKS
Reserves for unexpired risks are those proportions of the premiums written in a year, less re-insurance,that relate to the period of risks from January in the following accounting year to the subsequent date ofexpiry of the policies and have been computed in accordance with Section 20(1)(a) of the Insurance Act2003, which stipulates that provision for unexpired risk shall be calculated on a time apportionmentbasis of the risks accepted in the year.
5. PROVISION FOR OUTSTANDING CLAIMS/INCURRED BUT NOT YET REPORTED
Full provision is made for the estimated amount of outstanding claims notified but not settled at the dateof the balance sheet, less reinsurance recoveries, using the best information available at that time.Provision is also made for the cost of claims incurred but not reported (IBNR) until after the balancesheet date on the basis of claims notified but not settled in compliance with the provisions of Section20(1) (b) of the Insurance Act 2003. Similarly, provisions are made for "unallocated claims expenses"being the estimated administrative expenses that will be incurred after the balance sheet date in settlingall claims outstanding as at the date, including IBNR.
Differences between the provisions for outstanding claims at a balance sheet date and the subsequentsettlement are included in the revenue Account of the following year.
6. CONTINGENCY RESERVE
Contingency reserve is calculated at 3% of the total premium or 20% of the Net Profit before tax whichever is greater in accordance with Section 21(2) of the Insurance Act 2003 until the accumulated reservereaches the amount of the minimum paid-up capital or 50 per centum of the net premiums (which everis greater).
7. FOREIGN CURRENCIES TRANSLATION
The financial statements are presented in Naira, which is the Company's functional and presentationcurrency. Income and expenses denominated in foreign currencies are translated to the Naira at therates of exchange ruling at the date of the transaction. Monetary assets and liabilities denominated inforeign currency balances are converted to the Naira at the applicable rates of exchange ruling at thebalance sheet date. Any profits or loss arising on the conversion of foreign currencies is included inthe profit and loss account.
8. INVESTMENTS
Long-term investments are stated at cost or revalued amount on Balance Sheet date while short-terminvestments are stated at cost less provision for diminution in values.
No provision is made for diminution in the market value of government securities, as it is the Company'spolicy to hold such Securities until maturity.
PRESTIGE ASSURANCE PLC
STATEMENT OF ACCOUNTING POLICIES YEAR ENDED 31 DECEMBER, 2009 (Contd...)
SU
BS
ID
IA
RIE
SS
UB
SID
IA
RIE
SS
UB
SID
IA
RIE
SS
UB
SID
IA
RIE
SS
UB
SID
IA
RIE
S

okf"kZd fjiksVZANNUAL REPORT 2009-10
151
9. INVESTMENT INCOME
Interest and rental income are shown gross and are accounted for on accrual basis. Dividends are accountedfor on the basis of the amounts actually received during the year.
10. DEBTORS
Debtors are recognized and earned at the original invoice amounts less an allowance for any Un-collectibleamounts. Specific provision is made where there is objective evidence that the Collection of any debt isconsidered doubtful. Debts considered irrecoverable are written off.
11. EMPLOYEES' RETIREMENT BENEFITS
i) Pension Fund Scheme
The Company operates a defined contributory retirement benefits scheme for members of staff, whichis independent of its finances and is managed by Pension Fund Administrators. The Scheme, whichis funded by contributions from the Company (15%), is consistent with the provisions of the PensionReform Act 2004. The company's contribution in each year is charge against income and is includedin staff cost.
ii) Gratuity Scheme
The company operates a non-contributory and unfunded defined benefit service gratuity scheme forits employees. The employees' entitlement to retirement benefits under the service gratuity schemedepends on the individual years of service, terminal salary and conditions of service. Benefits payableto employees on retirements or resignation are accrued over the service life of the employee concernedbased on current salary at the balance sheet date. The Company's contribution to the service gratuityscheme is charged to the income statement.
12. TAXATION
Income tax expense is the aggregate of the charge to the profit and loss account in respect of currentincome tax, education tax and deferred income/capital gains tax.
i) Income Tax
Income tax payable is provided by applying the currently enacted tax rates on the profit of thecompany as adjusted for taxation purposes.
ii) Deferred Taxation
Deferred taxation, which arises from timing differences in the recognition of items for accountingand tax purposes, is calculated using the liability method. Deferred income tax assets and liabilitiesare measured at the rates that are expected to apply to the year when the asset is realized or theliability settled, based on tax rates and tax laws that have been enacted at the balance sheet date.
iii) Capital Gain Tax
Capital Gain Tax is included in the tax expenses for the period to which it relates. Capital Gain Taxrelating to a disposal of an extra ordinary item is deducted from such item.
PRESTIGE ASSURANCE PLC
STATEMENT OF ACCOUNTING POLICIES YEAR ENDED 31 DECEMBER, 2009 (Contd...)
SU
BS
ID
IA
RIE
SS
UB
SID
IA
RIE
SS
UB
SID
IA
RIE
SS
UB
SID
IA
RIE
SS
UB
SID
IA
RIE
S

fn U;w bafM;k ,';ksjUl da- fy-THE NEW INDIA ASSURANCE CO. LTD.
152
Estbd. 1919
iv) Value Added Tax
Non-recoverable VAT paid in respect of an expensed. Non-recoverable VAT paid in respect ofproperty, plant & equipment is capitalized as part of the cost of the property, plant and equip-ment.
The net amount owing to or due from the tax authority is included in the recoverable VAT outstandingfor over three years is fully provided for output VAT is excluded from the turnover shown in theprofit and loss account.
v) Withholding Tax
The withholding tax credit is used to set off against income tax payable. Tax credit, which isconsidered irrecoverable, is written off as part of the tax charge for the year.
13. CLAIMS
Claims paid are stated alongside amounts recoverable from re-insurers.
14. MAINTENANCE EXPENSES
Maintenance expenses are apportioned amongst the various classes of insurance business on thebasis of net premium earned in each class.
15. PREMIUM
Full credit is taken for premium receivable upon the issuance of the related policies.
16. COMMISSION
Commissions are accounted for in the profit and loss account in the period they are incurred andcalculated on a time basis of the risks accepted in the year.
17. ASSETS ON LEASE
Assets on lease to customers are stated at cost less accumulated depreciation. Depreciation is providedon an appropriate basis to write-off the related assets cost over the period of the lease, and is includedin operating expenses. Rental income from assets on lease to customers is credited to lease income ona consistent basis over the lease term.
18. PROVISIONS
Provisions is recognized when the Company has present obligation, whether legal or constructive, as aresult of a past event for which it is possible that an outflow of a resources embodying economic benefitwill be recognized to settle the obligation in accordance with the statement of Accounting Standard (SAS23).
19. UNCLAIMED DIVIDEND
Unclaimed Dividends are amounts payable to shareholders in respect of dividend previously declaredby the company, which have remained unclaimed by the shareholder. In compliance with section 385 ofthe Companies and Allied Matters Act Cap C20, Laws of the Federation of Nigeria 2004, unclaimeddividend after twelve years are transferred to general reserves.
PRESTIGE ASSURANCE PLC
STATEMENT OF ACCOUNTING POLICIES YEAR ENDED 31 DECEMBER, 2009 (Contd...)
SU
BS
ID
IA
RIE
SS
UB
SID
IA
RIE
SS
UB
SID
IA
RIE
SS
UB
SID
IA
RIE
SS
UB
SID
IA
RIE
S

okf"kZd fjiksVZANNUAL REPORT 2009-10
153
PRESTIGE ASSURANCE PLC
STATEMENT OF ACCOUNTING POLICIES YEAR ENDED 31 DECEMBER, 2009 (Contd...)
20. CASH AND CASH EQUIVALENT
For the purpose of reporting cash flows, cash and cash equivalents include cash on hand; cash balanceswith banks and bank overdrafts.
21. DIVIDEND PAYABLE
Proposed dividend for the year, is recognized as a liability after the balance sheet date when declaredand approved by shareholders at the Annual General Meeting.
22. DEFERRED ACQUISITION EXPENSES
Prepaid expenses include deferred acquisition expenses. These expenses are incurred as a result ofdirect business earned from brokers. The deferred portion is calculated based on the percentage ofunearned premium to written premium.
23. REINSURANCE PREMIUM COST (INCLUDING PREPAID REINSURANCE PREMIUM)
Reinsurance cost have been apportioned on time basis. Therefore, unexpired portion has beenrecognized as assets in the balance sheet.
SU
BS
ID
IA
RIE
SS
UB
SID
IA
RIE
SS
UB
SID
IA
RIE
SS
UB
SID
IA
RIE
SS
UB
SID
IA
RIE
S

fn U;w bafM;k ,';ksjUl da- fy-THE NEW INDIA ASSURANCE CO. LTD.
154
Estbd. 1919
PRESTIGE ASSURANCE PLC
BALANCE SHEET AT 31 DECEMBER, 2009
ASSETS Notes 2009 2008N N
Cash 323,517,834 237,945,206Short term investments 1 2,419,812,758 1,993,167,752Debtors 2 1,372,880,532 1,589,421,964Defered Acquisition Expenses 3 118,503,599 35,562,100Outstanding Claims Recoverable 24 474,313,227 -Prepaid Reinsurance Premium 24 303,771,004 -Long term investments 4 1,016,941,414 1,227,727,315Statutory Deposit 5 300,000,000 300,000,000Fixed Assets 6 608,196,301 561,624,216
TOTAL ASSETS 6,937,936,669 5,945,448,553
LIABILITIES
Creditors:
Amount falling due within one year 7 769,579,070 740,418,207
Taxation 18a 289,154,591 326,858,290
Insurance Funds 8 1,471,348,246 451,628,778Deferred taxation 18b 64,133,940 56,919,315
2,594,215,847 1,575,824,590SHAREHOLDERS’ FUNDS
Share Capital 9 1,074,992,330 1,074,992,330Share Premium 10 1,349,985,726 1,349,985,726Statutory Contingency Reserve 11 957,947,969 783,264,667Investment Revaluation Reserve 12 - 188,978,516General Reserve 13 960,794,797 972,402,724
4,343,720,822 4,369,623,963
TOTAL LIABILITIES 6,937,936,669 5,945,448,553
Approved by the Board
DIRECTORS
The statement of significant accounting policies on pages 2 to 5 and accompanying notes on pages 15 to 20form part of these Financial Statements.
SU
BS
ID
IA
RIE
SS
UB
SID
IA
RIE
SS
UB
SID
IA
RIE
SS
UB
SID
IA
RIE
SS
UB
SID
IA
RIE
S

okf"kZd fjiksVZANNUAL REPORT 2009-10
155
PRESTIGE ASSURANCE PLC
PROFIT AND LOSS ACCOUNT YEAR ENDED 31 DECEMBER, 2009
Notes 2009 2008 N N N N
GROSS PREMIUM WRITTEN 3,445,446,799 3,008,390,602
GROSS PREMIUM EARNED 2,958,600,333 2,964,452,742
NET PREMIUM EARNED 14 1,655,870,303 1,532,178,469
Commission Received 307,270,794 335,958,052
1,963,141,097 1,868,136,521Less:
Net Claims incurred 416,359,324 356,629,082
Underwriting Expenses 15 844,376,035 691,816,693
(1,260,735,359) (1,048,445,775)
UNDERWRITING PROFITS 702,405,738 819,690,746Investment Income:
Interests Received 339,947,546 333,811,194 Lease Rental Income 528,724,211 418,027,422 Dividends Received 28,631,289 41,130,759 Profit on disposal of investment 37,423,256 116,330,696 Profit on disposal of fixed Assets 1,771,724 2,165,698
936,498,026 911,465,769Other Incomes 16 18,143,186 3,869,499
1,657,046,950 1,735,026,014Less:
Expenses of Management 624,367,584 589,568,805Provision for Bad and Doubtful Debts 159,262,854 145,436,797
(783,630,438) (735,005,602)
Profit before tax 873,416,512 1,000,020,412Information Tech Dev. levy (8,734,165) (10,000,204)
Profit before tax after I.T.D. Levy 864,682,347 990,020,208Income Taxation 18.1 (264,395,414) (290,943,224)Deferred Tax (7,214,625) 12,571,591
Profit after tax 593,072,308 711,648,575
APPROPRIATION:
Statutory Contingency Reserve 11 (174,683,302) (198,004,042)
Retained Earnings 13 418,389,006 513,644,533
Earnings per share (actual) 23 27.58 33.10
The statement of significant accounting policies on pages 2 to 5 and accompanying notes on pages 15 to 20 formpart of these Financial Statements.
SU
BS
ID
IA
RIE
SS
UB
SID
IA
RIE
SS
UB
SID
IA
RIE
SS
UB
SID
IA
RIE
SS
UB
SID
IA
RIE
S

fn U;w bafM;k ,';ksjUl da- fy-THE NEW INDIA ASSURANCE CO. LTD.
156
Estbd. 1919
2009 2008N N
IN RESPECT OF ACCIDENT INSURANCE BUSINESS
Premiums (direct) 411,892,940 694,473,158
Inward reinsurance premiums 306,754,497 74,709,794
Gross premiums written 718,647,437 769,182,952
Decrease/(Increase) in provisionfor unexpired risks (120,571,906) (12,734,354)
Gross premiums earned 598,075,531 756,448,598
Outward reinsurance premiums (310,707,760) (570,791,632)
Decrease/(Increase) in prepaid reinsurance 93,775,364 -
Reinsurance Cost (216,932,396) (570,791,632)
Net premium Earned 381,143,135 185,656,966
Commission received 99,905,493 139,220,221
TOTAL INCOME 481,048,628 324,877,187
Claims paid (direct) 72,383,280 97,964,104
Inward claims paid 1,918,125 -
Gross claims paid 74,301,405 97,964,104
Increase/(Decrease) in outstanding claims 21,585,125 (687,511)
Gross claims incurred 95,886,530 97,276,593
Outward reinsurance recoveries (66,829,722) (45,161,625)
Net claims incurred 29,056,808 52,114,968
Acquisition cost 122,195,838 90,372,832
Maintenance expenses 100,504,530 103,441,971
Profit to Profit and Loss Account 229,291,452 78,947,416
481,048,628 324,877,187
PRESTIGE ASSURANCE PLC
REVENUE ACCOUNT FOR THE YEAR ENDED 31 DECEMBER, 2009
SU
BS
ID
IA
RIE
SS
UB
SID
IA
RIE
SS
UB
SID
IA
RIE
SS
UB
SID
IA
RIE
SS
UB
SID
IA
RIE
S

okf"kZd fjiksVZANNUAL REPORT 2009-10
157
2009 2008N N
IN RESPECT OF WORKMEN COMPENSATIONINSURANCE BUSINESS
Premiums (direct) 56,657,891 37,475,730
Inward reinsurance premiums 220,144 -
Gross premiums written 56,878,035 37,475,730
Decrease/(Increase) in provisionfor unexpired risks (3,195,318) 4,775,691
Gross premiums earned 53,682,717 42,251,421
Outward reinsurance premiums - -
Decrease/(Increase) in prepaid reinsurance - -
Reinsurance Cost - -
Net premiums earned 53,682,717 42,251,421
Commission received - -
TOTAL INCOME 53,682,717 42,251,421
Claims paid (direct) 27,226,383 33,913,961
Inward claims paid 3,395,597 -
Gross claims paid 30,621,980 33,913,961
Increase/(Decrease) in outstanding claims (15,955,500) 22,627,000
Gross claims incurred 14,666,480 56,540,961
Outward reinsurance recoveries - -
Net claims incurred 14,666,480 56,540,961
Acquisition cost 6,365,367 5,157,439
Maintenance Cost 7,954,527 5,039,846
Profit/(Loss) to Profit and Loss Account 24,696,343 (24,486,825)
53,682,717 42,251,421
PRESTIGE ASSURANCE PLC
REVENUE ACCOUNT FOR THE YEAR ENDED 31 DECEMBER, 2009 (Contd...)
SU
BS
ID
IA
RIE
SS
UB
SID
IA
RIE
SS
UB
SID
IA
RIE
SS
UB
SID
IA
RIE
SS
UB
SID
IA
RIE
S

fn U;w bafM;k ,';ksjUl da- fy-THE NEW INDIA ASSURANCE CO. LTD.
158
Estbd. 1919
2009 2008N N
IN RESPECT OF MOTOR INSURANCE BUSINESS
Premiums (direct) 342,122,123 299,927,220
Inward reinsurance premiums 3,307,976 3,314,762
Gross premiums written 345,430,099 303,241,982
Decrease/(Increase) in provisionfor unexpired risks (39,920,654) 3,523,437
Gross premiums earned 305,509,445 306,765,419
Outward reinsurance premiums (2,779,022) (3,882,822)
Decrease/(Increase) in prepaid reinsurance - -
Reinsurance Cost (2,779,022) (3,882,822)
Net Premiums earned 302,730,423 302,882,597
Commission received 486,328 -
TOTAL INCOME 303,216,751 302,882,597
Claims paid (direct) 83,792,782 80,993,214
Inward claims paid - -
Gross claims paid 83,792,782 80,993,214
Increase/(Decrease) in outstanding claims (15,551,250) 24,674,650
Gross Claims incurred 68,241,532 105,667,864
Outward reinsurance recoveries - -
Net Claims incurred 68,241,532 105,667,864
Acquisition cost 22,495,709 20,433,891
Maintenance expenses 48,309,210 40,780,868
Profit to Profit and Loss Account 164,170,300 135,999,974
303,216,751 302,882,597
PRESTIGE ASSURANCE PLC
REVENUE ACCOUNT FOR THE YEAR ENDED 31 DECEMBER, 2009 (Contd...)
SU
BS
ID
IA
RIE
SS
UB
SID
IA
RIE
SS
UB
SID
IA
RIE
SS
UB
SID
IA
RIE
SS
UB
SID
IA
RIE
S

okf"kZd fjiksVZANNUAL REPORT 2009-10
159
2009 2008N N
IN RESPECT OF MARINE AND AVIATIONINSURANCE BUSINESS
Premiums (direct) 835,678,607 741,010,835
Inward reinsurance premiums 104,417,059 63,922,276
Gross premiums written 940,095,666 804,933,111
Decrease/(Increase) in provisionfor unexpired risks (100,605,620) (23,798,472)
Gross premiums earned 839,490,046 781,134,639
Outward reinsurance premiums (483,546,207) (373,102,002)
Decrease/(Increase) in prepaid reinsurance 9,513,902 -
Reinsurance Cost (474,032,305) (373,102,002)
Net Premiums earned 365,457,741 408,032,637
Commission received 86,192,240 60,966,644
TOTAL INCOME 451,649,981 468,999,281
Claims paid (direct) - 177,455,664
Inward claims paid 287,020,785 -
Gross claims paid 287,020,785 177,455,664
Increase/(Decrease) in outstanding claims 5,058,328 56,353,649
Gross Claim Incurred 292,079,113 233,809,313
Outward reinsurance recoveries (231,202,138) (115,745,644)
Net Claims incurred 60,876,976 118,063,669
Acquisition cost 77,617,867 42,499,360
Maintenance expenses 131,474,585 108,249,757
Profit to Profit and Loss Account 181,680,554 200,186,495
451,649,981 468,999,281
PRESTIGE ASSURANCE PLC
REVENUE ACCOUNT FOR THE YEAR ENDED 31 DECEMBER, 2009 (Contd...)
SU
BS
ID
IA
RIE
SS
UB
SID
IA
RIE
SS
UB
SID
IA
RIE
SS
UB
SID
IA
RIE
SS
UB
SID
IA
RIE
S

fn U;w bafM;k ,';ksjUl da- fy-THE NEW INDIA ASSURANCE CO. LTD.
160
Estbd. 1919
2009 2008N N
IN RESPECT OF FIRE INSURANCE BUSINESS
Premiums (direct) 1,253,821,482 1,063,821,649
Inward reinsurance premiums 130,574,080 29,735,178
Gross premiums written 1,384,395,562 1,093,556,827
Decrease/(Increase) in provision for unexpired risks (222,552,968) (15,704,162)
Gross premiums earned 1,161,842,594 1,077,852,665
Outward reinsurance premiums (809,468,045) (484,497,817)
Decrease/(Increase) in prepaid reinsurance 200,481,738 -
Reinsurance Cost (608,986,307) (484,497,817)
Net Premiums earned 552,856,287 593,354,848
Commission received 120,686,733 135,771,187
TOTAL INCOME 673,543,020 729,126,035
Claims paid (direct) 543,787,676 544,562,233
Inward claims paid 1,781,326 -
Gross claims paid 545,569,002 544,562,233
Increase/(Decrease) in outstanding claims 63,423,070 (38,446,810)
Gross claims incurred 608,992,072 506,115,423
Outward reinsurance recoveries (365,474,543) (481,873,803)
Net Claims incurred 243,517,529 24,241,620
Acquisition cost 133,847,435 128,776,012
Maintenance expenses 193,610,968 147,064,718
Profit to Profit and Loss Account 102,567,088 429,043,685
673,543,020 729,126,035
PRESTIGE ASSURANCE PLC
REVENUE ACCOUNT FOR THE YEAR ENDED 31 DECEMBER, 2009 (Contd...)
SU
BS
ID
IA
RIE
SS
UB
SID
IA
RIE
SS
UB
SID
IA
RIE
SS
UB
SID
IA
RIE
SS
UB
SID
IA
RIE
S

okf"kZd fjiksVZANNUAL REPORT 2009-10
161
PRESTIGE ASSURANCE PLC
STATEMENT OF CASH FLOWS YEAR ENDED 31 DECEMBER, 2009
ASSETS 2009 2008N N N N
Cash Flows from Operating Activities
Premium received from policy holders 3,606,456,123 2,901,041,264
Commission received 307,270,794 335,958,052
Other operating receipts 18,143,186 3,869,499
Reinsurance receipts in respect of claims 732,255,208 431,241,768
Cash paid to and on behalf of employees (383,038,259) (313,946,542)
Reinsurance premium paid (1,731,137,671) (1,610,499,212)Other operating cash payments (754,475,236) (552,056,498)Claims paid (978,520,823) (937,283,487)IT Development Levy paid (10,000,204) (9,015,693)Company Income Tax paid (300,833,074) (259,179,900)
Net cash provided by operating activities 506,120,045 (9,870,749)
Cash Flows from Investing Activities
Purchase of property, plant & equipment (485,797,313) (445,251,371)
Purchase of investments (6,852,168) (380,151,194)
Realisation of /(Addition to) other investments (434,144,028) 352,109,865
Sale of property, plant & equipment 1,771,724 2,165,698
Dividend received 28,631,289 41,130,759
Interest received 339,947,546 333,811,194
Lease rental received 528,724,211 418,027,422
Refund on Deposit for Investments - 87,397,187
Profit on sale of investment 37,423,256 120,251,513
Net Cash provided by investing activities 9,704,517 529,491,073
Cash Flows from Financing Activities
Expense of Script issue & Filing fees (255,000) (9,291,018)
Dividend paid (429,996,932) (452,988,863)
Net cash provided by financing activities (430,251,932) (462,279,881)
Increase in cash and cash equivalents 85,572,630 57,340,443
The accompanying notes form part of this Statement of Cash Flows.
SU
BS
ID
IA
RIE
SS
UB
SID
IA
RIE
SS
UB
SID
IA
RIE
SS
UB
SID
IA
RIE
SS
UB
SID
IA
RIE
S

fn U;w bafM;k ,';ksjUl da- fy-THE NEW INDIA ASSURANCE CO. LTD.
162
Estbd. 1919
PRESTIGE ASSURANCE PLC
STATEMENT OF CASH FLOWS YEAR ENDED 31 DECEMBER, 2009 (Contd...)
2009 2008N N
1. Reconciliation of Operating Profit to theCash provided by operating Activities
Operating profit before tax 873,416,512 990,020,208Stamp duty and Filing fees 255,000 9,291,018Investment income (936,498,026) (911,465,769)Depreciation 439,225,228 439,032,565Increase /(Decrease) in unearned premiums 486,846,466 43,937,860Increase /(Decrease) in creditors 65,319,440 (45,320,561)Increase /(Decrease) in claims provisions 532,873,002 64,520,978(Increase) /Decrease in debtors 216,541,432 (326,240,282)(Increase) /Decrease in deferred acquisition expenses (82,941,500) (5,451,173)(Increase) /Decrease in outstanding claims recoverable (474,313,227) -(Increase) /Decrease in prepaid reinsurance premium (303,771,004) -
IT Development levy paid (10,000,204) (9,015,693)Tax paid (300,833,074) (259,179,900)
Cash provided by operating activities 506,120,045 (9,870,749)
2 Analysis of Changes in Cash and Cash Equivalents and other liquid Investments
Cash & Cash Investment Total 2008Equivalents
N N N N
Balance as at 1 January 2008 237,945,206 3,220,895,067 3,458,840,273 4,135,706,444Net cash inflow 85,572,628 - 85,572,628 57,340,443Purchase of investments - 433,497,174 433,497,174 28,041,329Sales of Investment - - - (91,318,004)Investments revaluation Surplus - (217,638,069) (217,638,069) (670,929,939)
323,517,834 3,436,754,172 3,760,272,006 3,458,840,273
3. Analysis of the Balance of cash and cash equivalents and other liquid investments
2009 2008 Change duringthe year
N N N
Total cash and cash equivalents 323,517,834 237,945,206 85,572,628
Investments 3,436,754,172 3,220,895,067 215,859,105
3,760,272,006 3,458,840,273 301,431,733
SU
BS
ID
IA
RIE
SS
UB
SID
IA
RIE
SS
UB
SID
IA
RIE
SS
UB
SID
IA
RIE
SS
UB
SID
IA
RIE
S

okf"kZd fjiksVZANNUAL REPORT 2009-10
163
PRESTIGE ASSURANCE PLC
NOTES ON THE ACCOUNTS YEAR ENDED AT 31 DECEMBER, 2009
2009 2008N N
1. SHORT TERMS INVESTMENTCommercial Papers 783,111,111 128,000,000Bankers Acceptances 1,516,831,434 1,572,311,077Bond (Market value N37.5m) 37,500,000 75,000,000Call Deposits 82,370,213 217,856,675
2,419,812,758 1,993,167,7522 DEBTORS
Outstanding Premiums 603,359,563 582,816,455Amounts due from Re-Insurance and
Insurance Companies 705,706,268 774,455,073Amounts due from Insurance Brokers and Agents 542,095,148 564,384,726Sundry Debtors & Prepayments 65,407,133 52,190,436
1,916,568,112 1,973,846,690Provision on doubtful debts (543,687,580) (384,424,726)
1,372,880,532 1,589,421,964
3 DEFFERED ACQUISITION EXPENSESDeffered Acquisition Expenses 118,503,599 35,562,100
4 LONG TERM INVESTMENTSThese comprise of:(i) Quoted investments
Ordinary sharesBalance brought forward-COST 613,568,990 448,083,852Reclassified Balance - (68,407)Addition during the year 6,852,168 256,871,549Disposal during the year - (91,318,004)
620,421,158 613,568,990Transferred to investment revaluation reserve (Note 12) (28,659,553) 188,978,516
Balance Carried Forward 591,761,605 802,547,506
(ii) Unquoted investments at costOrdinary sharesBalance brought forward 425,179,809 301,831,757
Reclassified Balance - 68,407 Additions during the year - 123,279,645
425,179,809 425,179,809
1,016,941,414 1,227,727,315
The directors are of the opinion that the market value of unquoted investments is not lower than cost.
4.1 Ordinary Shares of quoted investments were valued at market value in line with NAICOM guidelines 2009.
5. STATUTORY DEPOSIT 300,000,000 300,000,000
This represents deposit with the Central Bank of Nigeria, the sum of N300m (2008 N300m).This is in accordance with section 10(2) of the Insurance Act, 2003.
SU
BS
ID
IA
RIE
SS
UB
SID
IA
RIE
SS
UB
SID
IA
RIE
SS
UB
SID
IA
RIE
SS
UB
SID
IA
RIE
S

fn U;w bafM;k ,';ksjUl da- fy-THE NEW INDIA ASSURANCE CO. LTD.
164
Estbd. 1919
PRESTIGE ASSURANCE PLC
NOTES ON THE ACCOUNTS YEAR ENDED AT 31 DECEMBER, 2009 (Contd...)
6. PROPERTY, PLANT & EQUIPMENT.
Leasehold FurniturePlant & Land & Fixtures & Computer Motor Assets On
Machinery Building Fittings Equipment Vehicles Lease TotalN N N N N N N
Cost :
At 1st January,2009 21,432,435 160,208,570 29,932,162 47,003,543 74,982,489 1,100,317,177 1,433,876,376
Additions 678,000 5,166,753 2,456,844 6,827,616 2,595,000 468,073,100 485,797,313
Disposal - - - - (1,800,000) (96,449,900) (98,249,900)
At 31st December,2009 22,110,435 165,375,323 32,389,006 53,831,159 75,777,489 1,471,940,377 1,821,423,789
Depreciation:
At 1st January,2009 13,711,155 16,642,619 17,843,020 39,071,401 47,380,461 737,603,504 872,252,160
Charge for the year 1,476,206 2,909,371 2,121,980 7,436,514 14,381,750 410,899,407 439,225,228
Disposal - - - - (1,800,000) (96,449,900) (98,249,900)
At 31st December,2009 15,187,361 19,551,990 19,965,000 46,507,915 59,962,211 1,052,053,011 1,213,227,488
Net book value :
At 31st December, 2009 6,923,074 145,823,333 12,424,006 7,323,244 15,815,278 419,887,366 608,196,301
At 31st December,2008 7,721,280 143,565,951 12,089,142 7,932,142 27,602,028 362,713,673 561,624,216
The leasehold land and buildings with a netbook value of N145,823,333 were professionally valued atN400,000,000 on the 16th November 2009 by Messrs Obasi & Co., Estate Surveyors and Valuers on thebasis of open market value of N600,000,000. In line with the National Insurance Commission's guideline, thiscan only be brought into the books of account after 3 years of the valuation.
7. CREDITORS 2009 2008N N
Amounts Falling due within one year:Amounts due to Re-Insurance and Insurance Companies 82,965,813 207,602,450Amounts due to Insurance Brokers and Agents 94,175,991 111,887,012Amounts due to Policy Holders 119,350,848 76,565,716Sundry Creditors and Accrued charges 473,086,419 308,204,452Dividend Payable (Note 20) - 36,158,577
769,579,070 740,418,207
SU
BS
ID
IA
RIE
SS
UB
SID
IA
RIE
SS
UB
SID
IA
RIE
SS
UB
SID
IA
RIE
SS
UB
SID
IA
RIE
S

okf"kZd fjiksVZANNUAL REPORT 2009-10
165
8. INSURANCE FUNDS 2009 2008N N
Unexpired Risks:Accident 168,881,852 48,309,946Fire 281,012,272 58,459,305Workmen's Compensation 10,679,655 7,484,337Motor 93,111,421 53,190,767Marine and Aviation 152,879,225 52,273,604
706,564,425 219,717,959Outstanding Claims:
Accident 121,895,362 36,661,143Fire 405,003,500 19,828,930Workmen's Compensation 21,769,000 37,724,500Motor 27,538,500 43,089,750Marine and Aviation 188,577,459 94,606,496
764,783,821 231,910,819
Total Insurance Funds 1,471,348,246 451,628,778
9. SHARE CAPITAL
4,000,000 Ordinary Shares of 50k each 2,000,000,000 2,000,000,000
ISSUED AND FULLY PAID:
2,149,984,660 Balance as at 1 January 1,074,992,330 859,993,864 - Bonus issue alloted - 214,998,466
2,149,984,660 1,074,992,330 1,074,992,330
10. SHARE PREMIUMBalance as at end of the year 1,349,985,726 1,349,985,726
11. STATUTORY CONTINGENCY RESERVEAt 1 January 783,264,667 585,260,625Additional provision made during the year 174,683,302 198,004,042
At 31 December 957,947,969 783,264,667
12 INVESTMENTS REVALUATION RESERVEAt 1 January 188,978,516 859,908,455Movement during the year (217,638,069) (670,929,939)
(28,659,553) 188,978,516Diminution Transferred to Profit and loss account 28,659,553 -At 31 December - 188,978,516
13. GENERAL RESERVE
At 1 January 972,402,724 811,771,430NITDA - (9,015,693)Dividend declared/paid (429,996,932) (343,997,546)Retained Earnings 418,389,005 513,644,533At 31 December 960,794,797 972,402,724
PRESTIGE ASSURANCE PLC
NOTES ON THE ACCOUNTS YEAR ENDED AT 31 DECEMBER, 2009 (Contd...)
SU
BS
ID
IA
RIE
SS
UB
SID
IA
RIE
SS
UB
SID
IA
RIE
SS
UB
SID
IA
RIE
SS
UB
SID
IA
RIE
S

fn U;w bafM;k ,';ksjUl da- fy-THE NEW INDIA ASSURANCE CO. LTD.
166
Estbd. 1919
PRESTIGE ASSURANCE PLC
NOTES ON THE ACCOUNTS YEAR ENDED AT 31 DECEMBER, 2009 (Contd...)
2009 2009 2008 2008N N N N
NET UNDER- NET UNDER-PREMIUM WRITING PREMIUM WRITING
EARNED PROFIT/ EARNED PROFIT(LOSS)
14. NET PREMIUM EARNED ANDUNDERWRITING PROFITS
Accident Insurance Business 381,143,135 229,291,452 185,656,966 78,947,416Fire Insurance Business 552,856,287 102,567,088 593,354,848 429,043,685Workmen's CompensationInsurance Business 53,682,717 24,696,343 42,251,421 (24,486,825)Motor Insurance Business 302,730,423 164,170,300 302,882,597 135,999,974Marine and Aviation Business 365,457,741 181,680,554 408,032,637 200,186,495
1,655,870,303 702,405,738 1,532,178,469 819,690,745
15. UNDERWRITING EXPENSES 2009 2008N N
Acquisition Cost:- Commission Paid 362,522,216 287,239,534- Maintenance Expenses 481,853,819 404,577,159
844,376,035 691,816,693
16. OTHER OPERATING INCOME
Sundry Income 1,741,537 3,869,499Gain on exchange 16,401,649 -
18,143,186 3,869,499
17. PROFIT ON ORDINARY ACTIVITIES
BEFORE TAXATION
This is stated after Charging and (Crediting):Directors' Remuneration:
Fees 950,000 750,000Gratuity 1,272,000 1,200,000Other remuneration 1,642,350 15,644,144Depreciation of property, plant & equipment 439,225,228 439,032,565Auditors' Remuneration 3,500,000 3,500,000Exchange Loss (Gain) (16,401,649) 7,493,709(Profit) /loss on disposal of fixed assets (1,771,724) (2,165,698)Lease Rental Income (528,724,211) (418,027,422)
SU
BS
ID
IA
RIE
SS
UB
SID
IA
RIE
SS
UB
SID
IA
RIE
SS
UB
SID
IA
RIE
SS
UB
SID
IA
RIE
S

okf"kZd fjiksVZANNUAL REPORT 2009-10
167
PRESTIGE ASSURANCE PLC
NOTES ON THE ACCOUNTS YEAR ENDED AT 31 DECEMBER, 2009 (Contd...)
2009 2008N N
18. TAXATION
18.1 PER PROFIT AND LOSS ACCOUNT
Profit and Loss Account-
Income Tax on Profit for the year 238,758,417 261,971,138
Education Tax 25,636,997 25,651,753
Under/Over provision-prior year - 3,320,333
Information Technology Tax 8,734,165 10,000,204273,129,579 300,943,428
Deferred Taxation (19.3) 7,214,625 (12,571,591)
280,344,204 288,371,83718.2 PER BALANCE SHEET
Balance at 1st January 326,858,290 285,094,762
Charge for the Year (Income Tax and Education Tax) 264,395,414 290,943,224
Information Technology Tax 8,734,165 10,000,204
Payment during the year (310,833,278) (259,179,900)
Balance at 31 December 289,154,591 326,858,290
The charge for taxation in these accounts is based on theprovisions of the Companies Income Tax Act, CAP C21 LFN2004 as amended and the Education tax CAP E4 LFN 2004
18.3 DEFERRED TAXATION
At 1 January 56,919,315 69,490,906
Provision made in the year 7,214,625 (12,571,591)
At 31 December 64,133,940 56,919,315
The company has adopted the Statement ofAccounting Standard SAS 19 on deferred taxationwhich is now computed using the liability method.
19. INFORMATION TECHNOLOGY DEVELOPMENT
The Nigeria Information Technology Development Agency (NITDA) Act wassigned into Law on 24 April,2007. Section 12(2a) of the Act stipulates that,specified companies contribute 1% of the their profit before tax to theNigerian Information Technology Development Agency. In line with the Act,the Company has provided for NITDA levy at the specified rate.
SU
BS
ID
IA
RIE
SS
UB
SID
IA
RIE
SS
UB
SID
IA
RIE
SS
UB
SID
IA
RIE
SS
UB
SID
IA
RIE
S

fn U;w bafM;k ,';ksjUl da- fy-THE NEW INDIA ASSURANCE CO. LTD.
168
Estbd. 1919
PRESTIGE ASSURANCE PLC
NOTES ON THE ACCOUNTS YEAR ENDED AT 31 DECEMBER, 2009 (Contd...)
2009 2008N N
20 DIVIDEND
At 1 January 36,158,577 145,149,894
Declared during the year 429,996,932 343,997,546
Payments during the year (466,155,509) (452,988,863)
At 31 December - 36,158,577
A final dividend of 10k per 50k share held hasbeen proposed.
This is subject to shareholders' ratification at theAnnual General Meeting.
21 INFORMATION REGARDING DIRECTORS AND EMPLOYEES
i) EMPLOYEES
Number of persons employed in the 2009 2008financial year and staff costs were as follows: Number Number
Managerial 4 6Senior Staff 40 42Junior Staff 38 40
82 88
ii) ANALYSIS OF STAFF COSTS N N
Salaries and welfare 322,148,270 247,334,649Staff gratuity and pension 24,359,901 26,572,063
346,508,171 273,906,712
Medical 18,008,215 11,872,629Training 18,521,873 28,167,201
383,038,259 313,946,542Gratuity
At 1 January 30,029,873 20,029,873
Provision during the year - 10,000,000
Payment during the year (10,000,000) -
At 31 December 20,029,873 30,029,873
SU
BS
ID
IA
RIE
SS
UB
SID
IA
RIE
SS
UB
SID
IA
RIE
SS
UB
SID
IA
RIE
SS
UB
SID
IA
RIE
S

okf"kZd fjiksVZANNUAL REPORT 2009-10
169
PRESTIGE ASSURANCE PLC
NOTES ON THE ACCOUNTS YEAR ENDED AT 31 DECEMBER, 2009 (Contd...)
2009 2008N N
iii) CHAIRMAN'S AND DIRECTORS' EMOLUMENTS,PENSIONS AND COMPENSATION FOR LOSS OF OFFICE:
Emoluments:
Chairman 150,000 150,000
Other Directors 600,000 600,000
Gratuity 1,290,000 1,200,000
Other Emolument of Executives 16,426,351 15,644,144
Emolument of highest paid director 16,426,351 15,644,144
The table below shows number of directors of the Companyexcluding the chairman whose emoluments fell within bandsshown below:
N N Number Number
10,001 20,000 Nil Nil20,001 30,000 Nil Nil50,001 60,000 Nil Nil70,001 80,000 Nil NilAbove 80,000 6 6
iv) EMOLUMENTS WAIVED
Number of directors who have waived their Nil Nilrights to receive emoluments
v) SCALE OF EMPLOYEES REMUNERATION
The number of employees in respect of emoluments within the following ranges were:
N N Number Number
250,000 300,000 3 14300,001 350,000 23 15350,001 400,000 10 14400,001 450,000 5 9450,001 500,000 6 8500,001 and above 35 28
82 88
22. PROPOSED DIVIDEND
In respect of the current year, the directors proposed that a dividend of 10kobo per ordinary share will bepaid to shareholders. The dividend is subject to approval by shareholders at the Annual General Meetingand has not been included as liability in the financial statements in accordance with the statement ofaccounting standard 23. The proposed dividend is subject to witholding tax at the appropriate tax rate
SU
BS
ID
IA
RIE
SS
UB
SID
IA
RIE
SS
UB
SID
IA
RIE
SS
UB
SID
IA
RIE
SS
UB
SID
IA
RIE
S

fn U;w bafM;k ,';ksjUl da- fy-THE NEW INDIA ASSURANCE CO. LTD.
170
Estbd. 1919
PRESTIGE ASSURANCE PLC
NOTES ON THE ACCOUNTS YEAR ENDED AT 31 DECEMBER, 2009 (Contd...)
and is payable to shareholders whose name appear in the register of members at closure date. The gross dividendto be paid is N214,998,466.
23. EARNINGS PER SHARE
Basic earnings per share is calculated by dividing the net profitafter tax attributable to ordinary shareholders the number ofordinary shares in issue during the year.
2009 2008N N
Profit after tax for the year attributable to ordinary shareholders 593,072,308 711,648,575
Ordinary shares in issue 2,149,984,660 2,149,984,660
Basic Earnings per share (kobo) 27.58 33.10
24. CHANGE IN ACCOUNTING TREATMENT
In compliance with the directive of the National Insurance Commission (NAICOM) to all InsuranceCompanies, the treatment of :
a) Outstanding Claims
b) Reserve for unexpired Riskshave been brought into the books on Gross basis rather than the former treatment of net basis, and
c) Re-insurance costs have been apportioned on time basis.
25. FINANCIAL COMMITMENTS
There is capital commitment of N755million for the building of the Company's new head office for aperiod of 60 weeks.
26 CONTINGENT LIABILITIES
There were no contigent liabilities at 31st December, 2009.
27 POST BALANCE SHEET EVENTS
No events or transactions have occurred since the balance sheet date,which would have a materialeffect upon the financial statements at that date or which need to be mentioned in the financial statements.
28 RECLASSIFICATION OF BALANCES
Where necessary, comparative figures have been adjusted to conform with changes in presentation of thecurrent year in accordance with the statement of Accounting Standard No.2 (SAS 2).
29 Prestige Assurance Plc is a subsidiary of the New India Assurance Co. Ltd.,Mumbai, India.
30 APPROVAL OF FINANCIAL STATEMENTS
The Financial Statements were approved by the Board of Directors on 11 June 2010.
SU
BS
ID
IA
RIE
SS
UB
SID
IA
RIE
SS
UB
SID
IA
RIE
SS
UB
SID
IA
RIE
SS
UB
SID
IA
RIE
S

okf"kZd fjiksVZANNUAL REPORT 2009-10
171
SU
BS
ID
IA
RIE
SS
UB
SID
IA
RIE
SS
UB
SID
IA
RIE
SS
UB
SID
IA
RIE
SS
UB
SID
IA
RIE
S
2009 % 2008 %N N
Premium Earned 1,655,870,303 1,532,178,469
Commissions - Net (55,251,422) 48,718,518
1,600,618,881 1,580,896,987
Claims incurredand other services expenses-Local (868,314,259) (753,232,940)
732,304,622 827,664,047
Investment Income 936,498,026 911,465,769
Other Operating Income 18,143,186 3,869,499
VALUE ADDED 1,686,945,834 100 1,742,999,315 100
Applied as follows:
To pay employees:
Salaries, wages and other benefits 383,038,259 23 313,946,542 18
To pay Provider of Capital:
Contingency Reserve 174,683,302 10 198,004,042 11
To pay Government:
Taxation 264,395,414 16 290,943,224 17
To provide for assets replacementand growth
Depreciation 439,225,228 26 439,032,565 25
Retained for Company's growth 418,389,006 25 513,644,533 29
Deferred Taxation 7,214,625 (12,571,591) -
1,686,945,834 100 1,742,999,315 100
PRESTIGE ASSURANCE PLC
STATEMENT OF VALUE ADDED YEAR ENDED 31 DECEMBER, 2009

fn U;w bafM;k ,';ksjUl da- fy-THE NEW INDIA ASSURANCE CO. LTD.
172
Estbd. 1919
SU
BS
ID
IA
RIE
SS
UB
SID
IA
RIE
SS
UB
SID
IA
RIE
SS
UB
SID
IA
RIE
SS
UB
SID
IA
RIE
S
2009 2008 2007 2006 2005N‘000’ N‘000’ N‘000’ N‘000’ N‘000’
ASSETS EMPLOYED
Net Current Assets 3,954,065 2,788,821 2,629,351 2,697,986 865,222
Investments 1,016,941 1,227,727 1,609,824 768,055 496,768
Statutory Deposit 300,000 300,000 300,000 20,000 20,000
Fixed Assets 608,196 561,624 555,405 495,627 348,043
5,879,203 4,878,172 5,094,580 3,981,668 1,730,033
Insurance Funds (1,471,348) (451,629) (343,170) (298,041) (268,784)
Deferred Taxation (64,134) (56,919) (69,491) (66,272) (40,697)
4,343,721 4,369,624 4,681,919 3,617,355 1,420,552
FINANCED BY:
Share Capital 1,074,992 1,074,992 859,994 797,652 366,122
Bonus Issue - - - - -
Reserve - - 214,998 - 91,530
Share Premium 1,349,986 1,349,986 1,349,986 1,335,829 94,173
Statutory Contingency Reserve 957,948 783,265 585,261 404,947 284,850
Investment Revaluation Reserve - 188,978 859,909 466,928 259,196
General Reserve 960,795 972,403 811,771 611,999 324,681
SHAREHOLDERS FUNDS 4,343,721 4,369,624 4,681,919 3,617,355 1,420,552
INCOME AND PROFIT
Gross Premium 3,445,447 3,008,391 2,260,710 1,539,098 1,269,048
Net Premium 2,958,600 1,576,116 1,180,858 889,602 627,968
Premium Earned 1,655,870 1,532,178 1,163,192 881,121 608,473
Investment and other Income 954,641 915,335 752,780 488,677 387,470
Profit before taxation 873,417 1,000,020 901,569 600,484 424,250
Taxation 264,395 290,943 263,485 193,068 139,778
Profit after taxation 593,072 711,649 638,084 407,416 284,472
Proposed dividend/paid - 429,997 343,998 257,998 87,869
Statutory Contingency Reserve 174,683 198,004 180,314 120,097 84,850
Retained Profits 418,389 513,645 457,770 287,319 111,753
PRESTIGE ASSURANCE PLC
FIVE YEAR FINANCIAL SUMMARY YEAR ENDED 31 DECEMBER
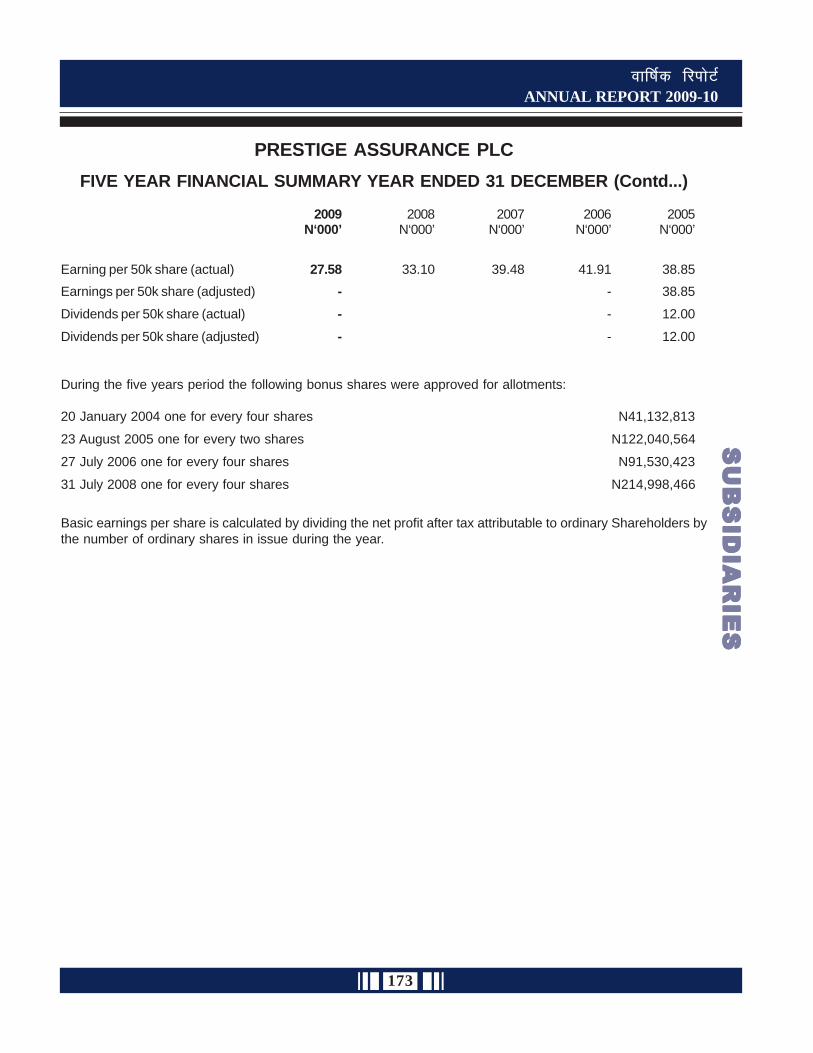
okf"kZd fjiksVZANNUAL REPORT 2009-10
173
SU
BS
ID
IA
RIE
SS
UB
SID
IA
RIE
SS
UB
SID
IA
RIE
SS
UB
SID
IA
RIE
SS
UB
SID
IA
RIE
S
Earning per 50k share (actual) 27.58 33.10 39.48 41.91 38.85
Earnings per 50k share (adjusted) - - 38.85
Dividends per 50k share (actual) - - 12.00
Dividends per 50k share (adjusted) - - 12.00
During the five years period the following bonus shares were approved for allotments:
20 January 2004 one for every four shares N41,132,813
23 August 2005 one for every two shares N122,040,564
27 July 2006 one for every four shares N91,530,423
31 July 2008 one for every four shares N214,998,466
Basic earnings per share is calculated by dividing the net profit after tax attributable to ordinary Shareholders bythe number of ordinary shares in issue during the year.
2009 2008 2007 2006 2005N‘000’ N‘000’ N‘000’ N‘000’ N‘000’
PRESTIGE ASSURANCE PLC
FIVE YEAR FINANCIAL SUMMARY YEAR ENDED 31 DECEMBER (Contd...)

fn U;w bafM;k ,';ksjUl da- fy-THE NEW INDIA ASSURANCE CO. LTD.
174
Estbd. 1919
OFFICE IN INDIA
SR REGIONAL DIVISIONAL BRANCH DIRECT AGENT EXTENTION TOTALNO OFFICE OFFICE OFFICE BRANCH COUNTERS
1 MUMBAI - I 14 1 1 0 16
2 MUMBAI - II 15 8 4 0 27
3 MUMBAI - III 10 2 0 0 12
4 MUMBAI - IV 10 0 0 0 10
5 PUNE 25 33 1 2 61
6 NAGPUR 10 18 0 0 28
7 AHMEDABAD 15 14 1 2 32
8 BARODA 10 6 0 1 17
9 SURAT 9 6 1 0 16
10 DELHI - I 20 15 0 0 35
11 DELHI - II 15 32 2 5 54
12 JAIPUR 11 21 1 0 33
13 CHANDIGARH 18 36 1 3 58
14 LUDHIANA 17 31 1 3 52
15 KANPUR 22 55 2 0 79
16 BHOPAL 19 29 1 0 49
17 KOLKATA 20 29 1 0 50
18 GUWAHATI 9 22 0 2 33
19 PATNA 10 29 1 0 40
20 BHUBANESHWAR 10 23 1 3 37
21 HYDERABAD 20 18 2 0 40
22 VISHAKHAPATNAM 12 23 1 1 37
23 BENGALURU 23 40 0 0 63
24 CHENNAI 20 21 4 1 46
25 COIMBATORE 18 35 0 0 53
26 ERNAKULAM 13 44 1 0 58
TOTAL 395 591 27 23 1036
TOTAL NO OF OFFICES : (26+395+591+27+23) = 1062

okf"kZd fjiksVZANNUAL REPORT 2009-10
175
FOREIGN OFFICES
A. FOREIGN BRANCHES
Country Branches Year of Commencementof Operations
1. Japan (Seven) 1. Tokyo 1950
2. Nagoya 1964
3. Hiroshima 1973
4. Okayama 1980
5. Sapporo 1978
6. Osaka 1962
7. Himeji 1996
2. Hong Kong (One) 8. Hong Kong 1952
3. Philippines (One) 9. Manila 1930
4. Thailand (One) 10. Bangkok 1948
5. Australia (One) 11. Sydney 1955
6. Fiji (Four) 12. Suva 1954
13. Lautoka 1967
14. Labasa 1982
15. Nadi 1996
7. Mauritius (One) 16. Port Louis 1935
8. U. K. (Two) 17. London- Fenchurch 1920
18. Ipswich 2000
9. New Zealand (One) 19. Auckland 2004
B. FOREIGN AGENCIES
Country Agencies Year of Commencementof Operations
1. Abu Dhabi (U.A.E.) 1. Abu Dhabi 1973
2. Dubai (U.A.E.) 2. Dubai 1961
3. Bahrain (One) 3. Bahrain 1959
4. Kuwait (One) 4. Kuwait 1953
5. Oman (One) 5. Muscat 1975
6. Dutch Caribbean (One) 6. Aruba 1963
7. Netherlands Antilles (One) 7. Curacao 1954

fn U;w bafM;k ,';ksjUl da- fy-THE NEW INDIA ASSURANCE CO. LTD.
176
Estbd. 1919
C. SUBSIDIARY COMPANIES
Country Year of Commencementof Operations
1. Nigeria 1. Lagos 1970
2. Kano
3. Port Harcourt
2. Trinidad & Tobago 1. Port of Spain 1966
2. St. Lucia (Castries)
3. Dominica (Roseau)
4. St. Maarten (Philipsburg)
3. Sierra Leone 1. Freetown 1973
D. ASSOCIATE COMPANIES
1. India International Insurance Pvt. Ltd., Singapore
2. Kenindia Assurance Co. Ltd., Kenya
3. United Insurance Co. Ltd., Jordan
4. Saudi Indian Company for Co Operative Insurance, Riyadh


