1-BSengupta · 8/30/11 1 Dr. B. Sengupta Former Member Secretary Central Pollution Control Board...
24
8/30/11 1 Dr. B. Sengupta Former Member Secretary Central Pollution Control Board Ministry of Environment & Forests Govt. of India, Delhi Email: [email protected], METROS CITIES/URBAN AREAS 83 non-attainment cities Dominant Sources: Vehicular Emissions, Small/Medium Scale Industries, Gensets, Biomass burning, etc. Pollutants: NO x , PM10 & PM2.5 , CO and Benzene CRITICALLY POLLUTED AREAS 43 critically polluted areas Dominant Sources: Industries-Power Plants, Refineries, Chemical Plants, etc.) Pollutants: NO x , PM10/PM2.5, SO 2 VOCs, PAHs, etc. RURAL AREAS Indoor air pollution: Use of Biomass, Coal, kerosene, etc. Outdoor air pollution: Unpaved roads, Biomass burning, Gen- sets etc. Pollutants: SPM/RSPM, CO, etc. 2
Transcript of 1-BSengupta · 8/30/11 1 Dr. B. Sengupta Former Member Secretary Central Pollution Control Board...

8/30/11
1
Dr. B. Sengupta Former Member Secretary
Central Pollution Control Board Ministry of Environment & Forests
Govt. of India, Delhi
Email: [email protected],
! METROS CITIES/URBAN AREAS ! 83 non-attainment cities ! Dominant Sources: Vehicular Emissions, Small/Medium Scale
Industries, Gensets, Biomass burning, etc. ! Pollutants: NOx, PM10 & PM2.5 , CO and Benzene
! CRITICALLY POLLUTED AREAS
! 43 critically polluted areas ! Dominant Sources: Industries-Power Plants, Refineries,
Chemical Plants, etc.) ! Pollutants: NOx ,PM10/PM2.5, SO2 VOCs, PAHs, etc.
! RURAL AREAS
! Indoor air pollution: Use of Biomass, Coal, kerosene, etc. ! Outdoor air pollution: Unpaved roads, Biomass burning, Gen-
sets etc. ! Pollutants: SPM/RSPM, CO, etc.
2

8/30/11
2
� Uncontrolled growth of vehicular population � Type of vehicles on road (predominant old
vehicles, Bharat Stage – II vehicles, 2W / 3W) � Fuel quality issues � Fuel adulteration issues � Air pollution from SSI units (brick kiln, stone
crusher, hotmix plants etc.) � Large number of DG Sets (small power
generating set run on liquid fuel) � Coal based power station
� MoEF / CPCB declared 43 critically polluted areas and 44 Severely Polluted areas based on CEPI index
� Uncontrolled SOx / NOx emission from Coal based power station (Singrauli, Korba, Talcher etc.)
� Toxic pollutant emission (VOC, BTX etc.) from chemical industrial zones (Vapi, Ankaleshwar, Mahad, Patencheru, Tarapur etc.)
� Air pollution in mining areas (Bellari, Raniganj etc.)

8/30/11
3
S e r i a l nos.
Industrial cluster/area CEPI-‐ Air index Type of industry
1. Vapi (Gujarat) 74.0 Chemical industry 2. Ankaleshwar(Gujarat) 72.0 Chemical industry 3. Bhiwadi (Rajasthan) 71.0 Secondary lead industry
4. Chandarpur(Maharashtra) 70.75 Power plant,steel industry
5. Singrauli(U.P.) 70.50 Power plant 6. Vellore (Tamil Nadu ) 69.25 Tanneries 7. Ghaziabad(U.P.) 68.50 SSI,carbon black industry,small steel
industry 8. Ludhiana (Punjab ) 68.0 ElectroplaVng industry
9. Korba (ChaXVsgarh) 67.0 Power plant 10. Dromibivali(Maharashtra) 66.0 SSI units 11 Kanpur (U.P.) 66.0 SSI units, power palnt
12 Noida (U.P.) 65.75 SSI units 13 Aurangabad (Maharashtra) 64.75 SSI units 14 Dhanbad (Jharkhand
) 64.50 Mining
15 Manali (Tamil Nadu ) 64.0 Chemical industry ,oil refinery
16 Angul-‐ Talcher (Orissa) 64.0 Power plant, mining industry
17 Faridabad (Harayana) 63.50 SSI units 18 Ahemedabad (Gujarat ) 62.75 Vehicles 19 BhadravaV(Karnataka ) 62.75 SSI units 20 Coimbatore (Tamil Nadu ) 62.25 Foundry,SSI units
21 Mandi Govind Garh (Punjab ) 62.0 Secondary Steel industry 22 Mangalore (Karanataka ) 61.75 Refinery, PesVcide units 23 Ib valley (Orissa ) 61.0 TPP/Coal mining 24 Navi Mumbai (Maharastra) 61.0 SSI units 25 Jhasugurda (Orissa ) 61.0 Sponge iron plants, mining industry 26 Tarapur (Maharastra ) 60.75 SSI units 27 Vatva (Gujarat ) 60.0 SSI units 28 Agra (U.P.) 59.0 SSI units 29 Indore(M.P.) 59.0 SSI units 30 Asansol (West Bengal ) 58.35 SSI units 31 Varanasi Mirzapur (U.P.) 58.0 SSI units 32 Howrah (W.B) 57.0 SSI units 33 Cochin (Kerela ) 57.0 Oil refinery/chemical industry 34 Vishakhapatnam (A.P.) 57.0 Chemical industry , oil refinery 35 Panipat(Haryana) 55.75 SSi units, oil refinery 36 Bhavnagar 54.50 SSI units 37 Cuddalore(T.N.) 54.0 PesVcide units,PharmaceuVcal units
38 Haldia (West Bengal ) 53.75 Oil refinery,chemical industry 39 Najafgarh drain basin 52.13 SSI units 40 Jodhpur (Rajasthan ) 52.0 SSI units 41 Palli 52.0 42 Junagarh (Gujarat ) 51.25 SSI units 43 Patancheru _Bollaram 50.0 Source : CPCB Website

8/30/11
4
ITEMS EXISTING SCENARIO
2050 SCENARIO
Coal based Electricity Production (MW)
67600 900000
Coal Consumption (million tonnes)
258 3434
Particulate Matter Emission (million tonnes)
1.62 21.9
Sulphur Dioxide (million tonnes) Emission
2.451 32.6
Oxide of Nitrogen (million tonnes)
2.3 30.9
Source: CEA/NTPC Website, 2011
Use of clean coal technologies (Super Critical ,IGCC, PFBC, CFBC, etc.) to be promoted based on location specific requirements.
� CPCB / SPCB are operating 343 air quality monitoring stations
� CPCB / SPCB are operating 50 continuous air quality monitoring stations
� Industries are operating more than 300 continuous monitoring stations
� Parameter monitored ¡ PM10, SO2, NOx (All Stations) ¡ PM2.5, CO, Benzene, Ozone, PAH (in selected
few stations)

8/30/11
5
Typical Air Quality Monitoring in Delhi
Annual Average of RSPM In Four Mega CIties
0
50
100
150
200
250
300
2001 2002 2003 2004 2005 2006 2007 2008 2009Year
An
nu
al A
vr.
Co
nc
. (µ
g/m
3)
Delhi Mumbai kolkata Chennai NAQS
Annual Average of PM10 in four mega cities

8/30/11
6
Annual Average of NO2 in Four Mega Cities
0
1020
3040
5060
7080
90
2001 2002 2003 2004 2005 2006 2007 2008 2009Year
An
nu
al A
vr.
Co
nc
. (µ
g/m
3)
Delhi Mumbai kolkata Chennai NAQS
Annual Average of No2 in four mega cities
PM10

8/30/11
7
PM10

8/30/11
8
Level of pollution
PM10 annual average in micro gram/cubic metre
Cities
Low pollution(0-50% of the standard)
0-30 Dewas,Tirupati,Kozhikode
Moderate Pollution(50%-100% of the standard)
30-60 Haldia, Dibrugarh,Salem,Vasco,Shimla, Pndicherry, Bongaigaon,Kottyam,Kochi,Nashik, Panaji, Madurai,Mysore,Aizwal,Belgaon
High Pollution (100%-150% of standard)
60-90 Solapur,Tuticorn,Vijayvada,Nagda,Tarapur,Cuttak, Talchar,Banglore,Lote,Hyderabad, Parvanu,Vapi,Bhubaneshwar,Aurangabad,Jammu,Dimapur,Tejpur,Kohlapur,Shillong,Ramagundam,Gajraula,Singraulli,Coimbatore,Chennai,Mangalore,Hasan

8/30/11
9
Critical(150% -200% of standard)
90-120 Meerut,Indore,Kota,Alwar,Patna,Hisar,Bhillai Howrah,Assansol,Jaipur,Nagpur,Vadodra,Pune,Ujjain,Dhanbad,Jabalpur,Bhopal,Dehradun,Kolkatta,Jamnagar,Raurkella,Chandigarh,Rajkot,Korba,Gauhati,Akhleshwar,Angoor,Ahmedabad,Udiapur,Navi mumbai,Mumbai,Surat,Vizag
Critical(200% -250% of standard)
120-150 Raipur,Panchi,Sindri,Anpada,Hubly-Dharwar,Durgapur
Critical(250% -300% of standard)
150-180 Jhariya,Delhi,Jalandhar,Jamshedpur,Gwalior,Noida,Jhasi,Chanrapur,Faridabad
Critical(300% -350% of standard)
180-210 Satna,Khurja,Lucknow,Ferozabad,Kanpur
Critical(350% -400% of standard)
210-240 Ghaziabad,Khana,Ludhiyana
Critical(400% -450% of standard)
240-270 Govindgarh
City No2 in microgram/cubic metre
Howrah 72 Kolkatta 60 Asansol 57
Durgapur 55 Dhanbad 52
Jamshedpur 52 Jharia 52 Delhi 51 Noida 49
Chandrapur 48 Source : CPCB

8/30/11
10
Phenenthrene 0.2 – 0.9 (ng/m3) Anthracene 0.2 – 1.4 (ng/m3) Fluoranthene 0.6 – 1.9 (ng/m3) Pyrene 0.7 – 2.9 (ng/m3) Benzo(a)anthracene 1.1 – 3.7 (ng/m3) Chrysene 1.6 – 3.5 (ng/m3) Benzo(e)pyrene 2.2 – 5.4 (ng/m3) Benzo(b)fluoranthene 1.0 – 6.3 (ng/m3) Indenol 1.0 – 8.4 (ng/m3) Benzo(a)pyrene 1.9 – 3.5 (ng/m3)
Source : CPCB Website
Source : MoEF Website, 2011
Benzene (ug/m3)
1,3-‐Butadiene (ppb)
Formaldehyde (ug/m3)
City Min Max Avg Min Max Avg Min Max Avg
Chennai 4 17 10.2 0.452 1.8 1.1 1.7 26 12.1
Delhi 1.92 11.19 4.96 0.2 1.6 0.78 1.94 19.0 11.27
Kanpur 4.88 68.11 26.86 -‐ -‐ -‐ 4.39 18.43 10.08
Mumbai Not MenVoned Not MenVoned 8.8 93.0 32.6
Pune 28.14 96.53 57.30 0.4 2.5 1.2 3.77 41.12 17.12

8/30/11
11
NMHC (ppm) HC (ppm)
City Min Max Avg Min Max Avg
Chennai 0.02 0.18 0.06 0.02 0.18 0.06
Delhi 0.2 1.7 0.9 2.6 5.3 3.7
Kanpur 0.06 0.255 0.14 0.07 0.26 0.15
Mumbai 0.1 24.6 2.3 1.5 25.5 4.6
Pune 1.32 3.82 2.55 1.74 4.22 2.96
Source : MoEF Website, 2011
AMBIENT AIR QUALITY STANDARDS 2009
Contd..
S.No. Pollutant
Time Weighted Average
Concentration in Ambient Air
Methods of Measurement
Remarks
Industrial, Residential, Rural and Other Area
Ecologically Sensitive Area (notified by Central Government)
(1) (2) (3) (4) (5) (6) (7) 1. Sulphur
Dioxide (SO2), µg/m3
Annual* 24 hours**
50 80
20 80
a) Improved West and Gaeke b) Ultraviolet fluorescence
Facilities available
2. Nitrogen Dioxide (NO2), µg/m3
Annual* 24 hours**
40 80
30 80
a) Modified Jacob & Hocheiser (Na-Arsenite) b) Chemiluminiscence
Facilities available

8/30/11
12
3. Particulate Matter (size less than 10 µm) or PM10 µg/m3
Annual* 24 hours**
60 100
60 100
a) Gravimetric b) TOEM c) Beta attenuation
• Most of the NAMP Stations have Gravimetric measurement facility including CPCB
• CAQMS is having BAM • TEOM has to be introduced
gradually
4. Particulate Matter (size less than 2.5 µm) or PM2.5 µg/m3
Annual* 24 hours**
40 60
40 60
a) Gravimetric b) TOEM c) Beta attenuation
• Gravimetric measurement facility may be developed countrywide
• CAQMS is having BAM • TEOM is yet to be
introduced gradually
5. Ozone (O3) µg/m3
8 hours* 1 hour**
100 180
100 180
a) UV photometric b) Chemiluminiscence c) Chemical Method
• CAQMS equipped with UV based or Chemiluminescence Online Analysers and may be used for 1 hrly data
• Chemical method may be adopted nationwide but monitoring hours is not specified, however 09 hrs to 17 hrs may be introduced
Contd..
6. Lead (Pb) µg/m3
Annual* 24hours**
0.5 1.0
0.5 1.0
a) AAS/ICP method after sampling on EPM 2000 or equivalent filter paper
b) ED-XRF using Teflon filter
• It appears that Pb is to be monitored in PM10, this standard already exists but monitored in SPM only at few locations.
• Once the sampling is done in Teflon the same may also be analyzed by other method ED-XRF
7. Carbon Monoxide (CO) µg/m3
8 hours* 1 hour**
02 04
02 04
Non Dispersiv Infra Red (NDIR) spectroscopy
• Only option is to go with online analyzer
8. Ammonia (NH3) µg/m3
Annual* 24hours**
100 400
100 400
a)Chemiluminiscence b) Indophenol blue
method
• Recently introduced at few locations in CAQMS
• Chemical method may be adopted nationwide
9. Benzene (C6H6) µg/m3
Annual* 05 05 a)Gas chromatography based continuous analyzer
b) Adsorption and Desorption followed by GC analysis
• BTX analysers are being used at CAQMS
• Active 24 hourly sampling in diffusion tubes followed by desorption in CS2 and finally GC Analysis may be adopted nationwide in NAMP
Contd..

8/30/11
13
10. Benzo(a)Pyrene (BaP) – particulate phase only, ng/m3
Annual* 01 01 S o l v e n t e x t r a c t i o n f o l l o w e d b y H P L C / G C analysis
• Facilities available with CPCB but BIS method using GC-FID may not attain the desired lowest concentration level below 1ng/m3 alternatively GC-MS or HPLC-UV Fluorescence may be provided
11. Arsenic (As), ng/m3
Annual* 06 06 A A S / I C P method after sampling on EPM 2000 or e q u i v a l e n t filter paper
• It appears that ‘As’ is to be monitored in PM10.
• Micro-wave digester is required for digestion alternatively acid digestion at 700 C for 12 hours is required.
12. Nickel (Ni), ng/m3
Annual* 20 20 A A S / I C P method after sampling on EPM 2000 or e q u i v a l e n t filter paper
• It appears that ‘Ni’ is to be monitored in PM10.
• Micro-wave digester is required for digestion alternatively acid digestion at 700 C for 12 hours is required.
� PM10 is exceeded in 83 cities and towns � NOx is having increasing trend and already exceeded in
major cities and towns (where vehicular population is high)
� Benzene in ambient air of Delhi, Mumbai, Kanpur, Pune are significantly higher than the national standard
� Elemental Carbon (EC) and Organic Carbon (OC) is 20-45% of PM10 indicating its origin from combustion related emission (vehicles / SSI)
� High EC / OC indicate higher emission from diesel burning
� EC / OC less in PM10 than PM2.5 indicate EC dominance in fine fraction of particulate matter
� Higher EC / OC at kerb side indicate contribution of vehicular sources
� Significant quantities of sulphate and nitrate in PM10
Source : Data from CPCB / MoEF / SPCBs website

8/30/11
14
� BS (III) norms for fuels and vehicles implemented all over India
� BS(IV) norms for vehicles and fuels implemented in 12 cities
� Pollution under control certificate (PUC) for in-use vehicles (not very effective)
� Comprehensive inspection and maintenance system (exists only in few places)
� Independent fuel testing laboratories for checking fuel adulteration
� Thrust on use of clean transportation fuel (CNG) in few cities
� New AAQS for ozone, PAH, Benzene etc. notified
FUEL AND VEHICLE EMISSION STANDARD
FOR AIR POLLUTION CONTROL
8/30/11
15
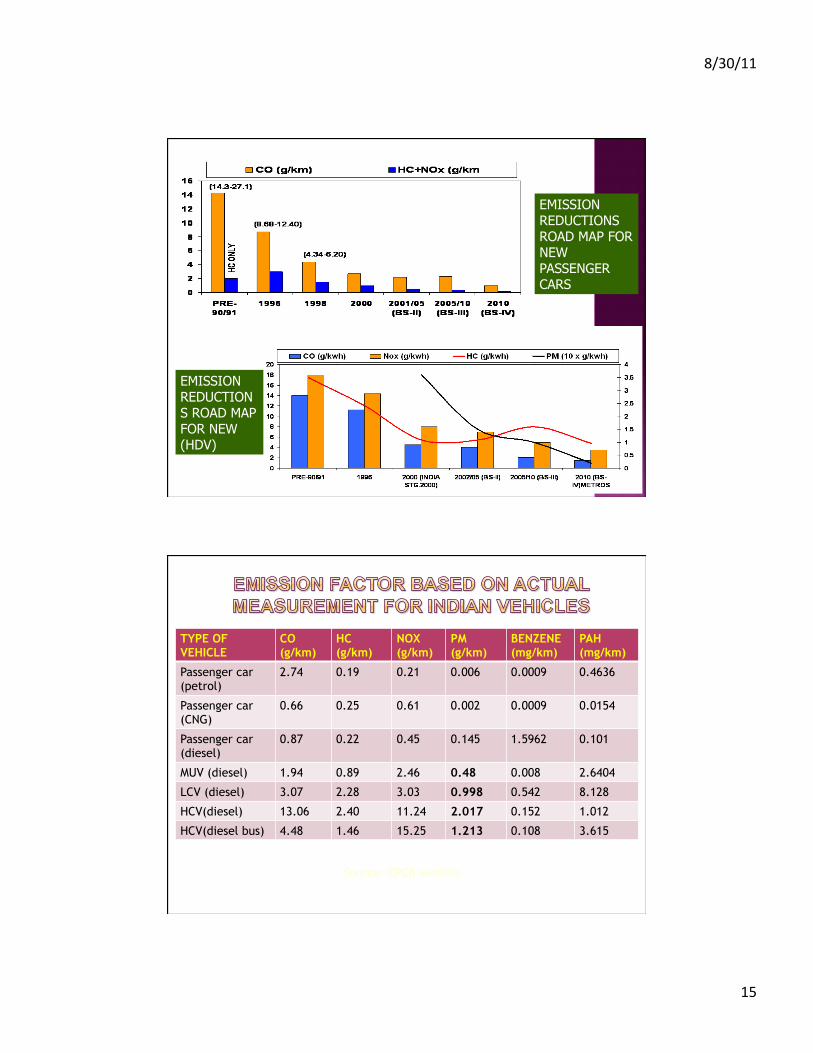
EMISSION REDUCTIONS ROAD MAP FOR NEW PASSENGER CARS
EMISSION REDUCTIONS ROAD MAP FOR NEW (HDV)
TYPE OF VEHICLE
CO (g/km)
HC (g/km)
NOX (g/km)
PM (g/km)
BENZENE (mg/km)
PAH (mg/km)
Passenger car (petrol)
2.74 0.19 0.21 0.006 0.0009 0.4636
Passenger car (CNG)
0.66 0.25 0.61 0.002 0.0009 0.0154
Passenger car (diesel)
0.87 0.22 0.45 0.145 1.5962 0.101
MUV (diesel) 1.94 0.89 2.46 0.48 0.008 2.6404
LCV (diesel) 3.07 2.28 3.03 0.998 0.542 8.128
HCV(diesel) 13.06 2.40 11.24 2.017 0.152 1.012
HCV(diesel bus) 4.48 1.46 15.25 1.213 0.108 3.615
Source: CPCB website

8/30/11
16
1 % in NCT & Mumbai
Feb 2000
Unleded Country
5 %
April 1996
April 2000
3% in Metro cities
Nov. 2000 3 % in all India & 1% in Major Metros
April. 2005
3 % in all India
April. 2010
June 1994
0.15 g/l (4 metro)
April 1995
Unleaded 4 metros
Low leaded Entire Country
Jan 1997
Jan 1999
Unleaded NCR
Gasoline Benzene Reduction Programme
in India
Gasoline Lead Phase-out Programme In India
Before 1996
No Specifications
Vehicle Emission Norm Schedule In India
1990
1st set norms notified
1995
Emission norms for catalytic vehicles
1996
2nd set norms notified
2000/01
Euro-‐I equivalent (Country) Euro-‐II eqv. For cars (4 metros)
2005
Euro-‐II (Country) Euro-‐III (11 cities)
2010
Euro-‐III (Country) Euro-‐IV (11 cities)
August 1997
Sulphur 0.25% Delhi & Taj
Sulphur 0.25% Metro cities
April 1998
Sulphur 0.25% Entire Country
April-‐2000
April 2000-‐04
Sulphur 0.05% 11 cities
April April6
Sulphur 0.50 % 4 metros & Taj
Diesel Sulphur Reduction
Programme
Sulphur 0.05% Entire Country & 0.035 (11 cities)
April-‐2005
April-‐2010
Sulphur 0.005% (11 cities) & 0.035%
(Entire Country)

8/30/11
17
� Action plan implementation in 43 critically polluted areas by SPCBs
� Emission control from thermal power plant (only for PM not for SO2 / NOx)
� Emission control from refineries (PM, SO2, NOx, VOH, Hydrocarbon)
� Emission control chemical industries (solvent management VOC control)
� DG set emission control � Regulation on coal beneficiation � Promotion of pollution prevention technology for small
scale air polluting industries � Emission control from hazardous waste incinerator

8/30/11
18
1. Based upon SPCB / CPCB data available on websites, in reports, from information collected, it has been observed that concentrations of PM10 and PM2.5 are significantly high in most of the cities and regions in India. As per CPCB / SPCBs monitored data in 83 cities the level of PM10 is in a critical stage and requires immediate attention to lower it to new ambient air quality standards.
2. High EC/OC ratios were attributed mainly to diesel/coal combustion. Many cities have shown this ratio to be high at kerbside and industrial locations. EC/OC ratios in PM2.5 are higher than in PM10 and have high (25 – 75%) values in all the cities. It signifies that PM2.5 has a much higher component of toxic EC and OC that mostly come from sources like vehicles.
3. There are significant quantities of SO42– and NO3
–, (10-15% in most cities and 20-30% in Kanpur) in PM10, indicating an important contribution of secondary particles. Any control strategy for reduction of particulate will have to consider control of SO2, NO2 and NH3.
4. With regard to air toxics, Benzene levels are higher in Delhi, Bangalore, Mumbai, Kolkata, Pune and Kanpur. The values of formaldehyde are also a matter of concern in Mumbai, Pune and Bangalore.
5. The winter and post monsoon season were found to be most critical. Standard exceedance rates were higher then than in summer due to strong inversion conditions, especially in Northern India.
6. NOx values are also increasing and many locations are exceeding the NOx standard, especially where vehicle population are high.
8/30/11
19
7. Within the transport sector, the PM10 contribution in terms of emission load is mainly from heavy-duty diesel vehicles (40 – 59%) in almost all the cities. With regard to NOx emissions, again heavy-duty vehicles are major contributors (43 – 75%).
8. Several epidemiological studies have linked PM10, and especially PM2.5,with significant health problems. PM2.5 is of specific concern because it contains a high proportion of toxins, and aerodynamically it can penetrate deeper into the lungs. Therefore, while planning control strategies, greater emphasis is to be given on reduction of PM2.5 and toxic constitutes of particulates.
9. The fuel adulteration issue is not addressed properly in India, and due to that, air pollution levels, especially air toxics, are high in ambient air. This may be one of the reasons for high cancer cases in India as per ICMR report.
10. The inspection and maintenance programme (I/M) for in-use vehicle emission control is not very effective. PUC certificates which are being given to in-use vehicles hardly serve any purpose for air quality improvement.
11. The CPCB and MoEF have identified 43 critically polluted areas (CPA) and 42 severely polluted areas in India. In most of the CPAs vehicular pollution is significant.
12. The Hon’ble Supreme Court in the past issued directives for pollution control in 17 non-attainment cities. EPCA / SPCB have drawn action plans to control pollution in those 17 cities which are in various stages of implementation (CPCB report NAAQMS/29/2006-07).

8/30/11
20
13. As per CAAQMS data it is reported that short term standards are violated for PM10,PM2.5, NOx, benzene and polyaromatic hydrocarbons in many metro cities and class – I towns where vehicular pollution is high.
14. The health effects study done by CNCI, AIIMS, Patel Chest Institute, Ramachandra Medical College, PG Medical College,etc clearly establish a relationship between health effects (respiratory and other diseases) with particulate matter (PM10 and PM2.5). Also high benzene levels in urban areas correlated with high incidences of cancer.
15. In India after Bharat Stage IV, which was implemented in cities in April 2010, no future standards have been formulated for fuel quality improvement and exhaust emission control from vehicles.
16. The fact that high fine particulate pollution is due to emissions from in-use diesel vehicles, the retrofitting of diesel particulate filter (DPF) on diesel vehicle is one of the areas which require serious consideration.
1. As PM10 concentrations in 83 cities / towns have reached at critical level (100% to 450% times the notified ambient air quality standard), immediate attention is required to prepare an action plan to reduce fine particulate pollution. The integrated action plan to be prepared, keeping the ultimate objective to meet PM10 standard in ambient air, which must include the following:
a. Diesel particulate filter (DPF) installation in existing old diesel vehicles (buses, trucks and commercial vehicles).
b. Supply of BSIV fuel in these polluted cities.
c. Improved I/M programme for control of emission from in-use vehicles.
d. Supply of clean transportation fuel (CNG etc) in all cities where it is possible to supply CNG.
e. Restriction on use of highly polluting DG Sets.
f. Controlling particulate emissions from power plant/SSI units effectively.
g. Indentifying grossly polluting in-use vehicles and phasing them out.
8/30/11
21
2. For all non-attainment cities, and critically polluted areas, action plans need to be prepared. The action plans should include emission inventories, air quality monitoring, air quality modeling, source apportionment studies, etc. Once prepared, the action plans should be implemented by corresponding state authorities and overseen by a high powered expert committee constituted by MoEF.
3. Presently fuel quality standards and vehicle exhaust standards are developed and notified by Ministry of Petroleum and Natural Gas and Ministry of Transport and Highways, respectively. However as per EP Act, 1986 and Air Act, 1981 the responsibility of maintaining air quality to the desired standards are responsibility of MoEF / CPCB / SPCBs. It is therefore felt that responsibility for framing the vehicular emission standard and fuel quality standard should be vested with MoEF.
4. Air toxics (Benzene, 1,3 butadiene, aldehydes, polycyclic aromatic hydrocarbon, metals, etc) assessment, monitoring and control should be given the highest priority. The limited measurement done by CPCB shows significantly high values of air toxics in ambient air. MoEF may setup an expert body to initiate the work on air toxic management.
5. The PM10/PM2.5 sampler used for the measurement of PM10 and PM2.5 in ambient air required thorough auditing with respect to calibration of the analyzers. MoEF may notify suitable agencies, for example CPCB, NEERI and CSIO, which should be given authority to audit the sampler. Only accredited supplier’s instrument should be used for monitoring.
6. Fuel adulteration should be checked authoritatively. An independent body should be setup by MoEF to do this. If samples of petrol / diesel are found to be adulterated in any petrol station, then the station’s license should be cancelled.
7. From the on-road vehicles fleet, grossly polluting vehicles should be identified (which may be 5%-10% of the total fleet), and they should be phased out.
8. To reduce high benzene levels in ambient air, vapour recovery systems should be installed in petrol dispensers and also benzene emission from two wheelers should be reduced.

8/30/11
22
9. As large number of DG Sets (diesel based small power generating sets) are working in almost all cities due to bad grid electricity supply, efforts should be made to improve the grid power supply so that the use of DG sets are minimized.
10. In non-attainment areas only gas based DG Sets should be permitted.
11. About 40,000 mobile towers are installed in NCR region and over 200,000 are installed in all over India. All mobile towers have DG sets as backup power. Effort should be made to reduce emission from these DG sets and DG sets should be allowed to use only clean fuel (CNG / Bio-fuel etc).
12. Large quantities of gas have been discovered in the KG basin of Andhra Coast. Government should allocate more gas as transportation fuel, especially in those cities where PM10 / PM2.5 concentrations are high and have reached at critical stage.
13. Action plans prepared by SPCBs / CPCB to control pollution from CPAs should be properly implemented. An independent high power expert body should be setup by MoEF to oversee the implementation.
14. Action plans prepared by SPCBs to control air pollution from 17 polluted cities as per Hon’ble Supreme Court direction should be properly implemented. An independent high power expert body should be setup by MoEF to oversee the implementation.

8/30/11
23
15. Road map for fuel quality improvement:
a. Since the year 2000, differential norms are implemented in metros and rest of the country due to non-availability of uniform quality fuel across the country. Due to non-availability of appropriate quality fuel, the vehicles of advance technology registered in metros and major cities are deteriorating fast, defeating the purpose.
b. Ensuring nationwide same quality of fuel will reduce emissions of in-use vehicle pollution noticeably due to the fact that the after-treatment devices and other newer technologies are very susceptible to the quality of fuel used. Very short distance exposure to low grade fuel quality may damage these devices permanently and thus make newer generations of in-use vehicles not effective or worse than those of earlier generation vehicles due to the failures of emission control devices. With this background, it is desirable to have the policy of ‘one country, one fuel quality and one regulation’.
16. Restricting the entry of polluting trucks and heavy-duty goods vehicles, and banning of old commercial vehicles in the cities.
17. As old vehicles emit more pollution, a comprehensive vehicle scrap policy needs to be evolved.
18. Management options like synchronizing traffic signals, staggering business hours, restricting vehicular movements in certain areas with high pollution levels (particularly during peak hours and/or critical season), fiscal incentives/disincentives (e.g. increased parking fee, proper fuel pricing policy), banning odd/even vehicles on major roads, etc. may be considered.
19. Development of mass rapid transportation systems. This will reduce traffic congestion, lower personalized VKT, and reduce soil and road dust re-suspension.
20. Financial incentives for non-polluting vehicles like electric- hybrid will also increase the penetration of these vehicles in public as well as in personal vehicles category.