(1) (2) (3) (4)ag...1 Alliant Energy Corporation (NYSE-LNT) 12/10 2.60 1.70 27.75 2 Ameren...
30
(1) (2) (3) (4) PER SHARE DATA ($) COMPANY EARNINGS 1 ALLETE, Inc. (NYSE-ALE) 12/10 2.19 1.78 27.26 2 American Electric Power Co. (NYSE-AEP) 12/10 2.53 1.84 27.19 3 Central Vermont Public Serv. Corp. (NYSE-CV) 12/10 1.64 0.92 20.44 4 Cleco Corporation (NYSE-CNL) 12/10 4.21 1.00 21.76 5 DPL Inc. (NYSE-DPL) 12/10 2.50 1.33 10.45 6 Edison International (NYSE-EIX) 12/10 3.84 1.28 32.48 7 El Paso Electric Company (NYSE-EE) 12/10 2.32 0.00 19.10 8 FirstEnergy Corporation (ASE-FE) 12/10 2.58 2.20 27.93 9 Great Plains Energy Incorporated (NYSE-GXP) 12/10 1.53 0.83 21.20 10 Hawaiian Electric Industries, Inc. (NYSE-HE) 12/10 1.21 1.24 15.67 11 IDACORP, Inc. (NYSE-IDA) 12/10 2.95 1.20 31.00 12 Nextra Energy (NYSE-NEE) 12/10 4.74 2.20 34.36 13 Otter Tail Corporation (NDQ-OTTR) 12/10 -0.06 1.19 17.11 14 Pinnacle West Capital Corp. (NYSE-PNW) 12/10 3.22 2.10 33.86 15 PNM Resources, Inc. (NYSE-PNM) 12/10 -0.49 0.50 18.88 16 Portland General Electric (NYSE-POR) 12/10 1.67 1.04 21.14 17 Progress Energy Inc. (NYSE-PGN) 12/10 2.94 2.48 34.21 18 Southern Company (NYSE-SO) 12/10 2.35 1.82 20.04 19 Westar Energy, Inc. (NYSE-WR) 12/10 1.80 1.28 21.25 AVERAGE PER SHARE DATA ($) LATEST 12 MONTHS CURRENT BOOK LATEST 12 MONTHS EARNINGS AVAILABLE CURRENT ANNUAL DIVIDEND BOOK VALUE (1)
Transcript of (1) (2) (3) (4)ag...1 Alliant Energy Corporation (NYSE-LNT) 12/10 2.60 1.70 27.75 2 Ameren...

(1) (2) (3) (4)
PER SHARE DATA ($)
COMPANY EARNINGS
1 ALLETE, Inc. (NYSE-ALE) 12/10 2.19 1.78 27.262 American Electric Power Co. (NYSE-AEP) 12/10 2.53 1.84 27.193 Central Vermont Public Serv. Corp. (NYSE-CV) 12/10 1.64 0.92 20.444 Cleco Corporation (NYSE-CNL) 12/10 4.21 1.00 21.765 DPL Inc. (NYSE-DPL) 12/10 2.50 1.33 10.456 Edison International (NYSE-EIX) 12/10 3.84 1.28 32.487 El Paso Electric Company (NYSE-EE) 12/10 2.32 0.00 19.108 FirstEnergy Corporation (ASE-FE) 12/10 2.58 2.20 27.939 Great Plains Energy Incorporated (NYSE-GXP) 12/10 1.53 0.83 21.20
10 Hawaiian Electric Industries, Inc. (NYSE-HE) 12/10 1.21 1.24 15.6711 IDACORP, Inc. (NYSE-IDA) 12/10 2.95 1.20 31.0012 Nextra Energy (NYSE-NEE) 12/10 4.74 2.20 34.3613 Otter Tail Corporation (NDQ-OTTR) 12/10 -0.06 1.19 17.1114 Pinnacle West Capital Corp. (NYSE-PNW) 12/10 3.22 2.10 33.8615 PNM Resources, Inc. (NYSE-PNM) 12/10 -0.49 0.50 18.8816 Portland General Electric (NYSE-POR) 12/10 1.67 1.04 21.1417 Progress Energy Inc. (NYSE-PGN) 12/10 2.94 2.48 34.2118 Southern Company (NYSE-SO) 12/10 2.35 1.82 20.0419 Westar Energy, Inc. (NYSE-WR) 12/10 1.80 1.28 21.25
AVERAGE
PER SHARE DATA ($)
LATEST 12 MONTHS
CURRENT
BOOK
LATEST 12 MONTHS EARNINGS AVAILABLE
CURRENT ANNUAL
DIVIDEND
BOOK VALUE
(1)
COMPANY EARNINGS
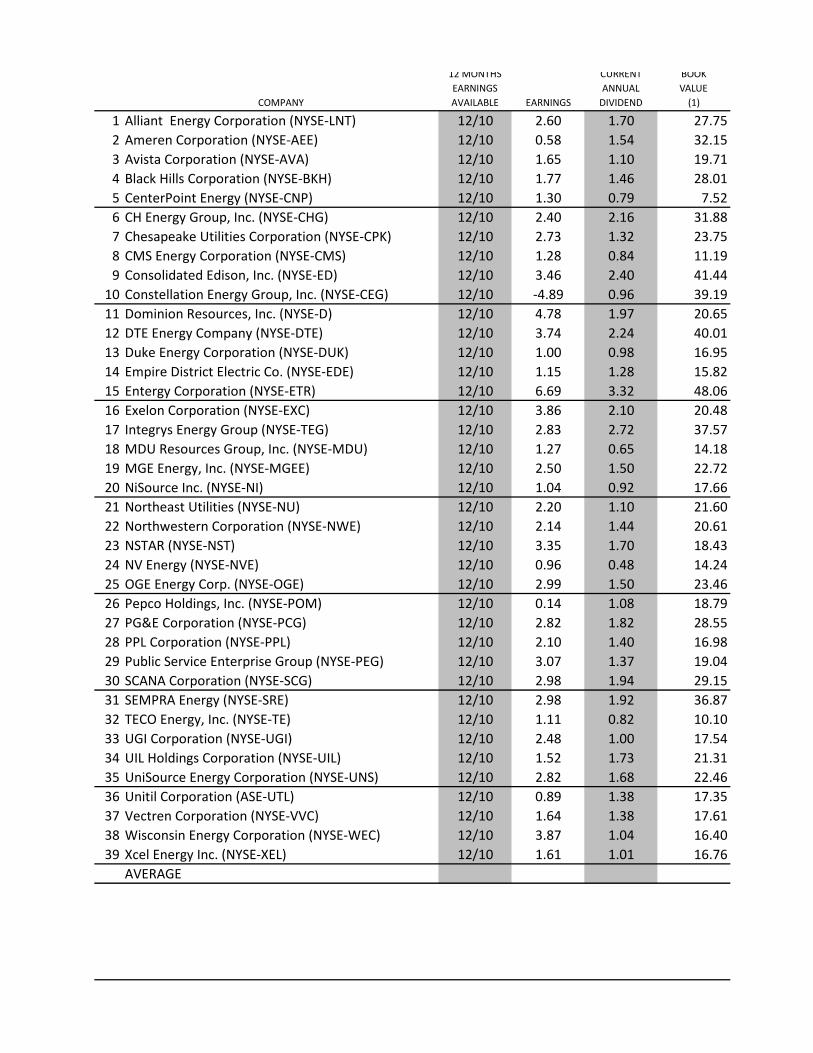
1 Alliant Energy Corporation (NYSE-LNT) 12/10 2.60 1.70 27.752 Ameren Corporation (NYSE-AEE) 12/10 0.58 1.54 32.153 Avista Corporation (NYSE-AVA) 12/10 1.65 1.10 19.714 Black Hills Corporation (NYSE-BKH) 12/10 1.77 1.46 28.015 CenterPoint Energy (NYSE-CNP) 12/10 1.30 0.79 7.526 CH Energy Group, Inc. (NYSE-CHG) 12/10 2.40 2.16 31.887 Chesapeake Utilities Corporation (NYSE-CPK) 12/10 2.73 1.32 23.758 CMS Energy Corporation (NYSE-CMS) 12/10 1.28 0.84 11.199 Consolidated Edison, Inc. (NYSE-ED) 12/10 3.46 2.40 41.44
10 Constellation Energy Group, Inc. (NYSE-CEG) 12/10 -4.89 0.96 39.1911 Dominion Resources, Inc. (NYSE-D) 12/10 4.78 1.97 20.6512 DTE Energy Company (NYSE-DTE) 12/10 3.74 2.24 40.0113 Duke Energy Corporation (NYSE-DUK) 12/10 1.00 0.98 16.9514 Empire District Electric Co. (NYSE-EDE) 12/10 1.15 1.28 15.8215 Entergy Corporation (NYSE-ETR) 12/10 6.69 3.32 48.0616 Exelon Corporation (NYSE-EXC) 12/10 3.86 2.10 20.4817 Integrys Energy Group (NYSE-TEG) 12/10 2.83 2.72 37.5718 MDU Resources Group, Inc. (NYSE-MDU) 12/10 1.27 0.65 14.1819 MGE Energy, Inc. (NYSE-MGEE) 12/10 2.50 1.50 22.7220 NiSource Inc. (NYSE-NI) 12/10 1.04 0.92 17.6621 Northeast Utilities (NYSE-NU) 12/10 2.20 1.10 21.6022 Northwestern Corporation (NYSE-NWE) 12/10 2.14 1.44 20.6123 NSTAR (NYSE-NST) 12/10 3.35 1.70 18.4324 NV Energy (NYSE-NVE) 12/10 0.96 0.48 14.2425 OGE Energy Corp. (NYSE-OGE) 12/10 2.99 1.50 23.4626 Pepco Holdings, Inc. (NYSE-POM) 12/10 0.14 1.08 18.7927 PG&E Corporation (NYSE-PCG) 12/10 2.82 1.82 28.5528 PPL Corporation (NYSE-PPL) 12/10 2.10 1.40 16.9829 Public Service Enterprise Group (NYSE-PEG) 12/10 3.07 1.37 19.0430 SCANA Corporation (NYSE-SCG) 12/10 2.98 1.94 29.1531 SEMPRA Energy (NYSE-SRE) 12/10 2.98 1.92 36.8732 TECO Energy, Inc. (NYSE-TE) 12/10 1.11 0.82 10.1033 UGI Corporation (NYSE-UGI) 12/10 2.48 1.00 17.5434 UIL Holdings Corporation (NYSE-UIL) 12/10 1.52 1.73 21.3135 UniSource Energy Corporation (NYSE-UNS) 12/10 2.82 1.68 22.4636 Unitil Corporation (ASE-UTL) 12/10 0.89 1.38 17.3537 Vectren Corporation (NYSE-VVC) 12/10 1.64 1.38 17.6138 Wisconsin Energy Corporation (NYSE-WEC) 12/10 3.87 1.04 16.4039 Xcel Energy Inc. (NYSE-XEL) 12/10 1.61 1.01 16.76
AVERAGE
12 MONTHS EARNINGS AVAILABLE
CURRENT ANNUAL
DIVIDEND
BOOK VALUE
(1)

PER SHARE DATA ($)
COMPANY EARNINGS
1 AGL Resources Inc. (NYSE-AGL) 12/10 3.00 1.80 23.422 Atmos Energy Corporation (NYSE-ATO) 12/10 2.02 1.36 25.103 Delta Natural Gas Company (NDQ-DGAS) 12/10 1.97 1.36 18.314 El Paso Corporation (NYSE-EP) 12/10 1.01 0.04 4.505 Energen Corporation (NYSE-EGN) 12/10 4.03 0.54 28.806 EQT Corporation (NYSE-EQT) 12/10 1.59 0.88 20.647 Gas Natural, Inc. (NDQ-EGAS) 9/10 1.68 0.18 8.938 Laclede Group, Inc. (NYSE-LG) 12/10 2.45 1.62 24.529 National Fuel Gas Company (NYSE-NFG) 12/10 2.95 1.38 21.31
10 New Jersey Resources Corp. (NYSE-NJR) 12/10 2.16 1.44 17.8111 NICOR Inc. (NYSE-GAS) 12/10 3.03 1.86 24.2412 Northwest Natural Gas Co. (NYSE-NWN) 12/10 2.73 1.74 25.9713 ONEOK, Inc. (NYSE-OKE) 12/10 3.10 2.08 23.0214 Piedmont Natural Gas Co., Inc. (NYSE-PNY) 1/10 1.56 1.12 14.1515 Questar Corporation (NYSE-STR) 12/10 1.91 0.61 5.8916 RGC Resources, Inc. (NDQ-RGCO) 12/10 2.02 1.36 21.1417 South Jersey Industries, Inc. (NYSE-SJI) 12/10 2.22 1.46 19.0818 Southern Union Company (NYSE-SUG) 12/10 1.86 0.60 20.0819 Southwest Gas Corporation (NYSE-SWX) 12/10 2.27 1.00 25.6020 WGL Holdings, Inc. (NYSE-WGL) 12/10 2.50 1.51 23.5121 Williams Companies, Inc. (NYSE-WMB) 12/10 -1.89 0.50 12.46
AVERAGE
PER SHARE DATA ($)
COMPANY EARNINGS
1 American States Water Co. (NYSE-AWR) 12/10 1.77 1.04 20.262 American Water Works Co., Inc. (NYSE-AWK) 12/10 1.54 0.88 23.613 Aqua America, Inc. (NYSE-WTR) 12/10 0.91 0.62 8.484 Artesian Resources Corp. (NDQ-ARTNA) 12/10 1.01 0.76 12.465 California Water Service Group (NYSE-CWT) 12/10 1.81 1.23 20.916 Connecticut Water Service, Inc. (NDQ-CTWS) 12/10 1.13 0.93 13.137 Middlesex Water Company (NDQ-MSEX) 12/10 0.96 0.73 11.138 Pennichuck Corporation (NDQ-PNNW) 12/10 0.80 0.74 12.01
LATEST 12 MONTHS EARNINGS AVAILABLE
CURRENT ANNUAL
DIVIDEND
BOOK VALUE
(1)
LATEST 12 MONTHS EARNINGS AVAILABLE
CURRENT ANNUAL
DIVIDEND
BOOK VALUE
(1)
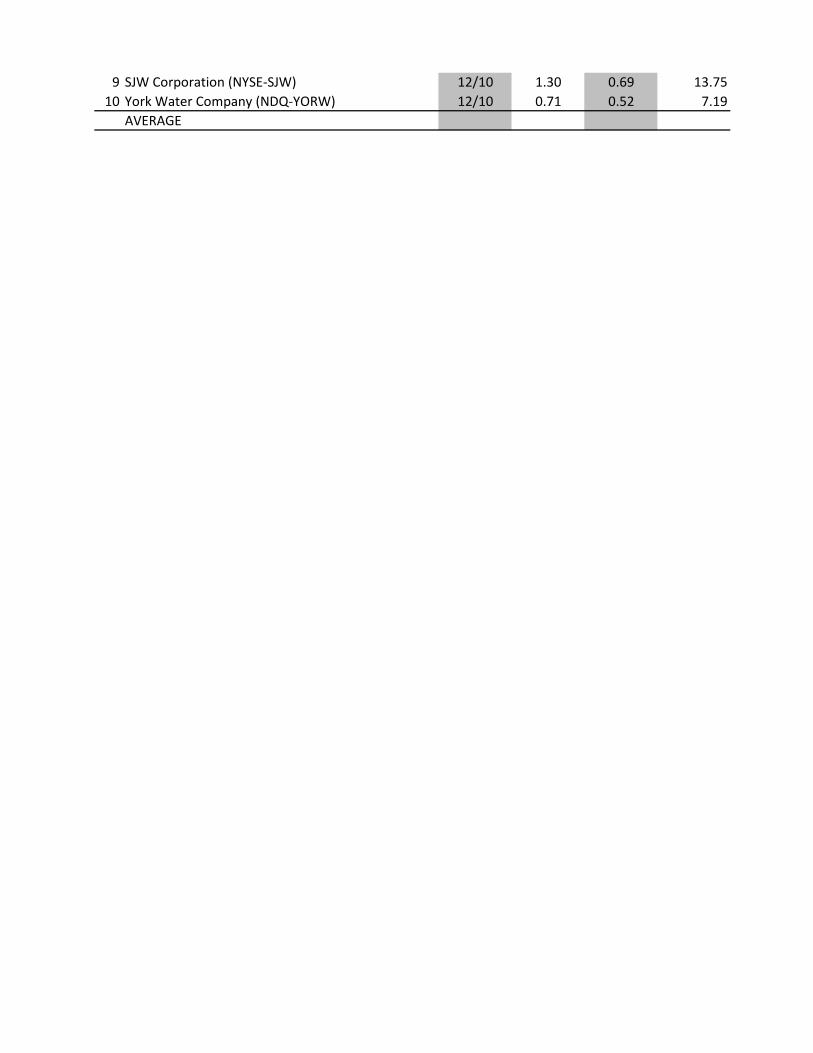
9 SJW Corporation (NYSE-SJW) 12/10 1.30 0.69 13.7510 York Water Company (NDQ-YORW) 12/10 0.71 0.52 7.19
AVERAGE

AUS MONTHLY REPORT
APRIL 2011
REPORT PAGES
(5) (6) (7) (8) (9) (10) (11) (12) (13)
ELECTRIC COMPANIES
PERCENT (2)
3/21/2011
37.64 35.8 81 4.7 138.1 6.5 17.234.06 501.0 73 5.4 125.3 6.8 13.522.80 13.3 56 4.0 111.5 4.5 13.933.23 60.5 24 3.0 152.7 4.6 7.926.52 116.6 53 5.0 253.8 12.7 10.636.40 325.8 33 3.5 112.1 3.9 9.528.28 42.4 0 0.0 148.1 NM 12.236.79 304.8 85 6.0 131.7 7.9 14.319.39 136.1 54 4.3 91.5 3.9 12.724.28 94.7 102 5.1 154.9 7.9 20.137.60 49.4 41 3.2 121.3 3.9 12.753.76 420.9 46 4.1 156.5 6.4 11.322.10 36.0 NM 5.4 129.2 7.0 NM41.91 108.8 65 5.0 123.8 6.2 13.014.60 86.7 NM 3.4 77.3 2.6 NM23.83 75.3 62 4.4 112.7 4.9 14.344.66 293.0 84 5.6 130.5 7.2 15.237.42 843.8 77 4.9 186.7 9.1 15.926.02 112.1 71 4.9 122.4 6.0 14.5
59 4.3 135.8 6.2 13.5
COMBINATION ELECTRIC & GAS COMPANIES
PERCENT (2)
DIV/
PRICE
TOTAL REV
STOCK COMMON
DIV/ BOOK
(2)
PRICE EARN MULT
DIV PAYOUT
DIV YIELD
MKT/ BOOK
STOCK PRICE
COMMON SHARES
O/S MILL

3/21/2011
38.89 110.9 65 4.4 140.1 6.1 15.0 3,417.227.51 240.4 NM 5.6 85.6 4.8 47.4 7,638.022.71 57.1 67 4.8 115.2 5.6 13.8 1,558.732.42 39.3 82 4.5 115.7 5.2 18.3 1,307.317.10 425.0 61 4.6 227.4 10.5 13.2 8,785.049.03 16.9 90 4.4 153.8 6.8 20.4 972.341.99 9.5 48 3.1 176.8 5.6 15.4 427.519.26 249.6 66 4.4 172.1 7.5 15.0 6,432.050.15 272.0 69 4.8 121.0 5.8 14.5 13,326.031.04 199.8 NM 3.1 79.2 2.4 NM 14,340.044.49 581.0 41 4.4 215.4 9.5 9.3 15,197.047.70 168.0 60 4.7 119.2 5.6 12.8 8,557.017.72 1,329.0 98 5.5 104.5 5.8 17.7 14,272.021.30 41.6 111 6.0 134.6 8.1 18.5 541.365.69 178.7 50 5.1 136.7 6.9 9.8 11,487.640.40 662.0 54 5.2 197.3 10.3 10.5 18,644.049.87 77.4 96 5.5 132.7 7.2 17.6 5,203.222.57 188.9 51 2.9 159.2 4.6 17.8 3,909.739.81 23.1 60 3.8 175.2 6.6 15.9 532.618.82 278.9 88 4.9 106.6 5.2 18.1 6,421.634.21 176.4 50 3.2 158.4 5.1 15.6 4,898.229.04 39.8 67 5.0 140.9 7.0 13.6 1,110.745.57 105.0 51 3.7 247.3 9.2 13.6 2,921.214.68 235.3 50 3.3 103.1 3.4 15.3 3,280.249.15 97.6 50 3.1 209.5 6.4 16.4 3,716.918.32 225.1 NM 5.9 97.5 5.7 130.9 7,579.043.75 395.2 65 4.2 153.2 6.4 15.5 13,841.024.68 483.4 67 5.7 145.3 8.2 11.8 8,578.030.76 506.0 45 4.5 161.6 7.2 10.0 11,793.039.00 127.0 65 5.0 133.8 6.7 13.1 4,601.052.23 240.0 64 3.7 141.7 5.2 17.5 9,003.018.07 214.9 74 4.5 178.9 8.1 16.3 2,576.532.10 111.1 40 3.1 183.0 5.7 12.9 5,738.229.41 50.5 114 5.9 138.0 8.1 19.3 997.735.65 36.5 60 4.7 158.7 7.5 12.6 1,453.723.28 10.9 155 5.9 134.2 8.0 26.2 358.426.78 81.7 84 5.2 152.1 7.8 16.3 2,129.530.07 233.7 27 3.5 183.4 6.3 7.8 4,209.823.69 482.3 63 4.3 141.3 6.0 14.7 10,310.9
68 4.5 149.5 6.6 19.0
NATURAL GAS DISTRIBUTION, TRANSMISSION AND INTEGRATED NATURAL G
MKT/ BOOK
DIV/ BOOK
(2)
PRICE EARN MULT
REV
$MILL (1)
PRICE
COMMON SHARES
O/S MILLDIV
PAYOUTDIV
YIELD

PERCENT (2)
3/21/2011
39.30 77.4 60 4.6 167.8 7.7 13.133.90 90.6 67 4.0 135.1 5.4 16.831.60 3.4 69 4.3 172.6 7.4 16.017.85 704.3 4 0.2 396.7 0.9 17.763.15 74.8 13 0.9 219.3 1.9 15.747.73 149.2 55 1.8 231.2 4.3 30.011.20 6.1 11 1.6 125.4 2.0 6.737.51 22.4 66 4.3 153.0 6.6 15.370.97 82.3 47 1.9 333.0 6.5 24.142.07 41.4 67 3.4 236.2 8.1 19.553.51 45.5 61 3.5 220.8 7.7 17.746.74 26.7 64 3.7 180.0 6.7 17.166.17 106.4 67 3.1 287.4 9.0 21.329.64 71.8 72 3.8 209.5 7.9 19.017.38 176.0 32 3.5 295.1 10.4 9.131.25 2.3 67 4.4 147.8 6.4 15.554.97 29.9 66 2.7 288.1 7.7 24.828.50 125.8 32 2.1 141.9 3.0 15.338.60 45.6 44 2.6 150.8 3.9 17.038.46 51.1 60 3.9 163.6 6.4 15.430.75 585.0 NM 1.6 246.8 4.0 NM
51 3.0 214.4 5.9 17.3
WATER COMPANIES
PERCENT (2)
3/21/2011
33.76 18.6 59 3.1 166.6 5.1 19.127.50 175.0 57 3.2 116.5 3.7 17.922.38 138.4 68 2.8 263.9 7.3 24.619.22 7.6 75 3.9 154.3 6.1 19.035.98 20.8 68 3.4 172.1 5.9 19.925.41 8.7 82 3.7 193.5 7.1 22.518.03 15.6 76 4.1 162.0 6.6 18.828.50 4.7 93 2.6 237.3 6.2 35.6
STOCK PRICE
COMMON SHARES
O/S MILLDIV
PAYOUTDIV
YIELDMKT/ BOOK
DIV/ BOOK
(2)
PRICE EARN MULT
DIV PAYOUT
DIV YIELD
MKT/ BOOK
DIV/ BOOK
(2)
PRICE EARN MULT
STOCK PRICE
COMMON SHARES
O/S MILL

22.90 18.6 53 3.0 166.5 5.0 17.616.89 12.7 74 3.1 234.9 7.3 23.8
71 3.3 186.8 6.0 21.9

(14) (15) (16) (17) (18) (19) (20) (21) (22)
907.0 92 1,805.6 1.99 A- Baa1 55.1 7.9 7.514,427.0 95 35,674.0 2.47 BBB Baa2 42.8 9.1 7.1
341.9 98 371.5 1.09 NR Baa1 53.9 6.2 5.61,148.7 98 2,784.2 2.42 BBB Baa2 45.7 21.0 14.81,883.1 95 2,918.1 1.55 A Aa3 47.5 24.8 14.3
12,408.0 80 30,184.0 2.43 BBB+ A1 44.0 12.3 8.9877.3 61 1,865.8 2.13 BBB Baa2 48.7 13.1 9.4
13,337.0 75 19,788.0 1.48 BBB Baa1 36.2 9.2 6.22,255.5 100 6,892.3 3.06 BBB Baa2 42.9 7.4 6.02,665.0 89 3,165.9 1.19 BBB- Baa2 51.0 7.8 5.61,036.0 100 3,161.4 3.05 A- A2 47.7 9.7 7.4
15,317.0 68 39,075.0 2.55 A Aa3 39.9 14.3 8.81,119.1 30 1,108.7 0.99 BBB-/BB+ Baa2 53.7 NM 3.13,276.9 97 9,393.9 2.87 BBB- Baa2 50.0 10.0 7.91,673.6 100 3,444.4 2.06 BBB-/BB+ Baa2 45.3 NM 2.51,783.0 98 4,133.0 2.32 A- A3 46.5 8.0 7.0
10,190.0 100 21,240.0 2.08 A/A- A1/A2 44.6 8.8 7.417,455.6 96 42,002.0 2.41 A A2/A3 43.0 12.2 7.7
2,056.2 100 5,964.4 2.90 BBB+ Baa1 43.8 8.8 7.246.4 11.2 7.6
NET
NET PLANT PER$
S&P
MOODY'S
COMMON EQUITY
% REG
% REG
% RETURN ON BOOK VALUE
S&P BOND
RATING
MOODY'S BOND
RATING
COMMON EQUITY RATIO
(3)COMMON EQUITY (4)
TOTAL CAPITAL
TOTAL REV
$MILL (1)
% REG ELEC REV
NET PLANT $ MILL
NET PLANT PER$ REV (1)
% RETURN ON BOOK VALUE

78 14 6,730.6 1.97 A-/BBB+ A2/A3 50.7 9.8 8.285 15 17,853.0 2.34 BBB- Baa2 49.5 1.8 4.063 33 2,714.2 1.74 BBB+ Baa1 45.1 8.5 7.144 42 2,495.4 1.91 BBB+ A3 43.3 6.3 7.325 42 11,732.0 1.34 BBB+ A3 25.2 15.1 8.058 16 1,054.7 1.08 A A3 50.6 7.2 6.522 41 462.8 1.08 NR NR 58.2 12.0 9.259 37 10,069.0 1.57 BBB+ A3 27.3 12.0 8.168 13 23,817.0 1.79 A- A3/Baa1 50.9 9.1 7.519 5 9,278.8 0.65 BBB+ Baa2 60.7 NM NM47 12 26,713.0 1.76 A Baa1/Baa2 40.1 24.2 12.958 20 12,992.0 1.52 A A2 45.0 9.7 8.075 4 40,344.0 2.83 A- A2 54.8 6.0 5.490 9 1,519.1 2.81 BBB+ A3 47.8 8.2 5.576 2 23,848.4 2.08 A-/BBB+ Baa1 41.5 14.5 9.159 4 29,941.0 1.61 A- A2/A3 51.2 19.6 13.026 40 5,013.4 0.96 A-/BBB+ A2/A3 51.8 7.6 6.65 23 4,115.2 1.05 NR Baa1 63.5 9.2 7.9
68 31 968.0 1.82 AA- A1 59.4 11.1 7.822 68 11,097.0 1.73 BBB- Baa2 40.1 6.0 5.784 9 9,567.7 1.95 BBB A3 42.8 10.5 7.271 29 2,118.0 1.91 NR NR 42.6 9.6 7.785 15 4,755.3 1.63 AA-/A+ A1 41.0 18.5 7.194 6 8,929.7 2.72 BBB Ba2 38.8 6.9 6.557 11 6,464.4 1.74 BBB+ Baa1 46.7 13.6 9.264 3 7,673.0 1.01 A A3 47.5 0.8 3.677 23 31,449.0 2.27 BBB+ A3 46.8 10.2 7.842 1 20,858.0 2.43 A- A3 37.6 13.7 8.942 24 16,390.0 1.39 A- A2 52.2 17.0 11.352 21 9,432.0 2.05 A- A3 43.0 10.6 7.628 48 19,876.0 2.21 A+ Aa3 47.5 8.3 6.584 21 5,841.0 2.27 BBB Baa1 40.1 11.4 8.82 18 3,109.0 0.54 NR A3 43.5 33.7 17.0
86 14 2,327.5 2.33 NR Baa2 39.1 10.4 6.883 10 2,961.5 2.04 BBB+ NR 30.2 14.2 8.357 42 476.5 1.33 NR NR 34.6 5.0 3.229 45 2,955.4 1.39 A- A2 44.4 9.4 7.070 28 9,601.5 2.28 A- A1 42.9 12.3 7.682 17 20,663.1 2.00 A A3 45.0 9.8 7.8
45.2 11.2 7.8
GAS COMPANIES
TOTAL CAPITAL
COMMON EQUITY (4)
NET PLANT $ MILL
PER$ REV (1)
S&P BOND
RATING
MOODY'S BOND
RATING
EQUITY RATIO
(3)
REG ELEC REV
REG GAS REV

2,373.0 63 4,405.0 1.86 A- A3 39.9 13.0 7.74,653.8 65 4,859.3 1.04 BBB+ Baa2 48.6 8.3 7.4
80.9 62 131.9 1.63 NR NR 48.5 11.0 8.44,616.0 61 21,072.0 4.56 B+/B Baa3 15.2 25.6 10.11,551.0 40 3,719.2 2.40 BBB A1 75.1 14.0 12.21,322.7 80 5,910.1 4.47 BBB NR 60.6 8.7 7.9
81.8 90 73.2 0.89 NR NR 54.4 19.7 13.41,688.1 51 891.0 0.53 A A2 54.3 10.1 7.81,754.4 58 3,601.2 2.05 BBB Baa1 62.1 13.0 10.72,742.9 36 1,153.1 0.42 A+ NR 48.4 12.3 7.62,709.8 81 3,022.8 1.12 AA Aa3 54.5 12.9 9.0
367.6 94 1,854.2 5.04 A+ A1 44.7 10.8 8.013,030.1 19 7,313.2 0.56 BBB Baa2 27.8 14.4 7.9
1,530.6 100 2,453.6 1.60 A A3 49.2 11.2 8.01,693.0 57 2,884.6 1.70 A A3 43.9 8.4 8.4
73.2 98 82.2 1.12 NR NR 63.3 9.7 8.5925.1 51 1,193.3 1.29 A A2 44.8 12.0 7.6
2,489.9 59 5,704.5 2.29 BBB- Baa3 39.8 8.9 8.61,830.4 83 3,072.4 1.68 BBB Baa2 49.3 9.2 7.72,777.3 49 2,357.6 0.85 AA- A2 59.5 10.9 8.39,616.0 59 20,272.0 2.11 BBB- Baa2 41.1 NM NM
48.8 12.2 8.8
400.8 73 855.0 2.13 A+ A2 51.1 9.0 7.42,710.7 89 11,058.6 4.08 A+ Baa1 42.0 9.6 7.3
726.1 98 3,469.3 4.78 AA- NR 41.6 10.9 7.464.9 92 345.4 5.32 NR NR 41.1 8.2 5.5
460.4 94 1,270.2 2.76 AA- NR 46.3 8.8 4.768.1 99 344.2 5.05 A NR 45.1 8.8 4.6
102.7 90 398.7 3.88 A NR 52.2 9.0 6.536.5 93 158.8 4.35 NR NR 48.0 6.8 6.2
TOTAL CAPITAL
NET PLANT $ MILL
NET PLANT PER$ REV (1)
S&P BOND
RATING
MOODY'S BOND
RATING
COMMON EQUITY RATIO
(3)COMMON EQUITY (4)
% REG
WATER REV
TOTAL REV
$MILL (1)
COMMON EQUITY (4)
TOTAL CAPITAL
% RETURN ON BOOK VALUE
COMMON EQUITY RATIO
(3)
TOTAL REV
$MILL (1)
% REG GAS REV
NET PLANT $ MILL
NET PLANT PER$ REV (1)
S&P BOND
RATING
MOODY'S BOND
RATING
% RETURN ON BOOK VALUE
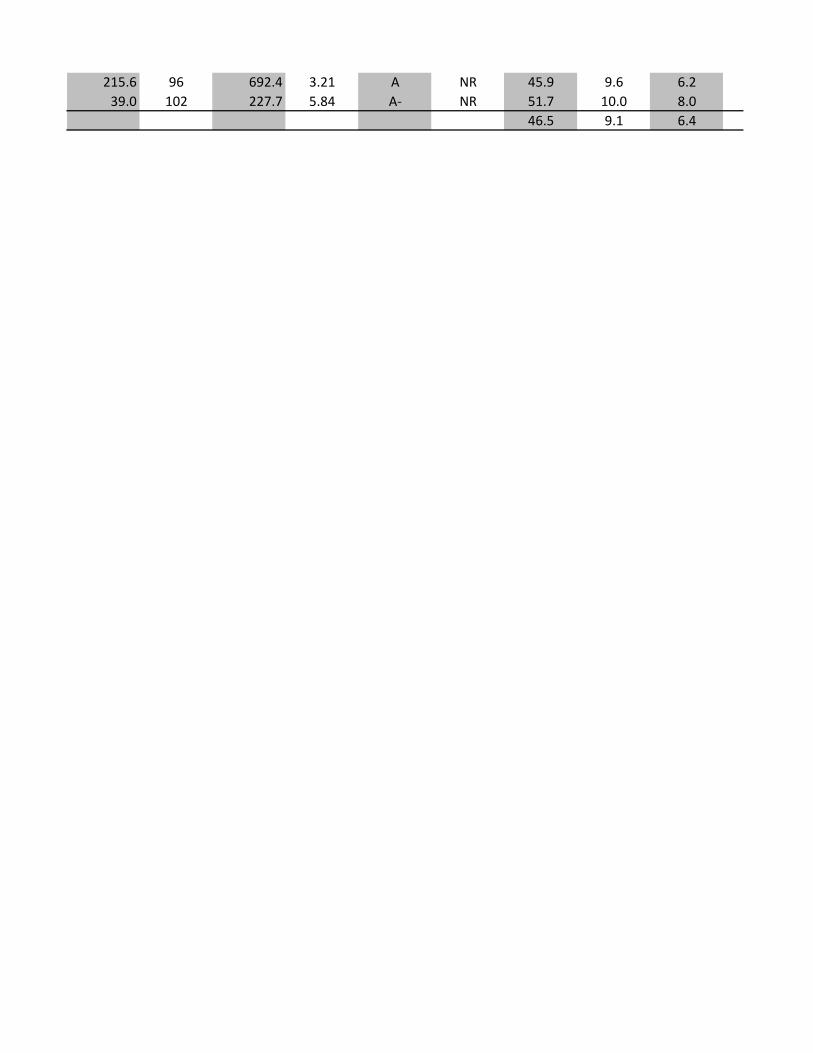
215.6 96 692.4 3.21 A NR 45.9 9.6 6.239.0 102 227.7 5.84 A- NR 51.7 10.0 8.0
46.5 9.1 6.4

(23) (24) (25)
10.38 11/1010.68 -10.71 01/0810.70 10/0911.00 12/0510.68 -11.25 -10.67 -10.38 -10.47 -10.18 05/0910.50 03/1010.59 -11.00 12/0910.35 -10.00 12/1012.00 -11.90 -10.20 12/0510.72
ORDER DATE
REGULATION
ALLOWED ROE
REGULATION
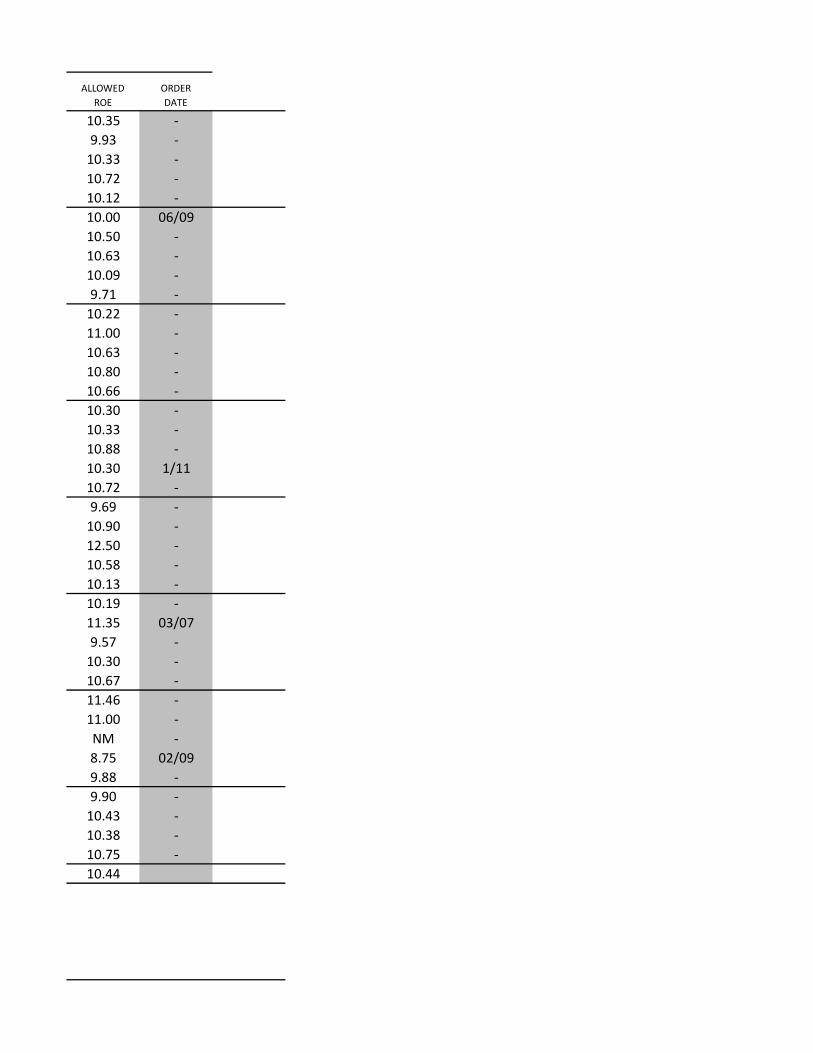
10.35 -9.93 -
10.33 -10.72 -10.12 -10.00 06/0910.50 -10.63 -10.09 -9.71 -
10.22 -11.00 -10.63 -10.80 -10.66 -10.30 -10.33 -10.88 -10.30 1/1110.72 -9.69 -
10.90 -12.50 -10.58 -10.13 -10.19 -11.35 03/079.57 -
10.30 -10.67 -11.46 -11.00 -NM -8.75 02/099.88 -9.90 -
10.43 -10.38 -10.75 -10.44
ALLOWED ROE
ORDER DATE

10.46 -11.71 -10.40 10/10NM 11/02
13.40 06/0211.00 -12.63 -NM 10/059.50 -
10.30 10/0810.17 03/0910.20 -10.50 -10.60 -10.00 08/089.85 -
10.30 9/16/201010.03 -10.22 -10.20 -NM -
10.64
10.20 5/099.63 -
10.33 -10.00 09/0910.20 05/099.75 07/10
10.15 -9.75 -
ALLOWED ROE
ORDER DATE
ALLOWED ROE
ORDER DATE
REGULATION
REGULATION

10.20 10/10NM 10/08
10.02

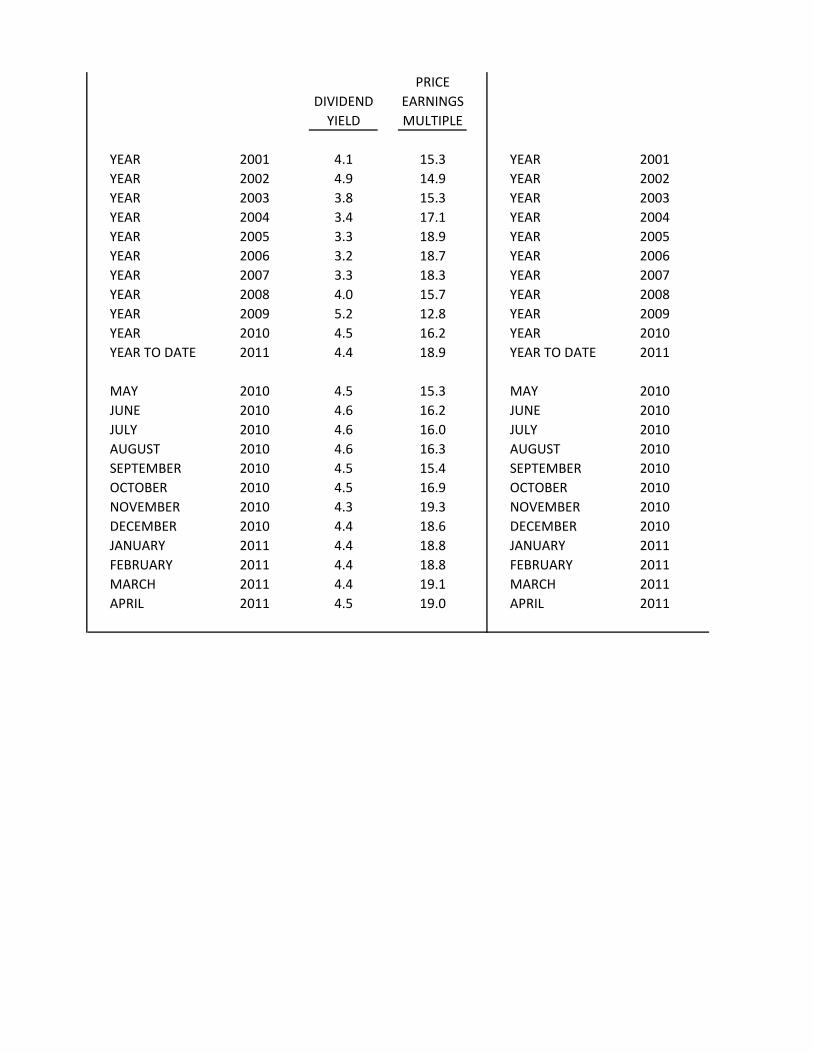
PRICEDIVIDEND EARNINGS
YIELD MULTIPLE
YEAR 2001 4.5 14.0 YEAR 2001YEAR 2002 5.0 14.8 YEAR 2002YEAR 2003 5.0 15.4 YEAR 2003YEAR 2004 4.4 18.4 YEAR 2004YEAR 2005 4.1 20.9 YEAR 2005YEAR 2006 3.8 20.8 YEAR 2006YEAR 2007 3.4 18.5 YEAR 2007YEAR 2008 3.9 16.1 YEAR 2008YEAR 2009 4.8 14.1 YEAR 2009YEAR 2010 4.3 18.1 YEAR 2010YEAR TO DATE 2011 4.3 22.5 YEAR TO DATE 2011
MAY 2010 4.3 16.9 MAY 2010JUNE 2010 4.3 14.9 JUNE 2010JULY 2010 4.4 14.7 JULY 2010AUGUST 2010 4.4 14.7 AUGUST 2010SEPTEMBER 2010 4.4 13.6 SEPTEMBER 2010OCTOBER 2010 4.3 17.2 OCTOBER 2010NOVEMBER 2010 4.1 26.7 NOVEMBER 2010DECEMBER 2010 4.2 26.3 DECEMBER 2010JANUARY 2011 4.1 31.4 JANUARY 2011FEBRUARY 2011 4.3 22.5 FEBRUARY 2011MARCH 2011 4.3 22.8 MARCH 2011APRIL 2011 4.3 13.5 APRIL 2011
AUS MONTHLY REPORT
NATURAL GAS DISTRIBU & INTEGRATED CO
COMBINED ELECTRIC & GASDISTRIBUTION COMPANIES
ELECTRIC COMPANIES
WATER COMP
COMPOSITE INDEX
PRICEDIVIDEND EARNINGS
YIELD MULTIPLE
YEAR 2001 4.1 15.3 YEAR 2001YEAR 2002 4.9 14.9 YEAR 2002YEAR 2003 3.8 15.3 YEAR 2003YEAR 2004 3.4 17.1 YEAR 2004YEAR 2005 3.3 18.9 YEAR 2005YEAR 2006 3.2 18.7 YEAR 2006YEAR 2007 3.3 18.3 YEAR 2007YEAR 2008 4.0 15.7 YEAR 2008YEAR 2009 5.2 12.8 YEAR 2009YEAR 2010 4.5 16.2 YEAR 2010YEAR TO DATE 2011 4.4 18.9 YEAR TO DATE 2011
MAY 2010 4.5 15.3 MAY 2010JUNE 2010 4.6 16.2 JUNE 2010JULY 2010 4.6 16.0 JULY 2010AUGUST 2010 4.6 16.3 AUGUST 2010SEPTEMBER 2010 4.5 15.4 SEPTEMBER 2010OCTOBER 2010 4.5 16.9 OCTOBER 2010NOVEMBER 2010 4.3 19.3 NOVEMBER 2010DECEMBER 2010 4.4 18.6 DECEMBER 2010JANUARY 2011 4.4 18.8 JANUARY 2011FEBRUARY 2011 4.4 18.8 FEBRUARY 2011MARCH 2011 4.4 19.1 MARCH 2011APRIL 2011 4.5 19.0 APRIL 2011

PRICEDIVIDEND EARNINGS
YIELD MULTIPLE
4.1 16.64.3 17.34.0 16.23.3 17.03.1 19.83.1 17.22.9 19.5
13.1 17.43.8 14.43.2 18.63.0 16.8
3.1 20.33.2 17.63.2 17.83.3 16.73.3 16.13.2 16.33.2 17.03.2 17.13.1 16.33.0 16.73.0 16.83.0 17.3
UTION TRANSM. OMPANIES
PANIES

PRICEDIVIDEND EARNINGS
YIELD MULTIPLE
3.4 21.43.1 22.23.2 23.23.1 27.92.8 28.72.8 30.92.8 28.13.1 23.13.5 21.33.4 23.73.2 23.1
3.3 29.03.3 29.03.4 25.63.4 26.13.5 22.03.6 22.83.3 22.63.4 22.53.1 24.03.2 23.73.3 22.73.3 21.9

AUS MONTHLY REPO
APRIL 2011AUS INDUSTRY RANKI
ELECTRIC COMPANIE
DIVIDEND YIELDHIGH
FirstEnergy Corporation (ASE-FE) 6.0Progress Energy Inc. (NYSE-PGN) 5.6American Electric Power Co. (NYSE-AEP) 5.4Otter Tail Corporation (NDQ-OTTR) 5.4Hawaiian Electric Industries, Inc. (NYSE-HE) 5.1DPL Inc. (NYSE-DPL) 5.0Pinnacle West Capital Corp. (NYSE-PNW) 5.0Westar Energy, Inc. (NYSE-WR) 4.9Southern Company (NYSE-SO) 4.9ALLETE, Inc. (NYSE-ALE) 4.7
MARKET/BOOK RATHIGH
DPL Inc. (NYSE-DPL) 254Southern Company (NYSE-SO) 187Nextra Energy (NYSE-NEE) 157Hawaiian Electric Industries, Inc. (NYSE-HE) 155Cleco Corporation (NYSE-CNL) 153El Paso Electric Company (NYSE-EE) 148ALLETE, Inc. (NYSE-ALE) 138FirstEnergy Corporation (ASE-FE) 132Progress Energy Inc. (NYSE-PGN) 131Otter Tail Corporation (NDQ-OTTR) 129
PRICE/EARNINGS MULTHIGH
Hawaiian Electric Industries, Inc. (NYSE-HE) 20.1ALLETE, Inc. (NYSE-ALE) 17.2Southern Company (NYSE-SO) 15.9Progress Energy Inc. (NYSE-PGN) 15.2Westar Energy, Inc. (NYSE-WR) 14.5Portland General Electric (NYSE-POR) 14.3FirstEnergy Corporation (ASE-FE) 14.3Central Vermont Public Serv. Corp. (NYSE-CV) 13.9American Electric Power Co. (NYSE-AEP) 13.5Pinnacle West Capital Corp. (NYSE-PNW) 13.0

RETURN ON BOOK VALUE OF COM HIGH
DPL Inc. (NYSE-DPL) 24.8Cleco Corporation (NYSE-CNL) 21.0Nextra Energy (NYSE-NEE) 14.3El Paso Electric Company (NYSE-EE) 13.1Edison International (NYSE-EIX) 12.3Southern Company (NYSE-SO) 12.2Pinnacle West Capital Corp. (NYSE-PNW) 10.0IDACORP, Inc. (NYSE-IDA) 9.7FirstEnergy Corporation (ASE-FE) 9.2American Electric Power Co. (NYSE-AEP) 9.1
COMBINATION ELECTRIC & GAS
DIVIDEND YIELDHIGH
Empire District Electric Co. (NYSE-EDE) 6.0Unitil Corporation (ASE-UTL) 5.9Pepco Holdings, Inc. (NYSE-POM) 5.9UIL Holdings Corporation (NYSE-UIL) 5.9PPL Corporation (NYSE-PPL) 5.7Ameren Corporation (NYSE-AEE) 5.6Duke Energy Corporation (NYSE-DUK) 5.5Integrys Energy Group (NYSE-TEG) 5.5Exelon Corporation (NYSE-EXC) 5.2Vectren Corporation (NYSE-VVC) 5.2
MARKET/BOOK RATHIGH
NSTAR (NYSE-NST) 247CenterPoint Energy (NYSE-CNP) 227Dominion Resources, Inc. (NYSE-D) 215OGE Energy Corp. (NYSE-OGE) 210Exelon Corporation (NYSE-EXC) 197Wisconsin Energy Corporation (NYSE-WEC) 183UGI Corporation (NYSE-UGI) 183TECO Energy, Inc. (NYSE-TE) 179Chesapeake Utilities Corporation (NYSE-CPK) 177MGE Energy, Inc. (NYSE-MGEE) 175
PRICE/EARNINGS MULTHIGH

Pepco Holdings, Inc. (NYSE-POM) 130.9Ameren Corporation (NYSE-AEE) 47.4Unitil Corporation (ASE-UTL) 26.2CH Energy Group, Inc. (NYSE-CHG) 20.4UIL Holdings Corporation (NYSE-UIL) 19.3Empire District Electric Co. (NYSE-EDE) 18.5Black Hills Corporation (NYSE-BKH) 18.3NiSource Inc. (NYSE-NI) 18.1MDU Resources Group, Inc. (NYSE-MDU) 17.8Duke Energy Corporation (NYSE-DUK) 17.7
RETURN ON BOOK VALUE OF COM HIGH
UGI Corporation (NYSE-UGI) 33.7Dominion Resources, Inc. (NYSE-D) 24.2Exelon Corporation (NYSE-EXC) 19.6NSTAR (NYSE-NST) 18.5Public Service Enterprise Group (NYSE-PEG) 17.0CenterPoint Energy (NYSE-CNP) 15.1Entergy Corporation (NYSE-ETR) 14.5UniSource Energy Corporation (NYSE-UNS) 14.2PPL Corporation (NYSE-PPL) 13.7OGE Energy Corp. (NYSE-OGE) 13.6
NATURAL GAS DISTRIBUTION, TRANSMISSION AND INT
DIVIDEND YIELDHIGH
AGL Resources Inc. (NYSE-AGL) 4.6RGC Resources, Inc. (NDQ-RGCO) 4.4Laclede Group, Inc. (NYSE-LG) 4.3Delta Natural Gas Company (NDQ-DGAS) 4.3Atmos Energy Corporation (NYSE-ATO) 4.0WGL Holdings, Inc. (NYSE-WGL) 3.9Piedmont Natural Gas Co., Inc. (NYSE-PNY) 3.8Northwest Natural Gas Co. (NYSE-NWN) 3.7Questar Corporation (NYSE-STR) 3.5NICOR Inc. (NYSE-GAS) 3.5
MARKET/BOOK RATHIGH
El Paso Corporation (NYSE-EP) 397National Fuel Gas Company (NYSE-NFG) 333

Questar Corporation (NYSE-STR) 295South Jersey Industries, Inc. (NYSE-SJI) 288ONEOK, Inc. (NYSE-OKE) 287Williams Companies, Inc. (NYSE-WMB) 247New Jersey Resources Corp. (NYSE-NJR) 236EQT Corporation (NYSE-EQT) 231NICOR Inc. (NYSE-GAS) 221Energen Corporation (NYSE-EGN) 219
PRICE/EARNINGS MULTHIGH
EQT Corporation (NYSE-EQT) 30.0South Jersey Industries, Inc. (NYSE-SJI) 24.8National Fuel Gas Company (NYSE-NFG) 24.1ONEOK, Inc. (NYSE-OKE) 21.3New Jersey Resources Corp. (NYSE-NJR) 19.5Piedmont Natural Gas Co., Inc. (NYSE-PNY) 19.0El Paso Corporation (NYSE-EP) 17.7NICOR Inc. (NYSE-GAS) 17.7Northwest Natural Gas Co. (NYSE-NWN) 17.1Southwest Gas Corporation (NYSE-SWX) 17.0
RETURN ON BOOK VALUE OF COM HIGH
El Paso Corporation (NYSE-EP) 25.6Gas Natural, Inc. (NDQ-EGAS) 19.7ONEOK, Inc. (NYSE-OKE) 14.4Energen Corporation (NYSE-EGN) 14.0AGL Resources Inc. (NYSE-AGL) 13.0National Fuel Gas Company (NYSE-NFG) 13.0NICOR Inc. (NYSE-GAS) 12.9New Jersey Resources Corp. (NYSE-NJR) 12.3South Jersey Industries, Inc. (NYSE-SJI) 12.0Piedmont Natural Gas Co., Inc. (NYSE-PNY) 11.2
WATER COMPANIE
DIVIDEND YIELDHIGH
Middlesex Water Company (NDQ-MSEX) 4.1Artesian Resources Corp. (NDQ-ARTNA) 3.9Connecticut Water Service, Inc. (NDQ-CTWS) 3.7California Water Service Group (NYSE-CWT) 3.4

MARKET/BOOK RATHIGH
Aqua America, Inc. (NYSE-WTR) 264Pennichuck Corporation (NDQ-PNNW) 237York Water Company (NDQ-YORW) 235Connecticut Water Service, Inc. (NDQ-CTWS) 194
PRICE/EARNINGS MULTHIGH
Pennichuck Corporation (NDQ-PNNW) 35.6Aqua America, Inc. (NYSE-WTR) 24.6York Water Company (NDQ-YORW) 23.8Connecticut Water Service, Inc. (NDQ-CTWS) 22.5
RETURN ON BOOK VALUE OF COM HIGH
Aqua America, Inc. (NYSE-WTR) 10.9York Water Company (NDQ-YORW) 10.0SJW Corporation (NYSE-SJW) 9.6American Water Works Co., Inc. (NYSE-AWK) 9.6

ORT
NGS
ES
LOW
El Paso Electric Company (NYSE-EE) 0.0Cleco Corporation (NYSE-CNL) 3.0IDACORP, Inc. (NYSE-IDA) 3.2PNM Resources, Inc. (NYSE-PNM) 3.4Edison International (NYSE-EIX) 3.5Central Vermont Public Serv. Corp. (NYSE-CV) 4.0Nextra Energy (NYSE-NEE) 4.1Great Plains Energy Incorporated (NYSE-GXP) 4.3Portland General Electric (NYSE-POR) 4.4ALLETE, Inc. (NYSE-ALE) 4.7
TIOLOW
PNM Resources, Inc. (NYSE-PNM) 77Great Plains Energy Incorporated (NYSE-GXP) 92Central Vermont Public Serv. Corp. (NYSE-CV) 112Edison International (NYSE-EIX) 112Portland General Electric (NYSE-POR) 113IDACORP, Inc. (NYSE-IDA) 121Westar Energy, Inc. (NYSE-WR) 122Pinnacle West Capital Corp. (NYSE-PNW) 124American Electric Power Co. (NYSE-AEP) 125Otter Tail Corporation (NDQ-OTTR) 129
TIPLELOW
Cleco Corporation (NYSE-CNL) 7.9Edison International (NYSE-EIX) 9.5DPL Inc. (NYSE-DPL) 10.6Nextra Energy (NYSE-NEE) 11.3El Paso Electric Company (NYSE-EE) 12.2Great Plains Energy Incorporated (NYSE-GXP) 12.7IDACORP, Inc. (NYSE-IDA) 12.7Pinnacle West Capital Corp. (NYSE-PNW) 13.0American Electric Power Co. (NYSE-AEP) 13.5Central Vermont Public Serv. Corp. (NYSE-CV) 13.9

MMON EQUITYLOW
Central Vermont Public Serv. Corp. (NYSE-CV) 6.2Great Plains Energy Incorporated (NYSE-GXP) 7.4Hawaiian Electric Industries, Inc. (NYSE-HE) 7.8ALLETE, Inc. (NYSE-ALE) 7.9Portland General Electric (NYSE-POR) 8.0Progress Energy Inc. (NYSE-PGN) 8.8Westar Energy, Inc. (NYSE-WR) 8.8American Electric Power Co. (NYSE-AEP) 9.1FirstEnergy Corporation (ASE-FE) 9.2IDACORP, Inc. (NYSE-IDA) 9.7
S COMPANIES
LOW
MDU Resources Group, Inc. (NYSE-MDU) 2.9OGE Energy Corp. (NYSE-OGE) 3.1Constellation Energy Group, Inc. (NYSE-CEG) 3.1UGI Corporation (NYSE-UGI) 3.1Chesapeake Utilities Corporation (NYSE-CPK) 3.1Northeast Utilities (NYSE-NU) 3.2NV Energy (NYSE-NVE) 3.3Wisconsin Energy Corporation (NYSE-WEC) 3.5SEMPRA Energy (NYSE-SRE) 3.7NSTAR (NYSE-NST) 3.7
TIOLOW
Constellation Energy Group, Inc. (NYSE-CEG) 79Ameren Corporation (NYSE-AEE) 86Pepco Holdings, Inc. (NYSE-POM) 98NV Energy (NYSE-NVE) 103Duke Energy Corporation (NYSE-DUK) 105NiSource Inc. (NYSE-NI) 107Avista Corporation (NYSE-AVA) 115Black Hills Corporation (NYSE-BKH) 116DTE Energy Company (NYSE-DTE) 119Consolidated Edison, Inc. (NYSE-ED) 121
TIPLELOW

Wisconsin Energy Corporation (NYSE-WEC) 7.8Dominion Resources, Inc. (NYSE-D) 9.3Entergy Corporation (NYSE-ETR) 9.8Public Service Enterprise Group (NYSE-PEG) 10.0Exelon Corporation (NYSE-EXC) 10.5PPL Corporation (NYSE-PPL) 11.8UniSource Energy Corporation (NYSE-UNS) 12.6DTE Energy Company (NYSE-DTE) 12.8UGI Corporation (NYSE-UGI) 12.9SCANA Corporation (NYSE-SCG) 13.1
MMON EQUITYLOW
Pepco Holdings, Inc. (NYSE-POM) 0.8Ameren Corporation (NYSE-AEE) 1.8Unitil Corporation (ASE-UTL) 5.0Duke Energy Corporation (NYSE-DUK) 6.0NiSource Inc. (NYSE-NI) 6.0Black Hills Corporation (NYSE-BKH) 6.3NV Energy (NYSE-NVE) 6.9CH Energy Group, Inc. (NYSE-CHG) 7.2Integrys Energy Group (NYSE-TEG) 7.6Empire District Electric Co. (NYSE-EDE) 8.2
TEGRATED NATURAL GAS COMPANIES
LOW
El Paso Corporation (NYSE-EP) 0.2Energen Corporation (NYSE-EGN) 0.9Gas Natural, Inc. (NDQ-EGAS) 1.6Williams Companies, Inc. (NYSE-WMB) 1.6EQT Corporation (NYSE-EQT) 1.8National Fuel Gas Company (NYSE-NFG) 1.9Southern Union Company (NYSE-SUG) 2.1Southwest Gas Corporation (NYSE-SWX) 2.6South Jersey Industries, Inc. (NYSE-SJI) 2.7ONEOK, Inc. (NYSE-OKE) 3.1
TIOLOW
Gas Natural, Inc. (NDQ-EGAS) 125Atmos Energy Corporation (NYSE-ATO) 135

Southern Union Company (NYSE-SUG) 142RGC Resources, Inc. (NDQ-RGCO) 148Southwest Gas Corporation (NYSE-SWX) 151Laclede Group, Inc. (NYSE-LG) 153WGL Holdings, Inc. (NYSE-WGL) 164AGL Resources Inc. (NYSE-AGL) 168Delta Natural Gas Company (NDQ-DGAS) 173Northwest Natural Gas Co. (NYSE-NWN) 180
TIPLELOW
Gas Natural, Inc. (NDQ-EGAS) 6.7Questar Corporation (NYSE-STR) 9.1AGL Resources Inc. (NYSE-AGL) 13.1Laclede Group, Inc. (NYSE-LG) 15.3Southern Union Company (NYSE-SUG) 15.3WGL Holdings, Inc. (NYSE-WGL) 15.4RGC Resources, Inc. (NDQ-RGCO) 15.5Energen Corporation (NYSE-EGN) 15.7Delta Natural Gas Company (NDQ-DGAS) 16.0Atmos Energy Corporation (NYSE-ATO) 16.8
MMON EQUITYLOW
Atmos Energy Corporation (NYSE-ATO) 8.3Questar Corporation (NYSE-STR) 8.4EQT Corporation (NYSE-EQT) 8.7Southern Union Company (NYSE-SUG) 8.9Southwest Gas Corporation (NYSE-SWX) 9.2RGC Resources, Inc. (NDQ-RGCO) 9.7Laclede Group, Inc. (NYSE-LG) 10.1Northwest Natural Gas Co. (NYSE-NWN) 10.8WGL Holdings, Inc. (NYSE-WGL) 10.9Delta Natural Gas Company (NDQ-DGAS) 11.0
S
LOW
Pennichuck Corporation (NDQ-PNNW) 2.6Aqua America, Inc. (NYSE-WTR) 2.8SJW Corporation (NYSE-SJW) 3.0American States Water Co. (NYSE-AWR) 3.1

TIOLOW
American Water Works Co., Inc. (NYSE-AWK) 117Artesian Resources Corp. (NDQ-ARTNA) 154Middlesex Water Company (NDQ-MSEX) 162SJW Corporation (NYSE-SJW) 167
TIPLELOW
SJW Corporation (NYSE-SJW) 17.6American Water Works Co., Inc. (NYSE-AWK) 17.9Middlesex Water Company (NDQ-MSEX) 18.8Artesian Resources Corp. (NDQ-ARTNA) 19.0
MMON EQUITYLOW
Pennichuck Corporation (NDQ-PNNW) 6.8Artesian Resources Corp. (NDQ-ARTNA) 8.2Connecticut Water Service, Inc. (NDQ-CTWS) 8.8California Water Service Group (NYSE-CWT) 8.8


![Science Applications International Corporation (SAIC ... · PDF fileScience Applications International Corporation (SAIC) [NYSE: SAIC] ... Science Applications International Corporation](https://static.fdocuments.us/doc/165x107/5ab54bee7f8b9a6e1c8ca2a2/science-applications-international-corporation-saic-applications-international.jpg)