1-17 18-24 25-64 65+ 23.1% - Nevadadpbh.nv.gov/uploadedFiles/03 Infographic_SuicidesinNevada.pdf ·...
12
Total Suicides* Total Suicides* Age-adjusted Rate Age-adjusted Rate Poisoning by Solid, Liquid or Gaseous Substances Hanging/ Strangulation/ Suffocation Firearms/ Explosives Cutting/ Stabbing Others Jumped from Height Drowning/ Submersion Method of Suicide: 1-17 Age at Suicide: Poisoning by Solid, Liquid or Gaseous Substances Hanging/ Strangulation/ Suffocation Firearms/ Explosives Cutting/ Stabbing Others Jumped from Height Drowning/ Submersion Method of Suicide: Age at Suicide: Suicide was the leading cause of death in the United States Suicide Was The leading cause of death in Nevada 76.9% 23.1% 78.3% 21.7% 18-24 25-64 65+ 18-24 25-64 65+ 1-17 * See Technical Notes. If you or someone you know need help, call:
Transcript of 1-17 18-24 25-64 65+ 23.1% - Nevadadpbh.nv.gov/uploadedFiles/03 Infographic_SuicidesinNevada.pdf ·...

Total Suicides*
Total Suicides*
Age-adjusted Rate
Age-adjusted Rate
Poisoning by Solid, Liquid or Gaseous Substances
Hanging/ Strangulation/ Suffocation
Firearms/ Explosives
Cutting/ Stabbing
Others
Jumped from Height
Drowning/ Submersion
Method of Suicide:
1-17 Age at Suicide:
Poisoning by Solid, Liquid or Gaseous Substances
Hanging/ Strangulation/ Suffocation
Firearms/ Explosives
Cutting/ Stabbing
Others
Jumped from Height
Drowning/ Submersion
Method of Suicide:
Age at Suicide:
Suicide
was the
leading cause of
death in the
United States
Suicide
Was The
leading cause of
death in Nevada
76.9% 23.1%
78.3%
21.7%
18-24 25-64 65+
18-24 25-64 65+ 1-17
* See Technical Notes.
If you or someone you know
need help, call:

COMMUNITY*
FAMILY*
INDIVIDUAL*
Poisoning by Solid, Liquid or Gaseous Substances
Hanging/ Strangulation/ Suffocation
Firearms/ Explosives
Cutting/ Stabbing
Other
Method :
Suicide was the
leading cause of death in Carson City
Percentage Completed
Total Billed
Expenses*:
Potential Years of Life Lost:
Total Suicides*
0
10
20
30
40
Married Never Married
Widowed Divorced 0
10
20
30
40
Married Single Divorced Unknown
Suicides Hospitalizations
Average Age
at Death
Average Number
of
Potential Years
of Life Lost
Poisoning by Solid, Liquid or Gaseous Substances Hanging/ Strangulation/ Suffocation Firearms/ Explosives
Cutting/ Stabbing
Others
Average Billed Expense per Admission*:
MALE FEMALE
Method by Sex:
Age at
Suicide:
Age-adjusted Rate
75.3% 24.3%
% of Suicides by Sex:
1-17 18-24 25-64 65+
* See Technical Notes.
If you or someone you know need help, call:
Division of Public and Behavioral Health
COMMUNITY*
FAMILY*
INDIVIDUAL*
Method :
Suicide was the
leading cause of death in Clark
Percentage Completed
Total Billed
Expenses*:
Potential Years of Life Lost:
Total Suicides*
Poisoning by Solid, Liquid or Gaseous Substances
Hanging/ Strangulation/ Suffocation
Firearms/ Explosives
Drowning/ Submersion
Cutting/ Stabbing
Jumped from Height
Others
Suicides Hospitalizations
0
200
400
600
800
1000
0
500
1000
1500
2000
Average Billed Expense per Admission*:
Average Age
at Death
Method by Sex:
Poisoning by Solid, Liquid or Gaseous Substances Hanging/ Strangulation/ Suffocation
Firearms/ Explosives
Cutting/ Stabbing
Others
Jumped from Height
Drowning/ Submersion
MALE FEMALE
Age-adjusted Rate
Age at
Suicide:
75.9% 24.1%
% of Suicides by Sex:
1-17 18-24 25-64 65+
* See Technical Notes.
If you or someone you know need help, call:
Average Number
of
Potential Years
of Life Lost
Division of Public and Behavioral Health

FAMILY*
Suicide was the
leading cause of death in Douglas
Suicides vs. Hospitalizations
Total Billed
Expenses*:
Potential Years of Life Lost:
Total Suicides*
COMMUNITY*
INDIVIDUAL*
Average Billed Expense per Admission*:
0 5
10 15 20 25 30
Married Never Married
Widow Divorce Unknown
0
5
10
15
20
25
30
35
Married Single Divorced
Suicides Hospitalizations
Poisoning by Solid, Liquid or Gaseous Substances
Hanging/ Strangulation/ Suffocation
Firearms/ Explosives
Cutting/ Stabbing
Others
Method :
Method by Sex:
Poisoning by Solid, Liquid or Gaseous Substances Hanging/ Strangulation/ Suffocation Firearms/ Explosives
Cutting/ Stabbing
Others
MALE FEMALE
Age-adjusted Rate
Age at
Suicide:
80.6% 19.4%
% of Suicides by Sex:
1-17 18-24 25-64 65+
* See Technical Notes.
If you or someone you know need help, call:
Average Number
of
Potential Years
of Life Lost
Average Age
at Death
Division of Public and Behavioral Health

FAMILY*
Suicide was the
leading cause of death in Elko
Percentage Completed
Total Billed
Expenses*:
Potential Years of Life Lost:
Total Suicides*
COMMUNITY*
INDIVIDUAL*
Average Billed Expense per Admission*:
Suicides Hospitalizations
Method :
Method by Sex:
Age-adjusted Rate
Age at
Suicide: % of Suicides by Sex:
1-17 18-24 25-64 65+
* See Technical Notes.
If you or someone you know need help, call:
Firearms/ Explosives
Others
0
5
10
15
20
25
30
35
Married Never Married
Widowed Divorced
0
20
40
60
80
Married Single Widowed Divorced Legally Seperated
Poisoning by Solid, Liquid or Gaseous Substances
Hanging/ Strangulation/ Suffocation
Firearms/ Explosives
Others
MALE FEMALE
80.0% 20.0%
Average Number
of
Potential Years
of Life Lost
Average Age
at Death
Division of Public and Behavioral Health

COMMUNITY*
FAMILY*
INDIVIDUAL*
Method :
Percentage Completed Suicide was the
leading cause of death in Lyon
Total Billed
Expenses*:
Potential Years of Life Lost:
Total Suicides*
Poisoning by Solid, Liquid or Gaseous Substances
Hanging/ Strangulation/ Suffocation
Firearms/ Explosives
Cutting/ Stabbing
Drowning/ Submersion
Suicides Hospitalizations
0
10
20
30
40
50
Married Never Married
Widowed Divorced 0
5
10
15
20
25
30
35
Married Single Widowed Divorced
Average Billed Expense per Admission*: Method by Sex:
Age at
Suicide:
Age-adjusted Rate
Poisoning by Solid, Liquid or Gaseous Substances Hanging/ Strangulation/ Suffocation Firearms/ Explosives
Cutting/ Stabbing
Drowning/ Submersion
MALE FEMALE
88.9% 11.1%
% of Suicides by Sex:
* See Technical Notes.
If you or someone you know need help, call:
Average Number
of
Potential Years
of Life Lost
Average Age
at Death
1-17 18-24 25-64 65+
Division of Public and Behavioral Health
COMMUNITY*
FAMILY*
INDIVIDUAL*
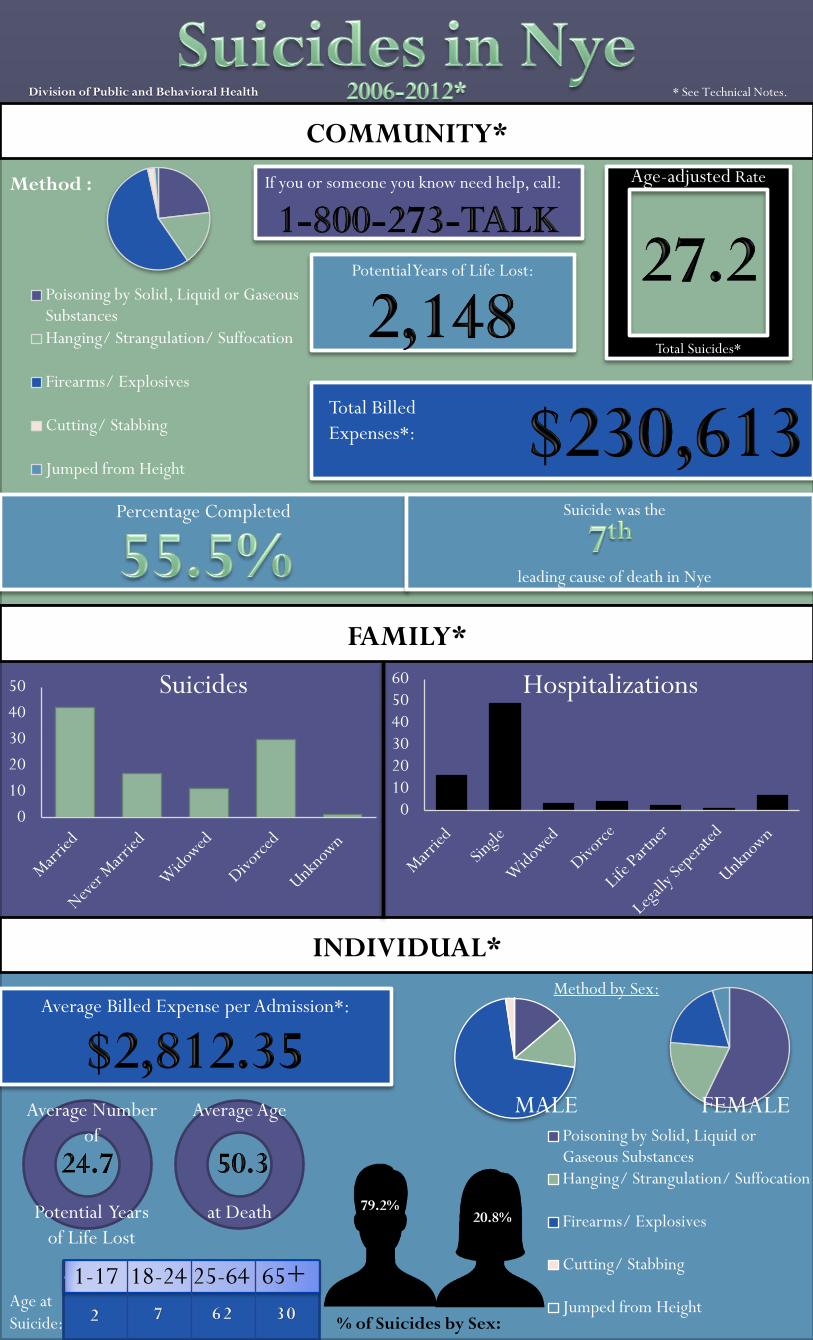
Method :
Percentage Completed Suicide was the
leading cause of death in Nye
Total Billed
Expenses*:
Potential Years of Life Lost:
Total Suicides*
Poisoning by Solid, Liquid or Gaseous Substances
Hanging/ Strangulation/ Suffocation
Firearms/ Explosives
Cutting/ Stabbing
Jumped from Height
Suicides Hospitalizations
0
10
20
30
40
50
0
10
20
30
40
50
60
Average Billed Expense per Admission*: Method by Sex:
Age at
Suicide:
Age-adjusted Rate
Poisoning by Solid, Liquid or Gaseous Substances Hanging/ Strangulation/ Suffocation
Firearms/ Explosives
Cutting/ Stabbing
Jumped from Height
79.2% 20.8%
MALE FEMALE
% of Suicides by Sex:
1-17 18-24 25-64 65+
* See Technical Notes.
If you or someone you know need help, call:
Average Number
of
Potential Years
of Life Lost
Average Age
at Death
Division of Public and Behavioral Health

COMMUNITY*
FAMILY*
INDIVIDUAL*
Method :
Percentage Completed
Total Billed
Expenses*:
Potential Years of Life Lost:
Total Suicides*
Poisoning by Solid, Liquid or Gaseous Substances
Hanging/ Strangulation/ Suffocation
Firearms/ Explosives
Cutting/ Stabbing
Others
Jumped from Height
Drowning/ Submersion
Suicides Hospitalizations
0
50
100
150
200
250
0
100
200
300
400
500
Average Billed Expense per Admission*: Method by Sex:
Age at
Suicide:
Age-adjusted Rate
Poisoning by Solid, Liquid or Gaseous Substances Hanging/ Strangulation/ Suffocation
Firearms/ Explosives
Cutting/ Stabbing
Others
Jumped from Height
Drowning/ Submersion
MALE FEMALE
77.7% 22.3%
% of Suicides by Sex:
1-17 18-24 25-64 65+
* See Technical Notes.
If you or someone you know need help, call:
Average Number
of
Potential Years
of Life Lost
Average Age
at Death
Suicide was the
leading cause of death in Washoe
Division of Public and Behavioral Health

* See Technical Notes.
Statistics for the following counties were suppressed to protect
confidentiality and/or due to concerns of statistical reliability. Please
refer to the overall Nevada fact sheet which may serve as proxy
measures for any one of those counties.
Churchill
Esmeralda
Eureka
Humboldt
Lander
Lincoln
Mineral
Pershing
Storey
White Pine
Division of Public and Behavioral Health
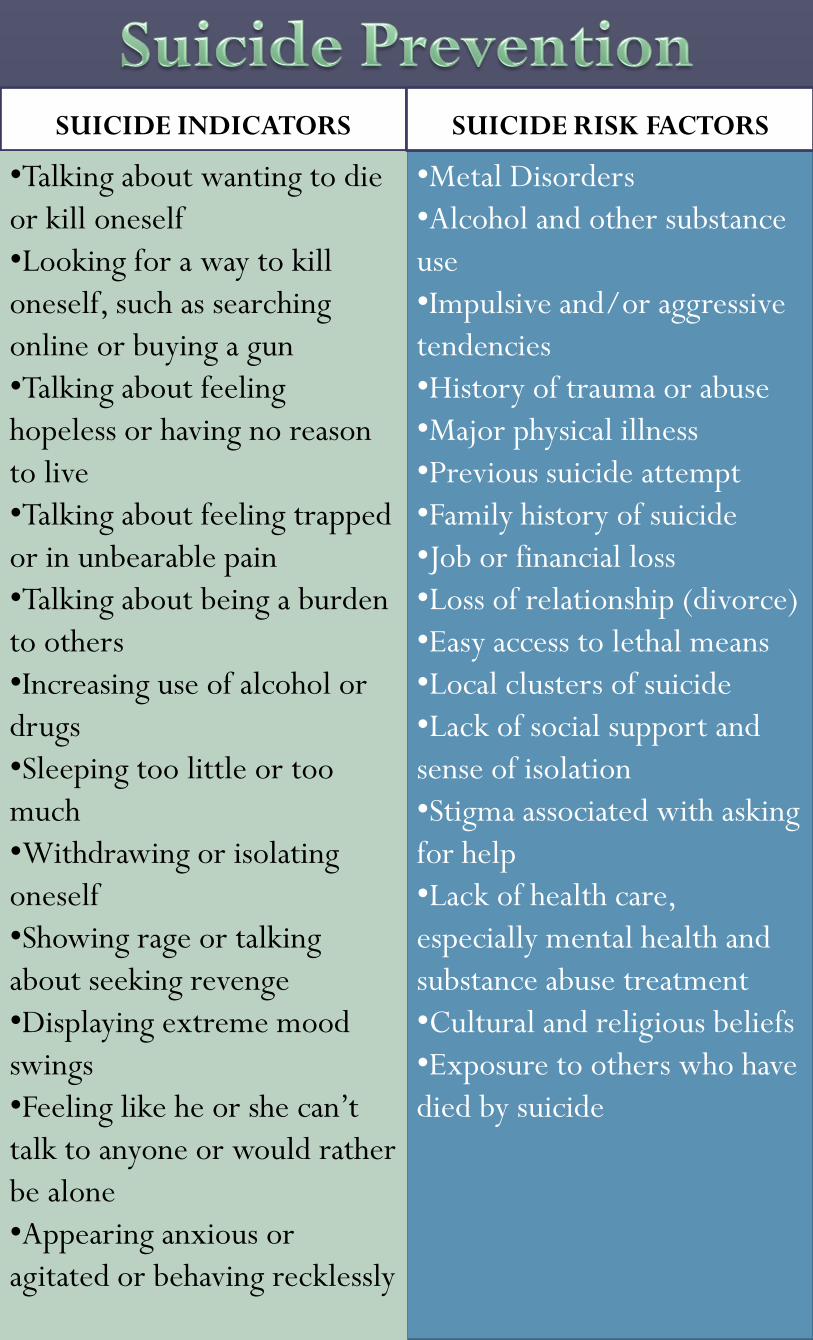
SUICIDE INDICATORS
•Talking about wanting to die
or kill oneself
•Looking for a way to kill
oneself, such as searching
online or buying a gun
•Talking about feeling
hopeless or having no reason
to live
•Talking about feeling trapped
or in unbearable pain
•Talking about being a burden
to others
•Increasing use of alcohol or
drugs
•Sleeping too little or too
much
•Withdrawing or isolating
oneself
•Showing rage or talking
about seeking revenge
•Displaying extreme mood
swings
•Feeling like he or she can’t
talk to anyone or would rather
be alone
•Appearing anxious or
agitated or behaving recklessly
SUICIDE RISK FACTORS
•Metal Disorders
•Alcohol and other substance
use
•Impulsive and/or aggressive
tendencies
•History of trauma or abuse
•Major physical illness
•Previous suicide attempt
•Family history of suicide
•Job or financial loss
•Loss of relationship (divorce)
•Easy access to lethal means
•Local clusters of suicide
•Lack of social support and
sense of isolation
•Stigma associated with asking
for help
•Lack of health care,
especially mental health and
substance abuse treatment
•Cultural and religious beliefs
•Exposure to others who have
died by suicide

If you or someone you know is considering suicide, get help!
An Online Crisis
Network
Hotline for Hearing & Speech Impaired
Bureau of Child, Family and Community Wellness: Office of Suicide
Prevention
North: (775)443-7843 South: (702)486-8225
http://dhhs.nv.gov/SuicidePrevention.htm

Hospitalizations
ICD-9 Definition ICD-9 Codes
Suicide related injuries/death E950-959.9
Emergency department visits by demographics, county of residence 2009-2011 combined.
The ICD-9 codes above were used to compile these data.
All 33 diagnosis codes and 5 E-codes related to suicide were considered.
Data may not meet the criteria for reliability, data quality or confidentiality due to small counts.
Data contains instances where the patient passed away leading to double reporting if compared to the suicide data within this report.
Hospital Emergency Department Billing (HEDB) data was proved by the Center for Health Information Analysis (CHIA). HEDB data is used to calculate the figures for all hospital related statistics: suicide related
hospital case count, marital status, and billed hospital expenses.
Marital status is self-reported and only reported in the graphs when case count is greater than 1.
Percentage completed is the number of suicides divided by the sum of the number of suicides and the number of suicide-related hospitalizations that did not result in death.
Suicides
ICD-10 Definition ICD-10 Codes
Poisoning by Solid, Liquid or Gaseous Substance X60 through X69.9 Hanging/Strangulation/Suffocation X70 through X70.9 Drowning/Submersion X71 through X71.9 Firearms/Explosives X72 through X75.9 Cutting/Stabbing X78 through X79.9 Jumped from Height X80 through X80.9
Others X76 through X76.9 (or) X77 through X77.9 (or) X81
through X84.9 (or) Y87.0 (or) U03
Age-adjusted mortality rates are per 100,000 state and county specific population and are adjusted to the 2000 U.S. Standard population.
Population estimates were provided by the Nevada State Demographer in March 2012.
Data may not meet the criteria for reliability or data quality due to small counts.
*Nevada deaths during 2006-2012 period were combined for this report. 2012 Nevada death data is not final and subject to change. United States death data is 2006-2010 period combined.
ICD-10 codes used were queried using the underlying cause of death only.
Potential years of Life lost (PYLL) is the sum of the differences between the life expectancy (75 years of age) of a given population and the age of death for each person who died before then. All persons are
considered half-way through the year for their age of death.
Average number of potential years of life lost (PYLL) is the number of deaths by residence divided by the total sum of potential years of life lost to the region.
Death counts were used to create all charts within this document.
Leading cause of death ranking is calculated using county specific age-adjusted rates for all suicide causes.
Marital status is self-reported and only reported in the graphs when case count is greater than 1.
For additional information, contact-
Theron Huntamer - Health Resource Analyst
Division of Public and Behavioral Health
Office of Public Health Informatics and Epidemiology
[email protected] 775-684-4152