1 13. Type of Report and Period Covered SP,Onsoring … · · 2013-08-06Research Report 1302-2F...
268
1. Report No. 2. Government Acce$$ion No. FHWA/TX-96-1302-2F 4. Title and Sublirle THE CONNECTION BETWEEN A STEEL CAP GIRDER AND A CONCRETE PIER 7. Author(s) Joseph M. Ales, Joseph A. Yura, Michael D. Engelhardt, and Karl H. Frank 9. Performing Orgonization Name and Address Center for Transportation Research The University of Texas at Austin 3208 Red River, Suite 200 Technical Report Documentation Page 3. Recipient's Catalog No. 5. Report Date April 1995 6. Performing Organization Code 8. Performing Organization Report No. Research Report 1302-2F 10. Work Unit No. (TRAIS) 11. Contract or Grant No. Research Study 0-1 302 Austin, Texas 78705-2650 /-----------:--------------------1 13. Type of Report and Period Covered 12. SP,Onsoring Agency Name and Address Texas Department of Transportation Research and Technology Transfer Office P.O. Box 5080 Austin, Texas 78763-5080 Final 14. Sponsoring Agency Code 15. Supplementary Notes Study conducted in cooperation with the U.S. Department of Transportation, Federal Highway Administration. Research study title: "Connections between Steel Bent Caps and Concrete Piers" 16. Abstract At congested highway interchanges, horizontal and vertical clearance requirements may dictate the use of narrow piers and shallow depth cap girders to accommodate the various roadways and overpasses. In situations such as this, the state of Texas uses horizontally curved steel plate girders as the bridge structural system, supported on integral steel cap girders at single column piers. Two bearings are used to connect the steel cap girder to the concrete pier. Owing to the narrow pier, unbalanced loading may produce a transverse overtuming moment at the pier; the bearings resist this moment by developing a couple, with one bearing loaded in compression and one bearing loaded in tension. When the unbalanced loading is caused by truck traffic, which is cydic, the bearing resisting the uplift is subject to fatigue loading. The standard connection used by the state of Texas is an in-house design that comprises a line rocker bearing, which accommodates the horizontal rotation, and embedded anchor bolts that are used to both resist potential uplift and to provide a positive connection from the cap girder to the pier. The behavior of this connection, however, is not well understood and the detailing is complex. The objectives of this research were to examine and categorize the behavior of the existing connection and to develop a new detail that is simpler and cost effective, and to develop design guidelines for steel reinforcement in the concrete pier cap. The research showed that the standard TxDOT connection performs adequately with respect to horizontal rotation but that it cannot resist uplift because of the poor fatigue characteristics of threaded anchor bolts. While the fatigue problem may be mitigated by post-tensioning the uplift bearing, this option is not available for the standard connection. Two new connection details were developed, one to be used for situations in which uplift does not occur and one that is capable of resisting uplift. The new details replace the line rocker with a rolled wide-flange section, and the threaded anchor bolts are replaced with high-strength thread bar, which is specifically designed for post-tensioning. The new connections proved to be more cost effective than the standard connection. At the top of the concrete pier, a strut-and-tie model is recommended for designing the steel reinforcement to support the bearing loads. 17. Key Words 18. Distribution Statement Bridge design, concrete piers, steel cap girders, strut-and-tie model, brige steel reinforcement No restrictions. This document is available to the public through the National Technical Information Service, Springfield, Virginia 22161. 19. Security Oouif. (of this report) Unclassified Form DOT F 1700.7 (8-72) 20. Security Oassif. (of this page) Unclassified Reprodudion of completed page authorized 21. No. of Poges 22. Price 267
Transcript of 1 13. Type of Report and Period Covered SP,Onsoring … · · 2013-08-06Research Report 1302-2F...

1. Report No. 2. Government Acce$$ion No.
FHWA/TX-96-1302-2F
4. Title and Sublirle
THE CONNECTION BETWEEN A STEEL CAP GIRDER AND A CONCRETE PIER
7. Author(s)
Joseph M. Ales, Joseph A. Yura, Michael D. Engelhardt, and Karl H. Frank
9. Performing Orgonization Name and Address
Center for Transportation Research The University of Texas at Austin 3208 Red River, Suite 200
Technical Report Documentation Page
3. Recipient's Catalog No.
5. Report Date April 1995
6. Performing Organization Code
8. Performing Organization Report No.
Research Report 1302-2F
10. Work Unit No. (TRAIS)
11. Contract or Grant No.
Research Study 0-1 302 Austin, Texas 78705-2650
/-----------:--------------------1 13. Type of Report and Period Covered 12. SP,Onsoring Agency Name and Address
Texas Department of Transportation Research and Technology Transfer Office P.O. Box 5080 Austin, Texas 78763-5080
Final
14. Sponsoring Agency Code
15. Supplementary Notes Study conducted in cooperation with the U.S. Department of Transportation, Federal Highway Administration. Research study title: "Connections between Steel Bent Caps and Concrete Piers"
16. Abstract
At congested highway interchanges, horizontal and vertical clearance requirements may dictate the use of narrow piers and shallow depth cap girders to accommodate the various roadways and overpasses. In situations such as this, the state of Texas uses horizontally curved steel plate girders as the bridge structural system, supported on integral steel cap girders at single column piers. Two bearings are used to connect the steel cap girder to the concrete pier. Owing to the narrow pier, unbalanced loading may produce a transverse overtuming moment at the pier; the bearings resist this moment by developing a couple, with one bearing loaded in compression and one bearing loaded in tension. When the unbalanced loading is caused by truck traffic, which is cydic, the bearing resisting the uplift is subject to fatigue loading.
The standard connection used by the state of Texas is an in-house design that comprises a line rocker bearing, which accommodates the horizontal rotation, and embedded anchor bolts that are used to both resist potential uplift and to provide a positive connection from the cap girder to the pier. The behavior of this connection, however, is not well understood and the detailing is complex. The objectives of this research were to examine and categorize the behavior of the existing connection and to develop a new detail that is simpler and cost effective, and to develop design guidelines for steel reinforcement in the concrete pier cap.
The research showed that the standard TxDOT connection performs adequately with respect to horizontal rotation but that it cannot resist uplift because of the poor fatigue characteristics of threaded anchor bolts. While the fatigue problem may be mitigated by post-tensioning the uplift bearing, this option is not available for the standard connection. Two new connection details were developed, one to be used for situations in which uplift does not occur and one that is capable of resisting uplift. The new details replace the line rocker with a rolled wide-flange section, and the threaded anchor bolts are replaced with high-strength thread bar, which is specifically designed for post-tensioning. The new connections proved to be more cost effective than the standard connection. At the top of the concrete pier, a strut-and-tie model is recommended for designing the steel reinforcement to support the bearing loads.
17. Key Words 18. Distribution Statement
Bridge design, concrete piers, steel cap girders, strut-and-tie model, brige steel reinforcement
No restrictions. This document is available to the public through the National Technical Information Service, Springfield, Virginia 22161.
19. Security Oouif. (of this report)
Unclassified
Form DOT F 1700.7 (8-72)
20. Security Oassif. (of this page)
Unclassified
Reprodudion of completed page authorized
21. No. of Poges 22. Price
267

THE CONNECTION BETWEEN A STEEL CAP GIRDER AND A CONCRETE PIER
by
JOSEPH M. ALES, JOSEPH A. YURA, MICHAEL D. ENGELHARDT AND KARL H. FRANK
Research Report No. 1302-2F
Research Project 0-1302
"CONNECTIONS BETWEEN STEEL BENT CAPS AND CONCRETE PIERS"
conducted for the
TEXAS DEPARTMENT OF TRANSPORTATION
in cooperation with the
u.S. DEPARTMENT OF TRANSPORTATION FEDERALIDGHWAY ADMINISTRATION
by the
CENTER FOR TRANSPORTATION RESEARCH BUREAU OF ENGINEERING RESEARCH THE UNIVERSITY OF TEXAS AT AUSTIN
April 1995


IMPLEMENTATION
The research has developed a design method for connections between steel cap girders and concrete piers. A new detail has been developed that is more cost-effective and one that can also handle uplift. This should provide a wide array of design options. It is recommended that designs that call for a steel rocker bearing could be replaced with an equivalent piece of rolled wide flange sections at very substantial cost savings.
The reinforcement detail at the top of the concrete pier should utilize a continuous bar around the top as is current practice. The sizing of the reinforcement can be based on a strut-and-tie model.
Prepared in cooperation with the Texas Department of Transportation and the U.S. Department of Transportation, Federal Highway Administration.
The contents of this report reflect the views of the authors, who are responsible for the facts and the accuracy of the data presented herein. The contents do not necessarily reflect the view of the Federal Highway Administration or the Texas Department of Transportation. This report does not constitute a standard, specification or regulation.
NOT INTENDED FOR CONSTRUCTION, PERMIT, OR BIDDING PURPOSES
Joseph A. Yura, Texas P.E. #29859 Michael E. Kreger, Texas P.E. #65541
Research Supervisors
III

MI::: I HIC (SI*) CONVERSION FACTORS
APPROXIMATE CONVERSIONS TO SI UNITS APPROXIMATE CONVERSIONS FROM SI UNITS
Symbol When You Know Multiply by To Find Symbol Symbol When You Know Multiply by To Find Symbol
LENGTH '" _'"d E LENGTH
in inches 2.54 centimeters cm mm millimeters 0.039 Inches in ... ft feet 0.3048 meters m - m meters 3.28 feet ft yd yards 0.914 meters m m meters 1.09 yards yd mi miles 1.61 kilometers km km kilometers 0.621 miles ml
\2 UI AREA
AREA ~
mm2 millimeters squared 0.0016 square inches in 2
m2 meters squared 10.764 square feet ft2 m2 meters squared 1.20 square yards yd 2
in2 square inches 645.2 millimeters squared mm 2
j l: km2 kilometers squared 0.39 square miles mi2
ft2 square feet 0.0929 meters squared m2 ha hectares (10,000 m2) 2.53 acres ac yd2 square yards 0.836 meters squared m2
mi2 square miles 2.59 kilometers squared km2 MASS (weight)
ac acres 0.395 hectares ha
g grams 0.0353 ounces oz
MASS (weight)
--1 l: kg kilograms 2.205 pounds Ib Mg megagrams (1.000 kg) 1.103 short tons T
oz ounces 28.35 grams g VOLUME Ib pounds 0.454 kilograms kg T short tons (2,000 Ib) 0.907 megagrams Mg
mL milliliters 0.034 fluid ounces floz L liters 0.264 gallons gal m3 meters cubed 35.315 cubic feet ft3
VOLUME
~ ~ m3 meters cubed 1.308 cubic yards yd 3
floz mL TEMPERATURE (exact)
fluid ounces 29.57 milliliters gal gallons 3.785 liters L
-=@ ~ OC Celsius 915 (then Fahrenheit OF ft3 cubic feet 0.0328 meters cubed m3
yd3 cubic yards 0.Q765 meters cubed m3 temperature add 32) temperature
NOTE: Volumes greater than 1,000 L shall be shown in m3.
OF OF 32 98.6 212
TEMPERATURE (exact)
d E -jO I I I? 1 1 11 410 II I ~o I b,1~0, 111~01 I 12~0~ I I I I I I I I I
-40 -20 0 20 370 60 80 100 OF Fahrenheit 5/9 (after Celsius OC OC OC
temperature subtracting 32) temperature These factors conform to the requirement of FHWA Order 5190.1 A.
* SI is the symbol for the International System of Measurements

ACKNOWLEDGEMENTS
Research Project 0-1302 was funded by the Texas Department of Transportation (TxDOT). The authors thank Mike Lynch and David McDonald of TxDOT for their valuable suggestions and guidance.
Thanks are extended to the students working on this project: Rich Denio, Jason Olson, and Ahmed Uddin Emad.
The experimental work was conducted at the Ferguson Structural Engineering Laboratory at The University of Texas. The entire staff of the laboratory contributed to the success of this project: P. Ball, S. Cunningham, W. Fontenot, L. Golding, R. Green, A. Jenkins, W. Little, R. Madonna, and B. Stasney.
v


TABLE OF CONTENTS
CHAPTER 1 -INTRODUCTION ..................................... ................................................... 1
1.1 PROBLEM STATEMENT ............................................................................ , 1
1.2 CON N ECTION STATICS ........... .............. ........................ ........................... 4
1.2.1 Transverse Direction Behavior........................................................ 4
1.2.2 Longitudinal Direction Behavior....................................................... 7
1.3 STANDARD PRACTICE IN THE UNITED STATES................................... 9
1.3.1 Survey............ ......... ................. ........ ......................... .......... ............. 9
1.3.2 Typical Details ................................................................................. 10
1.4 BASICS OF BRIDGE DESIGN .................................................................... 12
1.4.1 Analysis ofthe Bridge Superstructure ............................................. 12
1.4.2 Design Loads................................................................................... 15
1.5 DESIGN PROCEDURE FOR STANDARD TXDOT DETAIL ...................... 16
1.6 SCOPE OF RESEARCH ............................................................................. 19
CHAPTER 2 - PHASE I TEST PROGRAM .................... ................................................... 21
2.1 PROTOTYPE BRIDGE DESIGN ................................................................. 21
2.2 TEST PROGRAM ........................................................................................ 24
2.2.1 Test Variables.................................................................................. 24
2.2.2 Stiffness Tests ................................................................................. 25
2.2.3 Pretensioning Tests......................................................................... 27
VII

CHAPTER 3 - PHASE I TEST RESULTS ......................................................................... 31
3.1 MATERIAL PROPERTIES ........................................................................... 31
3.2 PRETENSIONING TESTS ........................................................................... 32
3.3 TRANSVERSE STIFFNESS TESTS ........................................................... 35
3.3.1 Load-Deflection and Moment-Rotation Behavior............................. 35
3.3.2 Distribution of the Bolt Forces and the Pier Reactions .................... 36
3.4 LONGITUDINAL STIFFNESS TESTS ......................................................... 41
3.5 TRANSVERSE DIRECTION ULTIMATE STRENGTH TEST ..................... 45
CHAPTER 4 - PHASE I ANALYSIS AND DiSCUSSiON.................................................. 49
4.1 ESTIMATION OF PRETENSION FORCE................................................... 49
4.1.1 Anchor Bolt Stiffness........................................................................ 50
4.1.2 Bearing Pad stiffness .................................................................. :... 50
4.1.3 Cap Girder Web, Cross Plate and Stiffeners ................................... 52
4.1.4 Bearing Hardware stiffness ..... ........ ........ ........... .................. ........... 52
4.1.5 Concrete Pier Cap Stiffness ............................................................ 53
4.1.6 Comparison of Calculated and Experimental Pretension Forces .... 53
4.2 LONGITUDINAL ROTATION BEHAViOR ................................................... 54
4.2.1 Determination of the Longitudinal Rotation...................................... 54
4.2.2 Rotational Stiffness of Elements...................................................... 55
4.2.3 Forces Developed in the Elements .................................................. 57
4.2.4 Effect of Removal of Upper stiffener ............................................... 60
4.3 TRANSVERSE DIRECTION BEHAVIOR .................................................... 68
CHAPTER 5 - PHASE I CONCLUSIONS AND RECOMMENDATIONS ......................... 71
5.1 CONCLUSIONS ........................................................................................... 71
VIII

5.2 RECOMMENDATIONS ............................................................................... 72
5.2.1 Design Changes........ ........... ...... .............. ....... ..... ....................... .... 72
5.2.2 Fabrication Changes........................................................................ 72
5.3 NEW CONNECTION DETAIL...................................................................... 73
CHAPTER 6 - PHASE II COMPRESSION TESTS ........................................................... 77
6.1 TEST PROGRAM ........................................................................................ 77
6.1.1 Variables.............................................. ............................................ 77
6.1.2 Test Schedule.................................................................................. 77
6.1.3 Test frame........................................................................................ 79
6.1.4 Instrumentation ........... ......... ........ .......... ....... ...... ...... ....................... 80
6.1.5 Test Procedure ................................................................................ 82
6.2 TEST RESULTS .......................................................................................... 82
6.2.1 Material Properties .......................................................................... 82
6.2.2 Web Compression Results .............................................................. 84
6.2.3 Bearing Plate Results ...................................................................... 85
6.3 DISCUSSION OF RESULTS ....................................................................... 90
6.3.1 Compressive Strength of Bearing Web ........................................... 90
6.3.2 Design of Bearing Plates ................ ................................................. 96
CHAPTER 7 - PHASE II FATIGUE TESTS ....................................................................... 99
7.1 TEST PROGRAM ........................................................................................ 99
7.1.1 Test Variables.................................................................................. 99
7.1.2 Test Setup ........................................................................................ 100
7. 1.3 Test Schedule .................................................................................. 100
7.1.4 Test Procedure ................................................................................ 103
IX

7.2 TEST RESULTS ........................................................................................... 104
7.2.1 Flexural Stiffness of Specimens ...................................................... 104
7.2.2 Comparison of Calculated and Experimental Stresses ................... 105
7.2.3 Fatigue Ute ...................................................................................... 107
7.2.4 Notched Specimens ......................................................................... 108
CHAPTER 8 - PHASE II LARGE SCALE TESTS ............................................................. 113
8.1 TEST PROGRAM ......................................................................................... 113
8.1.1 Test Schedule .................................................................................. 113
8.1.2 Test Setup ........................................................................................ 114
8.1.3 Instrumentation ................................................................................ 117
8.1.4 Test Procedure ................................................................................ 118
8.2 TEST RESULTS ........................................................................................... 120
8.2.1 Pretensioning Forces ....................................................................... 120
8.2.2 Longitudinal Direction Tests ............................................................ 122
8.2.3 Transverse Direction Tests .............................................................. 129
8.3 DISCUSSION OF RESULTS ....................................................................... 137
8.3.1 Longitudinal Direction Behavior ....................................................... 137
8.3.2 Transverse Direction Behavior ........................................................ 140
8.3.3 Constructibility .................................................................................. 143
8.3.4 DeSign of Bolt Anchorage ................................................................ 145
CHAPTER 9 - PHASE II CONCLUSiONS ......................................................................... 147
9.1 CONCLUSiONS ........................................................................................... 147
9.2 CONCLUSiONS ........................................................................................... 148
x

CHAPTER 10 - DESIGN PROCEDURES ......................................................................... 151
10.1 DESIGN PROCEDURE, NO UPLIFT .......................................................... 151
10.1.1 Determine the Loads on the Bearings ............................................. 151
10.1.2 Design of Wide-Flange Bearing ....................................................... 152
10.1.3 Design Bearing Stiffeners ................................................................ 154
10.1.4 Connection of Bearing to Pier Cap and Cap Girder ........................ 154
10.2 DESIGN PROCEDURE FOR UPLIFT ......................................................... 155
10.2.1 Determine the Uplift Load ................................................................ 155
10.2.2 Design Up/ift Resisting Elements .................................................... 155
10.2.3 Determine Pretension Force ............................................................ 155
10.2.4 Check Fatigue of Anchor Bolts ........................................................ 156
10.2.5 Design Bearing Stiffeners ................................................................ 157
10.3 DESIGN PROCEDURE FOR STANDARD TXDOT CONNECTION .......... 157
10.3.1 Design of Bearing Plates ................................................................. 157
10.3.2 Design of Neoprene Bearing Pad .................................................... 157
CHAPTER 11 REINFORCED CONCRETE PIER CAPS UNDER CONCEN-TRA TED BEARING LOADS .......................................................... 159
11.1 INTRODUCTION ........................................................... ; ............................. 159
11.2 EXPERIMENTAL PROGRAM ..................................................................... 160
11.2.1 Typical TxDO T Pier Cap Design ..................................................... 160
11.2.2 Description of Test specimens ........................................................ 162
11.2.3 Materials .......................................................................................... 165
11.2.4 Test Set-Up and Procedure ............................................................. 165
11.3 TEST RESULTS .......................................................................................... 168
11.3.1 Nomenclature .................................................................................. 168
11.3.2 Load-Deflection Behavior ................................................................ 170
XI

11.3.3 Failure Modes .................................................................................. 173
11.4 ANALYSIS OF RESULTS ............................................................................ 176
11.4.1 Discussion of Test Results .............................................................. 177
11.4.2 Corbel Analysis ................................................................................ 178
11.4.3 Deep Beam Analysis ........................................................................ 179
11.4.4 The Strut-and-Tie Design Method ................................................... 179
11.4.4.1 The Model ..................................................................... 180
11.4.4.2 Analysis Results from Strut-and-tie ModeL ................. 182
11.4.4.3 Summary of Strut and Tie Results ................................ 183
11.4.5 Design Example Using Strut-and-Tie Model ................................... 186
CHAPTER 12 - SUMMARY AND CONCLUSIONS .......................................................... 197
12.1 PROBLEM STATEMENT ............................................................................. 197
12.2 PHASE I SUMMARY AND CONCLUSIONS ............................................... 197
12.3 PHASE II SUMMARY AND CONCLUSIONS .............................................. 198
12.4 CONCRETE PIER SUMMARY AND CONCLUSIONS ............................... 200
12.5 FUTURE RESEARCH .................................................................................. 200
APPENDIX A
APPENDIXB
APPENDIXC
APPENDlXD-
APPENDIXE-
REFERENCES
DESIGN EXAMPLE FOR STANDARD TXDOT CONNECTION ... 203
DERIVATION OF BEARING PLATE EQUA·nONS ....................... 219
WIDE-FLANGE BEARING PROPERTIES ..................................... 222
DERIVATION OF MOMENT AND FORCE EQUATIONS FOR WIDE-FLANGE BEARINGS ........................................................... 224
DESIGN EXAMPLES FOR PORPOSED CONNECTION .............. 229
......................................................................................................... 241
XII

Figure 1-1
Figure 1-2
Figure 1-3
Figure 1-4
Figure 1-5
Figure 1-6
Figure 1-7
Figure 1-8
Figure 1-9
Figure 1-10
Figure 1-11
Figure 1-12
Figure 1-13
Figure 1-14
Figure 1-15
Figure 1-16
Figure 1-17
Figure 1-18
Figure 1-19
Figure 1-20
LIST OF FIGURES
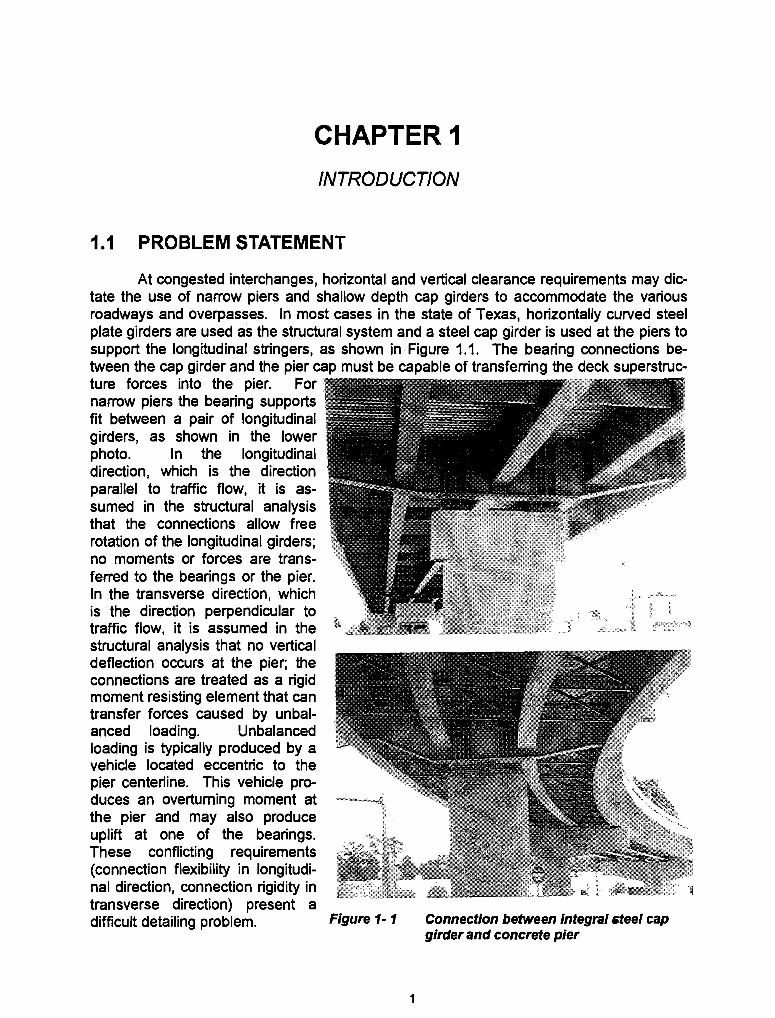
Connection between integral steel cap girder and concrete pier .. 1
Steel bolster shoe .......................... ................. ......... ...... ........ ....... 2
Pot bearing................................................................................... 2
Standard TxDOT connection ........ ................................................ 3
Statics of cap girder centered on pier ......................... ..... ............. 4
Behavior of pretensioned connection............................................ 5
Bolt force vs. applied load............................................................. 6
Reaction force between plates vs. applied load............................ 6
Horizontal displacement of bearing............................................... 7
Distribution of horizontal forces in continuous beam..................... 8
Single column with pinned bearing connection.... ............. ............ 10
Integral prestressed concrete cap girder....................................... 11
Steel cap girder bolted directly to pier........................................... 11
Typical diaphragm detail .................................... :.......................... 13
Diaphragm equilibrium.................................................................. 13
Shear loads on diaphragm............................................................ 13
Influences surfaces for maximum bearing reactions ..................... 14
Standard truck and equivalent uniform land load {adapted from AASHTO [2]} ................................................................... ....... ....... 16
Typical details of standard TxDOT connection {from TxDOT Bridge Design Guide [21]. p. 7-70} ............................................... 18
Bolt anchorage.............................................................................. 19
XIII

Figure 2-1
Figure 2-2
Figure 2-3
Figure 2-4
Figure 2-5
Figure 2-6
Figure 2-7
Figure 2-8
Figure 2-9
Figure 2-10
Figure 3-1
Figure 3-2
Figure 3-3
Figure 3-4
Figure 3-5
Figure 3-6
Figure 3-7
Figure 3-8
Figure 3-9
Figure 3-10
Figure 3-11
Figure 3-12
Figure 3-13
Figure 3-14
Design parameters ....................................................................... 21
Plan view of loading for prototype bridges. .......... ............... .......... 22
Cross-section view of loading for prototype bridges ............ ......... 23
Bearing uplift force vs. connection spacing .................................. 23
Schematic of test connection........................................................ 24
Schematicof transverse direction test setup................................. 26
Transverse direction test setup..................................................... 26
Schematic of longitudinal direction of test setup........................... 28
Longitudinal direction test setup..................... .............................. 28
Schematic of instrumentation ....................................................... 29
Total pretension force as function of bearing pad......................... 32
Effect of tightening sequence on pretension force........................ 34
Typical plot of end load vs. deflection for transverse stiffness tests.............................................................................................. 34
Location of deflection and rotation pOints, transverse stiffness tests.. ....... .......... ... ........... ............ ......... ... ............ ............ ..... ........ 35
End load vs. vertical end defJectio for transverse stiffness tests... 35
Moment vs. rotation for transverse stiffness tests......................... 36
Separation at the uplift bearing..................................................... 36
Statics of system. ............. ........ .................. ......... ............ ....... ...... 37
Bolt group force, pier reaction vs. reaction force, no pads............ 38
Bolt group force, pier reaction vs. reaction force, pre-formed fabric pads....................... .................................... ......................... 38
Bolt group force, pier reaction vs. reaction force, ROF pads..... ... 39
Bolt group force, pier reaction vs. reaction force, neoprene pads 39
Typical plot of bolt line force vs. load.......... .................................. 40
Longitudinal rotation of cap girder ...................... .......... ............. ... 41
XIV
Figure 3-15
Figure 3-16
Figure 3-17
Figure 3-18
Figue 3-19
Figure 3-20
Figure 3-21
Figure 3-22
Figure 3-23
Figure 3-24
Figure 4-1
Figure 4-2
Figure 4-3
Figure 4-4
Figure 4-5
Figure 4-6
Figure 4-7
Figure 4-8
Figure 4-9
Figure 4-10
Figure 4-11
Figure 4-12
Figure 4-13
Figure 4-14
Figure 4-15
Moment VS. rotation for longitudinal rotation tests......................... 41
Illustration of change in rotatinal stiffness........................ ............. 42
Eccentricity of rotation......................... ....... ................ ...... ............. 42
Stress per bolt on south side ................... ......... ........................ .... 43
Stress per bolt on north side ...... ....... ..................................... ....... 44
Stress per bolt on south side, no pretension................................. 44
Moment VS. rotation for ultimate strength test.................. ............. 44
Load VS. deflection for ultimate strength test ......... ....................... 45
Bolt group force, pier reaction VS. applied load for ultimate strength test.................................................................................. 47
Stress distribution along rocker pin............................................... 47
Elements of connection.. ........... ....... ............ .......................... ...... 50
Load VS. deflection curvs for bearing pads ................................... 51
Loading to produce maximum rotation at interior supports........... 54
Model of anchor bolt system ............ ..... ......... ....................... ........ 55
Model of pier used to determine rotational stiffness...................... 57
Stiffener termination pOint............................................................. 60
Web area modelled....................................................................... 61
Finite element mesh.................... .... ...... ....................... ................. 62
Typical plot of principal tensile stress........... ....................... .......... 63
Principal tensile stress VS. stringer spacing................................... 63
Principal tensile stress VS. anchor bolt stiffness ...... ...................... 64
Maximum stress bound VS. stiffener height.... ................. ..... ......... 65
Area of mesh refinement..... ............. ......................... .................... 65
Refined finite element mesh......................................................... 66
Typical plot of principal tensile stress for refined mesh ................. 67
xv
Figure 4-16
Figure 5-1
Figure 5-2
Figure 5-3
Figure 6-1
Figure 6-2
Figure 6-3
Figure 6-4
Figure 6-5
Figure 6-6
Figure 6-7
Figure 6-8
Figure 6-9
Figue 6-10
Figure 6-11
Figure 6-12
Figure 6-13
Figure 6-14
Figure 6-15
Figure 6-16
Figure 6-17
Figure 6-18
Figure 6-19
Figure 6-20
S-N plot of details similar to stiffener termination point (adapted from Joehnk [11], pp. 58-59) ......................................................... 69
Comparison of standard connection and proposed connection, transverse direction...................................................................... 74
Comparison of standard connection and proposed connection, longitudinal direction..................................................................... 74
Proposed connection, no uplift ..... .................... ..... ............... ........ 75
Schematic of test frame......... ............ ........ ........... .... ............ ........ 78
Test frame............................. ....................................................... 79
Compression test specimen .................................................... ..... 79
Failure modes............................................................................... 80
Test frame sway................. .................................. ........................ 80
Location of strain gages on test specimen ................................... 81
Location of strain gages on bearing plates................................... 81
Flange out-of-straightness..... ............ ............. .......... ............ ........ 82
Typical load vs. lateral deflection curve ........................................ 84
Non-dimensional axial stress vs. lateral deflection, W12 X 87...... 86
Non-dimensional axial stress vs. lateral deflection, W12 X 152.... 86
Non-dimensional axial stress vs. lateral deflection, W12 X 230.... 86
Progression of yield. ..................................... ................................ 87
Failed specimens.......................................................................... 88
Stress distribution along length of bearing............... ..................... 89
Centerline bearing plate stress vs. load.............. .......................... 89
Edge bearing plate stress vs. load......... ............. ........ ..... ......... .... 90
Derivation of bearing plate stresses ............................................. 91
Plate under uniform edge compression ........................................ 91
Poisson effect in plates..................... ......... ..... .......... ......... .... ........ 92
XVI

Figure 6-21
Figure 6-22
Figure 6-23
Figure 6-24
Figure 6-25
Figure 7-1
Figure 7-2
Figure 7-3
Figure 7-4
Figure 7-5
Figure 7-6
Figure 7-7
Figure 7-8
Figure 7-9
Figure 7-10
Figure 7-11
Figure 7-12
Figure 7-13
Figure 8-1
Figure 8-2
Figure 8-3
Figure 8-4
Figure 8-5
Figure 8-6
Figure 8-7
Non-dimensional axial stress vs. slenderness parameter (adapted from Salmon and Johnson [15], p. 364)......................... 92
Non-dimensional axial stress VS. slenderness parameter for bearing specimen ......................................................................... 94
Model of bearing plate as beam on elastic foundation.................. 96
Ratio of end deflection to center deflection VS. (31.......................... 96
Bearing strength test specimen .... ........................ ........................ 98
Location of maximum stress........................ ..................... ............ 99
Schematic of test setup for symmetric specimens .................. ...... 101
Test setup for symmetric specimens ............................................. 101
Schematic of fatigue test specimens............... ............................. 103
Shear VS. displacement for sym metric test setup......... ................. 104
Ratio of calculated to experimental stress at fillet, W 12 X 87 ...... 106
Ratio of calculated to experimental stress at fillet, W 12 X 152 .... 106
Ratio of calculated to experimental stress at fillet, W 12 X 230 .... 106
Stress range VS. numberof cycles to failure.................................. 108
Schematics of crack surfaces................. ....... ........................ ....... 109
Photos of cracked specimens.................................... ..... .............. 110
Notched specimen detaiL............... ............ ........... ...... ... ...... ....... 111
N plot including notched specimens ..... ....... ................................. 111
Schematic of transverse direction test setup ................................ 114
Transverse direction test setup ............. .......... ...... ........................ 114
Schematic of longitudinal direction test setup .................. ............. 115
Longitudinal direction test setup ....... .................. ........... ......... ...... 115
New connection details ........... ....... ............................... ... ............. 116
Location of instrumentation ........................................................... 117
Location of strain gages on bearings ......... ............. .... .................. 117
XVII
Figure 8-8
Figure 8·9
Figure 8-10
Figue 8-11
Figure 8-12
Figure 8-13
Figure 8-14
Figure 8-15
Figure 8-16
Figure 8·17
Figure 8-18
Figure 8·19
Figure 8-20
Figure 8-21
Figure 8-22
Figure 8·23
Figure 8-24
Figure 8-25
Figure 8-26
Figure 8-27
Figure 8-28
Figure 8-29
Figure 8-30
Figure 8-31
Location of inclinometers.......... ............................... ............... ...... 118
Bracing scheme.............. .............................................................. 118
Tensioning assembly........... ............................................... .......... 119
Pretension force per bolt, W12 X 87 bearings .............................. 121
Pretension force per bolt, W12 X 152 bearings ............................ 121
Moment vs. rotation (0) anchor bolts, CoR = 0" ............................ 123
Moment vs. rotation (1) anchor bolts, CoR = 0" ............................ 123
Moment VS. rotation (2) anchor bolts, CoR = 0" ............................ 123
Moment VS. rotation, (0) anchor bolts, CoR = 34" ...... ......... ...... .... 124
Moment VS. rotation, (1) anchor bolts, CoR = 34" ......................... 124
Moment VS. rotation, (2) anchor bolts, CoR = 34" ......................... 124
Illustration of negative rotation................................................ ...... 125
Moment in anchor bolts VS. applied moment, CoR = 0" ................ 126
Moment in bearings VS. applied moment, CoR = 0" ...................... 126
Resisting moment as percentage of applied moment, CoR = 0" ... 126
Web stress VS. web centerline rotation, CoR = 0" ......................... 128
Web stress VS. web centerline rotation, CoR = 34" ....................... 128
Moment VS. rotation, transverse direction, W12 X 8'"1 ................... 129
Moment VS. rotation, transverse direction, W12 X 152 ................. 129
Connection statics............................... ......................................... 130
Bolt group force, pier reaction VS. applied load, W12 X 87 large scale test........................... ........................................................... 131
Bolt group force, pier reaction VS. applied load, W12 X 152 large scale test........................................................... ........................... 132
Normalized stress at top gages VS. nominal web stress, W12 X 87. Compression bearing with pretensioned anchor bolts..... ...... 134
Normalized stress at bottom gages VS. nominal web stress, W 12 X 87. CompreSSion bearing with pretensioned anchor bolts........ 134
XVIII

Figure 8·32
Figure 8·33
Figure 8·34
Figure 8-35
Figure 8-36
Figure 8-37
Figure 8-38
Figure 8-39
Figure 8-40
Figure 11-1
Figure 11-2
Figure 11-3
Figure 11-4
Figure 11-5
Figure 11-6
Figure 11-7
Figure 11-8
Figure 11-9
Figure 11-10
Figure 11-11
Figure 11-12
Figure 11-13
Figure 11-14
Normalized stress at top gages VS. nominal web stress, W 12 X 87. Compression bearing, no pretension ..................................... 135
Normalized stress at bottom gage vs. nominal web stress, W 12 X 87. Compression bearing, no pretension............................ ...... 135
Average ratio of gage stress to nominal stress {fsg I fn} W 12 X 87...... ..... ................... ....... ...... ............ .............. ..................... ........ 136
A verage gage stress vs. nominal stress (fsg I fn) W 12 X 152........ 136
Load vs. top flange lateral displacement, compression bearing .... 137
Pier column and bearing... ............................................................ 138
Vertical adjustment of cap girder .................................................. 143
Setting of bearing on pier cap....................................................... 144
Recommended connection details ................................................ 145
Application of bridge loads to the pier cap.................................... 159
Arch action when the span/depth ratio < 1 .................. ................. 160
Typical TxDOT pier geometry...................................... ................. 160
Typical TxDOT pier steel reinforcing pattern ................................. 161
Geometry of the test specimens....... ........ .................................... 162
Steel reinforcing detail for the standard scale specimen
(Pier A2) ........................................................................................ 163
Improper placementof bars U in Specimen A1 and A2 ................. 163
Top layer pier cap reinforcing in Specimen B ............................... 164
Specimen 0 reinforcing ................................................................. 164
Steel reinforcing cage for Specimen A2........................................ 166
Test setup geometry ..................................................................... 166
Test specimens in the test machine .............................................. 167
Load paths for the pier cap. .......................................................... 168
Patterns of concrete distress........................................................ 169
XIX

Figure 11~15
Figure 11-16
Figure 11-17
Figure 11~18
Figure 11-19
Figure 11-20
Figure 11-21
Figure 11-22
Figure 11-23
Figure 11-24
Figue 11-25
Figure 11-26
Figure 11-27
Figure 11-28
Figure 11~29
Figure 11 ~30
Figure 11-31
Figure 11-32
Figure 11-33
Figure 11-34
Load-deflection behavior for Pier A 1-1 ......................................... 169
Crack distribution of Pier A 1-1 after failure ................................... 170
Crushing of Pier A 1-1 after failure ...................................... .......... 171
Comparison of resultant load vs. deflection at Linear Pot #1 ........ 172
Redistribution of internal forces in the pier cap ............................. 174
Development lengths for top layer reinforcing in Specimen 8 ...... 174
Splitting cracks due to bond distress in Specimen 8 ........... ......... 174
Punching of the base plate into Pier 82-2 ..... .......................... ..... 175
Crack distribution on the face of Pier D-1 after failure.............. .... 176
Force distribution in Specimen D after opening of the flexural crack............................................................................................. 176
Force distribution assumed in Corbel Code Provisions (Salmon 1985) ............................................................................................ 178
Configuration of strut-and-tie model 1 ................ .......................... 180
Determination of the compression field width...... .......... ............... 182
Pier cap geometry for the Example Problem ................ .... ............ 186
Strut-and-tie model for Example Problem............. ........................ 187
Cross section of Strut C5............................. ................................. 188
Location of Node 2 in the strut-and-tie model............................... 188
Geometry of the CCC node (Node 2 in the strut~and-tie model) ... 190
Steel reinforcing pattern from the Example Problem .................... 191
Geometry of the CCT Node (Node 1 in the strut~and~tie model)... 191
xx

LIST OF TABLES
Table 1-1 Survey Results ................................................................................. 9
Table 2-1 Bridge System Parameters............................................................... 22
Table 2-2 Cap Girder Dimensions. ....... ......... .... ......... ..... ................ ..... ..... ....... 24
Table 2-3 Bearing Pad Stiffnesses ..................... .... .............. ........... ...... ........... 25
Table 2-4 Test Schedule for Stiffness Tests ..................................................... 25
Table 2-5 Test Schedule for Pretensioning Tests ............................................. 29
Table 3-1 Anchor Bolt Material Properties........................................................ 31
Table 3-2 Concrete Material Properties... ... ........................... ........................... 32
Table 3-3 Percent Lossof Pretension Force Due to Pad Creep........................ 33
Table 3-4 Effect of Tightening Sequence on Pretension Force ........................ 33
Table 3-5 Transverse Rotational Stiffnesses......... ......... .......... ....... ..... .... ........ 37
Table 3-6 Ratio of Force of First Line of Bolts to Second Line of Bolts.... ......... 40
Table 3-7 Longitudinal Rotational Stiffness........................... ....................... .... 43
Table 3-8 Description of Ultimate Strength Test ...................... :........................ 46
Table 4-1 Compressive Stiffness of Bearing Pads............................................ 51
Table 4-2 Values for G and C, Neoprene Pads ................................................ 51
Table 4-3 Comparison of Calculated and Experimental Pretension Force .. ..... 53
Table 4-4 Ratios of Calculated to Experimental Anchor Bolt Rotational Stiffnesses ........................................................................................ 56
Table 4-5 Comparison of Maximum Stress for Coarse and Refined Mesh.. ..... 66
Table 4-6 Effect of Stiffener Height on Maximum Stress.................................. 67
Table 6-1 Bearing Specimen Compression Test Schedule and Properties ...... 78
XXI

Table 6-2 Bearing Specimen Material Properties.............................................. 83
Table 6-3 Chemical Analysis of Bearing Steels, %..... ............ ........... ..... ........... 84
Table 6-4 Compression Test Results ............................................................. '" 85
Table 7-1 Bearing Specimen Fatigue Tst Schedule and Properties.................. 102
Table 7-2 Effective Depth of the Web................................................................ 105
Table 7-3 Ratio of Calculated to Experimental Stress at Fillet........................... 107
Table 7-4 Fatigue Test Results ......................................................................... 107
Table 8-1 Full Scale Test Schedule................................................................... 113
Table 8-2 Anchor Bolt Tightening Sequence..................................................... 120
Table 8-3 Percent Loss in Pretension Force Due to Lock-Off ........................... 122
Table 8-4 Longitudinal Rotational Stiffness of Connection ................................ 125
Table 8-5 Transverse Rotational Stiffness......................................................... 129
Table 8-6 Comparison of Bearing Capacities from Full Scale Tests and Component Tests.............................................................................. 137
Table 8-7 Comparison of Experimental and Calculated Longitudinal Rotational Stiffnesses........................................................................ 140
Table 8-8 Equations for Bolt Group Force and Pier Reaction............................ 142
Table 9-1 Cost Analysis of Phase I Connection ................................................ 148
Table 9-2 Cost Analysis of Phase II Connection ............................................... 149
Table 10-1 Load Combinations ........................................................................... 151
Table 11-1 Rebar Siezes for Full-Size Piers and Test Specimens (see Figure 11.4 for bar layout) ................. ............. ...................... ............. ........... 162
Table 11-2 Measured Material Properties ........................................................... 165
Table 11-3 Summary of Specimen Reinforcement Patterns................................ 168
Table 11-4 Specimen Capacities and Concrete Strengths.................................. 171
Table 11-5 Specimen Cracking Loads................................................................. 173
Table 11-6 Test Specimen Capacity Compared to the Strength Predicted by Conventional Design Methods........................................................... 179
XXII
Table 11-7 Specimen Capacity and Member Forces for Strut-and-Tie Model.... 182
Table 11-8 Tested Capacities for Pier A and Pier C.................... ....................... 183
Table 11-9 Limitations on the Components of T2 Based on Reinforcing in the Test Specimens................................................................................ 183
Table 11-10 Predicted Specimen Capacities when a Vc Term is Added to Strengths from Strut-and-Tie Model............ ...................................... 184
Table 11-11 Comparison of Average Ratio of Theoryrrest Capacity for Different Design Methods................................................................................ 185
XXIII

XXIV

SUMMARY
At congested highway interchanges, horizontal and vertical clearance requirements may dictate the use of narrow piers and shallow depth cap girders to accommodate the various roadways and overpasses. In situations such as this the state of Texas uses horizontally curved steel plate girders as the bridge structural system, supported on integral steel cap girders at single column piers. Two bearings are used to connect the steel cap girder to the concrete pier. Due to the narrow pier, unbalanced loading may produce a transverse overtuming moment at the pier; the bearings resist this moment by developing a couple, with one bearing loaded in compreSSion and one bearing loaded in tension. When the unbalanced loading is caused by truck traffic, which is CYClic, the bearing resisting the uplift is subject to fatigue loading.
The standard connection used by the state of Texas is an in-house design that comprises a line rocker bearing, which accommodates the horizontal rotation, and embedded anchor bolts that are used to both resist potential uplift and to provide a positive connection from the cap girder to the pier. The behavior of the this connection, however, is not well understood and the detailing is complex. The objectives of the research were to examine and categorize the behavior of the existing connection and to develop a new detail that is simpler and cost-effective and to develop design guidelines for steel reinforcement in the concrete pier cap.
The research showed that the standard TxDOT connection performs adequately with respect to horizontal rotation but that it cannot resist uplift because of the poor fatigue characteristics of threaded anchor bolts. The fatigue problem may be mitigated by posttensioning the uplift bearing but this option is not available for the standard connection. Two new connection details were developed, one to be used for situations in which uplift does not occur and one that is capable of resisting uplift. The new details replace the line rocker with a rolled wide-flange section and the threaded anchor bolts are replaced with high-strength thread bar, which is specifically designed for post-tensioning. The new connections proved to be more cost-effective than the standard connection.
At the top of the concrete pier, a strut-and-tie model is recommended for designing the steel reinforcement to support the bearing loads.
xxv
CHAPTER 1
INTRODUCTION
1.1 PROBLEM STATEMENT
At congested interchanges, horizontal and vertical clearance requirements may dictate the use of narrow piers and shallow depth cap girders to accommodate the various roadways and overpasses. In most cases in the state of Texas, hOrizontally curved steel plate girders are used as the strudural system and a steel cap girder is used at the piers to support the longitudinal stringers, as shown in Figure 1.1. The bearing connedions between the cap girder and the pier cap must be capable of transferring the deck superstructure forces into the pier. For narrow piers the bearing supports fit between a pair of longitudinal girders, as shown in the lower photo. In the longitudinal diredion, which is the direction parallel to traffic flow, it is assumed in the structural analysis that the connections allow free rotation of the longitudinal girders; no moments or forces are transferred to the bearings or the pier. In the transverse direction. which is the direction perpendicular to traffic flow, it is assumed in the strudural analysis that no vertical deflection occurs at the pier; the connections are treated as a rigid moment resisting element that can transfer forces caused by unbalanced loading. Unbalanced loading is typically produced by a vehicle located eccentric to the pier centerline. This vehicle produces an overtuming moment at the pier and may also produce uplift at one of the bearings. These conflicting requirements (connection flexibility in longitudinal direction. connedion rigidity in transverse diredion) present a difficult detailing problem. Figure 1-1
1
Connection between Integra/mel cap girder and concrete pier

The detailing problem has resulted in the use of many types of bearing designs. Six types of bearings have been used with integral steel cap girders by the Texas Department of Transportation [21).
• Separated Steel Bolster Shoes
• Single Steel Bolster Shoes
• Long Steel Convex Plate bearing on Base Plate, with Prestressed Anchor Bolts
• Pre-formed Fabric Pad with High
UPPER PLATE WELDED TO CAP GIRDER
PIN
LOWER PLATE BOLTED PIER CAP
Strength Anchor Bolts Figure 1· 2 Steel bolster shoe
• Pot and Disc Bearings
• Separated Steel Pin and Rocker Bearing with High Strength Anchor Bolts
A schematic of a steel bolster shoe is shown in Figure 1.2. The pin allows free longitudinal rotation of the cap girder while simultaneously providing a rigid positive connection between the cap girder and the pier. The flexibility of the supporting pier is used to accommodate horizontal movement since the bearing itself does not permit this
UPLIFT, SHEAR RESTRICTION
M~_~
BEARINGPAO
type of displacement. A typical pot bearing is Figure 1· 3 Pot bearing shown in Figure 1.3. A pot bearing consists of a circular, non· reinforced rubber or elastomeric pad endosed by a steel pot. The steel pot prevents the pad from bulging when loaded. This confinement results in the pad behaving as a fluid under high pressure, producing a bearing that can accommodate significant rotation yet deflect very little vertically. A pot bearing may be designed with a center pin to resist horizontal movement or a vertical key mechanism to resist uplift. Though both of the bearings just described satiSfy the conflicting reqUirements, they tend to be expensive and are limited in the loads they can handle. The standard bearing now used by the Texas Department of Transportation with an integral steel cap girder the Separated Steel Pin and Rocker Bearing with High Strength Anchor Bolts, as shown in Figure 1.1.
A schematic of the standard connection is shown in Figure 1.4. The connection consists of steel bearing plates, which transfer the compressive loads to the pier; a rocker that allows free rotation in the longitudinal direction; anchor bolts, embedded in the pier cap, used to handle uplift; vertical stiffeners and a horizontal cross-plate, which provides the anchor bolt attachment to the cap girder; and bearing pads, located under the platewasher at the top of the anchor bolt. The long length of the anchor bolts and the bearing pads are used to reduce the axial stiffness of the anchor bolts, which will reduce the force
2

TRANSVERSE DIRECTION « )0
LONGITUDINAL DIRECTION ( ,
BEARING ... "'..", __
STIFFENERS
ROCKER
r----1~~~~."..-~S·TEEL BEARING PLAn:,:1~===;;J....,
....- PIER CAP "'"
Figure 1- 4 Standard TxDOT connection
developed by the anchor bolts in response to the longitudinal rotation. The main advantage of this connection is that it is less expensive than the proprietary bearings described above. The disadvantages of this connection are that its behavior is not well understood, the detailing is complex, and, though less expensive than the proprietary bearings, it is not considered costeffective by the Texas Department of Transportation. The expense of the connection is due to the fabrication reqUirements, which include the precise machining of the rocker detail and the complex stiffener detailing.
The complex detailing prompts concerns regarding the behavior of the connection and the design of the individual components of the connection. The standard connection has not been subject to controlled laboratory experimentation and so the assumptions made with respect to the behavior are not supported by any established set of data.. In the transverse direction, the direction perpendicular to traffic flow, the primary concern is the behavior of the connection with respect to uplift. A truck located on the roadway eccentric with respect to the centerline of the pier will produce an overturning moment at the pier. The close spacing of the bearings, which is a result of the narrow pier, increases the likelihood of uplift at one of the connections. Since the truck loading is cyclic, the uplift connection will be subject to fatigue. The uplift resisting element is the anchor bolt, which is classified as a Category E detail for fatigue design [1,9]. The failure of the anchor bolts in the connection resisting uplift may result in the collapse of the bridge. Presently the standard connection is used almost exclusively in situations in which no uplift will occur because of the questions regarding the behavior, but future plans envision the use of cap girders placed on the piers eccentrically, a condition that will almost certainly produce uplift. In the longitudinal direction, the direction parallel to traffic flow, the primary concern is the determination of the forces and moments developed in the elements of the connection. The forces and moments will be produced primarily by the rotation caused by the vehicle load and the horizontal displacement resulting from the expansion and contraction of the superstructure in response to temperature changes. The magnitudes of the forces and moments will depend on the restraining stiffnesses of the connection elements. The questions raised above and the cost-ineffectiveness of the standard connection were the impetus for the research presented herein.
Two major purposes of the research were to develop an understanding of the behavior of the standard steel connection and to develop a cost-effective alternative. Phase I of the research was an examination of the standard connection, in which a largescale experimental model of the connection was the subject of study. The objectives of the testing were to determine the transverse and longitudinal stiffnesses of the connection and to determine the ultimate strength of the connection. Mathematical modeling was used as a supplement to understanding the behavior. Based on the results of the first phase of the
3

research, a new detail was developed that addressed the deficiencies of the standard connection. Phase" of the research was an examination of the new connection detail, again through large-scale experimentation. Component tests were also conducted on one element of the new detail. Another phase of the research was concerned with the shear strength and reinforcement details at the top of the concrete pier in the vicinity of the bearings. This research also had the purpose of providing design guidelines for detailing the reinforcement at the top of the concrete pier since no formal design procedures are currently available.
1.2 CONNECTION STATICS
1.2.1 Transverse Direction Behavior.
Typically, the cap girder is placed on the pier cap symmetrically as shown in Figure 1.5. The vertical forces that are transferred to the bearings can be decomposed into a vertical force component, P, and a transverse moment, MT• The transverse moment is a measure of the eccentricity of the load with respect to the pier centerline and also of the effect of the horizontal curvature of the longitudinal girders. The primary vertical loads on the bridge are dead loads and live loads. If the roadway is straight in plan, equal dead load compressive reactions will be produced in the bearings. If the bridge is horizontally curved, the curvature effect will produce a slight eccentricity and a
p
correspondingly small transverse Figure 1· 5 Statics of cap girder centered on pier moment. The overwhelming percentage of the eccentric load comes from the vehicle live load, which is placed on the bridge such that it produces the maximum transverse moment at the bearings. The transverse moment produces a downward compressive force at bearing A and an upward tensile force at bearing B. Since the vehicle loading is cyclic, any component that must resist a tensile force becomes susceptible to fatigue damage. If the dead load compressive reaction at bearing B is greater than its live load tensile reaction, the bearing will remain in compreSSion. If, however, the dead load reaction is less than the live load reaction, uplift occurs and bearing B is loaded in tension. This situation will most likely occur if the bearing connection spacing is small or if the bridge superstructure is placed on the piers eccentrically. A threaded rod or bolt that resists the uplift is classified as a category E fatigue detail, where the allowable stress range is 8 ksi. For a connection consisting of four 1.5 inch diameter anchor bolts, the live load uplift force of only 45 kips would produce the category E allowable stress range in each bolt.
To increase the transverse moment at which uplift will occur, the bearings can be pretensioned. The behavior of a pretensioned connection [12] is illustrated in Figures 1.6 through 1.8. The connection consists of a bolt and two sets of compressive elements, shown in Figure 1.6.a. There are four distinct regions of behavior:
4

APPliED LOAD T (tension) 1 c (com:ess~n) I
I a.) GENERAL CONDITION
BOLT F~CE. B / I
REACTION, R-'
d.} APPLIED COMPRESSIVE LOAD, TENSION IN BOLT
REACTIO: = C(
b.) INITIAL PRETENSION, NO APPliED LOAD
~====~~====~r--R=O
B=T 1 e.) APPLIED TENSILE LOAD, PLATE
SEPARATION
Figure 1· 6 Behavior of pretensioned connection
Region 1: (Figure 1.6.b)
r APPLIED LO>.O T I
c.) APPLIED TENSILE LOAD, PLATES IN CONTACT
1 APPUED LOAD C 1
_~=---!R=C
f.} APPLIED COMPRESSIVE LOAD, NO TENSION IN BOLT
This is the initial condition of the connection; the pretension force has been applied and no extemal force is present. The bolt force B = So is equal to the compressive reaction between the plate R = Co.
Region 2: (Figure 1.6.c,d)
In this region an extemal force is present and the compression plates are in contact. The extemal force is either tensile or compressive. The bolt force increases very little with the increase in the applied load, shown in Figure 1.7. This is because the axial stiffness of the plates is much greater than the axial stiffness of the bolt and the same change in length (or thickness) produces a much smaller increase in the bolt force than the decrease in the plate reaction. The reaction force between the plates decreases almost linearly with the increase in the extemal force, as shown in Figure 1.8.
Region 3: (Figure 1.6.e)
The plates have separated due to an applied tensile load; "uplift" has occurred. The bolt force now equals the applied tensile load, B = T and the reaction force between the plates is zero. The extemal force necessary to produce plate separation is typically a
5

w U 0:: o u.. ~ f.) o aJ
IE] SOL T SUBJECT TO FATIGUE TENSILE STRESSES
d.)
APPLIED COMPRESSIVE LOAD
Figure 1· 7 Bolt force vs. applied load
z o
~ w a:::
APPLIED COMPRESSIVE LOAD
b.)
/ c.)
~
+ APPLIED TENSILE LOAD
T APPLIED TENSILE LOAD
e.)
Figure 1· 8 Reaction force between plates vs. applied load
6

few percent greater than the pretension force; it depends on the axial stiffnesses of the bolt and plates.
Region 4: (Figure 1.6.f)
This region is similar to region 3 but the extemal load is compression and it is the bolt that is not longer in contact with plates. The reaction force between the plates is equal to the applied compression load and the bolt force is zero. The applied load that produces this condition is typically many times greater than the pretension load. This region is not a practical concem.
Fatigue is primarily a function of the tensile stress range. The shaded areas in Figure 1.7 indicate where the bolt is in tension. In region c.) the bolt is in tension but the change in bolt tension is very small compared to the change in the applied tension; fatigue would probably not be a problem in this area. In region e.) the bolt force is equal to the applied force and fatigue becomes a concem. This of course depends on the actual magnitude of the load range. When a compressive load is applied to the connection, region d.), the bolt is not loaded in tension but the compression relieves some load in the bolt. The bolt cycles between some initial tensile force and a lower tensile force, effectively producing a tensile load range in the bolt The change in the bolt force, however, is small compared to the change in the applied compression so fatigue is not a concem in this area.
1.2.2 Longitudinal Direction Behavior
Rotation
In the longitudinal direction, the cap girder is subject to rotation caused by the longitudinal steel girders. If the connection restrains the rotation, moments and forces will be produced in the cap girder, the connections, and in the pier. The resisting moment is
Figure 1· 9
proportional to the rotational stiffness of the connection. The center of rotation of a cap girder that is free to rotate is about the neutral axis of the . longitudinal girders; this position may change, however, for a cap girder that is restrained. Since the bearings are located near the bottom flange of the cap
Y girder and are not coincident with the center
Horizontal displacement of bearing
of rotation, a horizontal displacement is produced at the bearings, as shown in Figure 1.9.
Temperature-Induced Displacement
Horizontal forces will develop at the bearings due to the temperature-induced expansion and contraction of the superstructure. A simplified method has been developed [23] to determine the

r x ,;-POINT OF ZERO MOVEMENT
J! -~
TYPE A TYPE B
Figure 1· 10 Distribution of horizontal forces in continuous beam
distribution of horizontal forces in continuous bridges. Consider the continuous beam in Figure 1.10. The beam is supported on two types of bearings, designated as Type A and Type B. Type A bearings (expansion bearings, as an example) are free to displace horizontally, but develop a resisting force through friction; the resisting force is
(1.1)
where m is the coefficient of friction and N is the dead load. Type B bearings (elastomeric bearings, as an example) resist horizontal displacement and develop a resisting force proportional to the displacement; the resisting force is
(1.2)
where k is the shear stiffness of the bearing and d is the horizontal displacement of the bearing. The shear stiffness of the bearing includes the flexural stiffness of the supporting pier.
The movement of the structure is governed by a temperature coefficient
c = aAT (1.3)
where a is the thermal coefficient of expansion of the longitudinal girders and DT is the change in temperature. At some pOint along the length of the' beam the horizontal displacement will be zero; this is called the point of zero movement and is distance x from the left end of the beam. The distance x is given as
x c L kiLi + L Jl.iN;
C L ki (1.4)
where the subscript i indicates an individual bearing and Lj is the distance from the bearing to the point of zero movement. The variable x is present on both sides of the equation (it is necessary to determine Li) and so manipulation is needed to determine its value The quantity mjHi is positive if the bearing is to the right of the point of zero movement and is negative if the bearing is to the left. This process is similar to finding the centroid of a section, using the bearing shear stiffness in place of the area. The forces in the Type B bearings can now be found by applying Equation 1.2, with d = c ~ The bearings in this
8

research are Type B. The effects of the Type A bearings may be conservatively ignored, reducing Equation 1.4 to
(1.5)
1.3 STANDARD PRACTICE IN THE UNITED STATES
1.3. 1 Survey
To assist in the process of developing a new connection detail, a questionnaire was sent to the fifty states to determine the types of details used in situations where the pier dimensions are restricted. Thirty-three responses were received and a summary of the results is shown in Table 1.1. The responses are divided into six categories. These categories were determined by consolidating the numerous connection details and practices of the several states into a manageable number. None of the states that responded had a standard deSign detail for those situations in which a narrow pier and integral cap girder were necessary. Connections seemed to be designed on a case-bycase basis. Typically, each state had only a few situations in which a narrow pier and integral cap girder were used.
The most common response, cited by 55% of the respondents, was that the integral cap girder I uplift resistant detail is not used or that its use is specifically avoided. The "Does Not Use" response indicates that restricted geometries (limited horizontal and vertical clearances) are not encountered in that state and that standard hammerhead caps are used in conjunction with single column piers. This response could also indicate that the state had concerns regarding the design and behavior of the detail. The majority of the concerns regarded the fatigue behavior of integral steel cap girders and the fatigue strength of anchor bolts. The lack of redundancy of a single steel cap girder was also a major concern. Ten percent of the respondents indicated that they used details that included an integral steel cap girder, but one that was supported at the ends, thereby eliminating uplift. In the states that did encounter situations where the integral cap girder I uplift reSistant detail was needed, many different designs were used. Three of the typical details are described in the following sections.
Table 1-1 SUIVey Results
DESCRIPllON % Does Not Use or Designs to Awid Uplift 55 Post-Tensioned Concrete Cap Girder 12 Proprietary Bearings Qncludes Pot Bearings) 10 Steel Box Girder Supported at Ends 10 Single, Steel Jacketed Columns with Pinned Bearing Connection 7 Steel Cap Girder Bolted Directly to Pier 6
9

CAP GIRDER
EMBEDDED PIN PLATE
ROUND PIER COLUMN
4"THICK CLEVISES
......... ···0··· 0····· ·····0 0····· ·····0 0····· ·····0 0····· ·····0 0····· ·····0 0····· ·····0 :::Q:::
LONGITUDINAL STRINGERS \
c ..
SECTIONA·A
12"¢PIN
4" THICK PLATE
718" ¢ X 5" SHEAR STUDS
REINFORCING STEEL NOT SHOWN
8"¢ HOLES
5'.6"¢ PIER COLUMN
Figure 1·11 Single column with pinned bearing connection
1.3.2 Typical Details
Single, Steel·Jacketed Columns with Pinned Bearing Connection
A schematic of this detail is shown in Figure 1.11. A large diameter pin is used to connect the steel cap girder to the single column, steel-jacketed pier. The pin passes through two large plates that are embedded in the concrete column. Shear studs and large diameter holes in the pin plate provide a strong intenock with the concrete. This connection detail, as with many others that were reviewed, is specifically designed to allow longitudinal rotation. The horizontal displacements that develop must be accommodated by the pier column flexibility.
Integral Prestressed Concrete Cap Girder
This detail was used by states that were concerned about the fatigue behavior of steel cap girders. A schematic of a typical cap girder is shown in Figure 1.12. The longitudinal steel girders are initially bolted to a small steel cross-beam (not shown). Formwork is then built around the cross-beam and the
connecting longitudinal girders. Metal ductwork is set in the concrete to guide the post -tensioning bars. The rods are anchored to the outside longitudinal stringers and follow a parabolic path.
Steel Cap Girder Bolted Directly to Pier
The simplest detail is probably that shown in Figure 1.13, the steel cap girder bolted directly to the pier cap. The connection hardware is essentially eliminated. The cap girder rests on some type of bearing pad, which may be used in conjunction with grout, and is secured to the pier cap with embedded anchor bolts. Since no element allows free longitudinal articulation, the moment and force that develop from the rotation and horizontal displacement must be mitigated by the pier column. A tall, slender, flexible pier column will attract a small moment and force. A short, stocky, stiff pier column can develop considerable moment and force. In the latter case, a box cap girder is used because a single web cap girder will distort considerably at the longitudinal stringer frame-in pOints.
10
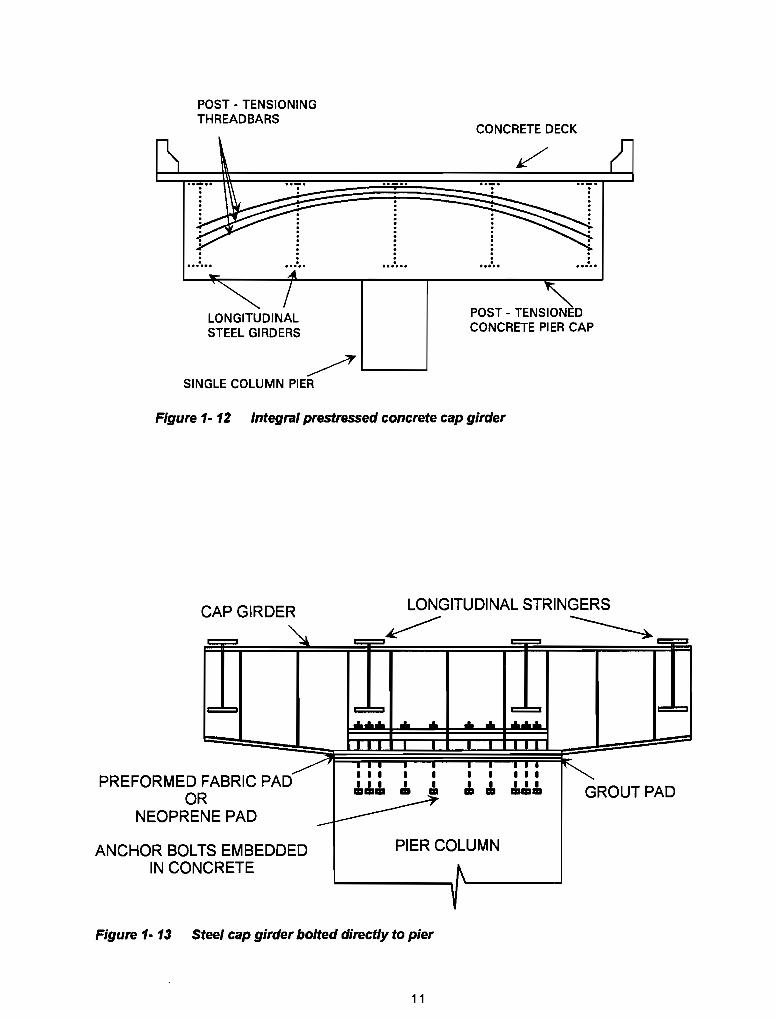
POST - TENSIONING THREADBARS
LONGITUDINAL STEEL GI RDERS
. ......
CONCRETE DECK
· · · . ....
POST - TENS~D CONCRETE PIER CAP
~'-------i SINGLE COLUMN PIER
Figure 1·12 Integral prestressed concrete cap girder
CAP GIRDER
PREFORMED FABRIC PAD OR
NEOPRENE PAD
ANCHOR BOLTS EMBEDDED IN CONCRETE
LONGITUDINAL STRINGERS
~ ~
• • I
da-Y. GROUT PAD
PIER COLUMN
Figure 1· 13 Steel cap girder bolted directly to pier
11

The single web, by flexing in response to the stringer rotation, becomes the rotational "sink", a function normally performed by a bearing. Distortion-induced fatigue is the likely outcome.
None of the connection deSigns submitted seemed simple or cost-effective enough to consider as an altemative to the standard TxDOT detail. Many, including the connection described above, involved the use of a pin, which requires labor-intensive machining. The post-tensioned concrete cap girder requires complex detailing of the steel connections within the cap girder. The cap girder placed directly on the pier cap must transfer force along the entire length of the pier, rather than at one or two locations. The distribution of the force along the length would be difficult to determine as compared with the determination of the forces at one or two isolated locations.
1.4 BASICS OF BRIDGE DESIGN
At present (1994), the Texas Department of Transportation designs its bridges using the Standard Specifications for Highway Bridges of the American Association of State Highway and Transportation Officials (AASHTO) [2]. For curved steel plate girder bridges that incorporate integral steel cap girders, the working stress design provisions of the specification are used.
1.4. 1 Analysis of the Bridge Superstructure
Two primary methods exist for analyzing bridges that are curved in plan. The first method is to use a three-dimensional finite element analysis; this is the most accurate method of analysis but it is also the most time consuming and requires access to a program capable of carrying out the analysis. The second approach is to use an approximate method; the most common simplified analysis technique used is the V-load method [22].
Descriotion of V-Load Method
When a hOrizontally curved girder is loaded vertically, torsion is produced. In multiple girder bridges, diaphragms are used between the girders to distribute lateral loads and to resist the torsion. A typical diaphragm detail, known as an X-brace, is shown in Figure 1.14. Figure 1.15 shows a segment of a curved girder centered on a diaphragm chord. The arc length, S, is the distance between diaphragms and R is the radius of curvature. The girder flange force can be approximated as Fr = Mi I hr where Mi is the inplane bending moment and hr is the distance between the flange centroids. Since the flange forces are not collinear a lateral force component develops in the diaphragm chord, Hd = (Mi S) I (hr R). Equilibrium of the diaphragm requires that vertical shear reactions develop in the girders, as shown in Figure 1.16. For two girders, the magnitude of the shear force is V = (Hd1 + Hd2) hr I D where the subscripts 1 and 2 indicate the girder number and D is the girder spacing. These vertical reactions are termed V-loads. They are assumed to be self-equilibrating along each line of diaphragms and therefore produce no net increase or decrease in force. The V-loads are added to the actual loads on the girder to approximate the curvature loading effects.
12

Figure 1· 14 Typical diaphragm detail
5
Figure 1·15 Diaphragm equilibrium
Figure 1·16 Shear loads on diaphragm
13
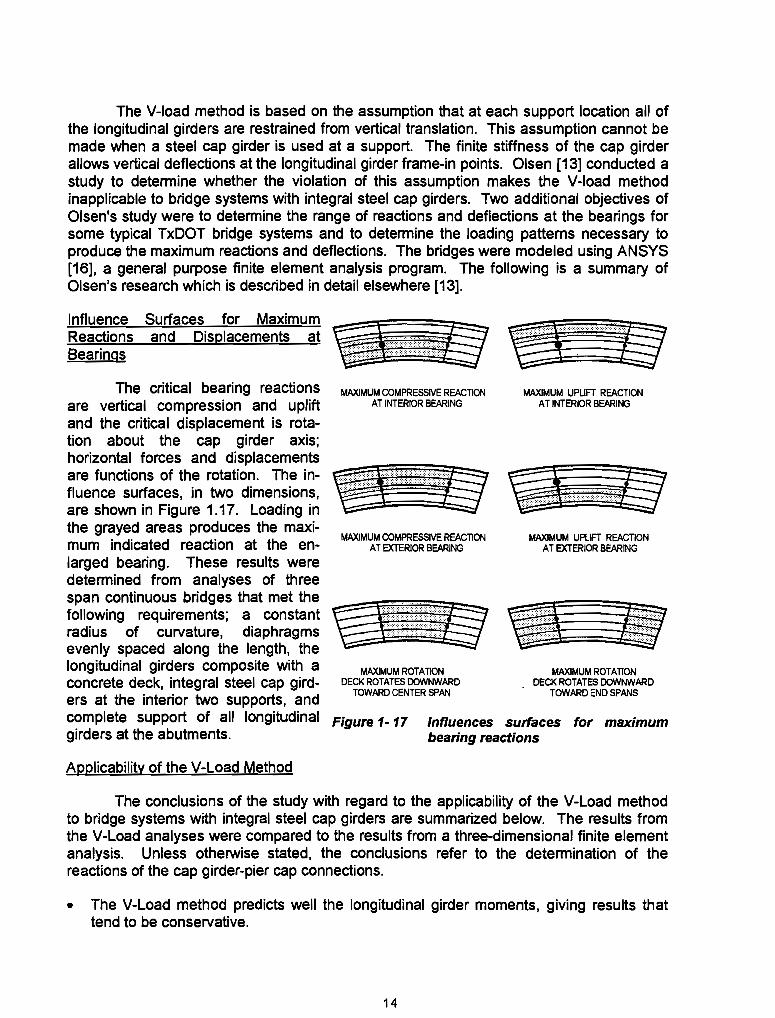
The V-load method is based on the assumption that at each support location all of the longitudinal girders are restrained from vertical translation. This assumption cannot be made when a steel cap girder is used at a support. The finite stiffness of the cap girder allows vertical deflections at the longitudinal girder frame-in pOints. Olsen [13] conducted a study to determine whether the violation of this assumption makes the V-load method inapplicable to bridge systems with integral steel cap girders. Two additional objectives of Olsen's study were to determine the range of reactions and deflections at the bearings for some typical TxDOT bridge systems and to determine the loading pattems necessary to produce the maximum reactions and deflections. The bridges were modeled using ANSYS [16], a general purpose finite element analysis program. The following is a summary of Olsen's research which is described in detail elsewhere [13].
Influence Surfaces for Maximum Reactions and Displacements at Bearings
The critical bearing reactions are vertical compreSSion and uplift and the critical displacement is rotation about the cap girder axis; horizontal forces and displacements are functions of the rotation. The influence surfaces, in two dimensions, are shown in Figure 1.17. Loading in the grayed areas produces the maximum indicated reaction at the enlarged bearing. These results were determined from analyses of three span continuous bridges that met the following requirements; a constant radius of curvature, diaphragms evenly spaced along the length, the longitudinal girders composite with a concrete deck, integral steel cap girders at the interior two supports, and complete support of all longitudinal girders at the abutments.
Applicability of the V-Load Method
MAXIMUM COMPRESSIVE REACTION AT INTERIOR BEARING
MAXIMUM COMPRESSIVE REACTION AT EXTERIOR BEARING
MAXIMUM ROTATION DECK ROTATES OOWNWARD
TOWARQ CENTER SPAN
MAXIMUM UPLIFT REACTION AT INTERIOR BEARING
MAXIMUM UPLIFT REACTION AT EXTERIOR BEARING
MAXIMUM ROTA nON DECK ROTATES OOWNWARD
TOWARD END SPANS
Figure 1-17 Influences surfaces for maximum bearing reactions
The conclusions of the study with regard to the applicability of the V-Load method to bridge systems with integral steel cap girders are summarized below. The results from the V-Load analyses were compared to the results from a three-dimensional finite element analysis. Unless otherwise stated, the conclusions refer to the determination of the reactions of the cap girder-pier cap connections.
• The V-Load method predicts well the longitudinal girder moments, giving results that tend to be conservative.
14

• The results from a V-Load analysis are not affected by a change in the radius of the curvature of the bridge.
• The V-Load method is more accurate for end spans that are long relative to the center span; a recommended minimum ratio of the end span length to the center span length is 1 to 1.2. For shorter end spans the V-Load method becomes increasingly inaccurate.
• For Live Load placed in the interior lanes, the V-Load method is conservative. For Live Load placed in the exterior lanes, the V-Load method is unconservative in predicting the compressive bearing reaction by about 5%. If the V-Load method predicts that uplift will not occur, that is, the uplift bearing will be under compression, the estimate of this compression force will be unconservative by about 10%. If the V-Load method predicts uplift, the estimate of the uplift force will be conservative.
• For Dead Load and concentric, uniform Live Load, the transverse overturning moment will produce reactions in the bearings that are small compared to the reactions produced by the vertical loads. Therefore, any inaccuracy in V-Load method will have negligible effect on the final reaction forces.
• If the pier support is off-center, the V-Load method is conservative and fairly accurate.
1.4.2 Design Loads
The loads that affect the design of the cap girder and bearing connection are listed below:
• Dead Load D
• Live Load plus Impact (L+I)n
• Centrifugal Force CF
• Wind Pressure on Structure W
• Wind Pressure on Moving Load WL
• Braking and Acceleration Force LF
• Thermal Displacement Force T
The dead load (D) includes the weight of the concrete deck slab and railings, the longitudinal steel girders, diaphragms, and cap girders, and any permanent utilities.
The live load (L) is the weight of the vehicular traffic. The load is represented by either a standard truck with trailer or an equivalent uniform load in combination with a concentrated load, as shown in Figure 1.18. The load is placed in a design lane, which is 12 feet wide. The standard truck and the uniform load occupy a 10 foot width of the design lane, and the loads are pOSitioned, in their respective lanes, such that they produce the
15

Figure 1-18
H2O-M LOADING _..... LOADING
Standard truck and equivalent uniform lane load (adapted from AASHTO[2})
maximum stress in the member being analyzed. When the standard truck loading is used, only one truck per lane is used on each span, and when the equivalent uniform lane load is used it is placed on the entire length of the span; partial span loading is also allowed. The number of design lanes on a bridge is a function of the roadway width and a load reduction factor is used when more than two design lanes are loaded. The factor is 0.9 for three loaded lanes and 0.75 for four loaded lanes. The live load is increased by an impact factor (I) to account for the dynamic nature of the loading.
The centrifugal force (CF) is the normal component of the inertia vector of the moving truck and represents the tendency of the truck to leave its curved path. It is applied at six feet above the deck in the transverse direction.
Wind forces (W) are treated as moving loads that act horizontally in any direction. They can act on the exposed areas of the superstructure and substructure and on any traffic on the bridge. When applied to bridge traffic (Wl), the centroid of the force is assumed to act at 6 feet above the bridge deck. The acceleration and braking forces (IF) are the tangential component of the inertia vector of the moving truck and are given a magnitude of 5% of the live load headed in one direction. .
The thermal displacement forces (T) occur due to the temperature induced expansion and contraction of bridge components. Forces are present only in those components that are restrained from moving.
1.5 DESIGN PROCEDURE FOR STANDARD TxDOT DETAIL
There are five major steps in designing the standard TxDOT connection detail. They are listed below.
1) Determine the loads on the cap girder and bearings
2) Design the bearing plates and rocker elements
16

3) Size the cap girder web
4) Design the bearing stiffeners
5) Design the anchor bolts and related plates
The following sections will describe each step in detail. The design example given in Appendix A clarifies the general descriptions given below.
Determining the Loads on the Cap Girder and Bearing
The load combination that usually controls the design of the connection is shown below:
D + (L + I )n + CF + O.3W + WL + LF + T
The live load, which may consist of one or more lanes, is positioned such that it produces the largest reaction in the member under investigation. The largest vertical forces are produced by the dead load and live load and the largest horizontal forces are typically produced by temperature.
Design of the Bearing Plates and Rocker Pin
The bearing plates and rocker pin are designed to resist the maximum compressive reaction. The bearing plates typically number three or more and are stepped, as shown in Figure 1.19. The bottom plate is sized such that the stress it places on the concrete pier, which is assumed uniform and equal to the load divided by the area of the plate, does not exceed the allowable concrete bearing stress of 0.3fc· (A2 1 A1)o.5. The total thickness of the plates is determined by applying the uniform bearing stress to the bottom of the plate, calculating the moment at the center of the plate, and determining the minimum thickness necessary to limit the bending stress to the allowable of 0.55Fy• The thicknesses of the individual plates are determined by applying the uniform bearing stress under the plate to the cantilevered portion and carrying out the procedure used for calculating the total thickness. The plates are welded together to form a monolithic unit.
The rocker pin is treated as a pin subject to rotation. The length of the pin is established from the design of the bearing plates; the thickness is determined such that the bearing stress on the pin does not exceed the allowable of O.4Fy• The radius at the top of the pin is machined to an ANSI 125 finish. The rocker pin is welded to the top bearing plate with a partial penetration groove weld. The minimum weld size usually governs the design. The dimensions of the sole plate are typical, with the radius of the groove 1/16 inch larger than the radius of the pin.
Sizing the Cap Girder Web
The cap girder web is designed to preclude the need for intermediate stiffeners. It must resist the shear caused by the vertical loads and is tapered outside of the connection area.
17

Figure 1·19
'Q. »
• l!~ • ~. '0 0-t I .Ie Ii --+---fl~I-a-P.t-i1 z t:
~!' ~:;.v-*""'-"I'I '0 Bec:r .
) ':!! N -;~ --- - - --- ) ~-
j I · WI:. 0 • --Ii; . • ~i
!!! .. N ... -u on I( xi a!! ~ S ... ... is! ~ :II I( ~I ". ¥.
. #. ... g #.
S Vr' I( , N 0
~ :..~
SECTION B-a SECT ION e I -a I
I---,i-:-ii--I------ COl> W.I> d, l--+.if-ioo-;"""1-;------l , I( , Stl"1_.
A~-+-:-+-::::=-I------ , V,' )C I 'II" Cope
....t------rt , I( 2 V~ I( 0' -8'
___ -- . -- Bottom Flonoe 01 COl> w, 2" Ho'.15
.__--It ''I, II( 18 .Ie 2' - .. " w' 2'11' Holell
) 'I, I( 7 Ie 2'·, ~' Pin
It z Yz )C 22 )C 2' - .. " w, 2'11' Hoi •• for Anchor 8olt ... I '/4" Hoi •• 10r HOld 00wn Bolt.
t 2 Y2 I( HI( 2"'" 'III 2 .... Ho'I5I5 10r Anehat' Bolt ... I \f.', 110' •• for HolG 00wn 801t.
It 2 Ya I( 28 x 2"'" wi 2'11' 1101 •• 1011' Anchor Bolt ... I 'I." 1101 •• for IIOIG 00wn Bolt.
Top Of ConIII"ete Co IUII'I
...,..-- Y!.' Pr.fOf'lllld FCIbr Ie Pod
;.o...--+---!------- t 801' •
...... -------- i 8/"0
DETAIL B
Typical details of standard TxDOT connection (from TxDOT Bridge Design Guide [211, p, 7-70)
18

Design of the Bearing Stiffeners
The bearing stiffeners, three to a connection and located on both sides of the web, extend along the entire depth of the web and are interrupted by a horizontal cross-plate. The stiffeners, along with a portion of the web, are designed as an axially loaded column. A mill-to-bear specification is made for the bottom flange-stiffener junction and a tight fit specification is made for the remaining junctions. The stiffeners are welded to the web and the cross-plate but are not welded to the cap girder flanges.
Design of the Anchor Bolts and Related Plates
The minimum diameter of anchor bolts for bridges with spans over 100 feet is 1.5 inches. Four anchor bolts per connection are typical and the embedment 1.5".ANCHOR BOLTS
depth is 20 bolt diameters. Four 1 inch diameter bolts are also used to secure the bearing plates to the concrete pier. The r1'" HOLD-OOWNBOLTS
anchorage for the bolts is shown in Figure 1.20. It consists of a metal template to position the bolts and double nuts to hold the bolts in place. It is not necessary to check the anchorage and pull-out capacity of the anchor bolts if uplift does not occur. Figure 1. 20 Bolt anchorage
The cross-plate is designed as a fixed-fixed beam with a point load at the center. The magnitude of the load is equal to the allowable tensile load of the anchor bolt. The bearing pad, which is located between the cross-plate and the nut-washer plate, is also designed to resist the allowable tensile load of the anchor bolt. A 1 inch thick pre-formed fabric pad is typically used, with an allowable compressive stress of 2000 psi. The nut-washer plate is designed in a manner similar to the bearing plates.
The anchor bolts are tightened using the turn-of-the-nut-method, typically to a condition of snug tight plus one-quarter tum. The snug tight condition is defined as the tightness that exists when all plies of the joint are in firm contact; this can be achieved by the full effort of a man using an ordinary spud wrench [3]. After the bolt is snugged the nut is turned some fraction of a tum further, in this case one-quarter turn. The final tightening is done after all of the dead load is on the structure.
1.6 SCOPE OF RESEARCH
Phase I of the research, which dealt with an examination of the standard connection, is covered in Chapters 2 through 5. Chapter 2 describes the test program and the development of the test specimen. A three-quarter scale experimental model of a prototype connection was the subject of the study. Tests were conducted in the transverse and longitudinal directions. In addition, tests were conducted to determine the pretenSion force that could be induced in the anchor bolts. The primary objectives of the Phase I
19

research were to determine if the anchor bolts developed fatigue critical stresses due to longitudinal rotation and to determine if the connection could be used to resist uplift. The test results are presented in Chapter 3 and a discussion of the results are presented in Chapter 4. A summary of the results and the conclusions of the Phase I research are given in Chapter 5. A new detail is developed based on the results of the Phase I research and is introduced in Chapter 5.
Phase II of the research focused on the testing of the new detail. The testing conSisted of large-scale tests and component tests on the bearing detail. Chapters 6 and 7 cover the component tests on the bearing detail, which consisted of compression tests and fatigue tests. Chapter 8 covers the large-scale tests on the new connection system. These tests were conducted in a manner similar to the large-scale tests conducted in the first phase of the research. A summary of the results and the condusions of the Phase II research are given in Chapter 9. The design procedures for the new connection detail are presented in Chapter 10. The research was limited to an examination of the connection itself, which included the bearing hardware, the anchor bolts, and the stiffener details. The pull-out capacity of the bolt anchorage was not part of the experimental program, but some design recommendations are included .. Research on the bearing capacity of the pier cap and recommended steel reinforcement details are summarized in Chapter 11. A separate report [6] gives more details on this phase of the research. The complete design of the concrete cap girder was not addressed, though its interaction with the connections was considered
20

CHAPTER 2
PHASE I TEST PROGRAM
2.1 PROTOTYPE BRIDGE DESIGN
The first step in the testing program was to design and build the test specimen. The test specimen included the cap girder, the pier cap, and the connection. The design parameters induded the span lengths and deck width of the roadway, the longitudinal girder spacing, the bearing connection spacing, and the slab thickness; TxDOT provided a range of values for each of the parameters. Once the parameters were established, a particular set of parameters was selected to be used in the design of prototype components. The test specimen was an approximate 3/4 scale model of the prototype.
Design Parameters
TxDOT provided the following ijf;;;I information with regard to the design ,a::1 ....... ~~=:s..~:g-:=:5~:::::;~::::::::=oa;Q~:r----~===~SZ:
t th ty' II ,J.f---""-L--J ..... _-'-1""'.2""'L'--..... J<----___ L'---.,t). parame ers; e overpasses are pica y (100' -180') (120' _ 220') three span, with a constant radius of curvature, and a center span 20% longer than the end spans. The curvature was ignored in the parameter study. The minimum length of the end spans is 100 feet, corresponding to a 120 foot center span, and the maximum length of the end spans is 180 feet, corresponding to a 220 foot center span. The deck width is 44 feet for 2 lane
2 LANES: 44 It 3 LANES: 56 It
I I ~(8" -10")
! I j I T ~ I I .p(7 5' - 9')
~ I . (3' -1Z)
bridges and 56 feet for three lane bridges; Figure 2· 1 Design parameters the girder spacing is not less than 7.5 feet . and does not exceed 9 feet. There are two types of girder configurations, odd and even; the odd configuration indicates that there is an odd number of girders. In this type of configuration, one girder is aligned between the bearing connections. The even configuration signifies the use of an even number of girders, with the bearing connections between two girders. The slab thickness is usually 8, 9, or 10 inches and the connection spacing varies from 3 feet to 12 feet. This information is shown schematically in Figure 2.1.
Bridge Systems Analyzed
The prototype bridge was selected based on the results from an analysis of four basic bridge configurations. The parameters of these bridge systems are listed in Table 2.1 . A two lane bridge and a three lane bridge, each with the minimum span lengths and maximum span lengths, were examined. For each system, the concrete slab thickness was varied from 8 inches to 10 inches. The purpose of the analyses was to determine the
21

Table 2 .. 1 Bridge System Parameters
# of Lanes Span Lengths # of Girders @ SpaCing Slab Thickness 8"
2 100' -120' - 100' 6@8'-0" 9" 10" 8"
2 180' - 220' -180' 6@8'-0" 9" 10" 8"
3 100' - 120' -100' 7@8'-8" 9" 10" 8"
3 180' - 220' -180' 7@8'-8" 9" 10"
uplift force as a function of the bearing connection spacing. By using the minimum and maximum span lengths, bounds for the uplift force could be established. A plan view of the bridge systems and the loading pattern is shown in Figure 2.2. A cross-section view of the two lane bridge and its loading pattern is shown in Figure 2.S.
Two load cases were examined, dead load and vehicle live load. The dead load comprised the weight of the concrete deck slab, given as SOL, and the self-weight of the longitudinal girders, given as G. The span-ta-depth ratio of the longitudinal girders was assumed to be SO, using the center span length, and the self-weight was estimated. The vehicle live load consisted of truck lane loads and an accompanying point load, given as LL. Each lane is 12 feet wide and the lane load is assumed to be distributed over a length of 10 feet. The lane load can be located anywhere within the 12 foot wide lane. The AASHTO lane loading is used to simulate the load of a line of trucks and is equal to 640 plf. The maximum reaction at the bearing locations occurs when the two adjacent spans are loaded. An 18 kip point load, one for each lane, was placed at the bearing location, centered within the lane load. To produce uplift at one of the bearings, the live load must be placed on the roadway eccentrically with respect to the centerline of the roadway. In both the two lane and the three lane bridges, two loaded lanes were necessary to produce the worst-case uplift condition.
L 1.2L
LANE 1 LANE 2
MAXIMUM REACTIONS
Figure 2- 2 Plan view of loading for prototype bridges
22
L

LL 7' 12'
2' 8' 8'
S LL DL
3'
4' 22'
Results of Analyses
The results of the analyses are shown graphically in Figure 2.4, as a plot of bearing uplift force RI versus the connection spacing, which is defined as 2d (shown in Figure 2.3). Only the results from the analyses using an 8 inch slab thickness are shown. The change in slab thickness did not have much affect on the connection spacing necessary to produce uplift. The connection spacing at which uplift occurs is primarily a function of the deck width and the span
Figure 2- 3 Cross-section view of loading length. A wider deck width increases the for prototype bridges eccentricity of the live load; this produces a
-80\.f--+-F-r-+-+--+---+-+--+--'
6 7
CONNECTION SPACING (ft)
larger overtuming moment at the bearings and consequently a larger tensile force in the bearing subject to uplift. The bearings must be farther apart in order to prevent uplift from occurring. An increase in span length
-- -- increases both the magnitude of the live load and the magnitude of the dead load. An increase in dead load causes the curves to move to the left, indicating that the bearings can be spaced at a smaller distance without uplift occurring. The most critical bridge configuration is that in which uplift commences at the widest bearing spacing;
Figure 2- 4 Bearing uplift force vs. connection spacing this configuration is the three lane short-span bridge and uplift begins at a connection spacing
of 6.26 feet. Uplift begins in the two lane short-span bridge at a connection spacing of 4.46 feet, at 4.22 feet in the three lane long-span bridge, and at 3.00 feet in the two lane long-span bridge. The three lane Short-span bridge was chosen for the prototype design. The result show that, in general, uplift will not occur for symmetrically placed pier caps until the connection spacing becomes less than 10% of the roadway width. This translates into connection spacings from about 3 feet to 6 feet, spacings which are for the most part impractical because they would place limitations on the widths of the bearings. Uplift, therefore, will not occur for the vast majority of situations in which the cap girder is placed on the pier cap symmetrically.
Prototype Bridge DeSign
The purpose of designing the prototype bridge system was to produce a cap girder design and connection detail that could be scaled down and tested experimentally. The
23

connection spacing of the three lane short span bridge was decreased to 4 feet and the deck width was decreased to 47 feet. The deck width was decreased to lessen the load on the cap girder, which would result in a smaller size, and the connection spacing was reduced to match the test floor bolt pattern spacing. By reconciling the spacing difference, a more efficient test setup could be designed. The analysis was simplified by using the same size for all of the longitudinal girders; the section was prismatic. A summary of the sizes of the primary components of the prototype cap girder and the test specimen is shown in Table 2.2. The test specimen is an approximate 3/4 scale model of the prototype. The cap girder acted as a lever arm that applied an overturning moment to the bearings. Only the vehicle live load was simulated during testing. A schematic of the test connection is shown in Figure 2,5.
Table 2·2 Cap Girder Dimensions
PROlOTYPE FLANGE 20" X2" WEB 60" X.75" STIFFENER 9" X1" ANCHOR BOLT 2"f/2.5 in2 UPUFTFORCE 64ki~ COMPRESSIVE REACTION 1050 kips
TllNlSVl!RSE DIRECTION
58 X 5.5' X 2' PlATE
5.25' X5.25' x 0.5,0.75" BEARJNGPAD
1.5'!IA38GAl.VAHlZEO ANCHOR BOlT
:WXI4'X28SO!.EPI.
24' x as x 5.5' PIN
24'X 12'X 1.WPlATE c:;;~~~24'XlrX 1.WPlATE ,....J 24'X24'X 1.75'PlATE
~DIREC11ON -
3/4 SCALE MODEL TEST SPECIMEN 15" X 1.5" 16" X 1.5" 45" X9/16" 48" X 314" 6,75" X.75M 7" X.75"
1.75"f 11.88 in2 1.5"f 11.41 in2 48ki~ 45ki~
788 ki~ 750 kips
The design for the concrete pier cap and pier column was a scaled down version of a typical design used in bridges where the connection spacing is 12 feet. The actual design and detailing of the concrete and its reinforcement is addressed by Denio [6].
2.2 TEST PROGRAM
2,2.1 Test Variables
Figure 2· 5 Schematic of test connection The experimental test program comprised pretensioning tests, transverse stiffness tests,
longitudinal stiffness tests, cyclic loading tests in the transverse direction, and an ultimate strength test. The primary variable in the tests was the bearing pad. The bearing pad is used to reduce the axial stiffness of anchor bolt and thereby reduce the force in the anchor bolt produced by the longitudinal rotation.
24

Table 2. 3 Bearing Pad Sfiffnesses The stiffness of the connection is a direct function of the flexibility of the anchor bolts and the compressibility of the bearing
BEARING PAD
112-in. PFP 3/4-in. PFP 1/2-in. ROF 3/4-in. ROF 5/8-in. NEO 3/4-in. NEO 71-in. BOLT, 1.5-in. dia.
STIFFNESS kips per inch
890 799 241 171 75 52 723
pads. To examine a connection with different stiffnesses, a number of bearing pads, with a wide range of stiffnesses, were used as variables in the tests. Three types of materials were used, each of two thicknesses; an unreinforced elastomeric bearing pad, made from neoprene rubber (NEO); a nonengineered, pre-formed structural bearing pad that is constructed from a homogeneous mixture of new, unvulcanized rubber and unused, randomly-oriented synthetic fiber reinforcement (ROF); and pre-formed fabric
pad, which is composed of multiple layers of cotton duck impregnated and bound with a high quality natural rubber (PFP). Approximate static stiffnesses of the pads, in kips per in, are shown in Table 2.3. The stiffnesses vary from 52 klin for the 3/4" neoprene to 890 klin for the 1/2" pre-formed fabric pad. Also shown is the stiffness of the anchor bolt, which is a calculated value (see Section 4.1.1).
2.2.2 Stiffness Tests
Test Schedule
The test schedule for the transverse stiffness tests is shown in Table 2.4. Six of the tests were con-ducted with the bearing pads; the variables considered were the pad material and pad thickness. One test was conducted with no bearing pads. Also shown is the amount of pretension used in each test. The bolt tightening procedure used was the tum-of-the-nut method; in the field, the bolts are typically tightened to snug plus 1/4 turn.
Test Setup
Table2·4 Test Schedule for Stiffness Tests
TEST BEARING PAD PRETENSION 1 314" NEO SNUG + 1/2 TURN 2 5/8" NEO SNUG + 1/2 TURN 3 314" ROF SNUG + 1/4 TURN 4 1/2" ROF SNUG + 1/4 TURN 5 3/4" PFP SNUG + 1/4 TURN 6 1/2" PFP I SNUG + 1/4 TURN 7 NO PAD SNUG
A schematic of the test setup for the transverse loading tests is shown in Figure 2.6. The setup consisted of the cap girder, the pier cap, a l' section of the pier column, and a foundation to anchor the setup to the test floor. The concrete portion was cast in two stages, as is done in the actual construction. The pier column is cast first and is allowed to set; the pier cap is then cast at a later date. The cap girder was 15 feet long and cantilevered out past the left bearing 8 feet, acting as a loading arm to apply an overturning moment to the bearings. The girder and bearing steel were A572 GR50 material (yield stress is 50 ksi) and the anchor bolts were 1.5 inch diameter galvanized A36 steel (yield
25

8' -12 r f' -11~F=============r*~==~FFT===~
4'
-10 ~ -9 -8
=~'tr========1~~~~~~ -5 E-_ 4 LOAD
-3 -2 - 1 (FEET)
I I
PIER CAP
I COLUMN J
I I TEST I I FLOOR I I I I I
Figure 2- 6 Schematic of transverse direction test setup
Figure 2- 7 Transverse direction test setup
26

stress is 36 ksi); the concrete strength was 3500 psi. The foundation was secured to the test 'floor at each end with high strength bolts. Figure 2.7 shows the test setup as constructed in the lab. A schematic of the test setup for the longitudinal rotation tests is shown in Figure 2.8. A truss structure composed of angles and T-sections was designed to simulate a longitudinal girder and to act as a loading arm. The rotation was applied by loading the end of the truss structure. The connection to the cap girder web is typical of what is done in the field; clip angles are used to transfer shear, the bottom flange of the longitudinal girder was welded to a plate that was bolted to the cap girder web, and the top flange was connected over the top of the cap girder. The test setup as constructed in the lab in shown in Figure 2.9.
Instrumentation
The instrumentation consisted of strain gages, used on the anchor bolts to measure bolt force, and linear potentiometers, located along the length of the girder to measure the vertical bottom flange deflection and the bottom flange longitudinal rotation. Electronic rotation gages were located on the top flange of the cap girder. The instrumentation is shown in Figure 2.10.
Test Procedure
The test procedure for the transverse stiffness tests was the same for each test. After the bolts were pretensioned, small static loads were applied to the test specimen and sensor readings were taken after each. Load was then applied in increments such that 10 to 15 readings could be taken before the test end. Each load was paused for 5 minutes or 10 minutes, depending on the bearing pad material, to allow creep of the pads. Readings were taken before and after the pause and the load was held constant during this time.
2.2.3 Pretensioning Tests
The primary objective of the pretensioning tests was to determine the magnitude of the pretension force that could be put in the anchor bolts using a typical installation procedure. A secondary objective was to determine how the tightening sequence affects the distribution of the bolt forces. The schedule is shown in Table 2.5. Each test is identified by an alphanumeric code. The first three letters indicate bearing pad material; the next two numbers are the nominal durometer hardness of the bearing pad; the following two numbers are the thickness of the pad in sixteenths of an inch; the last number is the bolt tightening sequence number.
The pretensioning tests were conducted on the east, or uplift, connection. A pipe wrench with a 12 inch long handle was used for the tightening. A pipe extension was used as a lever arm to tighten the bolts past snug. The number of turns past snug was determined by marking the nut and then marking the cross plate at the location where the nut had to be turned to.
27

r 8' i
CLIP ANGLES
.. LOAD
00
N oE-E--
ANCHOR BOLTS NOT SHOWN ,.-J:~g~::!::L-.
Figure2·8 Schematic of longitudinal direction of test setup
Figure 2· 9 Longitudinal direction test setup
28

- -""- / INCliNOMETERS
') E-
i
[) ~ LOAD
57.5" 86.5·
168"
Figure 2· 10 Schematic of instrumentation
Table 2- 5 Test Schedule for Pretensioning Tests
NE070101 NE070102 NE070121 NE070122 PFP90081 PFP90082 PFP90121 PFP90122 ROF85081 ROF85082 ROF85121 ROF85122 STE00321 STE00322
2 .E·· -MA1ERlAL
Neoprene Neoprene Neoprene Neoprene
Fabric Pad
• • 1 3
HARDNESS (durometer)
70 70 70 70 90
6 8 • • • • 5 7
"THICK TENSION (inches) 8-May Snug+1I2T 8-May !nUg+1/2T 4-Mar Snug+1/2T 4-Mar Snug+1/2T 2.Jan Snug+1/4T
Fabric Pad 90 I 2.Jan Snug+1/4T Fabric Pad 90 4-Mar Snug+1/4T Fabric Pad 90 4-Mar Snug+1/4T
ROF 2.Jan Snug+1/4T ROF 85 2.Jan Snug+1/4T ROF 85 4-Mar~4T ROF 85 4-Mar Snug+1/4T
Steel Plate - 2 Snug+1/4T Steel Plate - 2 Snug+1 14T
29
TIGHTENING . SEQUENCE
1423 1342 1423 1342 1423 1342 1423 1342 1423 1342 1432 1342 1432 1342

Two bolt tightening sequences were used. The procedure for each test is shown below.
1. Hand-tighten all four bolts.
2. Snug tighten first bolt in sequence using 12" long pipe wrench.
3. Tighten same bolt fraction of a full tum further, either 1/4 tum or 1/2 tum. Bolt is fully tightened. Record strain readings.
4. Repeat steps 2.) and 3.) for next bolt in tightening sequence. (Each step took approximately two minutes to complete).
5. After all four bolts are tightened, pause ten minutes to allow creep and record strain readings.
30

CHAPTER 3
PHASE I TEST RESULTS
3.1 MATERIAL PROPERTIES
Anchor Bolts
The anchor bolts used in the full scale tests were made from 1.5 inch diameter A36 round stock and had cut threads for six inches at each end. Two rod lengths were ordered, 91" and 66". The anchor bolts were hot - dip galvanized and the nuts were tapped oversized to accommodate the galvanizing. The strength properties of the anchor bolt-nut assemblage was detennined by a tension test on one rod of each length. The bolts were tested in a 600 kip capacity hydraulic test machine. The strain was measured with an 8" extenso meter and the total bolt deflection was measured by a linear potentiometer. The bolt shank was held by grips at the top and the bottom was secured by the nut and washer plate used in the full scale tests. The results of the tests are shown in Table 3.1. In both cases, the bolt fractured at the first thread that engaged the nut. A "Gil indicates that calculations were made using the gross area and a ''T'' indicates that calculations were made using the tensile stress area [3, pA-1471, which is the area of the threaded portion of the bolt and is defined as
( 0.9743)2
At = 0.7854 db - -p- (3.1)
where db is the nominal diameter of the bolt and p is the number of threads per inch.
Table 3·1 Anchor Bolt Material Properties
DESC AREA STA llC YIELD DYNAMIC YIELD ULT. SlRENGTH SlRESS LOAD SlRESS LOAD SlRESS LOAD
in2 ksi kips ksi kips ksi kips 91-1n. G 1.77 42.1 74.5 45.2 79.8 55.1 97.4 91-1n. T 1.41 52.8 74.5 56.6 79.8 69.1 97.4 66-in. G 1.77 I 40.6 71.9 43.2 76.4 58.2 103 66-inT 1~1 71.9 54.2 76.4 73 103 MILL 45.5 69 ASlM 36 58
31

Table 3- 2 Concrete Material Properties Concrete Pier Cap and Foundation
AGE COMPRESSIVE SlRENGTH (PSi) (days) PIER CAP COLUMN & FOUND.
7 2561 4247 14 3047 4813 21 3353 5120 28 3474 5543 201 3880 6243
3.2 PRETENSIONING TESTS
The compressive strengths of the concrete elements used in the large scale tests are shown in Table 3.2. The foundation and column were specified to have a strength of 5000 psi and the pier cap was specified to have a strength of 3600 psi. The target pier cap concrete strength was the same as that specified in the field. Shown in the table are the strengths at 7, 14, 21, and 28 days and the strength at the time of the ultimate strength test. The values are the average of strengths obtained from three standard cylinder tests.
The functions of the anchor bolts in the detail are to provide a positive connection from the cap girder to the pier cap and to resist uplift. Most of the existing bridge systems using this detail are not subject to uplift, so the anchor bolts serve no purpose once the bridge is opened to traffic. During the erection stage, the anchor bolt nuts are tightened to hold the cap girder in place as the deck slab is placed. Once placement is cOr"!lplete, the nuts are tightened using the tum-of-the-nut method, one-quarter tum past snug. The engagement of the anchor bolts introduces a rotational restraint into the connection system. To reduce the magnitude of the restraint, which will reduce the fatigue stress in the anchor bolt, bearing pads are placed between the cross plate and the plate-washer to increase the anchor bolt axial flexibility. Future plans envision the use of uplift resistant details. As shown earlier, pretensioning of the anchor bolts is necessary to improve the fatigue resistance of the connection. The purposes of the pretensioning tests were to determine the magnitude of the force that could be put in the bolts using a typical installation method and the effect that the tightening sequence had on the force.
Magnitude of the Pretension Force
The total pretension force that could be developed at the connection with each type of bearing pad is shown in Figure 3.1. Also shown is the average stress per bolt, based on the tensile stress area. The minimum pretenSion force, 19.2 kips, occurred when the 3/4" neoprene pad was used, which is the softest pad. The magnitude of the pretenSion force increased steadily as the stiffness of the bearing pad type increased. The
!OK) 86.1
ieo ;g. 70 w ~eo f2so ~40 g30 ~20 g 10
SN..G + 112 TI.R'I
SN..G + 1/41\.R11
45.1 37.4
29.2 27.1
16
14 ::::~
12 ~ ~
10 g 8 15 6 a..
~ 4 w
2 ~ O~~~~~~~~~~~~~
~ a. a. @ 0
if @
Figure3-1
32
u. u. !5 ~ a. a. ct: :z
S ~ S ~ f:o 1;; iCi
Total pretension force as function of bearing pad

Table 3- 3 Percent Loss of Pretension Force Due to Pad largest force, 86.1 kips, was Creep developed in the connection
with no pad; it was extremely difficult to turn the nut the re
BEARING PAD % LOSS after 10 minutes
3/4-in. NEO 14.1 5/8-in. NEO 19.0 3/4-in. ROF 13.2 112-in. ROF 8.3 3/4-in. PFP 7.0 112-in. PFP 5.4 NO PAD 1.3
FORCE AFTER LOSS kips 19.2 27.1 29.2 37.4 45.1 54.2 86.1
quired amount, 1/4 turn past snug. The bearing pads creep and as a result the pre. tension force decreases with time. The percent loss of the pretension force after 10 minutes for each configuration is shown in Table 3.3. The loss varied from 19% for the connection with the 5/8 inch neo-prene pads to 5.4% for the connection with the 1/2 inch
pre-formed fabric pad. Long term creep of 70 durometer bearing pads is approximately 45% [8], so a good portion of the pretension force in the anchor bolt will be eliminated over time.
Effect of Tightening Sequence on Pretension Force
The tightening sequence Table 3- 4 Effect of Tightening Sequence on Preten-did not have much effect on the sion Force total pretension force that could be developed in the connection. Table 3.4 shows the total pretension force as a function of the tightening sequence. The same data are shown in Figure 3.2. The scatter was minimal for the softer pads, but increased considerably for the stiffer pads. The tightening sequence S1324, in which both of the bolts on one side of web were tightened first and second, produced less scat-
BEARING PAD
NO PADS 112-in. PFP 3/4-in. PFP 112-in. ROF 3/4-in. ROF 518-in. NEO 3/4-in. NEO
% LOSS after 10 minutes
82.5 52.5 44.6 36.3 30.1 27.3 19.2
FORCE AFTER LOSS kips 91.1 54.9 45.0 37.8 29.1 26.9 19.4
ter than the tightening sequence S1423. In that sequence, the first and second bolts tightened were on opposite sides of the web. The web is in plane with the rocker, which is the center of rotation in the longitudinal direction. As a bolt on one side of the web was tightened, the cap girder rotated towards the tightened bolt. This produced an increase in the force of the bolts on the opposite side of the web and a reduced force in the bolt on the tightened side of the web. The force in each bolt of the group changed as each individual bolt was tightened. The scatter of the bolt forces will be significant only if the cap girder is allowed to rotate. In practice the longitudinal girders and the concrete deck are in place before the final tightening is done, so longitudinal rotation of the cap girder is effectively precluded.
33
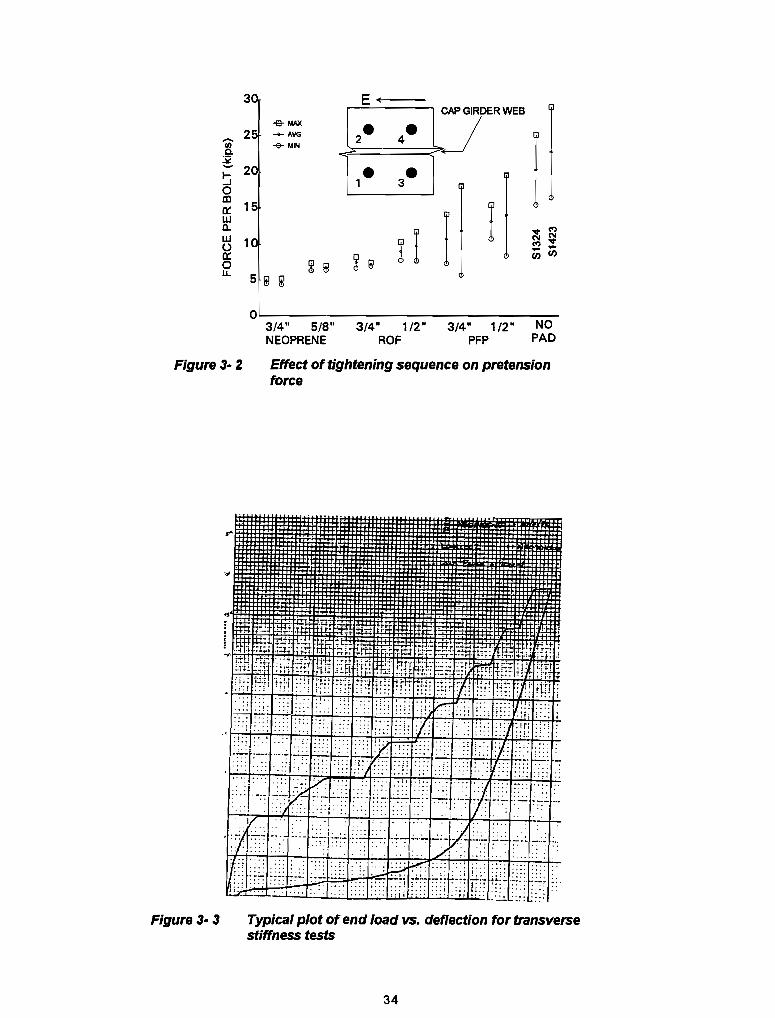
-. '" Co
~ ~ 0 CD a: UJ Q..
UJ 1 li 0 u..
Figure3-Z
Figure 3·3
E t CAP GIRDER WEB
-e- MAX - 4--AVG
I 2 -e- MIN
- -1 3 jl
r I I I ..,..., ('.I ('.I ..,..,. ......
~ 9 rJ)rJ)
~ S 5 ~ ~
0 3/4" 5/S" 3/4" 1/2" 3/4" 1/2" NO NEOPRENE ROF PFP PAD
Effect of tightening sequence on pretension force
Typical plot of end load vs. deflection for transverse stiffness tests
34

3.3 TRANSVERSE STIFFNESS TESTS
A typical plot of the load vs. vertical deflection, as recorded by a pen plotter during a test, is shown in Figure 3.3. The responses of the system have been classified as dynamic and static. The dynamic response was constructed by connecting the pOints on the graph located at the peaks of the non-zero portions of the curve. The static response was constructed by connecting the points on the graph located at the ends of the zero slope portions of the curve. All subsequent data refer to the static response of the system.
3.3.1 Load-Deflection and Moment-Rotation Behavior
The deflection and the rotation were measured as shown in Figure 3.4. The load vs. vertical deflection curves of the seven stiffness tests are shown in Figure 3.5. The stiffness is primarily a function of the axial stiffness of the bearing pad-anchor bolt combination. This is confirmed by the curves, where the steepest slopes are for the pre-formed fabric pads and for no pads and the flattest slope is for the 3/4" neoprene pads. Almost no difference exists between the stiffnesses of the systems with pre-formed fabric pads and the system with no pads, suggesting that the use of pre-formed fabric pads adds no additional flexibility to the system. The responses of these stiff systems are also relatively linear, in contrast to the responses of the systems using the softer pads. In the
e
E-
END LOAD
120"
tests where the randomly-oriented- Figure 3· 4 Location of deflection and rotation fiber pads and the neoprene pads points, transverse stiffness tests were used, the stiffness of the system increased with increasing load. This is due to the hyperelastic behavior of the rubber-like materials; the thickness of the pad reduces considerably as lateral bulging increases, thereby increasing the compressive stiffness of the pad. The transverse moment vs. rotation curves of the
55 5tl 45
seven stiffness tests are shown in i 4tl ;g Figure 3.6. The rotation of the cap Q 35
girder is measured between the two ~ ~ connections and the moment is ifi 20
calculated as the end load multiplied ~~ by the distance to the centerline of the two connections, 120 inches. Initially the moment is increasing with little change in rotation because the cap
5
0.00 0.25 o.so 0.75
VeRTICAL DEFLECTION (inches)
__ NO PADS __ lIrPFP
__ 3/,'PFP __ lIrROF __ 3I4'ROF __ 5I8"'NEO
...... 3I4·NEO
1.00 1.25
girder is still in contact with the Figure 3. 5 End load vs. vertical end deflection bearing and the anchor bolts have not for transverse stiffness tests picked up much additional load. At
35

this range of load the connection is essentially behaving as a rigid moment resisting element, as is assumed in the analysis. The stiffness of the connection reduces when the cap girder is no longer in contact with the bearing and the anchor bolts and bearing pads are resisting the entire uplift force. A photo of the separation at the uplift bearing is shown in Figure 3.7. The rotational stiffnesses of the systems, both before and after uplift, are shown in Table 3.5. The stiffnesses were determined using linear regression for all of the data within each group and the regression lines for the test with the 3/4 inch bearing pads are shown in Figure 3.6.
3.3.2 Distribution of the Bolt Forces and the Pier Reactions
The behavior of a pretensioned connection was described in Section 1.2.1. In
7000
6000
ffi 3000
~2000 1000 Lrr ./-::::-- CASHED LINES ARE REGRESSION CURVES
FOR 314' NEO PADS, UPLIFT AND NO UPLIFT
........ NOPAOS
...... 1I2"PFP
........ 314·PFP --Ir-1I2"ROF --Ir-314' ROF -D-5I8"NE:O __ 314'NE:O
o~~~~--~--~--~--~~--~
0.000 0.001 0.002 0.003 0.004 0.005 0.006 0.007 0.008
ROTATION (radians)
Figure 3- 6 Moment vs. rotation for transverse stiffness tests
comparing the behavior of the tested connections with the idealized connection, it is assumed that the center of rotation of the cap girder is at the center of the two connections and that the resultant bolt force is at the center of each bolt group. If these assumptions are invalid, the behavior Figure 3· 7 SepanitJon at the uplift bearing of a tested connection will deviate somewhat from the behavior predicted by the idealized model. The reaction force at each connection was calculated using Simple statics, as shown in Figure 3.8. The resultant uplift force, in kips, at the east bearing is
A = 3P - 6.25 (3.2)
where P is the end load, defined as positive, and the value 6.25 accounts for the dead load of the cap girder, G, which was 5 kips and was applied at one foot to the left of the uplift connection. The compression force, in kips, at the west bearing is
A = - (2P - 1.25) (3.3)
36

Table 3· 5 Transverse Rotational Sfiffnesses The bolt group force B is the sum of the forces in the four bolts at each connection, is defined as positive in Figure 3.B, and is assumed to act at the centroid of each connection. The pier reaction is the difference between the applied load and the bolt force and is given by
BEARING PAD NO UPLIFT o nlkips/rad)
NO PADS 4,930,000 1/2..jn. PFP 3,900,000 3/4-in. PFP 4,470,000 112..jn. ROF 3,360,000 3/4-in. ROF 2,710,000 5/8-in. NEO 3,960,000 3/4-in. NEO 3,570,000
UPLIFT Qn-kips/rad)
2,850,000 2,440,000 2,310,000 1,610,000 1,300,000
872,000 635,000
R = A - B (3.4)
The bolt group force and pier reaction data are presented in four quadrant graphs in Figures 3.9 to 3.12. Each graph combines the two charts
shown in Figures 1.7 and 1.B. Both of the connections are represented on each graph. The portion of the graph to the right of zero shows the response of the uplift connection (solid data points). The portion of the graph to the left of zero shows the response of the compression connection (open data points). For each connection the bolt group force (B) and pier reaction (R) are plotted against the connection reaction force (A). One graph is shown for each type of bearing pad, with the results from both of the tests using the two different thicknesses. The responses were not significantly affected by the change in thickness.
The response of the stiff systems, the connections in which no pads and the preformed fabric pads were used, correlated qualitatively very well with the response predicted by the idealized model. For the uplift connection, the initial slope of the bolt group force curve was relatively flat. indicative of a pretensioned connection. When uplift occurred, the bolt force matched the reaction force. The system responded equally well with respect to the pier reaction. which went to zero after uplift occurred. For the compression connection. the load at which the pretenSion force became zero coincided with the load at which the pier reaction began to match the compression force. A deviation in the expected and actual behavior is seen in the responses of the soft systems, the connections in which the neoprene pads and the ROF pads were used. This deviation began after uplift occurred
8'
i E __
p
Figure 3· 8 Statics of system
37

w ~ o u.. ~ o OJ
i z .-OC i= -175 -150 -125 -100 -75
~ 0::: 0::: W 0::
25 50 75 100 125 150 175 -50 -75
-100 -125 -150 -175
APPLIED LOAD (kips)
Figure 3-9 Solt group force, pier reaction vs. reaction force, no pads
w ~ o u..
~
PFP
-17 -15 -12 -10 5 050
175 150
APPLIED LOAD (kips)
Figure 3-10 Solt group force, pier reaction vs. reaction force, pre-formed fabric pads
38

w () a:: o u. ~ o OJ
'[ Z~ Q --175 -150 -125 -100 -75 ~
~ w a:: a:: w a::
50 75 100 125 150 175
-75 -100 -125 -150 -175
APPLIED LOAD (kips)
Figure 3·11 Bolt group force, pier reaction VS. reaction force, ROF pads
w U c::: o u. ~ o III ..J
~ g
z o i=
~ c::: c::: w 0::
iii Q,
~ - -175 -150 -125 -100 -75
175 150 125
-100 -125 -150 -175
o 5/8"
APPLIED LOAD (kips)
Figure 3·12 Bolt group force, pier reaction VS. reaction force, neoprene pads
39

and was due to the flexibility of the pads. It is assumed that the bolts of the compression connection can only lose load, i.e., that once the tension force in the bolts reduces to zero they are no longer effective because the applied load is compressive and the bolts do not resist compression. Similarly, it is assumed that the uplift connection resists all of the tension in the system. With a flexible vertical support, however, the point of rotation of the cap girder moves toward the compression connection and as a result, the bolts in the compression connection actually begin picking up tensile force. The bolts of the uplift connection no longer resist all of the tensile force and the bolt force curve drops below the applied load curve. The difference between an ordinate of the applied load curve and the corresponding ordinate of the bolt force curve is equal to the tensile force that is resisted by the compression connection. This is also the difference that appears in the other quadrants of the graph.
110 !is
I so 45
W -40 U I§ 3S ... 30
~ 2S 211
i 15 to 5 0 .' ..s ....
5 -10
_ICLTIJIIE t __ ICLT ..... Z __ ICLT ..... I
_ICLTLllli4 ••••••••• MCIIII'
10 15 211 2S
LOAD (IdpI)
30 3S -40 45
The bolt force values used in the above graphs were the sum of the forces of the four bolts in the connection. Since the bolts in each connection were spaced at a finite distance, the forces in the bolts were not the same. Figure 3.13 shows a typical plot of the change in the bolt line force vs. the load applied at the end of the cap girder for the four lines of bolts. Also shown is the force curve that the bolts would follow if all were concentrated at the center of the connection, as has been assumed
Figure 3·13 Typical plot of bolt line force vs. load
Table 3· 6 Ratio of Force of First Line of Bolts to Second Line of Bolts
BEARING PAD RAllO NO PADS 1.27 1/2-in. PFP 1.27 3/4-in. PFP 1.24 1/2-in. ROF 1.37 3/4-in. ROF 1.34 5/8-in. NEO 1.75 3/4-in. NEO 1.59
previously. The first line of bolts always develops more force than the second line of bolts, and the ratio of these two bolt line forces is shown in Table 3.6. In general, the disparity in the force between the lines of bolts increases with an increase in the flexibility of the bearing pads.
The transverse direction stiffness tests showed that a flexible system does not respond as predicted once uplift has occurred. Once the dead load compressive force is overcome, only the maintenance of the pretenSion force precludes uplift. The magnitude of the pretenSion force that can be induced is small, probably less than the
range within which the uplift force is known. If uplift occurs, only the tensile resistance of anchor bolts prevents failure. Since the loading is cyclic, the anchor bolts are then subject to fatigue. Threaded rods, however, are rated as a category E detail, with an allowable stress of 8 ksi; using four 1.5 inch diameter anchor bolts, the allowable live load uplift force is only TL = 4 (1.41) (8) = 45 kips. Given the uncertainty in knowing the actual uplift load
40

and the results of the pretensioning tests and the transverse stiffness tests, it is recommended that the current detail not be used in situations where uplift can occur.
8 If.. A-
3.4 LONGITUDINAL NORTH SIDE SOUTHSIDE
STIFFNESS TESTS
Moment vs. Rotation Behavior
The moment and rotation are defined as shown in Figure 3.14. The
I
..., mo ,., i I ., 'f, i r
moment vs. rotation curve of each MOMENTSABOUTlHlSUNE
connection is shown in Figure 3.15. As with the transverse direction tests, the Figure 3. 14 Longitudinal rotation of cap girder rotational stiffness is proportional to the stiffness of the bearing pads used in the connection. Similarly, a change is stiffness occurs during each test. Initially, the bolts are pretensioned; as the cap girder rotates counterclockwise, the bolts on the south side of the girder immediately begin picking up load and the bolts on the north side begin losing load. As long as the bolts on both sides of the girder remain in tension they both contribute to the stiffness of the connection. When the bolts on the north side lose all pretension force, they no longer contribute to the stiffness of the connection and the stiffness is cut in half. This is the case for the connection with no pads and the connection with the 3/4" ROF pads, which are shown in Figure 3.16. All of the bolts are in tension at the beginning
700 -+-NOPADS -&-1/2" PFP
600 -+-314"PFP -Is-112" ROF ......
f!!. 500 --.-314"ROF :iii:
I -a--518" NEO
e: 400 c __ 314"NEO
.... z 300 w ~ 0 200 ~
100
0 0.000 0.005 0.010 0.015 0.020 0.025 0.030
ROTATION (radians)
Figure 3· 15 Moment VS. rotation for longitudinal rotation tests
41

SLOPE OF INITIAL PORTION OF CURVE
700
600 -+-NOPADS
....... -.l-314"ROF
~500 32
I
C 400 ~
I-Z 300 w ::t 0200 ::t
100
0 0.000 0.005 0.010 0.015 0.020 0.025 0.030
ROTATION (radians)
Figure 3· 16 Illustration of change In rotational stiffness
of the loading and the connection has a certain stiffness, indicated by the dashed line. At a certain point. the pretension in the bolts on the north side is lost, which means a reduction in the connection stiffness.
Moment Resisted by the Anchor Bolts
The moment resisted by the anchor bolts is
(3.5)
where Fss is the sum of the bolt forces on the south side of the web, Fns is the sum of the
x
.. T
I I
Figure 3·17
d d
d-x J d+x I I I
u... j
I I 11 L I I I
: I I I I I ,,. ,
Fns Fss
Eccentricity of rotation
bolt forces on the north side of the web, and d is the distance from the anchor bolts to the centerline of the connection. It is assumed with this equation that the cap girder rotates about the centerline of the connection. The rocker, however, is not a knife~edge; it is 2.5 inches thick and the cap girder may rotate about any point within this 2.5 inches. Since the rocker thickness is a significant percentage of the moment arm distance, an appreciable difference can exist between the applied moment and the anchor bolt moment calculated from Equation 3.5. If an eccentricity of rotation, x, is defined as shown in Figure 3.17, the anchor bolt moment can be recalculated as
42
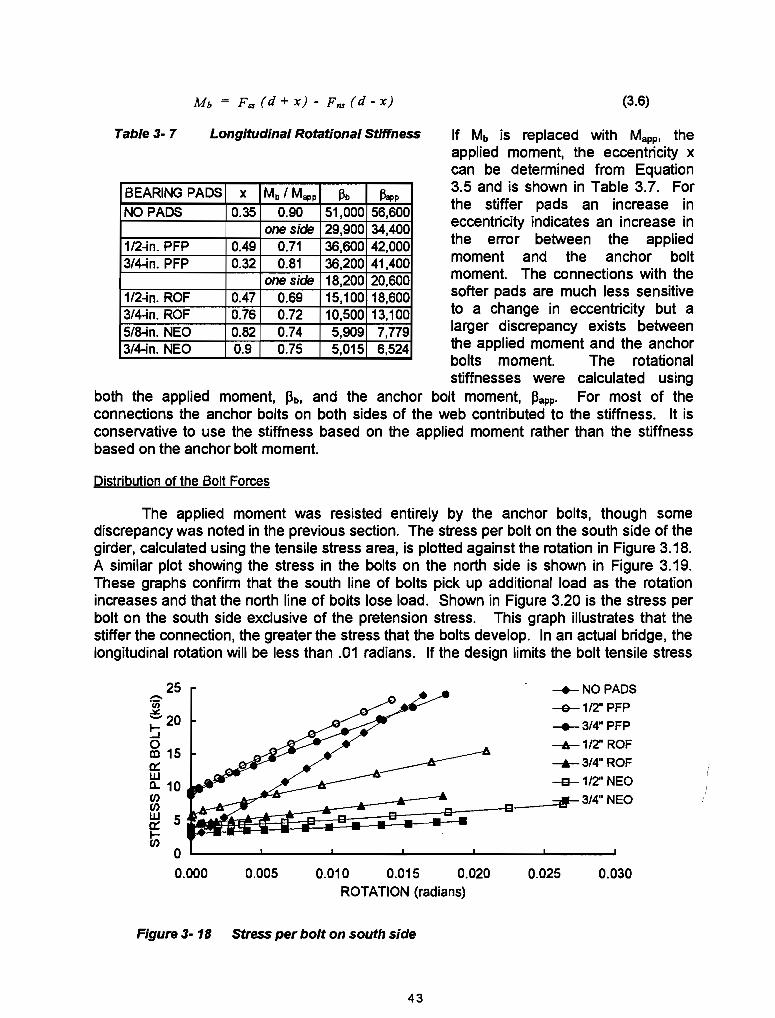
(3.6)
Table 3· 7 Longitudinal Rotational Stiffness If Mb is replaced with Mapp, the
BEARING PADS x Mb I Mapp NO PADS 0.35 0.90
one side 112-in. PFP 0.49 0.71 3/4-in. PFP 0.32 0.81
one side 1/2-in. ROF 0.47 0.69 314-in. ROF 0.76 0.72 5/8-in. NEO 0.82 0.74 3/4-in. NEO 0.9 0.75
f3b 51,000 29,900 36,600 36,200 18,200 15,100 10,500 5,909 5,015
/lapp 56,600 34,400 42,000 41,400 20,600 18,600 13,100 7,779 6,524
applied moment, the eccentricity x can be determined from Equation 3.5 and is shown in Table 3.7. For the stiffer pads an increase in eccentricity indicates an increase in the error between the applied moment and the anchor bolt moment. The connections with the softer pads are much less sensitive to a change in eccentricity but a larger discrepancy exists between the applied moment and the anchor bolts moment. The rotational stiffnesses were calculated using
both the applied moment, J3b, and the anchor bolt moment, ~app. For most of the connections the anchor bolts on both sides of the web contributed to the stiffness. It is conservative to use the stiffness based on the applied moment rather than the stiffness based on the anchor bolt moment.
Distribution of the Bolt Forces
The applied moment was resisted entirely by the anchor bolts, though some discrepancy was noted in the previous section. The stress per bolt on the south side of the girder, calculated using the tensile stress area, is plotted against the rotation in Figure 3.18. A similar plot showing the stress in the bolts on the north side is shown in Figure 3.19. These graphs confirm that the south line of bolts pick up additional load as the rotation increases and that the north line of bolts lose load. Shown in Figure 3.20 is the stress per bolt on the south side exclusive of the pretension stress. This graph illustrates that the stiffer the connection, the greater the stress that the bolts develop. In an actual bridge, the longitudinal rotation will be less than .01 radians. If the design limits the bolt tensile stress
25 -+-NOPADS -e--1/2" PFP
-+-3/4" PFP
-A-112" ROF
--Ir- 3/4" ROF
-a-1/2" NEO
3/4" NEO
o 0.000 0.005 0.010 0.015 0.020 0.025 0.030
ROTATION (radians)
Figure 3· 18 Stress per bolt on south side
43

Figure3-19
25
Figure 3·20
16000
14000
'[12000
110000 I;::>
!z8000 w
~6000 :!!
4000
2000
-.-NOPADS --e-112" PFP -.-314" PFP
-6- 112" ROF
-.-3I4"ROF
-s--112" NEO __ 3I4"NEO
0.005 0.010 0.015 0.020 0.025 0.030
ROTATION (l1ldians)
stress per bolt on north side
-.-NOPADS --e- 112" PFP
-.-314" PFP -6- 112" ROF
-.-314" ROF -s--112" NEO __ 314" NEO
0.025 0.030 ROTATION (l1ldians)
stress per bolt on south side, no pretension
REGION 5 : Anel!« 80ft Yield Flilure
REGION 4 : Uplift, Anel!« Bdts Yielding
REGION 3 : Upiilt, ElIlS1lc Response, 8G11 Une 3 in T En5Ian
REGION 2 : Upiift, EllISIic Response
REGION 1 : NO UpIlIt, Elastic 8Eha11ior
o W-------~--------~--------~------~ 0.000 0.005 0.010
ROTATlON (radians)
0.015 0.020
Figure 3· 21 Moment vs. rotation for ultimate strength test
44

140
120
..... 100
.~ 080 Q
~80 ...J
40
20
O~--~~--~----~----~----~--~
0.0 0.5 1.0 1.5 2.0 2.5 3.0
VERTICAL DEFLECTION (inches)
Figure 3· 22 Load VB. deflection for ultimate strength test
range to 8 ksi in the threaded area, only the connections with no pads and the pre-formed pads approached or exceeded this level.
3.5 TRANSVERSE DIRECTION ULTIMATE STRENGTH TEST
Moment-Rotation Behavior
The moment vs. rotation curve for the ultimate strength test is shown in Figure 3.21. The load vs. deflection curve is shown in Figure 3.22. There are five principal regions of behavior and the characteristics of each of these regions is described in Table 3.8. The regions are delineated on the graphs.
Load Distribution in Anchor Bolts
The distribution of the bolt forces and the pier reaction is shown in Figure 3.23. The regions of the behavior listed above are shown on the graph. The pretension forces were 88 kips for the compression connection and 78 kips for the uplift connection. The shapes of the curves and the deviation from the expected behavior are conSistent with the stiffness tests (Section 3.3.2) detailed earlier. The major deviation is due to the transfer of tensile load from the anchor bolts of the uplift connection, bolt lines one and two, to the first line of anchor bolts of the compression connection, bolt line 3. An additional deviation in the behavior occurred when the bolts of the uplift connection reached the yield level; there was no increase in bolt force with an increase in applied load near the end of the test. The deviation is also the cause of the upward spike in the bolt force and pier reaction at the compression bearing. The increase in bolt force is due to the transfer of tensile load to the third line of the bolts.
Stress Distribution in Compression Bearing
The rocker element of the compression bearing was instrumented with seven strain gages along its length to determine the stress distribution. The normalized stress
45

distribution at the seven locations is plotted for eight different load levels in Figure 3.24. The stress values were nonnalized to the average stress in the bearing, calculated as the applied compression force divided by the area of the rocker. At the load levels corresponding to regions 1 and 2 of the behavior the pattern of the stress distribution is similar. The reaction load is concentrated in the first third and last third of the rocker, with little load in the center third. The stresses decrease with increasing load in the first third and increase with increasing load in the last third. At load levels corresponding to regions three through five, the stress redistributes to the right third of the bearing.
Table3·8 Description of Ultimate Strength Test
REGION P REACll0N FORCE DESCRlPll0N UPLIFT COMPR
1 0-45 0-129 0-89 No uplift, elastic response 2 I 45-a0 129-234 89-159 Uplift, elastic response
Uplift, elastic response. third line 3 80-100 234-294 159-199 of bolts picking up tension
Uplift. anchor bolts of uplift 4 100-120 294-354 199-239 connection yielding, third line
of bolts picking up tension Uplift, anchor bolts of uplift connection completely yielded.
5 120-128 354-378 239-255 third line of bolts picking up tension. increase in defonnation with very small increase in load
46

COMPRESSION BEARING 400
350
300 250
5 4 3 2 1 200
150
-200
-250
-300 -350
-400 A == -(2P - 1.25) (kips)
.... z Q C) w 0:
UPLIFT BEARING
N Z o ffi 0:
A = 3P - 6.25 (kips)
Figure 3· 23 Bolt group force, pier reaction vs. applied load for ultimate strength test
50
45
40
~ 35
::.. 30 (/) (/) 25 w IX: 20 l-(/)
15
10
5
0 0
LOAD -e-Okips
-+-20~
-.r-40~
-e--60~
-+-80~
-+-100~ ___ 120~
--'-128~
2 4
0" 8" 16" 24" COMPRESSION BEARING
6 8 10 12 14 16 18 20 22 24
DISTANCE ALONG ROCKER PIN (inches)
Figure 3· 24 Stress distribution along rocker pin
47

48

CHAPTER 4
PHASE I ANALYSIS AND DISCUSSION
4.1 ESTIMATION OF PRETENSION FORCE
The pretension force in a bolt can be determined as
(4.1)
where .6.b is the bolt extension and ki is the axial stiffness of an element located between the nut and anchorage of the bolt. When the turn-of-the-nut method is used to tighten a bolt, the bolt extension is equal to the number of turns of the nut divided by the pitch of the threads. The pitch is the number of threads per inch. The connection studied in this research can be divided into five elements as shown in Figure 4.1; these element are
• Anchor bolt kb
• Bearing Pad kp
• Cap Girder Web, Cross Plate, and Stiffeners kgird
• Bearing Hardware kh
• Concrete Pier Cap krone
where kgird and krone are shaded. Substituting the element stiffnesses into Equation 4.1 gives
number oj turns / pitch Eo = ---"1--""'1-~""'1--!.-1:----:-1- (4.2)
-+-+ +-+ n kb n kp kgird kh k conc
where n is the number of bolts in the connection. For elements in parallel, such as the anchor bolts and the bearing pads, the total stiffness is equal to the sum of the stiffnesses. For elements in series, such as those described above, the total stiffness is equal to the inverse of the sum of the inverse of the individual stiffnesses. In the latter case, the stiffness is always less than the smallest stiffness of any element. Only those elements that have a stiffness similar to the element with the smallest stiffness will have a signi'ficant effect on the total stiffness. The following sections will give methods for estimating the stiffnesses of the individual elements.
49

ANCHOR BOLTS--+-.....
i CAPGIROER CROSS-PLATE, STIFFENERS
-l-~: ~~ BEARING HAROWA~R~E_~~~~i_....,
1 CONCRETE
~
Figure4-1 Elements of connection
4.1.1 Anchor Bolt Stiffness
The anchor bolt stiffness is calculated as
(4.3)
where Ab is the area of the shank of the bolt, E is the modulus of elasticity for steel, 29,000 ksi, and Lb is the length of the anchor bolt. The threaded portions of the bolt, which have a smaller area than the shank, typically comprise only a few percent of the total length of the bolt and will be ignored in the calculation. The major difficulty in using this equation is selecting a proper length for the anchor bolt. The length of the anchor bolt from the top of the pier cap to the nut is free to deform, but from the top of the pier cap to the anchorage pOint, it is embedded in concrete. Along this length, the anchor bolt is bonded to the concrete. If no slip occurs at the anchorage the anchor bolt length is a minimum if it is assumed to be fixed at the top of the pier cap and is a maximum if it is assumed to be
unbonded in the embedment length. If the bond stress is uniformly distributed along the length of the bolt, the stiffness of the embedded length of the anchor bolt is the same as the stiffness of a free anchor bolt with a length one-half of the embedment depth [20]. The length of the anchor bolt for stiffness calculations can be approximated as the free length plus one-half of the embedment depth. Using the properties of the connection being studied, the axial stiffness of the anchor bolt is bounded by the following values:
• 4,min = 56 in : Ab= 1.77 in2 : E = 29,000 ksi ~,min = 1.77(29000) 156 = 917 k I in
• Lb,max = 85 in : (56"+ embedment depth (29"» : ~,max = 1.77(29000) 185 = 604 k I in
• Lb,eff = 71 in : (56" + 0.5 (29)} ~. avg = 1.77(29000) 171 = 723 k I in
4. 1.2 Bearing Pad Stiffness
The compressive load vs. deflection curves of the bearing pads used in this research are shown in Figure 4.2. The response of the preformed fabric pads and the ROF pads were relatively linear while the response of the neoprene pads were nonlinear, increasing in stiffness as the load increased. Also shown is the linear regression estimate of the stiffness, the values of which are shown in Table 4.1. The table also gives an estimate of the compressive modulus of elasticity for each pad and the ratio of the modulus of elasticity of steel to the modulus of elasticity of the pad. The stiffness of a bearing pad will be a function of the material and the shape factor. The shape factor is defined as the ratio of the pad area compressed to the pad area free to bulge laterally. The stress-strain relation-
50

50 112" PFP
1/Z'ROF
40
30
~ ::i2 - 20 0
C!i ..oJ
10
0 00 0.1 0.2 0.3 0.4 0.5
·10 DEFLECTION (inches)
Figure 4- 2 Load VS. Deflection curves for bearing pads
Table 4·1 Compressive Stiffness Bearing Pads
BEARING PAD kp SF Ep Exl Ep 1/2-in. PFP 932 2.44 18.2 1596 3/4-in. PFP 1786 1.63 23 1262 112-in. ROF 230 2.44 4.5 6468 3/4-in. ROF 161 1.63 4.7 6160 5/8-in. NEO 80 1.95 1.9 14877 314-in. NEO 57 1.63 1.7 17400
of ship of the various types of pads can be provided by the manufacturer. The stiffness can be found by using Equation 4.3, substituting the pad thickness for length. The modulus of elasticity of neoprene bearing pads can be estimated as [2, p.295,630]
Ep = 3G (1 + 2 (C) SF2) (4.4)
where G is the shear modulus in psi, C is a constant that is a function of the durometer of the pad, and SF is the shape factor of the bearing pad. The- values of G and C for three durometer hardnesses are shown in
Table 4.2. Interpolation may be used for values not listed. Using Equation 4.4, the calculated modulus of elasticity for the neoprene pads cited in Table 4.1 are 1.92 ksi for the 5/8" pad and 1.88 ksi for the 3/4" pad. These values compare very well with the measured values of 1.9 ksi (5/8") and 1.7 ksi (3/4").
Table 4· 2 Values for G and C, Neoprene Pads
HARDNESS 50 60 70 G, psi 90 -100 120 150 -160
C 0.75 0.6 0.55
51

4. 1.3 Cap Girder Web, Cross Plate and Stiffeners
The axial stiffness of this area can be estimated as [2, p. 295, 630]
kgird [ S ]_1
h st + Sst
E (Ast + Aweb) n 192 EI cp (4.5)
where hst is the height of stiffeners, Ast is the area of stiffeners, Aweb is the area of web, Sst is the spacing of stiffeners, and Icp is the moment of inertia of the cross plate. The first term is the axial stiffness of the stiffeners and the cap girder web and the second term is the flexural stiffness of the cross plate with respect to the load and deflection at midspan of the plate, which is assumed to be fixed at the ends. The effective area of the web may be estimated by multiplying its thickness by a width that is the average of the bearing width and the out-to-out width of the edge stiffeners. Using the properties of the connection being studied, the stiffness of the cap girder section can be estimated as follows:
• hst = 36 in : Ast = 6(7){0.75) = 31.5 in2
• n = 4 : Sst = 8 in
: Aweb = 0.5625(24+ 16)/2 = 11.25 in2
: lop = (1/12)(7)(2)3 = 4.67 in4
[ 1 1 J-1
k gird = -- + = 29446 k I inch 34438 203145
4.1.4 Bearing Hardware Stiffness
The stiffness of the bearing hardware may be estimate as
(4.6)
where tp is the thickness of the rocker pin, b is the transverse width of the bearing, and hh is the height of bearing hardware. Using the properties of the connection being studied, the bearing hardware stiffness can be estimated as follows:
• tp = 2.5 in : b = 24 in : hh = 12.25 in : ~ = 2.5(24)(29000) 112.25 = 142.000 k 1 in
The measured stiffness of the bearing hardware was determined by dividing the pretension force in the bolts by the average of the deflections on the bottom of the cap girder, which measured the bottom flange deflection with respect to the top of the concrete pier cap. The average value for the stiffness was 4000 kips 1 inch, which is only 3% of the stiffness calculated above. The small value is most likely the result of settlement between the rocker pin and the sole plate. No dead load was present for the tests, so the rocker and sole plate were not in complete contact at all locations. Any initial settlement in the field will be eliminated by the superstructure dead load; a connection with a settlement stiffness of 4000 kips 1 inch requires only 40 kips of load to eliminate a gap of 0.01 inches.
52

4.1.5 Concrete Pier Cap Stiffness
This represents the mass of concrete between the top of the pier and the anchorage of the bolts. The axial stiffness of this element may be estimated as
k conc (Abear + Aanch) Ec
2 Ld (4.7)
where Abear is the area of the bottom bearing plate, Aanch is the area encompassed by the anchor bolts, Ec is the modulus of elasticity of concrete, and ~ is the embedment depth of anchor bolts. Using properties of the connection being studied, the axial concrete stiffness can be estimated as follows:
• Abear = 576 in2 : Aanch = 64 in2
: Ec = 3420 ksi : he = 29 in
• kconc = (576+64) 34201 (2(29» = 37738 k 1 in
4.1.6 Comparison of Calculated and Experimental Pretension Forces
A comparison of the Table 4- 3 Comparison of Calculated and Experimen-calculated and experimentally tal Pretension Force measured pretension forces is shown in Table 4.3. The stiffness of the anchor bolt was based on the free length plus one-half of the embedded length. In all cases, the calculated pretension force is smaller than the actual pretension force. The percent difference varied from 2% to 59%. The difference is due mainly to the pretension
BEARING PAD
NO PADS 1/2-in PFP 3/4-in. PFP 1/2-in. ROF 3/4-in. ROF SIS-in. NEO 3/4-in. NEO
Bo, calc Bo, exp (kips) (kips)
58.S 86.1 45.6 54.2 44.3 45.1 23.5 37.4
19 29.2 21.9 27.1 16.2 19.2
Bo, exp / Bo. calc
1.47 1.19 1.02 1.59 1.53 1.24 1.18
force developed during the snugging process. The calculated values are based on the force produced by the number of turns after the snugging procedl;Jre and so do not include this initial pretensioning. As a result, the calculated force will be less than the actual force, assuming the stiffnesses were correctly derived. The elements with the smallest stiffnesses will have the largest impact on the magnitude of the pretension force. In this case these elements are the anchor bolts and the bearing pads. If the stiffness contributions of the other elements are ignored, the stiffness of the connection will be slightly overestimated, which will result in a larger calculated pretension force. For example, the pretension force of the connection with the 1/2" ROF pads was 23.5 kips when the stiffness of all of the elements was considered. If only the stiffness of the anchor bolts and the bearing pads are considered, the pretension force is 29 kips, a 23% increase. For calculating the pretension force, it is conservative to use only the anchor bolt and bearing pad stiffnesses and the anchor bolt length should be the free length plus one-half of the embedded length. The pretension force will be used to determine the area of the bearing pad. The procedure is given in Chapter 10.
53

4.2 LONGITUDINAL ROTATION BEHAVIOR
The longitudinal rotation of the stringers at the pier location is restrained by the anchor bolts and the pier column. The restraining mechanism of each element will be demonstrated in the following sections. The forces and moments developed in the restraining elements are a function of the rotational stiffnesses of the elements and will be proportional to the applied rotation.
4.2.1 Determination of the Longitudinal Rotation
The longitudinal rotation at a support is not a quantity that is normally determined in the design of a steel bridge. The rotation, however, produces forces in the anchor bolts and a horizontal force on the rocker. The only displacements that are typically determined are the dead load deflections and the maximum live load deflection. The maximum rotation at a support occurs under pattern live loading. By linking the rotation to the maximum live load deflection, a Simple method is developed for calculating the maximum longitudinal rotation.
EI ip Consider the three span continuous
ttT!T!~!TTT:~W beam shown in Figure 4.3. The ratio of the
_'!::!::::!::::!:::...:::~::!::::!::!_ span lengths are 1.0 - 1.2 - 1.0, the span t L )l( 1.2L )IE L li ratios recommended for the design of the aiE---=---;bllolE----:..:;C==---'lIkd--=-----!oj~ bridge systems studied in this research.
The stiffness of the girder, EI, is constant. Figure 4. 3 Loading to produce maximum The center span is loaded with a uniform
rotation at interior supports live load, w, and a point live load, P. This will produce the maximum live load deflection in the center span, point c, and
will also produce the maximum rotations at supports band d. The deflection of pOint c is
., P " t:.c = 0.01312 w L + 0.01864-L-El El
and the rotation at point b (or d) is
= 0.02572 w L3 + 0.03145 P L2 Ob El El
Dividing Equation 4.9 by Equation 4.8 gives
_ t:.c [0.02572 wL + 0.03145 P] Ob - T 0.01312wL + 0.01864P
(4.8)
(4.9)
(4.10)
If P = 0, Equation 4.10 reduces toob = J. 96 l!.c. If wL = a, Ob = J. 69 l!.c. For long spans, L L
lane loading governs the design; the uniform load component of a lane load, 0.64L, is much larger than the point load component, 18 kips, so the equation in which P=O can be conservatively used. For short spans, truck loading governs; there is no uniform load component of a truck load, so the equation in which wL=O can be used. The maximum live
54

load deflection is limited to Ls I 800 where Ls is the length of the span. If Ls = ~1.2L the maximum live load rotations at the interior supports are
Omax = 0.003 radians for lane loading
Omax = 0.0025 radians for truck loading (4.11)
Although the equations derived above apply only to the bridge system shown in Figure 4.3, the values should be reasonable estimates for bridge systems with different, but similar, span ratios; for bridges with non-constant section properties; and for bridge systems where the maximum interior support rotations are produced by loading the end spans. The largest rotation would occur for cases in which the end spans are very long in relation to the center span, the limiting case being the center span simply supported at the ends. In this case, the maximum end rotations are 0.004 radians for uniform loading and 0.00375 radians for point loading.
4.2.2 Rotational Stiffness of Elements
Anchor Bolt System
The anchor bolt system can be modelled as shown in Figure 4.4. The cap girder and stiffeners are treated as a rigid body. The anchor bolts and the bearing pads, the flexible elements in the system, are replaced with springs of axial stiffness ks. Applying a moment M to the rigid body. a rotation e occurs and the springs deflect a distance 11. The spring on the left contracts Figure 4- 4 Model of anchor bolt system and the spring on the left extends. If both of the bolts are pretensioned to a force Fo, a change in force will occur
FL = Fo - ks A
FR = Fo + ks A
where the moment is
M d( FR - FL)
= d ( Fo + ks A - Fo + ks A)
= d (2 ks A)
and A Od. Substitution into Equation 4.13 gives the rotational stiffness as
55
(4.12)
(4.13)
(4.14)

For multiple bolts on each side of the web of the cap girder, the equation is multiplied by the number of bolts on each side. If the bolts on one side lose all pretension force, only one side of bolts is effective and the equation is divided by two.
The term ks is the stiffness of the anchor bolt and the bearing pad and is
(4.15)
Substituting Equation 4.15 into Equation 4.14 gives the rotational stiffness of the anchor bolt system as
ns d2 [ ~ + ~ Jl for one side o/bo/ts effective kb kp
P2b = 2 ns d2 [ ~ + ~ ],1 for both sides o/bo/ts effective kb k p
(4.16)
Table4·4 Ratios of Calculated to Experimental Anchor Bolt Rotational Stiffnesses
BEARING PAD I3cac I l3exp It,= 56 in. It,= 85 in.
NO PADS 2.07 1.36 1/2-in PFP 1.41 1.12 3/4..jn. PFP 1.31 1.06 1/2..jn. ROF 1.27 1.15 314-in. ROF 1.34 1.25 5/S-in. NEO 1.21 1.16 314-in. NEO 1.05 1.02
where ns is the number of bolts on one side of the web. The ratios of the calculated rotational stiffnesses to the experimental rotational stiffnesses are shown in Table 4.4. This table applies to the situation in which the anchor bolts on both sides of the web are effective. The experimental rotational stiffnesses are taken from Table 3.5 and the calculated stiffnesses are derived using the bearing pad stiffnesses given in Table 4.1. The large difference of the stiffer systems is due to the uncertainty in the anchor bolt stiffness. In these .systems, the bearing pad stiffness is comparable to the anchor bolt stiffness, so the rotational stiffness is sensitive to the anchor bolt stiffness. The difference is smaller with
the softer systems because the bearing pad stiffness is much less than the anchor bolt stiffness and therefore the total stiffness is not as sensitive to the anchor bolt stiffness.
56

Pier Column
The pier column restrains the longitudinal rotation of the cap girder by reacting against the horizontal displacement at the bearing. The rotational stiffness of the pier column with respect to the cap girder can be derived with a method similar to that used in section 4.2.1. The cap girder is treated as a rigid body, as shown in Figure 4.5. The flexural stiffness of the pier column is represented by a spring with stiffness kpf. A moment is applied to the center of rotation of the system, which acts at a distance y above the spring. The moment produces a rotation a and a deflection 8 in the spring. The force in the spring is
Hpf = kpf A
and moment is
M'" HpfY
... kpf Ay
(4.17)
(4.18)
where A e y. The rotational stiffness is
Figure 4- 5 Model of pier used to determine rotational stiffness
(4.19)
The flexural stiffness of the pier column, first given in Appendix A is restated as
3 (El).: k - ---=-.....:....'::..----".
pf - (Lc + Lcb / (4.20)
where (El)c is a stiffness property of the pier column, Lc is the length of the pier column, and Lcb is an additional length added to the actual length to account for the flexibility of the pier column foundation.
4.2.3 Forces Developed in the Elements
Anchor Bolts
The moment resisted by the anchor bolts is proportional to the rotational stiffness of the anchor bolt system. The force in the anchor bolts on each side of the web is a function of moment and is given as
57

M Fa ---
2d n .. M
Fa+--2d n ..
where the moment is equal to PbS, giving
(4.21)
(4.22)
The change in force in the bolt is represented by the second term in Equation 4.22. To get the tensile stress range of the bolt it is necessary to divide by the area of the bolt. The tensile stress range of a bolt is
(4.23)
where AI is the tensile stress area of the bolt. In determining the stress range for the anchor bolts, the rotation should be doubled. As a load moves along the length of the bridge the cap girder rotates; if the load is in the span to the left of support b in Figure 4.3 the cap girder at support b rotates counterclockwise. This will reduce the tension in the bolts on the Jeft side of the cap girder web and will increase the tension in the bolts on the right side of the web; both sets of bolts experience a change in tensile stress. When the load moves into the second span the cap girder will rotate clockwise and the tension in the bolts on the left side of the web will increase while the tension in the bolts on the right side of the web will decrease. Assuming that the maximum rotation produced by load in the end span is the same as the maximum rotation produced by the load in the center span, the tensile stress range in the bolts will be twice that produced by the load moving through the center span alone.
Determination of the tensile stress range in a bolt is illustrated by a short example. The properties of the connection designed in Appendix A will be used, with the exception that a neoprene bearing pad will be used instead of a preformed fabric pad. The parameters of the connection are listed below:
• Maximum Rotation Range S: use 2(.003) = 0.006 radians
• N umber of bolts on each side of web ns = 4
• Diameter of anchor bolt = 1.5 inches (AI = 1.41 in2)
• Distance from anchor bolt to web centerline d = 7 inches
• Neoprene Pad Properties: 70 Durometer : 6.5" X 6.5" X 1" : A = 40 in2 : SF =
1.53 using Equation 4.4, Ep = 1.61 ksi : kp = 40(1.61) 11 = 64.4 kips 1 in
The rotational stiffness of the anchor bolt system is determined using Equation 4.16 and it will be assumed that the bolts on both sides of the web are effective. The stiffness of the
58

anchor bolt will not be considered, which will produce a conservative estimate of the rotational stiffness. The rotational stiffness of the anchor bolt system is determined as f3b = 2 ns d2 kp = 2(4)(72)64.4 = 25245 in-kips I radian. The stress range in each bolt is
25245 (0.006) Sb = 2 (4) (7) 1.41
1.92 ksi
which is much less than the allowable tensile stress range for anchor bolts of 8 ksi. As long as a neoprene bearing pad is used in combination with the anchor bolt, fatigue of the anchor bolts due to longitudinal rotation is not a concern.
Bearing and Pier Column
The horizontal force applied to the bearing and pier column due to the longitudinal rotation is
(4.24)
which, when substituting in Equation 4.19, gives
Hr (4.25)
In the negative moment region over the pier supports, no shear studs are used so the concrete deck slab is not composite with the longitudinal stringers. The center of rotation can be assumed coincident with the neutral axis of the longitudinal stringers, so y will be the distance from the center of the stringer to the bottom of the cap girder.
The force produced by the change in temperature of the superstructure for a three span bridge with expansion bearings at the abutments and identical fixed bearings and pier columns at the two interior supports is
Ht _ _ 3--,-(._El....:.)..!:..C _
At 2 ( La + Leb)
(4.26)
where .6c = a L aT; a is the coefficient of thermal expansion, which for steel is 6.5E-6 1°F; L is the length of the center span; and aT is the change in temperature, which for steel structures TxDOT uses 50° F.
If Equation 4.26 is divided by Equation 4.25, the ratio of the horizontal force due to temperature change to the horizontal force due to rotation can be determined. This ratio can establish whether the horizontal force due to rotation is a quantity that needs to be considered in design.
Carrying out the division gives
(4.27)
59

where ~ = a. L aT = 6.5e-5(50)L = O. 000325 L, e = 0.003 radians, and y can be estimated as d I 2 where d is the depth of the longitudinal stringer. This depth can be related to L through the span-to-depth ratio limitations recommended by AASHTO (10.5.2), which are L I d = 25 for the depth of the stringer including the thickness of the slab and LId = 30 for the depth of the stringer alone. Using the more conservative limitation of LId = 25, y = L I 50. Substituting these values into Equation 4.27 gives Ht I Hr = 5.41, which states that the horizontal force due to the temperature change is typically over five times greater than the horizontal force produced by the longitudinal rotation. The horizontal force is necessary to check the shear and bending stresses at the base of the pin where it is welded to the top bearing plate. For the primary stress check the temperature-induced force controls; for a pin with a 50 ksi yield stress the maximum bending stress is 27.5 ksi. For the fatigue check the horizontal force produced by the longitudinal rotation must be checked; given its relationship to the temperature-induced force the maximum tensile stress range in the pin would be 27.5 I 5.41 = 5 ksi. The axial stress in the pin due to the dead load will almost certainly be greater than 5 ksi. This compressive stress will eliminate the tensile stress range, so fatigue will not be a concern. Therefore, for typical situations the horizontal force produced by the longitudinal rotation does not have to be considered in the deSign.
4.2.4 Effect of Removal of Upper Stiffener
The upper stiffener, shown in Figure 4.6, presents fabrication problems because of the tight fit-up required. The author witnessed the fabrication of the cap girder used in the tests and significant delays resulted from the inability of the fabricator to fit the stiffener, which was cut too long and required repeated grinding and refitting. The upper stiffener is not necessary as a bearing support since no concentrated loads are applied to the top flange of the cap girder. It restricts access to the anchor bolt nuts and so its removal would ease the installation process. Its removal, however, introduces a Figure 4- 6 potential problem resulting from the out-of-plane rotation of the cap girder web. The
STIFFENERS
Stiffener termination pOint
longitudinal rotation of the cap girder is resisted by the anchor bolt system; with the upper stiffener in place, the web near the stiffeners is stiffened along its entire length. If the upper stiffener is removed, a sharp change in stiffness occurs at the termination of the stiffener, as shown in Figure 4.6. If the cap girder is not restrained from rotating by any anchor bolts, the web and the stiffeners rotate as a rigid body and no stress will be produced at the stiffener termination point. If anchor bolts are present and resist the cap girder rotation, however, a stress riser will develop at this location due to the sharp change in the stiffness and geometry. The area around the stiffener termination pOint become susceptible to distortion-induced fatigue cracking. To determine if the stresses produced in this area are high enough to produce a fatigue concern, finite element analyses using the ANSYS program were conducted on the section of the cap girder web near the connection.
60

Finite Element Model
MODEu.eo AREA
NICHOR I!OI.TS
hoi
The area modelled is shown in Figure 4.7. Symmetry was used to reduce the size of the problem. The objective of the study was to determine the maximum web tensile stress that would be produced as a function of four variables. The variables were the stiffener height, the anchor bolt stiffness, the spacing of the longitudinal stringer, and the web thickness. The load was an applied rotation at the stringer of 0.003 radians, the maximum probable rotation as determined in the previous section. The parameters of the analyses are listed below:
Figure 4- 7 Web area modelled
• Web Thickness, fw
• Web Depth, hw
• Stringer Spacing, S
• Stiffener Height, hSI
• Stiffener Thickness, lsi
• Anchor Bolt Stiff, kb
• Bearing Width, bw
: 0.5 inch, 1 inch, 1.5 inch
: 6 feet
: 2 feet, 4 feet, 6 feet
: 2 feet, 4 feet
: 1 inch
: 100, sao, 1000,2000,4000,8000,00 kips I in
: 36 inches
All of the values are typical of those used in actual designs and the maximum and minimum values for the web thickness and stringer spacing are bounds between which all designs will fall. The finite element mesh is shown in Figure 4.8. A three inch by three inch grid was used. The web and stiffeners are composed of 4-node shell elements with six degrees of freedom at each node. Beam elements were used to model the top and bottom flanges of the cap girder. The anchor bolts were modelled as orie-dimensional springs in the V-direction. The cap girder was restrained in the Y and Z direction along 18 inches on the bottom flange; this simulated the bearing connection. Though the bearing actually displaces horizontally, the horizontal fixity would represent the worst case. The rotation was applied at mid-depth of the web along the stringer boundary line. An area of nodes representing the leg of the clip angle connection was rigidly coupled to the rotated node.
Results
The stringer spaCing and the web thickness were varied for the first set of analyses. The stiffener height was held constant at 24 inches and the cross-plate was fixed in the vertical direction at the anchor bolt location. This fixity simulated an infinitely stiff anchor bolt, which is an upper bound on the rotational stiffness of the connection. A typical contour plot of the principal tensile stress is shown in Figure 4.9. As expected, the area of maximum stress surrounds the stiffener termination pOint. The plotted stresses are interpolated from the node stresses. Since the mesh is very coarse in the area around the
61

~ ~~V/. ~ ~v /. ~ V
::.--
Figure 4· 8 Finite element mesh
stiffener termination point, the maximum stress occurs at the node three inches above, rather than the point itself. The ANSYS program calculates an estimated maximum bound for the stress based on the error due to the mesh discretization. This stress is shown as SMXB in the contour bar. In most cases, this bound was two to three times the maximum plotted stress. A plot of the maximum plotted principal tensile stress vs. the stringer spacing is shown in Figure 4.10. The curves, one for each web thickness, show that the stress increases as the spacing is reduced and that the stress increases with an increase in the web thickness. The purpose of this first set of analyses was to determine the combination of the stringer spacing and web thickness that produced the largest stresses. This occurred with the stringer spaCing of 2 feet and the web thickness of 1.5 inches.
The anchor bolt stiffness was varied for the second set of analyses. The stiffener height was held constant at 24 inches, the stringer spacing was set at 2 feet, 4 feet, and 6 feet. the web thickness was held constant at 1.5 inches. and the anchor bolt stiffness was varied from 100 kips per inch to 8000 kips per inch. Figure 4.11 shows the maximum plotted principle stress vs. the anchor bolt stiffness. Up to a stiffness of 2000 kips per inch the stress was not affected too much by the change in stringer spacing. For anchor bolt stiffnesses greater than 2000 kips per inch the maximum stress increased as the stringer spacing decreased. The anchor bolt stiffness. given in kips per inch. does not have much meaning. The minimum anchor bolt diameter allowed by the AASHTO code (10.29.6.2) is 1.5 inches for span lengths greater than 150 feet. If the length of the bolt is assumed to be four feet (the stiffener height plus two feet to the top of the pier cap) the stiffness of the
62

Flgure4-9
20
! III III W a: ti 14 W .... iii 12 :z I:!! 10 .... ~ 8 0 :z a: 6 a. ::E 4 ~ X 2
i 0
2
AN9YS 5.0 JUL 28 .1994 .16: 29: .12 PLOT NO. .1 NODAL SOLUT:ION STEP=.1 SUS =.1 T:IME=.1 9.1 (AVe:.; ) TOP DMX = . .1 77228 SMN =-.055697 SMNE3=-3.797 SMX =6.089 9MXE3=11.777
-.055697 .627038 .1.3.1 .1 .993 2.675 3.358 4 .04.1 4.723 5.406 6.089
Typical plot of principal tensile stress
-e-tw = 0.5"
-.-tw 1.0'
-e-Iw - 1.5"
4
WEB DEPTH = 6'
STIFFENER HEIGHT = 24"
ROTATION = 0.003 radians
DJSf ANCE FROM SfRJNGER TO Cl OF CONNECTlON (feel)
6
Figure 4- 10 Principal tensile stress vs. stringer spacing
63

! 20
18 \\EB DEPTH. 8' ~ w 16 \\EB THICKNESS = 1.S" ROTAl1ON '"' 0.003 radlana 0::
to 14
STIFFENER HEIGHT. 24'" ~ u;
12 z -0-8-2' w I- -.-8-.,
i 10 ......-&.6"
0 8
~ IS :IE i 4
~ 2
0 0 1000 2000 3ODO 4000 5000 6000 7000 8000
ANCHOR BOLT STIFFNESS (k lin)
Figure 4- 11 Principal tensile stress vs. anchor bolt stiffness
anchor bolt is kt, = AE 1 L = (1.77)29,000/48 = 1069 kips per inch. The anchor bolt will be used in conjunction with a neoprene bearing pad. Using the 3/4 inch neoprene pad stiffness given in Table 4.1, 57 kips per inch, the stiffness of the anchor bolt-bearing pad system is 54 kips per inch. At this value of stiffness, the stress is insignificant. If the anchor bolt was used without the bearing pad, the stress would be approximately 6 ksi for a two foot stringer spacing. This stress, however, may be two to three times less than the actual maximum stress because of the coarse mesh.
The third set of analyses was conducted to determine the effect of the stiffener height on the maximum stress and to calculate the actual stresses using a refined mesh. For this set of analyses, the stringer spacing was held constant at two feet, the spacing producing the largest stresses; the web thickness was held constant at 1 inch, a typical value; the anchor bolt stiffness was set at 100 kips per inch and 1000 kips per inch, realistic values; and the stiffener height was set at 2 feet and 4 feet. . The maximum stress bound vs. the stiffener height is shown in Figure 4.12. The maximum stress decreased with an increase in the stiffener height for both anchor bolt stiffnesses, though the change was more pronounced for the larger bolt stiffness. The maximum stress bound is an estimate by the program taking into account the error inherent in a coarse mesh. To check the accuracy of the program estimate, the mesh around the stiffener termination point was refined using a process called submodelling and the section was reanalyzed.
The area of mesh refinement is shown in Figure 4.13. In the submodelling process, the larger structure is analyzed using a coarse mesh and the results are saved. The smaller section, in which a more accurate analysis is needed, is remodelled using a finer mesh. The smaller section is oriented using the coordinates of the same area in the larger structure. To the edges of the submodel, called the cut boundaries, are applied the boundary conditions from the coarse mesh results. These boundary conditions are simply the displacements and rotations of the nodes in the coarse mesh that lie on the cut boundaries of the submodel. If the nodes of the coarse mesh do not coincide with the
64
•
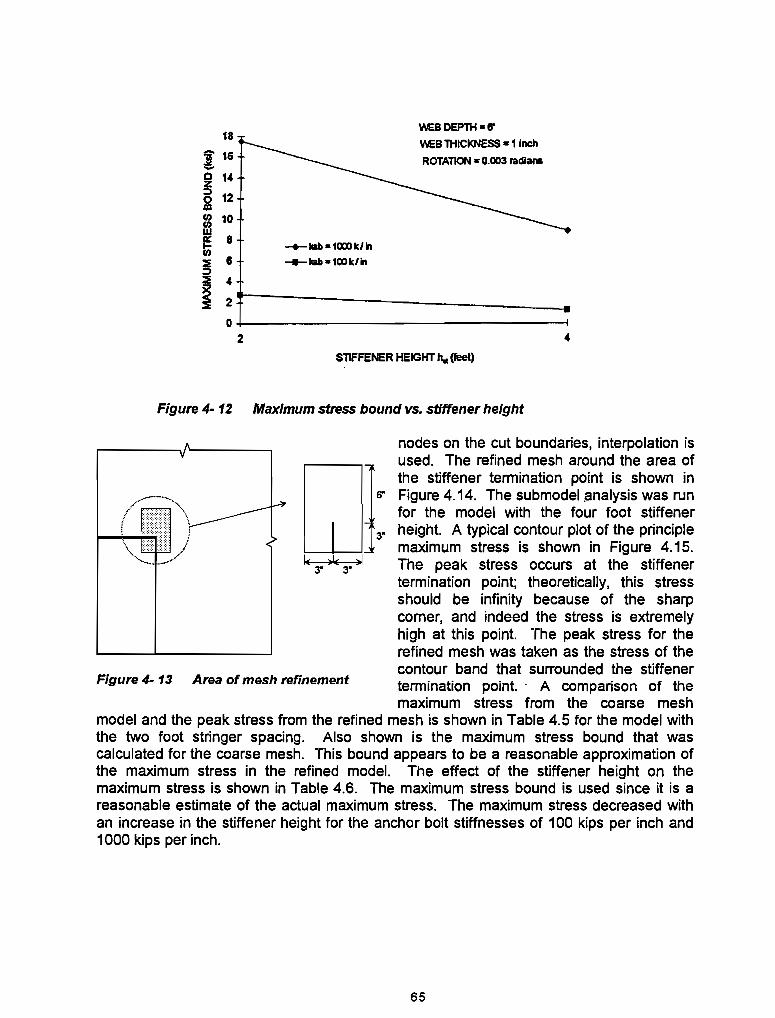
18
j' 16 ..... ~ 14
2 12 0 10 m ~ 8
:E e J :E 4
~ 2
-+-kab -1000 kl In ___ kab -100 kl iI
w;a DEPlH .8'
'M;B THICKNESS -1 Inch ROTATION.O.003 radlan&
D+---------------------------------~ 2 " Sl1FFENER HEIGHT h,. (feet)
Figure 4- 12 Maximum stress bound vs. stiffener height
Figure4-13 Area of mesh refinement
nodes on the cut boundaries, interpolation is used. The refined mesh around the area of the stiffener termination point is shown in Figure 4.14. The submodel analysis was run for the model with the four foot stiffener height. A typical contour plot of the principle maximum stress is shown in Figure 4.15. The peak stress occurs at the stiffener termination point; theoretically, this stress should be infinity because of the sharp comer, and indeed the stress is extremely high at this point. The peak stress for the refined mesh was taken as the stress of the contour band that surrounded the stiffener termination point.· A comparison of the maximum stress from the coarse mesh
model and the peak stress from the refined mesh is shown in Table 4.5 for the model with the two foot stringer spacing. Also shown is the maximum stress bound that was calculated for the coarse mesh. This bound appears to be a reasonable approximation of the maximum stress in the refined model. The effect of the stiffener height on the maximum stress is shown in Table 4.6. The maximum stress bound is used since it is a reasonable estimate of the actual maximum stress. The maximum stress decreased with an increase in the stiffener height for the anchor bolt stiffnesses of 100 kips per inch and 1000 kips per inch.
65

Figure 4· 14 Refined finite element mesh
Table 4- 5 Comparison of Maximum Stress for Coarse and Re-fined Mesh
S = 2 feet: tw = 11 inch: hst = 48 inches: e = 0.003 radians kab = 100 klin. kab = 1000 k I in.
COARSE MESH .4 ksi 3.5 ksi REFINED MESH 1.3 ksi 9.0 ksi Max Bounded Stress 1.25 ksi 8.9 ksi
66

ANSY-S 5.0 .::rWL 28 .1994 .16 ~ .14: 4.1 RLOT NO. 2 NODAL SOLUTION 5TER=.1 SUS =.1 TIME==.1 5.1 (AVG) TOR DMX == . .1 586 .13 SMN =- . .103E-09 SMNB=-71.008 SMX =46.455 SMX8=1.15.B53
-.103E-09 o 1 2 3 4 5 S 7 8 9 10
Figure 4· 1 S Typical plot of principal tensile stress for refined mesh
Table 4- 6 Effect of Stiffener Height on Maximum Stress
S == 2 feet: t.v == 1~ inch: hst = 48 inches: e == 0.003 radians Sl1FFENER HEIGHT kab == 100 klin. ~ = 1000 kl in.
2 feet 2.74 ksi 17.5 ksi 4 feet 1.25 ksi 8.9 ksi
67

Conclusions
The conclusions of the finite element analyses are listed below:
• The maximum principal tensile stress at the stiffener termination pOint increases with a decrease in the stringer spacing and an increase in the web thickness.
• The maximum principal tensile stress at the stiffener termination point decreases with a decrease in the anchor bolt stiffness. For the combination of anchor bolt and bearing pad likely to be used in a design, the maximum stress is small and not likely to pose any fatigue problems.
• The maximum principle stress at the stiffener termination point decreases with an increase in the stiffener height.
If the stiffener detail is classified as a category C, which encompasses welded transverse stiffener details, the allowable tensile stress range would be 10 ksi for over 2 million cycles, which is the typical deSign requirement. The classification of the detail as such is supported by past research [ 1, illustrated in Figure 4.16. The graph shows the fatigue performance of various types of details similar to the detail examined here. All of the data fall above the category C curve. The stress range of 10 ksi is approached and exceeded for a rotation of 0.003 radians when the anchor bolt is used without a bearing pad (kab = 1000 k I in, (see Table 4.6) but is approximately seven times greater than the maximum stress for a typical anchor bolt-bearing pad combination (kab = 100 k I in). Based on the results given above, it is concluded that the upper stiffener may be removed without a concem for fatigue at the stiffener termination point as long as a neoprene bearing pad is used in conjunction with the anchor bolt.
4.3 TRANSVERSE DIRECTION BEHAVIOR
It was concluded from the results presented in Chapter 3 that the standard TxDOT connection should not be used in situations where uplift occurs. A general discussion of the transverse direction behavior is provided in Chapter e in conjunction with a discussion on the characteristics of a new connection detail that is deSigned for uplift.
68

50
.... ---r------, 11014
'anlal
,_er.Clon
Fl1Itt
Full
'-.trotl .. Fn1<tt
-'-0IIl e.a,."..,1Itld
,.,.. A: ,.n _c"tl .. FlI1ft IIIld
Tno I; Fillet
III"
IJ
• •
A
FIu.ETwao
/ o i
STIFFENER TERMINATION POINT
Figure 4- 16 S-N plot of details similar to stiffener termination point (adapted from Joehnk [11J, pp. 58-59)
69

70

CHAPTERS
PHASE I CONCLUSIONS AND RECOMMENDATIONS
5.1 CONCLUSIONS
Longitudinal Direction Behavior
There are two elements of the standard TxDOT connection that restrain the longitudinal rotation of the cap girder, the anchor bolts and the pier column. The objective of the examination of the longitudinal direction behavior was to determine whether this restraint produced reactions in the restraining elements that must be considered in design. With regard to the anchor bolts, the results and analysis showed that fatigue is not a concern if a neoprene bearing pad is used under the plate-washer. The longitudinal rotation also produces a horizontal force on the rocker pin, but this force is much smaller than the horizontal force produced by the change in length of the superstructure caused by a temperature change. It was shown that it is not necessary to consider this force in the fatigue design. In summary, the connection behaved as expected in the longitudinal direction.
Transverse Direction Behavior
The standard TxDOT connection cannot efficiently resist uplift. This is based on the transverse direction tests and the pretensioning tests. The long length of the anchor bolts and the bearing pads used under the plate-washer, the functions of which are to decrease the longitudinal rotational stiffness of the anchor bolt system, also decrease the rotational stiffness of the connection in the transverse direction. As a result, significant vertical deflection will accompany any uplift force and the anchor bolts, which resist the uplift, will be loaded in tension. The cyclic nature of the vehicle loads subject the anchor bolts to fatigue loading, but the allowable fatigue stress is much lower than the allowable static load tension stress. If four 1.S inch diameter anchor bolts with a yield stress of 10S ksi were used in a connection, the tensile force that could be applied to the connection would be T = 4 (O.SSFy)At = 4 (0.SS*10S)(1.41) = 326 kips. The allowable live load tensile stress, which will produce fatigue loading in the bolts, would only be TL = 4 (8)At = 4(8)(1.41) = 4S kips, where the anchor bolts are treated as a category E detail with an allowable stress range of 8 ksi. The tensile stress range can be eliminated by pretensioning the anchor bolts, but this option is impractical for the current detail because the soft bearing pads, which provide for the flexibility in the longitudinal direction, preclude the development of any significant pretensioning force in the anchor bolts. In addition, the upper stiffener detail severely restricts access to the anchor bolt nut for tightening. An uplift resistant connection is developed in the second phase of the research.
71

5.2 RECOMMENDATIONS
5.2.1 Design Changes
Use Neoprene Bearing Pads Under the Plate-washer
Longitudinal rotation of the cap girder produces forces in the anchor bolts. The bearing pads used under the plate-washer increase the flexibility of the connection and thereby reduce the magnitude of the forces developed. The 70 durometer neoprene bearing pads decreased significantly the axial stiffness of the anchor bolts while the 90 durometer pre-formed fabric pads produced a much smaller decrease.
Eliminate the Upper Stiffener or Cut Short of Top Flange
This recommendation is based on the fabrication difficulties observed by the author and the limited access for anchor bolt tightening. A full depth bearing stiffener detail must be cut to exacting tolerances, particularly when a tight fit or a mill-te-bear specification is made. An overcut stiffener must either be ground down to the correct size or forced into place, each of which are time-consuming and expensive. The upper stiffeners also restrict access to the anchor bolt nut. Elimination would significantly ease the installation process.
Decrease the Number of Bearing Plates
The sizing of the bearing plates is based on an analysis procedure that produces a very conservative design. The size of the bottom bearing plate is governed by the allowable concrete bearing stress, which is also very conservative. This limitation is the primary determinant of the bearing size. The design of the bearing plates is addressed in the second phase of the research.
5.2.2 Fabrication Changes
Implementation of the above modifications only slightly alter the basic configuration of the connection. The primary objective of the research is to develop a new detail that performs as well as or better than the current detail and is less expensive to fabricate. Consultation with a steel fabricator identified those aspects of the connection that significantly increase the fabrication cost. They are listed below:
Groove Weld Between Rocker Element and Top Bearing Plate
This weld is very expensive and time-consuming to make; considerable savings would be realized if it is eliminated. A possible solution is to make the rocker element and the top bearing plate a monolithic unit.
Machined radius of rocker and sole plate
The semi-circular groove in the sole plate and the rounded end of the rocker element require precision machining that is not justified on structural grounds. The surfaces will rarely match up in the field with the same precision with which they were
72

machined. Fabrication cost would be reduced if this detail was eliminated or less precise machining was used.
Mill-to-Bear Specification Between Stiffeners and Bottom Flange of Cap Girder
The machining required for the mill-to-bear spec increases the fabrication costs and is not justified on structural grounds.
Based on the data from the experimental testing and the recommendations by the fabricator, a new detail is proposed. The new detail has the capability of resisting uplift.
5.3 NEW CONNECTION DETAIL
The new connection detail is shown in Figures 5.1 and 5.2. It incorporates two major changes from the standard TxDOT connection; the first change is to replace the rocker element and sole plate with a rolled wide-flange section. This change eliminates two of the problems listed above, the groove weld between the rocker element and the top bearing plate and the machined radii of the sole plate and rocker element. The wide-flange should be capable of resisting substantial compressive loads and the web should allow relatively free out-of-plane movement. The primary movement that must be accommodated by the bearing is horizontal translation and the wide-flange web should prove to be much more flexible than the short, stiff rocker element now used. These hypotheses, of course, will be tested in the Phase II research. A major advantage of the wide-flange bearing detail is that it provides a positive connection between the cap girder and the pier cap; the current detail requires anchor bolts for a positive connection. For situations in which uplift does not occur, the wide-flange bearing connection can be used without anchor bolts, as shown in Figure 5.3.
The standard TxDOT connection uses threaded steel rod for the anchor bolts. The new detail would replace the threaded steel rod (and bearing pad) with high strength threadbar, which is specifically designed for pretensioning and for which installation procedures are well established.
• The new detail can resist uplift; the current detail cannot. When uplift does not occur, the new detail can be used without anchor bolts.
• The new detail is redundant with respect to uplift failure; a positive connection is maintained by the wide-flange bearing if the anchor bolts fail.
• The design and fabrication of the new detail is simpler and probably less expensive than the current detail.
73

Figure 5·1
Figure 5·2
UPPER STIFFENERS REMOVED
Comparison of standard connection and proposed connection, transverse direction
UPPER SllFFENERS REMOVEO
Comparison of standard connection and proposed connection, longitudinal direction
74
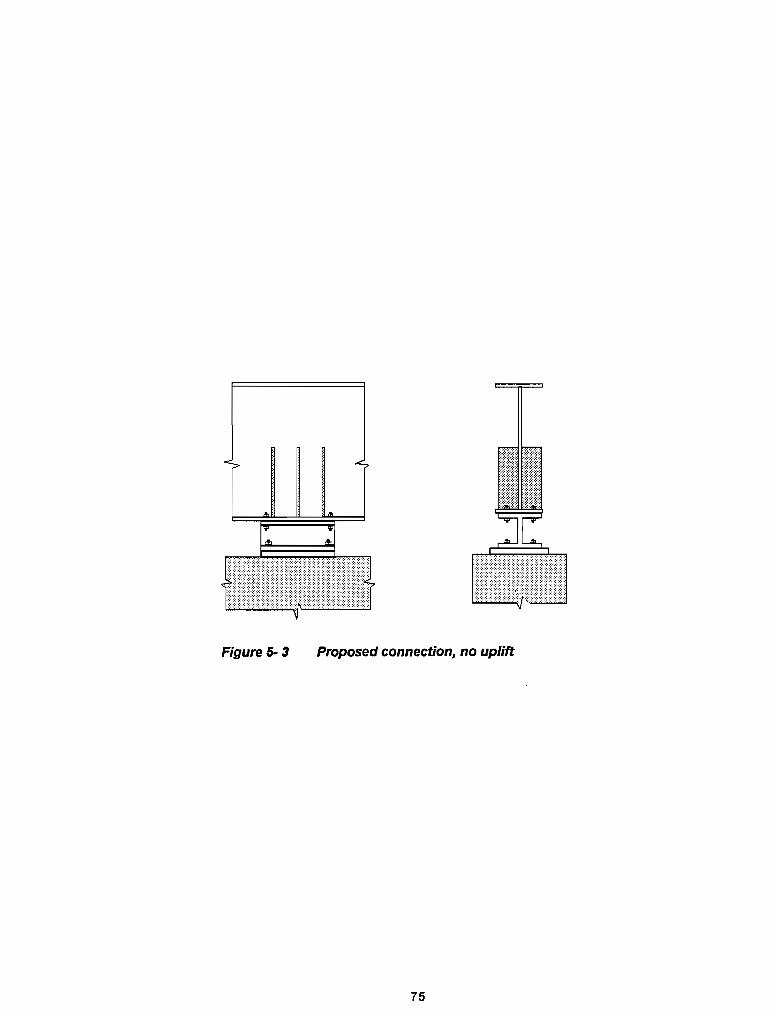
Figure 5-3 Proposed connection, no uplift
75

76

CHAPTER 6
PHASE /I COMPRESSION TESTS
6.1 TEST PROGRAM
The new detail is evaluated using both experimental testing and analytical modelling. The experimental testing comprised component tests and large scale tests. The component tests were conducted on the wide-flange section bearings and comprised compression tests and out-of-plane fatigue tests. Large scale tests were conducted on the new detail in a manner similar to the full scale tests conducted in the first phase testing. In this section the component compressive tests of the bearing are presented and discussed. The objective of the tests was to determine the vertical load capacity of the wide-flange bearing web.
Three sizes of wide-flange sections were selected as bearing specimens for the components tests. The sizes were a representative sample of the standard sections classified as the W12 and W14 column sections in the AISC Manual of Steel Construction [3]. The sizes tested were W12X87, W12X152, and W12X230. The material used was A572 Grade 50.
O. 1. 1 Variables
The primary variables for the compression tests were the slenderness ratio of the web and the thickness of the web. The slenderness ratio of the web was defined as the height of the web between the flanges, h, divided by the radius of gyration of the web, r. The range of the slenderness ratio for the W12 and W14 sections varies from 14 to 80 for web thicknesses between 0.5 inches and 2 inches. The nominal values of the web thicknesses and the slenderness ratios of the test specimens varied from 0.515 inches to 1.18 inches and from 31 to 71. An additional variable was considered, the width of the bearing. Two widths of bearings were tested, 24 inches and 36 inches, to determine whether the width of the bearing had any effect on the buckling stress. For plates with the unloaded edges supported in some way, the buckling stress is a function of the width-tothickness ratio.
0.1.2 Test Schedule
The schedule for the compression tests is shown in Table 6.1. Each test is identified by an alphanumeric code: the first letter, C, indicates that it was a compression test; the next three digits show the weight per foot in pounds of the W12 section; the next two digits give the width of the specimen in inches; the last digit indicates the number of the specimen tested.
77

Table '·1 Bearing Specimen Compression Test Schedule and Properties
TEST SIZE WIDTH WEB "rHICI' DEPTH h/r (inches) (inches) (inches)
C067361 W12X87 36 0.511 10.91 71.2 C067362 W12X67 36 0.511 10.91 71.2 C087241 W12X87 24 0.516 10.69 70.3 C087242 W12X87 24 0.506 10.89 71.7 C087243 W12X87 24 0.512 10.89 70.9 C152361 W12X152 36 0.893 11.01 41.1 C152362 W12X152 36 0.879 11.01 41.8 C230241 W12X230 24 1.3 10.85 27.8 C230242 W12X230 24 1.3 10.85 27.6
Replicate specimens were tested for each category. The width effect was examined using the W12X87 bearings; the widths tested were 24 inches and 36 inches. The slenderness effect and the web thickness effect were examined using all three specimen sizes. A more complete list of the specimen properties is given in Appendix C.
S'· W12X72
LOAD TRANSFER BEAM
TEST SPECIMEN
CONCRETE PIER
Figure ,. 1 Schematic of test frame
78

Figure 6-2 Test frame
6.1.3 Test Setup
The compressive loads that were expected exceeded the capacity of the largest test frame in the Ferguson laboratory. Therefore, a two million pound self-reacting frame was designed and constructed to test the bearings. A schematic of the test frame is shown in Figure 6.1 and a photograph of the frame as constructed in the lab is shown in Figure 6.2. The bottom platform supported a half section of a concrete pier cap and the top platform supported a 2000 kip capacity hydraulic ram. A 36" x 24" x 1 3/4" steel bearing plate transferred the compression load from the test specimen into the pier cap section. Shown in Figure 6.3 is the steel transfer beam that was located between the ram plunger
CONCRETE
Figure 6·3
TRANSFER BEAM
and the test specimen to spread the load out along the width of the specimen. The bottom flange of the test specimen was secured to the concrete cap with eight 3/4 inch diameter coil rods, four rods on each side of the web. The top flange of the test specimen was bolted to the transfer beam with eight 7/8 inch diameter high strength bolts. These
t5:::l";..--- TEST SPECIMEN attachments were designed to simulate field 1314' BEARING PLATE practice.
Compression test specimen
It was assumed in the original design of the loading frame that the test specimens would fail in the fixed-fixed buckling model as illustrated in Figure 6.4. In this failure mode,
79

FIXED-FIXED FAILURE MODE
~ K-O.5
SWAY FAILURE MODE
~ K=
Figure 6· 4 Failure modes
Figure 6· 5 Test frame sway
the top and bottom flanges are restrained from both rotating and translating. The frame, however, lacked sufficient stiffness to prevent lateral sway of the top flange of the test specimen. A simplified model of this behavior is shown in Figure 6.5. As the test specimen is loaded, geometric imperfections cause an eccentricity in the load application, which causes a moment equal to the load, P, multiplied by the eccentricity, e. This moment must be balanced by a couple produced by a horizontal shear force, V, separated by the specimen depth, d. The shear force that develops causes the frame to sway laterally. To increase the lateral stiffness of the frame, a diagonal brace was added to the east and west sides of the frame. Though the brace did not eliminate the frame sway totally, it lessened the problem.
6. 1.4 Instrumentation
The instrumentation used on the specimens consisted of strain gages, linear potentiometers, and servo inclinometers. In addition, whitewash was applied to the specimen and displacements were verified using rulers and a theodolite. A pressure transducer was used to measure applied load.
The strain gages were used to determine axial stresses and bending stresses in the web. They were typically located -at the web-fillet point of tangency at the top and bottom of the web, on both sides of the web, as shown in Figure 6.6. Strain gages were also placed on the base plate to determine the distribution of stresses. Ten gages were placed on the bottom of the plate: five gages were equally spaced along the 36" width, at the plate centerline; five gages were located on the north side of the plate, seven inches from the centerline. This location was approximately one inch past the edge of the bearing specimen flange. Five gages were located directly above this second set of gages, on the top of the base plate, as shown in Figure 6.7.
80

w 4" 4" GAGES ON BOTH ..: r )01..:
)01 rSIDES ,
I If J;:- I I I
, 4.75" I , ,
c------t---J ,
4.75" I ,
LI I I
24" or 36"
Figure 6· 6 Location of strain gages on test specimen
WEST - '--__ FOOTPRINT OF BEARING BOTTOM FLANGE
Figure 6· 7 Location of strain gages on bearing plate
81
OF WEB
1"
12"

The linear potentiometers measured the lateral displacement of the test specimen at the top flange and the web centerline. In most cases, three linear pots were located along the width of the web, at the centerline, and two linear pots were placed at the top flange. The rotations at the top and bottom flanges of the test specimens were measured using servo inclinometers. The progress and extent of the web yielding was monitored by painting both sides of the web with whitewash, a mixture of lime and water. When yield lines develop, the large accompanying strains cause the mill scale to crack and flake off and the whitewash accentuates the yield line.
6.1.5 Test Procedure
Before each test, the cross-section profile of the test specimen was traced out on a piece of graph paper. The traced profile was used to measure the initial imperfections in the specimen and the depth value, h. The web thickness was measured at five different locations, evenly spaced, along the height of the web and at the strain gage locations. The measurements were taken at both ends of the specimen and the average of the ten readings is shown in Table 6.1. The specimen was then placed on the base plate and the bottom flange coil rods were tightened to secure the specimen to the concrete cap. For the W12XB7 and W12X230 specimens, a layer of hydrostone was placed between the top flange and the transfer beam to mate the surfaces. The top flange bolts were then tightened. The W12X152 specimens had flanges that were not parallel. The relative angle between the two flanges was 0.01 radians, which compares with the mill tolerance value of 0.025 radians [3, p.5-251]. Rather than mate the surfaces of the top flange and transfer beam with hydrostone, contact between the surfaces was achieved by allowing the applied load to straighten out the test specimen. This is shown in Figure 6.B. This procedure was done to determine if large imperfections have any effect on load carrying capacity.
Each test was monitored using a plotter that recorded the real time load vs. lateral deflection behavior of the specimen. The load was statically applied in increments such that approximately 10-15 readings could be taken before the expected failure load was reaChed. A reading was taken approximately five minutes after a load step was completed; since yielding of the web was expected before failure, the pause was used to accommodate the yielding process. The loading was stopped once a peak load was achieved or the lateral deflection became excessive.
6.2 TEST RESULTS
6.2. 1 Material Properties
~ I
Figure 6· 8 Flange out-of· straightness
The material properties for the wide-flange bearing sections are given in Table 6.2. The properties were determined from tensile coupons taken from both the flange and the web. Two types of web coupons were cut from the sections, one set parallel to the direction of rOiling and one set perpendicular to the direction of rolling. Standard
82

Table 6· 2 Bearing Specimen Material Properties
SPECIMEN ORIENTATION YIELD STATIC DYNAMIC TENSILE & GAGE POINT YIELD YIELD STRENGTH ELONG. LENGTH
(from web) ksi ksi ksi ksi in.
W12X87 Transverse 58.S 61.60 81.8 31.7 2 Longitudinal 53.9 56.30 77.7 24.5 8 Mill Report 69.5 87.5 21.5~
W12X 152 Transverse 41.8 44.40 71.5 36.0 2 al 39.3 42.80 65.8 28.5 8
Long, Flange 43.3 39.6 42.90 64.9 31.8 8 Mill Report 58.5 75.1 27.0 8
W12X230 Transverse 47.3 49.00 83.1 22.8 2 Longitudinal 47.9 51.00 84.9 28.2 2 Long, Flange 48.4 51.60 80.5 28.5 8 Mill Report 58.5 85.5 23.0 8
A572 GR50 50 65.0 22.0
rectangular coupons with an 8 inch gage length and a 1.5 inch width were used for the parallel sets and standard round coupons with a 2 inch gage length and a 0.5 inch diameter were used for the perpendicular sets. The only variations from this program occurred with the perpendicular web coupons for the W12X87 sections, where rectangular coupons were used instead of the round coupons, and with the parallel web coupons for the W12X230 sections, where round coupons were used instead of the rectangular coupons.
The coupons were tested in both a hydraulic test machine and a screw-type test machine. The properties measured during the tests were the yield pOint, if there was any, the static and dynamic yield strengths, the ultimate strength, and the percent elongation. Most of the coupons exhibited a rounded yield curve, rather than the sharp-kneed bilinear curve. As a result, the yield stresses were obtained using the 0.2% offset method. Three static yield load pOints were taken during each test. The loading process was interrupted for apprOximately 5 minutes at each point. Two of these points were used to detennine the static yield stress.
The ASTM requirements for the A572 grade 50 steel are shown at the bottom of Table 7.1. The minimum specified yield strength is 50 ksi, the minimum specified ultimate strength is 65 ksi, and the minimum percent elongation is 22%. The specification requirements apply to longitudinal tensile coupons taken from the web; the yield strength applies to the yield point. The reasons for the disparity between the mill reports and the laboratory tests are the speed of testing and the variety of methods that the ASTM penn its to define yield strength. These differences are common and attempts to reduce the difference between mill reports and laboratory tests are currently being addressed by ASTM and the steel industry.
Only the W12X87 specimens had a static yield strength above 50 ksi. The W12X230 had a static yield strength 4.2% below the minimum specified and the W12X152 material was 21.4% below the minimum specified. The yield strengths of all three sizes
83

Figure 6- 9
Table 6- 3 Chemical Analysis of Bearing Steels, %
Typical load vs. lateral deflection curve
were well below the yield strengths reported on the mill certifications. The extremely low yield strength of the W12X152 material prompted a chemical analysis to determine if the material was indeed Grade 50. The results of the analysis are shown in Table 6.3. The very small percentage of vanadium indicated that the W12X 152 section was probably an A36 material, or a material with a yield strength of 36 ksi. The lab chemical analysis does not match the mill report, which suggests that an incorrect mill report was supplied with the steel.
6.2.2 Web Compression Results
The results of the bearing compression tests are shown in Table 6.4. A typical plot showing the load vs. the lateral centerline web dis-placement is shown in Figure
6.9. The dynamic failure load is the peak load reached in the test and the static failure load is the maximum static load reached in the test. The critical buckling stress, F cr, is defined as the maximum static load divided by the area. All of the specimens failed in the sway mode and in most cases lateral deflection began immediately upon loading. Graphs showing the non-dimensional axial stress vs. the top flange lateral deflection are shown in Figures 6.10 to 6.12. The transverse direction yield stress is used. The failure loads of the
84

Table 6-4 Compression Test Results
STATIC TESTID LOAD STRESS Fer I Fy
(kips) (ksi) C087361 830 45.1 0.78 C087362 860 46.7 0.79 W12X87 @36", AVG 845 45.9 0.79 C087241 571 46.1 0.78 C087242 578 47.6 0.81 C087243 610 49.6 0.84 W12X87 @24". AVG 586 47.8 0.81 C152361 1575 49 1.17 C152362 1450 45.8 1.09 W12X152 @36", AVG 1513 47.4 1.13 C230241 1750 56.1 1.19 C230242 1860 59.6 1.26 W12X230 @24", AVG 1805 57.9 1.23
specimens in each group are repeatable and the width of the specimen, which was varied in the W12X87 group, had no effect on the results. All of the specimens buckled in the inelastic range and strain hardening occurred in the W12X152 and the W12X230 groups.
The process of failure was similar for a" of the specimens and the sequence of the yielding was captured by the whitewash. Figure 6.13 shows the general process and extent of the yielding at different pOints on the load path. The initial yielding began in the lower comer of the south web, at a stress of about 0.4 Fy for the W12X87 specimens and at a stress of about 0.8 Fy for
the W12X230 specimens. Mill scale was not present on the W12X152 sections, so the whitewash did not begin flaking off until the failure load was approached. The next part of the web to yield was the upper north, at about 0.5 Fy for the W12X87 specimens and at about 0.8 Fy for the W12X230 specimens. The lower south web began to yield along its width at 0.7 Fy for the W12X87 specimens and at 0.9 Fy for the W12X230 specimens. As the failure load was approached, the yield lines extended along the width of the web on the top north and the bottom south. Continued loading caused the yield lines to penetrate deeper into the web. The final yield pattems for each size are shown in Figure 6.14.
The load distribution along the width of the web was not uniform because the transfer beam was not perfectly rigid. The stress distribution along the width of the web at the center was measured in the C087361 test. Five strain gages spaced at 7.5 inches and 3 inches from the edge measured the stress. The non-dimensionalized stress at different load levels is shown in Figure 6.15. Over the center 15 inches of the bearing, the stress distribution is relatively even and approaches the nominal stress as the load increases. This is the stiffest section of the transfer beam; vertical bearing stiffeners are located at the centerline and at 7.5 inches from the centerline on each side. Outside this width, at 3 inches from each end, the stress drops off and reaches 80% of the nominal stress at the failure stress of 0.78 Fy. As the load increases, the load redistributes from the center portion of the specimen to the outsider portions. This distribution is for a three foot wide specimen. The distribution is improved for the two foot section since a larger percentage of the width is under the stiffened section of the transfer beam.
6.2.3 Bearing Plate Results
The thickness of the bearing plates used to support a bearing is based on the simplified method of analysis that was described in Section 1.5. To determine the accuracy of the method, the bearing plate used in the compression tests was instrumented
85

1.4
1.2
1.0
Ll' 0.8
J! 0.6
0.4 0.2
0.0 0.00 0.01 0.02 0.03
lith
-o-C087361 ~C087362
-A-C087241 -o-C087242 -J:-C087243
0.04 0.05
Figure 6· 10 Non·dimensional axial stress vs. lateral deflection, W12 X 87
1.4
1.2 1.0
Ll' 0.8 -o-C152361 -J! 0.6 -o-C152362
0.4 0.2
0.0 0.00 0.01 0.02
li/h 0.03 0.04 0.05
Figure 6· 11 Non-dimensional axial stress vs. lateral deflection, W12 X 152
1.4
1.2 1.0
tC 0.8 -J! 0.6 -o-C230241
0.4 -o-CZ30242
0.2
0.0 0.00 0.01 0.02 0.03 0.04 0.05
IiIh
Figure 6· 12 Non-dimensional axial stress vs. lateral deflection, W12 X 230
86
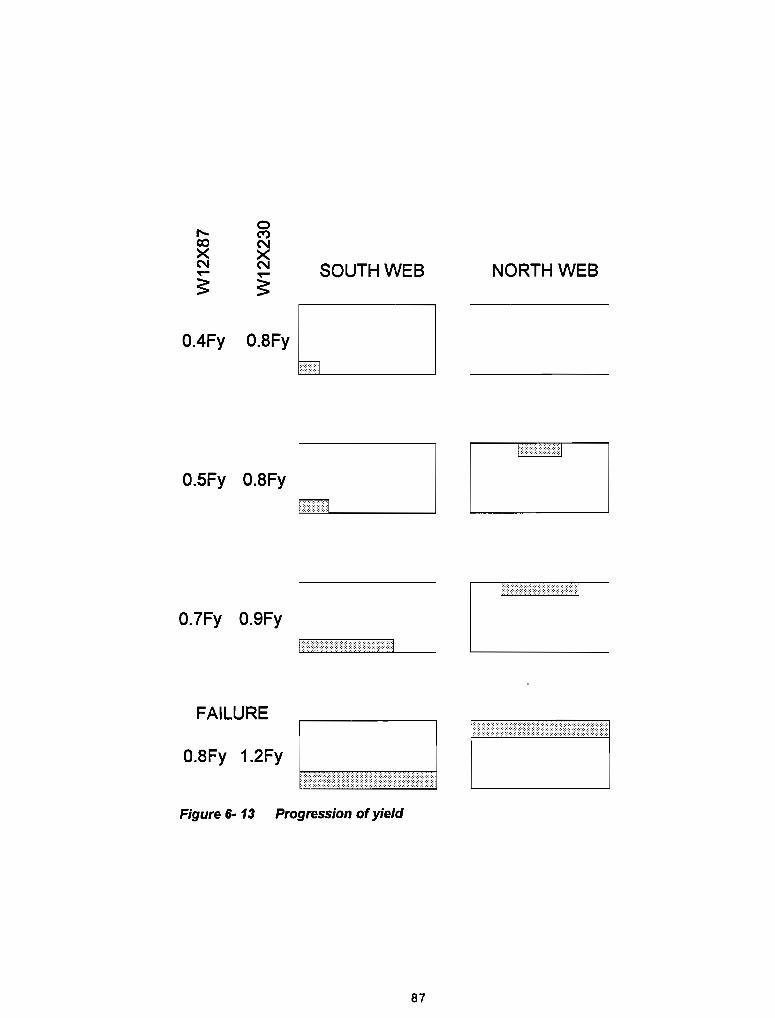
SOUTH WEB NORTH WEB
O.4Fy O.8Fy
TIm
O.SFy O.8Fy
O.7Fy O.9Fy
FAILURE
O.8Fy 1.2Fy
Figure 6w 13 Progression of yield
87

Figure 6· 14 Failed specimens
88

CIl CIl w
CIl c:: CIl t; W
~ ~ :s 0 z
1.2 1.1 1.0 0.9 0.8 0.7 0.6 0.5 0.4 0.3 0.2 0.1 0.0
r r r r r:
r:
r:
r r (1
f1
1"1
(1
o
p.23 ~y i
""l";"'::- ,,,=.,, ••• J ......... .......... , ...•.. -. "
.#.~/.' ......... ... - ....... --"". ~ ~
~ .. ' .... '~ r-... O. 8 Fy " ,.' ,""" v.o\ ry .... ,
"
i
3 6 9 12 15 18 21 24 27 30 33 3
DISTANCE ALONG BEARING (inches)
Figure 6· 15 Stress distribution along length of bearing
with strain gages along the centerline and at one inch from the edge of the bottom flange of the bearing. The centerline stress vs. load for the 36 inch wide bearings is shown in Figure 6.16. The edge stress vs. load for the 36 inch wide bearings is shown in Figure 6.17. The pOints on the graphs are the averages of the five values along each line.
Superimposed on each graph is the stress calculated using the simplified uniform stress method. The derivation of the stresses is shown in Figure 6.18. The plate is assumed to be loaded by a uniform force per inch of w = P I 24 where P is the applied load. At the centerline, the thickness of the resisting element is taken as the sum of the thicknesses of the bearing plate and the bottom flange of the bearing. This procedure is not strictly correct in this case since the bearing flange and the bearing plate are not
40
35
30 -'iii 25 ~ 00 20 CIl w c::: 15 I-CIl
10
5
0 0
USING TxDOT METHOD. W12X87 USING TxDOT METHOD. W12X152
--a- C152361
--.- C152362
-e-C087362
~ ~ a ~ 1~ 1B 1~ 1~ 1~
LOAD (kips)
Figure 6· 16 Centerline bearing plate stress vs. load
89
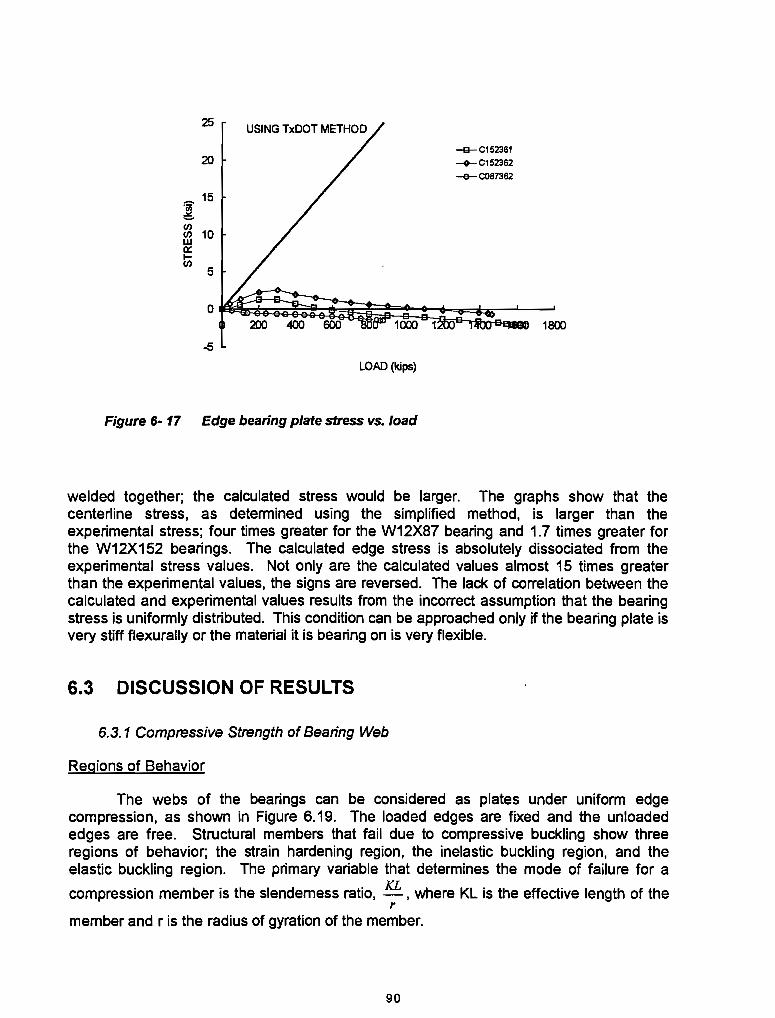
25
-El-C152361 20 -+-C152362
-e-C087362
= 15 ~ f/)
10 f/) w 0::: l-f/)
5
0 200 400 600 1800
-5
LOAD (kips)
Figure 6· 17 Edge bearing plate stress vs. load
welded together; the calculated stress would be larger. The graphs show that the centerline stress, as determined using the simplified method, is larger than the experimental stress; four times greater for the W12X87 bearing and 1.7 times greater for the W12X152 bearings. The calculated edge stress is absolutely dissociated from the experimental stress values. Not only are the calculated values almost 15 times greater than the experimental values, the signs are reversed. The lack of correlation between the calculated and experimental values results from the incorrect assumption that the bearing stress is uniformly distributed. This condition can be approached only if the bearing plate is very stiff flexurally or the material it is bearing on is very flexible.
6.3 DISCUSSION OF RESULTS
6.3.1 Compressive Strength of Bearing Web
Regions of Behavior
The webs of the bearings can be considered as plates under uniform edge compression. as shown in Figure 6.19. The loaded edges are fixed and the unloaded edges are free. Structural members that fail due to compressive buckling show three regions of behavior; the strain hardening region, the inelastic buckling region, and the elastic buckling region. The primary variable that determines the mode of failure for a
compression member is the slenderness ratio, KL , where KL is the effective length of the r
member and r is the radius of gyration of the member.
90

h
DETERMINATION OF CENTERLINE STRESS
~:fffffffff:fffffffffffl tWl2X87
= 1.75 + 0.81 = 2.56 in: S = 39.32 iff t Wl2X152 = 1.75 + 1.40 = 3.15 in: S = 59.54 i~
M = ~ = 3P : f= ~ f Wl2X87 = 0.0763P 2 S
f Wl2X15:;!'" O.0504P
DETERMINATION OF EDGE STRESS
S =.aw..W = 18.4 iff (j 1 6 'tttftfffJft~
M= '!!J§i =0.521P: f=0.0284P 2
Figure 6-18 Derivation of bearing plate stresses
b
Figure 6- 19 Plate under uniform edge compression
91

The non-dimensional slenderness ratio can also be expressed as
A.c = KL ~FY 1ty E
(6.1)
where A.c is the slenderness parameter for columns. The slenderness parameter for a plate with the unloaded edges free is
_ KL ~FY (l-v2
) A. I --
P 1ty E
The term (1_v2) accounts for the two-way action of
the plate. If the plate consisted of a series of isolated strips, or columns, as shown in Figure 6.20 the buckling load of the plate would be equal to the sum of the buckling loads of the individual strips. A plate however, is a monolithic member and so the behavior of one strip affects the behavior of the adjacent strip. As the strips are loaded axially they expand laterally due to the poisson effect. Each strip is free to expand through the thickness but is restrained from expanding through the width by the adjacent strip. This restraint increases the buckling load of the plate over that of a series of isolated strips.
A graph of non-dimensional axial stress
PLATE' IDEA1JZI!O AS SERIES OF INDIVIDUAL COLUMNS
i J II itt)! •• f J II I iii
'-+[gJ t-
STIilP EXPANDS DUE TO POISSON EFFECT; FIlEE TO EXPAND
(6.2)
AC"T1JAL PLATE
ililiiO!lliJ"'fii
~g t-
STRIP RESTRAINED FROM EXPANDING BY ADJACENT STRIPS
Figure 6- 20 Poisson effect in plates
vs. the slenderness parameter for columns and plates is shown in Figure 6.21. The regions are delineated by '-st, the slenderness parameter at which strain hardening begins, and Ap, the slenderness parameter at which yielding begins. For both columns and plates the non-dimensional elastic buckling stress is
Fer _ 1 Fy - A.2
(6.3)
where Fer is the elastic buckling stress. For the mathematically perfect column or plate, the elastic buckling load would govern behavior until the yield stress was reached. Due to the residual stresses and geometric imperfections that are always present in actual columns and plates, however, an inelastic transition region develops. This region extends from the point at
2.0
Figure 6- 21 Non-Dimensional axial stress vs. slenderness parameter (adapted from Salmon and Johnson [151, p. 364)
92

which yielding begins to the point at which strain hardening begins.
An equation commonly used to describe this region [10] is
(6.4)
where Fp is the proportional limit, or the nominal stress at which yielding begins. The exponent n is
n = (6.5)
The behavior of a column or plate in the strain hardening range is not easily quantifiable; it
is sufficient to state that F cr > 1 for A. s 'Ast. Fy
Description of Inelastic Region
To use Equation 6.4 it is necessary to define the variables Fp, 'Ast, and 'Ap. For the design of wide - flange columns, the strain hardening region is ignored, so 'Ast = O. The proportional limit, Fp, can be conservatively defined as Fy I 2. If Fer in Equation 6.3 is replaced by Fp = 0.5Fy, the slenderness parameter, A.p, can be derived. Performing this substitution gives 'Ap = --12. If n = 2 and all of the values are substituted into Equation 6.4, the equation defining the inelastic behavior of a column is
F cr = 1 _ 0.25 A, 2 : A, S .J2 Fy
(6.7)
which is known as the CRC (Column Research CounCil) column curve [4] for defining the inelastic behavior of wide - flange column sections. This equation, along with Equation 6.3 defining the elastic buckling behavior, is used by AASHTO for allowable stress design. Each equation is divided by a factor of safety of 2.12.
The inelastic buckling equation for a plate can be similarly derived. The strain hardening region for columns occurs at low slenderness ratios that are unlikely to be realized in practice. The strain hardening region for plates, however, is much larger. The size of the region depends on the boundary conditions of the unloaded edges of the plate. For a plate with one free edge and one supported edge the strain hardening behavior commences at 'Ast = 0.46. For a plate with both unloaded edges supported the strain hardening behavior commences at Ast = 0.58. These values are unconservative for a plate with two free edges, which will behave more like a column. The strain hardening slenderness parameter for columns can be derived by replacing the modulus of elasticity of steel, 29,000 kSi, with the strain hardening modulus, which may be estimated as 900 ksi [ ]. If this substitution is made in the elastic buckling equation (6.3) and Fer I Fy is set equal to one, Ast is 0.17. The strain hardening region for a plate may be conservatively estimated as beginning at Ast = 0.17. Also to be determined is the proportional limit and its
93

slenderness parameter. The proportional limit was estimated based on the values obtained in the bearing compression tests; they varied from 0.78Fy for the W12X230 sections to 0.62Fy for the W12X87 sections. For the purpose of deriving the inelastic buckling equation, the proportional limit Fp was taken as 0.6Fy. The slenderness parameter Ap was determined by replacing Fer of the elastic buckling equation with Fp and solving for A. This substitution produced Ap = 1.29. The exponent n is calculated by substituting the above values into Equation 6.5. For Ast = 0.17, n = 3.37. The inelastic plate buckling curve can now be derived as
Fer = 1 _ 0.27 ("J.. - 0.17 )3.37 1.29;;:: "J.. ;;:: 0.17
1.3 1.2 1.1
Fy
" 0 hIr=28" 0
hIr= 42
1'0t-_""'II"':~ __ . . . 0.9 0.8
il' 0.7 -u:' 0.6 0.5 0.4 0.3 0.2
- - - CRC -=q.6.8
o W12XB7 o W12X152
" W12X230
(6.8)
which is plotted along with the CRC column curve and the elastic buckling curve in Figure 6.22. Superimposed on the graph are the results from the bearing compression tests, with the effective length factor K set to 1. The actual effective length of the bearing specimens was difficult to de-
0.1 I _ ........... _-'-_..l-----''----'-_.....L-_''-----'-_--'---' termine due to the syvay of the 0.0 -0.0 0.2 0.4 0.6 0.8 1.0 1.2 1.4 1.6 1.8 2.0 test frame. It must fall be-
tween the bounds of K=0.5 and K=1. Given that all of the bearing specimens experi-
Figure 6· 22 Non-dimensional axial stress VS. enced a sway failure, the ef-slenderness parameter for bearing specimen fective length factor is closer to
1 than it is to 0.5. Since there was some restraint to lateral movement, however, the assumption that K=1 is unconservative. The inelastic plate buckling curve is unconservative for the specimen with the slenderness ratio of 71 0N12X87} but is conservative for the specimens with the lower slenderness ratios of 28 0N12X230} and 42 0N12X152}. To produce a design in which yielding controls rather than buckling it is necessary to limit the slenderness parameter to 0.17, which corresponds to a slenderness ratio of 13 for Grade 50 steel. Using the factor of safety for columns, 2.12, the allowable stress for the bearing web is
h f (J = 0.472 F y : - ;;:: 13 r
Combined Bending and Axial Stresses
(6.9)
The bearing web will not be subject to axial loading only; the horizontal forces due to temperature change and live load rotation will produce bending in the web. The design of members for combined bending and axial loading is governed by an interaction equation. The AASHTO specification requires the check of two interaction equations
94

(6.10)
and
fa + fb S; 1 0.472Fy Fb
(6.11)
where
F~ = (6.12)
where fa is the computed axial stress, fb is the computed compressive bending stress, Fa is the allowable axial stress, Fb is the allowable bending stress, and Cm/(l- fa/F~ is a
moment amplification factor. The first equation is appropriate for members that will fail due to instability while the second equation is appropriate for members in which buckling is precluded. It was established in the previous section that the slenderness ratio of the bearing web will be limited to ensure a yielding failure, rather than a buckling failure. Therefore, Equation 6.11 will be used to design the web. To ensure that this equation will always control the design, the amplification factor of the second term in Equation 6.10 must be less than or equal to one. If this factor is one the second term will reduce to fb I Fb, which is the second term of Equation 6.11. The coefficient em is 0.85 for a member which is loaded axially, has its maximum moments at the ends, and ends which are not prevented from translating. This is the condition of the bearing web. If fa = 0,472Fy and the effective length factor of the web is set to one the amplification factor becomes a function of the slenderness ratio, which can be solved for as
h 207 - s;--r..[F; (6.13)
and if Fy = 50 ksi the maximum slenderness ratio is 29. The maximum slenderness ratio, however, was previously set at 13 so that the failure would occur in the strain hardening range (Fer ~ 1.0Fy). At h/r.::;; 29, the buckling stress as determined by Equation 6.8 is Fer ~ 0.995Fy, a difference of less than 0.5%. Since r = t I "12 for a rectangular section, the limiting slenderness ratio can be converted to a minimum thickness limit. If the allowable bending stress is set to 0.55Fy the interaction equation to be used for the design of the bearing web is
f h[i; ----.:....:a=-- + s; 1 : t w ~ -- (inches) 0.472Fy 0.55Fy 60
(6.14)
95

I
6.3.2 Design of Bearing Plates
Sizing the Bearing Plate
The results of the compression tests showed that the uniform stress method for designing a bearing plate is conservative. A bearing plate on a concrete pier is best modelled as a beam
Figure 6· 23 Model of bearing plate as beam on an elastic foundation, as shown in on elastic foundation Figure 6.23. The primary variables in the
model are the length of the beam, I; the flexural stiffness of the beam, EI; and the modulus of reaction, k, which is a function of the modulus of elasticity of the concrete, Ec. The modulus of· reaction is defined as the load per unit length required to produce a unit deflection in the foundation.
The bearing stress in the concrete per unit length is
q = ky (6.1S)
where y is the local downward deflection of the concrete. To produce the uniform stress distribution that is assumed in the simplified analysis method, the deflection y must be uniform at all pOints along the length of the beam. A simple way to check the uniformity of the deflection is to compare the deflection at the center of the beam with the deflection at the end of the beam. If the ratio of the two measurements is one, the deflection and the bearing stress are uniform. For a finite length beam with a pOint load at the center, the ratio of the end deflection to the center deflection is
Yend = 4 cos (~l / 2) cosh (~l / 2)
Ycen 2 + cos ~l + cosh ~/
1 0.9 0.8
1: 0.7
~ ~ 0.6 >- 0.5 -"0 0.4 c: II)
>- 0.3 0.2 0.1
~~I -0.2 -0.3
0 2 3 4 5
PI
Figure 6-24 Ratio of end deflection to center deflection vs. PI
96
(6.16)
where ~l = I 4 k . A plot of . 4E1
Yend I Ycen vs. 131 is shown in Figure 6.24. For 131 < 1, Yend I Ycen
~ 1; the deflection, and therefore the stress, is uniform. For 131 > 3, the deflection at the end of the beam becomes negative; the beam applies a tensile stress to the foundation. Since the beam is needed to transfer compressive stress the portions of the beam transferring tensile stress are ineffective. Between the two extremes the relationship is approximately linear. If 131 is set to 1, a maxi-

mum length can be calculated such that the stress distribution is uniform. If ~I is set to 3, a maximum length can be calculated such that the entire length of the beam is effective. The modulus of reaction of the concrete can be estimated as
k Ee
Jl (6.18)
The derivation of this equation and all of the remaining equations in the section are shown in Appendix B. For a beam of unit width, the moment of inertia I = e I 12 where t is the thickness of the beam.
The maximum length for the two conditions are
Jstiff = 0.73 3.5 ( ~: ) t3 for uniform stress distribution
Jeff = 2.56 3.~( ~: ) t3 for ful/yejJective length
(6.19)
For example, if the beam thickness is 1.75 inches and the modulus of elasticity of the concrete is 4031 ksi (f e = 5000 psi), which are the values from the Phase" compression tests, the maximum length allowed for the plate to justify the assumption of uniform stress is 2.07 inches. The length of the plate that is effective, leff' is 7.27 inches. The actual length of the plate was 24 inches. The calculations show that only 30% of the bearing plate was effective. The maximum length allowable for the assumption of uniform stress distribution is too small to be of practical value. It is more reasonable to determine the maximum length for which the plate is effective.
The minimum required thickness for the bearing plate can be determined by relating the moment at the center of the plate to the allowable bending stress. The moment at the centerline is
_ p cosh PI - cos PI Melt" - 4~ sinh ~/ + sin PI (6.20)
At ~I = 3, Meen = 0.09P/; the moment at the centerline when a uniform stress distribution is assumed is .125P/, which is approximately 40% larger. Dividing the moment by the section modulus gives the bending stress. If the bending stress is set to the allowable the minimum thickness can be determined as a function of I.
Substituting the minimum thickness into Equation 6.19, the maximum length of the bearing plate that will be effective can be determined as
Ieff = 3.25 Eo --If ( P )Q.75 Ee Fbb
(6.21)
97

and the minimum thickness is
tmin = (6.22)
where Fb is the allowable bending stress and b is the width of the plate.
Concrete Bearing Stress
The current TxDOT design procedure sizes the bearing plate such that the maximum stress on the concrete does not exceed 0.3f c ...J(A2 I A1) ~ 0.6f c where A2 is the area of concrete supporting the bearing and A1 is the area of the bearing plate. Two tests were conducted to determine the
STIFfENERS
0.5" HYDI~OS1rQ.NE
AREA REMOveD =:i!=::::::::'"1FOR SECOND rEST
bearing strength of a concrete pier when loaded by a wide-flange bearing section. The test specimens are shown in Figure 6.25. In the first test the maximum nominal bearing stress in the concrete reached 1.36f c with only a small hairline crack as the only sign of distress. The loading had to be stopped because the wide- Figure 6· 25 Bearing strength test specimen
flange section was yielding. For the second test the length of the bearing 1lange was cut in half, which results in more stress on the concrete for the same load. Since some of the length of the bearing flange in the first test was probably ineffective, the actual stress on the concrete would not change that much from the first test. In the second test the concrete bearing stress reached 2.85f c with minor cracks around the perimeter of the bearing flange just beginning to form. It is recommended that rather than using the allowable stress given above to size the bearing plate, an allowable stress of 1.0f c be used to check the concrete bearing stress under the area leff '* b.
98

CHAPTER 7
PHASE /I FATIGUE TESTS
7.1 TEST PROGRAM
7. 1. 1 Test Variables
The bridge bearings will be subject to out-of-plane distortion due to horizontal movements and rotations. The primary horizontal movement is due to contraction and expansion caused by temperature changes. This movement, however, is not considered likely to cause fatigue damage. Fatigue damage is caused by the movements and forces produced by the cyclic live loading of truck traffic. At the pier locations, truck loading produces rotation about the transverse axis of the cap girder; the center of rotation is assumed to act at midheight of the longitudinal stringer (Section 4.2.3). Since the bearing location is not coincident with this pOint, a horizontal displacement, as well as a rotation, will be produced at the bearing location. This behavior is shown in Figure 1.9. The displacement that occurs at the bearing is equal to the product of the rotation and the distance from the measurement pOint to the center of rotation.
d
k
Figure 7·1 Location of maximum stress
The maximum stress in the bearing occurs at the intersection of the web and the flange, as shown in Figure 7.1. Rolled structural shapes have an approximate parabolic fillet transition from the web to the flange. Stress risers will be present in this transitional area, the magnitude of which will depend on the geometry of the transition. A sharper transition will produce a larger stress riser. Fatigue cracks may develop at these stress riser locations. The edges of the fillet are defined by two dimensions, k-t, and k1-ty)2. There is not much variation in these dimensions for the W12 and W14 sections, as given in the AISC Manual. For the W12 sections, the mean value of k-t, is
.71 inches with a standard deviation of 0.02 inches and the mean value of k1-ty)2 is 0.63 inches with a standard deviation of 0.02 inches. For the W14 sections, the mean value of k-t, is 0.67 inches with a starldard deviation of 0.02 inches and the mean value of k1-ty)2 is
99
0.63 with a standard deviation of 0.02 inches. The fatigue specimens comprised the same three sizes that were tested in the compression tests, W12X.87, W12X152, and W12X230. The properties of the specimens are listed in Appendix C.
The objective of the fatigue tests was to determine if a wide-flange section, when subject to cyclic out-of-plane shear distortion, would exhibit a fatigue life consistent with a category A detail. The category A detail encompasses details described as "Plain material, Base metal with rolled or cleaned surfaces" [2]. The allowable stress range is 24 ksi for an infinite life rating. Since a category A fatigue detail rarely controls the design of a bridge detail, a classification of the wide-flange section as such would simplify the design procedure by eliminating the requirement of checking for fatigue. Given that the allowable stress range for a category A detail for infinite life is 24 ksi, the fatigue speCimens were tested at stress ranges above this value, 30 ksi, 40 ksi, and 50 ksi.
7. 1.2 Test Setup
The rotation of the longitudinal stringers at the pier supports causes a horizontal displacement of the top flange of the bearing. This is in addition to the rotation. If the bottom flange of the bearing is assumed to be fixed, a conservative assumption. the displacement and rotation at the top of the bearing will produce a moment
M = EI (48 + 6A) where A = Y (J. The second term in the parentheses, the horizontal h h
displacement term, becomes 6 y (J / h , which will always be greater than the rotation term, 48. The larger the value of y, the more dominant the displacement term becomes. For example, if y = 60 inches and h = 12 inches, the ratio of the displacement term to the rotation term becomes 7.5, meaning that the horizontal displacement component causes a stress in the bearing 7.5 times greater than the stress caused by the rotation. Taking this stress differential into account, a test setup was deSigned that applied a horizontal displacement to the specimens. A schematic of the test frame is shown in Figure 7.2 and a photograph of the frame as constructed in the lab is shown in Figure 7.3.
The individual specimen was twelve inches wide. In most cases, two specimens were tested simultaneously, located symmetrically above and below the load application point. The top flange of the upper specimen and the bottom flange of the lower specimen were bolted to the test frame and were restrained from rotation and displacement. The bottom flange of the upper specimen and the top flange of the lower specimen were bolted together, but separated by a one inch thick loading plate. The loading plate was attached to a hydraulic ram that applied a constant amplitude sinusoidal load. The two specimens were free to translate, but not to rotate, at the load application point. Some tests were also conducted with only one specimen in the lower position. These tests were necessary to produce a 40 ksi stress range in the W12X230 specimens and in the single specimen tests a rotation as well as a horizontal displacement was produced.
7.1.3 Test Schedule
The schedule for the fatigue tests is shown in Table 7.1. Each test is separated by a blank row. Ten tests were conducted; two specimens (four fillets) were loaded in six of the tests and one specimen (one fillet) was loaded in four of the tests. Each fillet is identified by an alphanumeric code, similar to the code used for the compression tests: the
100

BUTIRESS /'
caX11.5
o 0 ==~=rT1~~~1 0 0
~_1800 _ 00
Figure 7· 2 Schematic of test setup for symmetric specimens
Figure 7· 3 Test setup for symmetric specimens
101

Table 7-1 Searing Specimen Fatigue Test Schedule and Properties
NOM IN~L STRESS RANGE FILLET 30 ksi 40 ksi 50 ksi F087UT1D X X X F087UB1D X X X F087LT1D X X X F087LB1D X X X
F087UT2D X X F087UB2D X X F087L T2D X X F087LB2D X X
F152UT1D X F152UB1D X F152LT1D X F152LB1D X
F152UB1S X
F152UT2D X F152UB2D X F152LT2D X F152LB2D X
F152UT3D X F 152UB3D X F152LT3D X F152LB3D X
F230UT1 0 X F230UB1D X F230LT1D X F230LB1D X
F230UB1S X F230LB1S X
F230LB2S X
102

first letter, an F, indicates that it is a fatigue test; the next three digits indicate the weight per foot in pounds of the W12 section; the next two digits give the location of the fillet in the test specimen; the next digit is a sequence identifier for the section size; the final letter indicates whether two specimens were tested in the symmetric placement setup, D, or if the specimen was tested by itself, S. The code is described below:
• X _ _ _ _ _ _ _ : F, fatigue test • X X X _ _ _ _ : weight per foot of bearing • _ _ _ _ X X_ _ : location of fillet subject to tensile stress range
: U, upper specimen; T, top fillet : L. lower specimen; B, bottom fillet
• _ _ _ _ _ _ X _ : section size test sequence identifier • _______ X : D, symmetric test setup
: S. single specimen tested
For example, test F087UT1 D indicates a fatigue test with a W12X87 section, the fillet is in the upper specimen at the top, this is the first test with a W12X87 bearing, and the fillet is part of the symmetric test setup. The table shows three nominal stress ranges, 30 kSi, 40 ksi, and 50 ksi. An X under one of the headings indicates that the fillet was tested at that stress range.
7.1.4 Test Procedure
Strain gages were used to measure the stress ranges at the anticipated peak tensile stress locations, as shown in Figure 7.4. This location was the point of tangency of the web and the 'fillet, or the dimension k from the bottom flange. The dimension k was the nominal value given in the AISC Manual. A comparison of the nominal value of k and the measured value of k for each specimen is given in Appendix C. An LVDT was used to measure the displacement of the loading plate.
Prior to each test, the
k
/ STRAIN GAGES
LOAD
--T ('\/ d I
'C
'- STRESS GRADIENT
.. V= PI2
cross-section profile was Figure 7. 4 Schematic of fatigue test specimens traced out and the web thick-ness was measured. The
h
specimens were then placed in position. Before any of the bolts that secured the specimens to the test frame were tightened, the strain gages were zeroed. This was done so that any stresses induced in the specimens due to the tightening procedure could be re-
103

corded. Once the specimens were secured, static load was applied to record the loadstress and load-displacement relationships. On completion of one static cycle, the cyclic load test began.
The constant amplitude, sinusoidal cyclic load was applied by means of a closedloop hydraulic system. A load controller was used to define the mean load and the load range. The load was correlated to the stress range in the static load test. The values were initially set to the values predicted by the static load tests, and then adjusted until the stress range, as recorded by the strain gages, was obtained. The load range was then checked to see that it produced the theoretical stress range The minimum load was set to produce a minimum stress of approximately +4 ksi for the fillets in tension. The load frequency varied from 3.0 Hz to 4.5 Hz and the number of cycles was recorded by a counter. Umits were placed on the load so that the system would turn off if a limit was exceeded. A fatigue crack typically activated the limit mechanism. If no fatigue crack occurred at 2 million cycles, the specimens were loaded to a 4 million cycle limit. If no fatigue crack occurred at the 4 million cycle limit, the stress range was increased and loading continued at this higher stress range until a 25
failure occurred. 20 -EI- W12XZlO
-A-W12X152
7.2 TEST RESULTS 'il' !15
-e-W1'l)(S7
cr «
7.2.1 Flexural Stiffness of w %10 (()
Specimens 5
0.00 0.02 0.04 0.06 0.08 0.10 0.12 0.14 DISPLACEMENT (inches)
Prior to each fatigue test, the flexural stiffness of the specimen was determined. The flexural stiffness was defined as the lateral deflection of the loading plate Figure 7· 5 Shear vs. displacement for symmetric test divided by the shear load. For setup the symmetric test setup, the shear load was defined as one-half of the applied load. A schematic of the system is shown in Figure 7.4. Each specimen was modelled as a beam that was fixed at one end and fixed but free to translate at the opposite end. For these end conditions, the flexural stiffness is
V kop = A (7.1)
where b is the width of the specimen, tv, is the average thickness of the web, and h is the depth of the web. The average shear vs. deflection curves for the three specimen sizes are shown in Figure 7.5. The height of the web can be considered as bounded between the height T = d-2k and the height d-2t, where d is the depth of the specimen. If the experimental stiffnesses are substituted into Equation 7.1, the effective depth of the web, he{f, can be solved for. A comparison of the effective height and the bounds given above is shown in Table 7.2. The measured values of T compare well with the nominal value of T
104

Table 7. 2 Effective Depth of the Web given in the AISC Manual. which is 9.5 inches. The
SIZE h=T h = d-2tf (measured) {measured}
Onches) Onches) W12)fS7 9.61 10.89 W12X152 9.42 11.00 W12X230 9.63 10.82
h = heff Eq.7.1 Onches) 10.12 11.06 11.99
% DIFF
heff, d-2tf 7.06 -0.56 -10.81
effective depth of the web is closely approximated by the depth d-2tr. The percent difference between these two depths is shown in the last column of the table. The W12X87 specimens were stiffer than calculated. the W12X152 specimens matched almost exactly, and the W12X230
specimens were more flexible than calculated. The difference between the actual stiffnesses and the calculated stiffnesses can be attributed to two primary causes:
1. Increased web thickness at fillets: This would tend to increase the flexural stiffness of the web because the fillet is ignored in the calculation.
2. Rotational flexibility of supports: It is assumed in the calculation that the supports are restrained from rotation. The web is actually supported by an elastic support (the flange) and the test frame cannot provide perfect rigidity.
The difference in stiffness for the W12X87 specimens is probably due to cause 1.) and the difference in stiffness for the W12X230 specimen is due primarily to cause 2.).
7.2.2 Comparison of Calculated and Experimental Stresses
Strain gages were placed on the specimens at the intersection of the web and the fillet to determine if the experimental dynamic stress readings were comparable to the calculated stresses. The calculated stresses were determined as
f = M = 6 V (I' / 2) cole S b tw2
(7.2)
where T is the nominal value given in the AISC Manual. The comparison of the calculated and experimental stress readings for all of the fillets that were gaged are shown in Figures 7.6 to 7.8. The mean ratio and the bounds of the ratio for each size are shown in Table 7.3. The maximum difference between the calculated and experimental stress readings is 27% and the mean difference varies between 1 % and 11 %. The primary error is due to the strain averaging property of a strain gage. A strain gage measures strain over a finite length and the output of the gage is the strain measured over this length. It is not possible to measure the strain at one point, nor is it possible to pick up a peak stress. The smaller the length of the strain gage, the more accurate the measurement will be. The length of the strain gages was 0.125 inches.
105

1.40
1.20
J 1.00
0.80 -.!.l 0.60 .J
0.40
0.20
0.00
Figure 7· 6
1.40
1.20
~ ~
1.00
0.80 -.!.l 0.60 .J
0.40
0.20
0.00
Figure 7· 7
1.40 I 1.20 .
1.00 Cl. x
0.80 ~ -.!.l 0.60 .J 0.40
0.20
0.00
Figure 7· B
o 5
o o 0 CD ...J 5 5
o CD ...J
o ~ ...J
FILLET # : W12X87
Ratio of calculated to experimental stress at fillet, W12XB7
- r- - r- f-
-+- + -+- 4- 4- 4- + -+- 4- -+- 4- -+- '-1 o .-m ::>
o
5 o CD ...J
FILLET # : W12X152
o S ...J
Ratio of calculated to experimental stress at fillet, W12 x 152
UT10 UB10 LT10 LB10 LB1S UB1S FILLET # : W12X230
Ratio of calculated to experimental stress at fillet, W12 X 230
106

Table 7·3 Ratio of Calculated to Experimental Stress at Fillet
W12XB7 W12X152 MEAN RAllO 1.11 0.99 MAX RAllO 1.27 1.11 MIN RAllO 1.03 0.86
Table 7·4 Fatigue Test Results
31 5.49 32 5.49 32 5.49 32 5.49
44 0.69 43 0.69 43 0.69
W12X230 1.07 1.25 0.98
107
7.2.3 Fatigue Ute
The results of the fatigue tests are shown in Table 7.4. The top row shows the nominal stress range in kips per square inch. The calculated stress range, Sr, and the number of cycles to failure, N, are given for each fillet. Each group of fillets that was tested simultaneously is separated by a dotted line. For each group of fillets, either one or more fillets failed or no fillets failed. Those that failed are shaded. A Y superscript indicates that the maximum stress in the stress range exceeded the yield strength of the material. The results are shown graphically in Figure 7.9 as a log-log plot of the stress range vs. the number of cycles to failure. One data point represents the results from each group of fillets. The data paints for the fillets that did not fail are accompanied by an arrow. Superimposed on the graph is the equation for the category A detail. In all cases, the experimental data paints lie above the category A boundary. The data points for the tests in which only one specimen was tested are indicated by an $. The results do not seem to be influenced by the test configuration.
In all 'cases, the crack initiated at some point within the center twothirds of the web. There was usually more than one crack initiation site and typically more than one crack plane. Schematics of the crack planes and crack surfaces of some of the failed specimens are shown in Figure 7.10. The cracks usually occurred just above or just below the anticipated cracking plane (at distance k from the outer surface of the flange) and the crack propagated as an ellipse, as shown by the shaded areas. In some cases the crack was visually observed before the loading system shut down.

100
60
!50 ~40 z ~30 (/) (/) w
~20
,
10 0.1
;
"'" I cuvr'i A
............... '
............ • ...... ~
i"""o ..... ..... t--•
~ .W12XB7 .W12X152 .W12X230
I
I
~-=~ 1-
~.~ .-
The specimens typically went through a few hundred thousand cycles from the time the crack was observed to the time it propagated through most of the thickness of the web or to the edge of the specimen. The fatigue life of a cracked specimen was taken either as the cycle count at the time the crack was visually observed or the last
1 2 3 4 5 6 10 observed cycle count before CYClES TO FAILURE (millions) the system shut down (this
was usually the case if the Figure 7- 9 Stress range vs. number of cycles to failure specimen failed during the
night). There is not much apparent difference in the
performances of the different sections, though the W12X87 sections had longer fatigue lives for higher stress ranges than the other two sections. This may be because the size of the fillet, which has dimensions (k1-V2, k-tr) that are larger than the web thickness, provides a smoother transition from the web to the flange and therefore has a smaller stress concentration. There was, however, no apparent stress concentration produced by the fillet transition, as shown by a thermoelastic stress analysiS of the fillet in Figure F.6 in Appendix F. It should also be noted that all of the W12X87 and W12X152 specimens that failed had a peak stress above the yield stress. Photos of some of the cracked specimens are shown in Figure 7.11.
7.2.4 Notched Specimens
The fillet provides a rather smooth transition from the web to the flange. To determine the effect on the fatigue life of a sharp transition, the fillets of two W12X87 specimens were machined out, as shown in Figure 7.12. This produced a sharp right angle transition from the web to the flange. The specimens were placed in the symmetric test setup and three stress ranges were tested. The specimens were first loaded to produce a calculated stress range of 38 ksi at the intersection of the web and flange. A crack formed at the intersection of the web and flange at the upper transition in the lower specimen (tension side) at 113,000 cycles. The crack extended almost the full width (12 inches) of the specimen. This cracked web and flange intersection was then reinforced with a fillet weld (no cracking ever occurred at the weld locations) on both sides of the web and the specimen loaded to produce a stress range of 10 ksi. No crack formed at any web-flange intersection at 4 million cycles. The stress range was increased to 20 ksi and a crack subsequently formed at the intersection of the web and flange at the bottom of the lower specimen, at 2.1 million cycles. The results of the test are plotted in Figure 7.13; also shown are the results from the previous tests and superimposed on the graph is the curve defining the category C detail, which specifies an allowable stress range of 10 ksi for infinite life. The data from the notched specimen tests fall close to and above the curve for the category C detail.
108

12"
.. FE230LB2S
3.7'
F152LB20
2"
F152LB20
F230UB1S
j 2.7"
F087LT20
1---- ".5 .. -----1 1.3"
Figure 7- 10 Schematics of crack surfaces
109

Figure 7- 11 Photos of cracked specimens
110

Figure 7· 12 Notched specimen detail
100
60 a-12 50 -~ 40 z ~30 (f) (f) W 0::: 20 t;
10
I I i
CATEGO RYA
---........... -. i~ " • ......... ...... I- ... Cf; TEGOR YC
~ ... lilt •
~ . .W12X87
• W12X152
eW12X230
• W12X87, NO FILLETS
I I 0.1
. ~ 14 I~ •
r--.. ..... , ~ ~
lilt -.. - lilt ...
-- ...
1 2 CYCLES TO FAILURE (millions)
Figure 7·13 N plot including notched specimens
111
.it-= ~ 11-
~ ~- --: f-I
!-
I- ... ::..
3 4 5 6 10

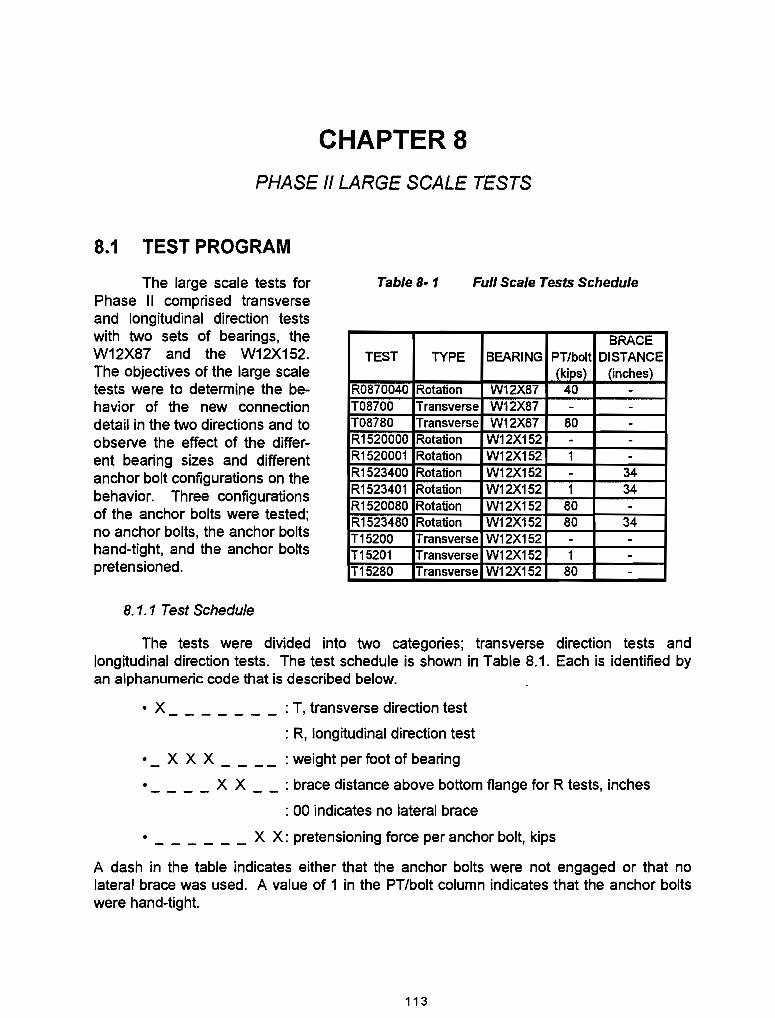
CHAPTERS
PHASE II LARGE SCALE TESTS
8.1 TEST PROGRAM
The large scale tests for Phase II comprised transverse and longitudinal direction tests with two sets of bearings, the W12X87 and the W12X152. The objectives of the large scale tests were to determine the behavior of the new connection detail in the two directions and to observe the effect of the different bearing sizes and different anchor bolt configurations on the behavior. Three configurations of the anchor bolts were tested; no anchor bolts, the anchor bolts hand-tight, and the anchor bolts pretensioned.
Table 8·1 Full Scale Tests Schedule
BRACE TEST TYPE BEARING PT/bolt DISTANCE
(kips) . (inches) R0870040 Rotation W12X87 40 -T08700 Transverse W12X87 - -T08780 Transverse W12X87 80 -R1520000 Rotation W12X152 - -R1520001 Rotation W12X152 1 -R1523400 Rotation W12X152 - 34 R1523401 Rotation W12X152 1 34 R1520080 Rotation W12X152 80 -R1523480 Rotation W12X152 80 34 T15200 Transverse W12X152 - -T15201 Transverse W12X152 1 -T15280 Transverse W12X152 80 -
8.1.1 Test Schedule
The tests were divided into two categories; transverse direction tests and longitudinal direction tests. The test schedule is shown in Table 8.1. Each is identified by an alphanumeric code that is described below.
• X _ _ _ _ _ _ _ : T, transverse direction test
: R, longitudinal direction test
• _ X X X _ _ _ _ : weight per foot of bearing
• ____ X X __ : brace distance above bottom flange for R tests, inches
: 00 indicates no lateral brace
• _ _ _ _ _ _ X X: pretensioning force per anchor bolt, kips
A dash in the table indicates either that the anchor bolts were not engaged or that no lateral brace was used. A value of 1 in the PT/bolt column indicates that the anchor bolts were hand-tight.
113

8.1.2 Test Setup
A schematic of the test setup for the transverse direction tests is shown in Figure 8.1. and a photo is shown in Figure 8.2. A schematic of the longitudinal rotation test setup is shown in Figure 8.3 and a photo is shown in Figure 8.4. The details of the con- I nection are shown in Figure 8.5. There are LOAD t three major changes in the configuration of the Phase II setup as compared with the Phase I setup. The first change is that the end load for the transverse direction tests is applied downward rather than upward as in Phase I. This models more correctly the load situation that occurs in practice. This first change necessitated the second change, the Figure 8- 1 design of the pier column and foundation. The load levels required in Phase II were
S' 4'
PIER CAP
N_
PIER COLUMN
_1
_1
_1
..... 9
_8
_7
_6
_5
_4
_3
_2
_1
Schematic of transverse direction test setup
much larger than those in Phase I, so the foundation was deSigned to engage two sets of test floor anchorages instead of one. The uplift force that could be applied to the system was 500 kips, which required a lengthening of the column section of the pier from one foot to two feet so the vertical column steel could be developed. The third major change was the orientation of the truss system that simulated the longitudinal girder. The truss was
Figure 8- 2 Transverse direction test setup
114

w+--
LOAD 8'
Figure 8-3 Schematic of longitudinal direction test setup
Figure 8-4 Longitudinal direction test setup
115

48" X 9116" WEB
24" O.75"X'" STIFFENERS
/ 2" X.,. X 19" Pl
22"
I::=~~;:~;~=;::::::b!-- W12X87 OR W12X152
1".HOLD-DOWN BOLTS
~ METAL TEMPLATE r-::!::....I...~...L.::o,.,.w....,.......r::: ..... O~ 0.25" x 3" STRIP
1.0" +150 KSI THREADBAR
Figure 8- 5 New connection details
116

turned upside down so that the load could be applied upward. This was done to simplify the loading fixture and to use the reaction wall as a bracing element.
Two types of longitudinal direction tests were conducted. In the first set of tests, all of the lateral bracing was removed; the center of rotation was at the bottom flange of the bearing. In the second set of tests, a lateral brace was placed 34 inches above the bottom flange of the cap girder; this simulated the center of rotation for the longitudinal girder rotating about its neutral axis.
8. 1.3 Instrumentation
The instrumentation used in the tests comprised strain gages, linear potentiometers, and servo and digital inclinometers. The loads were measured using both load cells and a pressure transducer. Whitewash was used on the W12XB7 bearing specimens.
The strain gages were located on the
48"
l< INCLINOMETER
TOP
N+--
T-GAGES / , 'f{ ....
~
i
::lINe' .. ""n:='" rf0T I
~ [ POTtl1 [ r#2 POT #3 ~ 'OT#4 pou ;6
~OAD , 51.5" 86.5"
168"
Figure 8 .. 6 Location of instrumentation
NORTH IE
GAGESON / BOTH SIDES
~
•
•
1.50" - W12X87 2.125" -W12X15!7
----."
cap girder, the bearings, the anchor bolts, 0" 12" 24" and the hold-down bolts. The gages on the cap girder are shown in Figure B.S. The Figure 8· 7 Location of strain gages on purpose of these gages, which were T.. bearings gages, was to determine if the cap girder web was significantly stressed from the web flexure caused by longitudinal rotation. The gages on the bearings, shown in Figure B.7, were used to determine the axial and bending stresses in the bearings. The gages on the anchor bolts were used to determine the forces in the anchor bolts. Two gages were placed opposite one another on the flat portion of the thread bar. Prior to use, one threadbar was calibrated to correlate strain and load. Subsequent testing proved the load obtained from the strain readings to be within a few tenths of a percent of the actual load.
The linear potentiometers were used to measure the bottom flange vertical and horizontal deflection of the cap girder. For the transverse loading tests, the pots were used to measure vertical deflection at the same position as the pots used in Phase I. Only one pot per location, however, was used in Phase II. Linear potentiometers were used to measure horizontal deflection of the bottom flange of the cap girder for the longitudinal rotation tests, as shown in Figure B.B.
117

c::::::;;~:!~ INCLINOMETER ON TOP FLANGE
The inclinometers were used to measure the transverse and longitudinal rotations of the cap girder. The servo inclinometers were placed on the top and bottom flanges of the cap girder, centered between the bearing connections. A digital inclinometer was placed at the center of the clip angle that connected the truss to the cap girder web and also on the horizontal cross plates of the two connections.
INCLINOMETER AT 'NEB CENTERLIN
~ INCLINOMETER ON CROSS-PLATE
INCLINOMETER ON BOTTOM FLANGE 8. 1.4 Test Procedure
C::::=~~H:::::::J LINEAR POT Plumbing the Cap Girder w+--
For the x087xxxx tests, the bear-Figure 8- 8 Location of inclinometers ings and the anchor bolts were erected
prior to the cap girder. For the x152xxx tests, the bearings were bolted to the cap girder before erection and the anchor bolts were placed after erection. An overhead crane was used to position the cap girder on the pier. Screw jacks were placed between the connections and near the load application point to support the girder for the plumbing operation. The cap girder was leveled horizontally along the axis by adjusting the height of the screw jacks and was plumbed vertically by selective tightening of the anchor bolts (x087xxxx tests) or the hold-down bolts (x152xxxx tests). A gap of approximately 3/4" was left for the grouting material. Dry pack grout was used to level the x087xxx cap girder and hydrostone was used to level the x152xxx cap girder.
.1\. V REACTION WALL V
n
• J
LAy
Figure 8·9
,., . J
E~
• 1 ........ " .. ,,, .
LOAD~
PUlNIIEW
AT COMPRESSION CONN£CTlOII
, ATLOAO POHT
Bracing scheme
Bracing the Cap Girder
The cap girder was braced to a reaction wall by four steel braces. The braces were pinned at both ends and located at the top and bottom flanges of the cap girder both at the load application pOint and at the north connection. The bracing scheme is shown in Figure 8.9. The braces were used for the transverse direction tests but were disconnected for the longitudinal rotation tests. A brace was added for the x152xxx tests; its purpose is explained below.

Tightening the Hold -Down Bolts
The hold-down bolts are the bolts that secure the bearing plates and the bottom flange of the bearing to the pier cap. These bolts were tightened using the tum-of-the-nutmethod, snug plus 1/4 tum. All of the bolts were tightened to the snug condition before the final tightening took place.
Tensioning the Anchor Bolts
The anchor bolts were tensioned using a hydraulic ram. A schematic of the tensioning assembly is shown in Figure 8.10. The anchor bolt extended past the nut approximately four inches. A tensioning coupler was threaded onto this extension and onto a pull rod. The pull rod extended through a hole in the top flange of the cap girder and through a center-hole ram. A 100 kip load cell was placed on top of the ram and a nut and anchor plate were the reacting mechanism of the pull rod. Before the tensioning began, all of the anchor bolts were tightened, by hand, to the snug condition. Each of the anchor bolts was tightened to the suggested working load of 0.66 fpu Aps [7], which in this case was 80 kips per bolt. The bolts in each bolt group were first tightened to 40 kips and then to the 80 kip working load. The tensioning process for each bolt comprised three stages: 1) tension the bolt to its target value plus fifteen percent; 2) tighten the nut; 3) release the load. Data were recorded at each stage. Overtensioning in stage one countered the seating loss from the stage two process. The cap girder was braced during the tensioning.
Transverse Direction Tests
The load was applied in increments
HYDRAULIC RAM TENSIONING COUPLER
Figure 8- 10 Tensioning assembly
such that 10 to 15 data readings could be taken before nonlinear behavior began. Each load step lasted approximately 30 seconds. Once the desired load level was reached, a needle valve in the hydraulic line was closed to maintain the pressure in the ram. After five minutes, the data scan was made. For the tests in which the anchor bolts were pretensioned, the specimen was taken to failure; the test was stopped when deflection at the load point increased with no increase in load. For the tests in which the anchor bolts were not pretensioned, the test was stopped before yielding of the bearing specimens began.
119
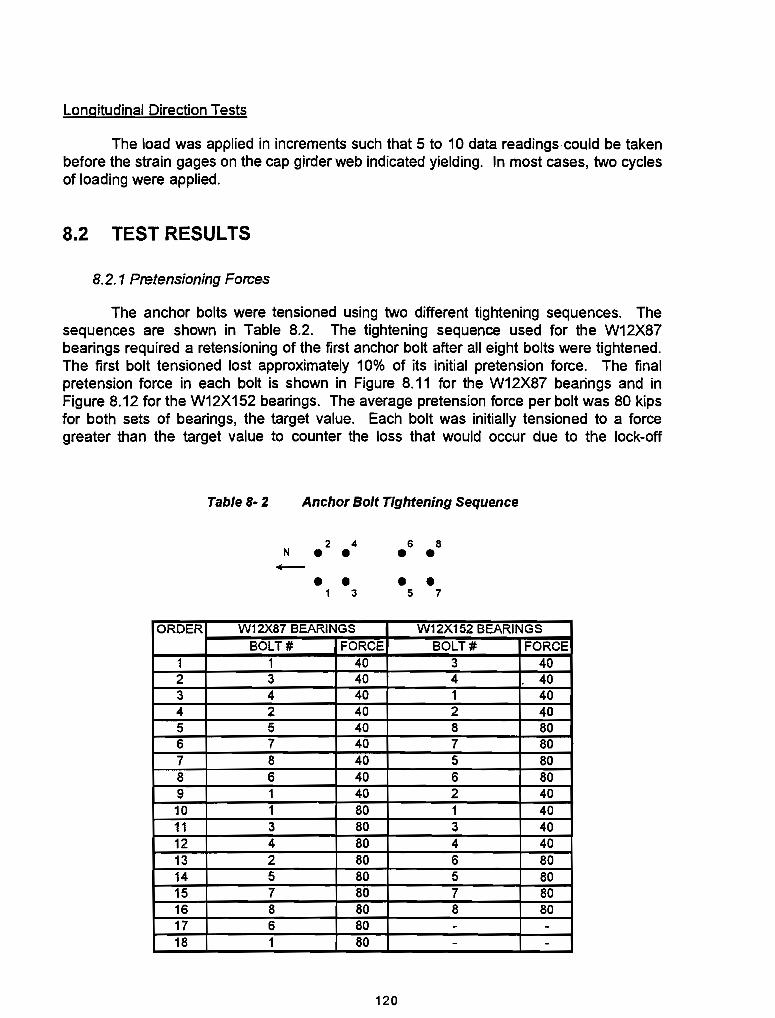
Longitudinal Direction Tests
The load was applied in increments such that 5 to 10 data readings could be taken before the strain gages on the cap girder web indicated yielding. In most cases, two cycles of loading were applied.
8.2 TEST RESULTS
8.2.1 Prefensioning Forces
The anchor bolts were tensioned using two different tightening sequences. The sequences are shown in Table 8.2. The tightening sequence used for the W12X87 bearings required a retensioning of the first anchor bolt after all eight bolts were tightened. The first bolt tensioned lost approximately 10% of its initial pretension force. The final pretension force in each bolt is shown in Figure 8.11 for the W12X87 bearings and in Figure 8.12 for the W12X152 bearings. The average pretension force per bolt was 80 kips for both sets of bearings, the target value. Each bolt was initially tensioned to a force greater than the target value to counter the loss that would occur due to the lock-off
ORDER
1 2 3 4 5 6 7 8 9 10 11 12 13 14 15 16 17 18
Table 8· 2 Anchor Bolt Tightening Sequence
2 4 N • •
• • 1 3
W12X87 BEARINGS
BOLT # FORCE 1 40 3 40 4 40 2 40 5 40 7 40 8 40 6 40 1 40 1 80 3 80 4 80 2 80 5 80 7 80 8 80 6 80 1 80
120
6 8 • • • • 5 7
W12X152 BEARINGS BOLT # FORCE
3 40 4 40 1 40 2 40 8 80 7 80 5 80 6 80 2 40 1 40 3 40 4 40 6 80 5 80 7 80 8 80 - -- -

90
80 -III 70 c. :i: - 60 Q)
e 50 0 u..
== 40 0 m ... 30 0 .&:: (,) 20 c «
10
0 1
North Bearing
319 kips
2 3 4 5
South Bearing
319 kips
6 7
Anchor Bolt Number
Figure 8·11 Pretension force per bolt, W12 X 87 bearings
90
80 -III 70 c. :i: - 60 Q)
e 50 0 u..
== 40 0 m ... 30 0 .&:: (,) 20 c «
10
0 1
North Bearing
318 kips
2 3 4 5
South Bearing
323 kips
6 7
Anchor Bolt Number
Figure 8·12 Pretension force per bolt, W12 x 152 bearings
121
79.7 kips
8
80.2 kips
8

procedure. The percentage loss due to lock-off for Table 8- 3 each bolt is shown in Table 8.3. The average loss per bolt was approximately 12%.
8.2.2 Longitudinal Direction Tests
Moment vs. Rotation Behavior
The primary purpose of the longitudinal rotation tests was to determine the stiffness of the connection as it relates to the rotation caused by vehicle live load. The moment vs. rotation curves of the different configurations of the connection with the W12X152 bearings are shown in Figures 8.13 to 8.18. The results are not shown from the one rotation test conducted on the connection with the
BOLT # 1 2 3 4 5 6 7 8
AVG
Percent Loss in Pretension Force Due to Lock-Off
% LOSS W12X87 W12X152
12.7 14.5 12.5 13.6 13.3 10.2 11.2 10.4 10.2 12.7 13.2 10.7 12.3 13.2 11.1 10.2 12.1 11.9
W12X87 bearings; its behavior was qualitatively similar to that of the connections with W12X152 bearings. Figures 8.13 to 8.15 show the results for the tests in which the lateral brace was not present, referred to as Center of Rotation (CoR) = 0". The results for the tests in which the lateral brace was present, referred to as CoR = 34", are shown in Figures 8.16 to 8.18. For each group, three sets of results are shown; the first graph in each group shows the moment vs. rotation curves for the connection in which the anchor bolts were not engaged, identified as (0) anchor bolts (the term engaged will refer to anchor bolts that resist the rotation of the cap girder); the second graph in each group shows the moment vs. rotation curves for the connection in which the anchor bolts have been tightened to a snug condition, identified as (1) anchor bolts; the third graph in each group shows the moment vs. rotation curves for the connection in which the anchor bolts are pretensioned, identified as (2) anchor bolts. In each graph, the moment vs. rotation behavior at four locations on the structure is shown. These locations are the top flange, the bottom flange, at the web centerline, and at the north connection cross plate. The applied moment is the product of the end load and its distance to the cap girder web, 96 inches. The rotation is given in milliradians.
The plots show that the rotation is a linear function of the applied moment. The stiffness of each connection is given by the slope of the moment vs. rotation curve. For the connection in which the anchor bolts are not engaged, only the out-of-plane flexural stiffness of the bearing resists the rotation. The slope of the curve is relatively flat. When the anchor bolts are hand-tight, the anchor bolts on the west side of the web resist the rotation while those on the east side do nothing. The stiffness of the connection increases, as shown by the increase in the slope. For the connection in which the anchor bolts are pretensioned, all of the anchor bolts resist the rotation and this connection is the stiffest. The connection stiffness increases considerably when the center of rotation is moved up into the web. An extra restraining element is introduced into the connection, the out-ofplane shearing stiffness of the bearing (see Section 4.2.2, Bearing and Pier Column). The rotations at the top flange and at the web centerline are essentially the same, as are the rotations at the cross plate and the bottom flange. The top flange is connected only to the web, since the bearing stiffeners are half-depth; it follows the rotation of the top half of the web. If the web was perfectly rigid, the rotation at every pOint along the depth of the girder
122

600 ....... 500 (/) ~
:i2 400 • c: 300 ;::... I- 200 Z w
100 ::i 0 0 ::i
-100 5
--e-TOP FLANGE
--tr- 'v'IIEB CL
~ BOTTOM FLANGE
--e-CROSS PL
10 15 20 25 30
ROTATION (milliradians)
35 40 45
Figure 8· 13 Moment VS. rotation (0) anchor bolts, CoR = 0"
600
....... 500 (/) ~ :i2 400 c: 300 ;::...
!z 200 w ::i 100 0 ::i 0
-100 5 10 15 20 25 30
--tr- 'v'IIE BeL
~ BOTTOM FLANGE
--e- CROSS PL
35 40 45
ROTATION (milliradians)
Figure 8· 14 Moment VS. rotation, (1) anchor bolts, CoR = 0"
600
i 500
• 400 c:
;::... 300
!z w 200 ::i 0 100 ::i
0 0 5 10 15 20 25 30
--e-TOP FLANGE
--tr- BOTTOM FLANGE
~'v'IIEB CL --e- CROSS PL
35 40 45
ROTATION (milliradians)
Figure 8·15 Moment vs. rotation, (2) anchor bolts, CoR = 0"
123
50
50
50

1200
-e-TOP FLANGE -+-BOnOM FLANGE
-6--WEBCL
-12 -10 -8 -S -4 -A200 2 4 6 8 10 12 ROTATION (milliradians)
Figure 8·16 Moment vs. rotation, (0) anchor bolts, CoR = 34"
1200 (i)'
1000 ~ :iii: -e-TOP FLANGE
I
C -+-BonOM FLANGE <::::.
-6--WEBCL .... Z UJ ::E 0 ::E
-12 -10 -8 -6 -4 -2200 2 4 6 8 10 12
ROTATION (milliradians)
Figure 8· 17 Moment vs. rotation, (1) anchor bolts, CoR = 34"
-/I) ~
:iii: I
C <::::.
-e-TOP FLANGE
-+-BonOM FLANGE
~ -6--WEBCL UJ -&-CROSS PL ::E o ::E
1200
1000
-12 -10 -8 -6 -4 -2 0 2 4 6 ROTATION (milliradians)
8 10 12
Figure 8·18 Moment vs. rotation, (2) anchor bolts, CoR = 34"
124

Table 8-4 Longitudinal Rotational Stiffness of Connection
ROTATIONAL STIFFNESS (inch-kips per radian) TEST BOTTOM FLANGE CROSS PLATE WEBCL TOP FLANGE
R1520000 6,500 8,040 8,290 6,520 R1520001 25,000 24,600 15,000 13,800 R1520080 59,500 60,900 23,900 20,300 R1523400 -275,000 - 172,000 123,000 R1523401 -275,000 - 174,000 128,000 R1523480 -385,000 -953,000 160,000 223,000 R0870040 50,300 .
e(·)=-..::~
=n=;~=8(')
NO STIFFENERS STIFFENERS
Figure 8-19 Illustration of negative rotation
- 18,040
would be the same as that point about which the web rotates, the center of rotation. The rotational stiffnesses of the different configurations are shown in Table 8.4. The negative sign for the stiffnesses of the CoR = 34" tests indicates that the rotation was in the direction opposite to the direction of the applied moment. This "negative rotation" occurred because the stiffeners did not extend the full depth of the web. Shown in Figure 8.19 is an illustration of the behavior. If no stiffeners were present the bottom
flange would rotate in a counterclockwise, or negative direction. If the stiffeners extend through the full depth of the web, all of the points along the depth must rotate in the same direction, which is clockwise or positive because that is the sense of the applied moment. Because the stiffeners of the detail only extend through half the depth of the web, the behavior will fall between the two extremes and in this case the bottom 'flange rotates counterclockwise, or in the negative direction.
Distribution of Moments
The applied moment is resisted by both the anchor bolts and the bearings. The amount of moment that is resisted by each is proportional to its stiffness. Figures 8.20 and 8.21 are graphs of the moment resisted by the anchor bolts and bearings vs. the applied moment at CoR = 0". If the anchor bolts, or the bearings, were the only resisting element, the slope of the curve would be one, i.e. the resisting moment would equal the applied moment. This relationship is represented in the graphs by the heavy solid line. A curve below this line indicates that the resisting moment is some fraction of the applied moment. Except for the case in which no anchor bolts are engaged, the bearings resist a smaller percentage of the applied moment than do the anchor bolts. The fraction of the applied moment that the bearings and anchor bolts resist is shown in Figure 8.22. For the
125

->- ! al:52 e , LIJ c: I- .-co--co ffi~ 0::0 I-al Zct: wo :::lEJ: ou :::lEZ
«
500
400
300
200
100
0
0
-ET- (2) ANCHOR BOLTS
......-(1) ANCHOR BOLTS
100 200 300 400 500 APPLIED MOMENT (in - kips)
Figure B· 20 Moment in anchor bolts vs. applied moment, CoR = ()"
>- 500 al-e!
400 LIJ:52 1-. co c: Ci5::- 300 Wco ct:(!)
200 I-Z z-wO:: :::lE« 100 oM:! :::lE 0
0
-ET- NO ANCHOR BOLTS
......-(1) ANCHOR BOLTS
-e- (2) ANCHOR BOLTS
100 200 300 400 500 APPLIED MOMENT (in - kips)
Figure B· 21 Moment in bearings vs. applied moment, CoR = ()"
~ 1.2 UJ ::E 1.0 o ::E 0.8 c !:!:! 0.6 ...I
8: 0.4 « ~ 0.2
~ 0.0
1.07 Ii (0) ANCHOR BOLTS
II (1) ANCHOR BOLTS
0(2) ANCHOR BOLTS
.(2) A.B., W12X87
o
BEARINGS BOLTS RESISTING MOMENT
1.07 1.04 1.00 1.02
SUM
600
600
Figure B· 22 Resisting moment as percentage of applied moment, CoR = ()"
126

connection in which the anchor bolts are not engaged, the applied moment is resisted solely by the bearings. The moment in the bearings, which was constant along the depth of the bearing web, was calculated using the strain gages located at the top and bottom of the web. The moment calculated using the experimental stress readings was 7% greater than the applied moment. For the connection in which the anchor bolts were snugged, the anchor bolts on the west side of the web were engaged, and the bearings resisted 35% of the moment and the anchor bolts resisted 69% of the moment, with the sum 4% greater than the applied moment. When the anchor bolts are pretensioned, the anchor bolts on both sides of the web are engaged and the stiffness of the anchor bolt system increases. This is confirmed by the experimental data. The moment resisted by the anchor bolts increased to 89% and the moment resisted by the bearings fell to 12%, with the sum equal to the applied moment. Also shown are the results from the connection with the W12X87 bearings. The W12X87 bearing is much more flexible than the W12X152 bearing and as a result resists a much smaller fraction of the applied moment.
It is more difficult to calculate the resisting moments using experimentally determined values for the connection with the center of rotation at 34 inches. Though the anchor bolt moments may still be easily determined, the bearings resist the moment through rotation and horizontal shear. The horizontal shear mechanism of the bearings (Section 4.2.2) produced a rotational stiffness much greater than the rotational stiffness of the anchor bolts and as a result the anchor bolts resisted less than 5% of the anchor bolt moment for all connection configurations {R1523400 [(0) anchor bolts] - 0%, R1523401 [(1) anchor bolts] - 3%, R1523480 [(2) anchor bolts] - 4%}.
Cap Girder Web Stresses
The web stress vs. rotation curves are shown in Figures 8.23 and 8.24. Six curves are shown for each of tests (CoR = 0" and CoR = 34"). The label PAR indicates the stress parallel to the long axis of the cap girder; the label PRP indicates the stress perpendicular to the long axis of the cap girder. The stresses are the averages of the values from the north and south groups of gages. The curves show that for CoR=O" the web stresses at the stiffener termination point increase with an increase in the number of anchor bolts engaged. This is due to the increase in the rotational stiffness of the anchor bolt system. The difference between the rotation at the web centerline and the cross-plate increases and so does the stress, as illustrated in Figure 8.23. The finite element analyses of the cap girder web subject to longitudinal rotation described in Section 4.2.4 showed the same trend. The web stress was not as sensitive to the rotational stiffness of the anchor bolt system for the CoR=34" tests. The stress, however, was larger for the same rotation as compared with the CoR=O" tests; at a rotation of 0.003 radians, the web stress at the stiffener termination point approached 1 0 ksi, which suggests that this area of the web may be susceptible to distortion-induced cracking (see Section 4.2.4). This problem could be eliminated by extending the stiffener the full depth of the web.
127

r.::-U) ~ ...... (f) (f) W
" I-(f)
m ~
50
45
40
35
30
25
20
15
10
5
0
-a-NO ANCHOR BOLTS, PAR
-a-NO ANCHOR BOLTS, PRP
--+--(1) ANCHOR BOLTS, PAR
-+-(1) ANCHOR BOLTS, PRP
__ (2) ANCHOR BOLTS, PAR
-e-(2) ANCHOR BOLTS, PRP
o 2 4 6 8 10 12 14 16 18 20 22 24 26 28 30 32 34 36 38
ROTATION (milliradians)
Figure 8· 23 Web stress vs. web centerline rotation, CoR = 0"
50
45
r.::- 40 ~ '-" 35 (f) (f)
30 w
" t; 25 m ~ 20
15
10
5
0 0 2 4 6 8
-a- (0) ANCHOR BOLTS, PAR
-a- (0) ANCHOR BOLTS, PRP
--+-- (1) ANCHOR BOLTS, PAR
-+-(1) ANCHOR BOLTS, PRP
__ (2) ANCHOR BOLTS, PAR.
-e- (2) ANCHOR BOLTS, PRP
10 12 14 16 18 20 22 24 26 28 30 32 34 36 38 ROTATION (milliradians)
Figure 8- 24 Web stress vs. web centerline rotation, CoR = 34"
128

8.2.3 Transverse Direction Tests
Moment vs. Rotation Behavior
The moment vs. rotation curves for the transverse direction tests are shown in Figures 8.25 and 8.26. The curves show that the rotational stiffness of the connection system increases when the anchor bolts are pretensioned. For the connections with no anchor bolts (TxxxOO) , the bearings provide the resistance to rotation. When the anchor bolts are engaged but not pre tensioned (Txxx01) the stiffness increases slightly. The connection system is at its stiffest when the anchor bolts are pretensioned. The rotation is primarily a function of the vertical deflection at each bearing. As was shown in Section 1.2.1 no significant deflection will occur in a pretensioned connection until the pretension force is overcome. The flattening of the moment vs. rotation curves for the pretensioned connections (Txxx80) is due primarily to the decrease in depth of the compression bearing as it failed. The rotational stiffness of the connection systems in the linear range are shown in Table 8.5.
30000
25000
I 20000 -6-T087oo -.-T08780 ,
.: "'" 15000 ... z w :;;
10000 0 :;;
5000
a 0.0 0.5 1.0 1.5 2.0 2.5 3.0 3.5 4.0
ROTATION (millimdians)
FigureB-25 Moment vs. rotation, transverse direction, W12 X 87
30000
25000
s: :.:' 20000 c:
"'" ... 15000 ttl ~1OOOO :;;
5000
0,0 0.5
Figure 8· 26
-6-T15200 -+-T15201 -+-T15280
1.0 1.5 2.0 2.5 3,0 3.5 4.0
ROTATION (milUmdians)
Moment vs. rotation, transverse direction, W12 X 152
Table 8· 5 Transverse Rotational Stiffness
TEST ROTATIONAL STIFFNESS (in-kips per radian) W12X87 BEARINGS W12X152 BEARINGS
TxxxOO 3,250,000 6,000,000 Txxx01 - 8,000,000 Txxx80 8,850,000 15,200,000
129

Distribution of Bolt Forces and Pier Reactions
The statics of the cap girder are shown in Figure 8.27. The dead load of the cap girder was ignored. The reaction force for the uplift connection is tensile and is defined as 2P where P is load applied at the end of the cap girder. The reaction force for the compression connection is com-
8'
pressive and is defined as 3P. The ==r=~===~]~I::J~~[== distribution of bolt forces and pier re- I actions for the tests with the preten- .. N --sioned connections (T08780 and p T15280) are shown in Figures 8.28 and 8.29. The individual data points are not shown. Each graph presents the data from both connections. The Figure 8. 27 Connection statics behavior of the uplift connection is represented by the curves to the right of zero, the heavy solid lines. The behavior of the compression connection is represented by the curves to the left of zero, the heavy dashed lines. The curves above zero show the response of the bolt group force as a function of the reaction force and the curves below zero show the response of the pier reaction as a function of the reaction force.
The pretension force in all of the bearings was approximately 310 kips. As load was applied to the end of the girder (P in Figure 8.27), the pier reaction decreased for the uplift bearing (heavy solid curve below zero) and increased for the compression bearing (heavy dashed curve below zero) in almost direct proportion to the reaction force (A in Figure 8.27). Note, however, that the change in the bolt group force (heavy curves above zero) was very small for the same increase in the reaction force. This behavior illustrates the great advantage of a pretensioned connection over a connection that is not pretensioned. For example, if the uplift bearing was not pretensioned, the bolt group would resist the entire reaction force (shown by the light dashed curve); a change in the reaction force of 250 kips would mean a change in the bolt group force of 250 kips. The actual change in the bolt group force for the same change in reaction force, however, was only 35 kips for the pretensioned connection (heavy solid curve), a decrease of over 600%.
Uplift did not occur in the test with the W12X87 bearings, illustrated by the termination of the curve before it reached the B (bolt group force) = A (reaction force) line; the compression bearing failed first. Uplift did occur in the test with the W12X152 bearings. The bolt group, however, did not resist all of the applied load once uplift occurred; unlike the Phase I bearing, which can only resist compression, the Phase " bearing provides a positive connection to the pier cap and resists tension. The uplift is resisted by both the anchor bolts and the wide-flange bearing.
The bolt group force for the compression bearing decreased Slightly with an increase in the applied compressive load. The decrease was linear for the test with the W12X 152 bearings; the failure of the bearing was not accompanied by a large decrease in
130

z o i= u « w a:: a:: w 0::
COMPRESSION BEARING UPLIFT BEARING ~
400 350 -- --:".-;;-
--------------------------~.~-~~~------~~~---~~~~-~-~-~-~----~~~: til • _ • • ..!!!!--..!f!--!'! -- ~
• .!!.-.,!!. - - 250 \,\ - .;-rr
200 150
100 50
-400 -350 -300 -250 -200 -150 -100 ~-.6650 A == -3P (kips) - , 00
-150 -200
R=A
-500 -550
-600
START OF TEST
B=A
50 100 150 200 250 J90 -350 400 A== 2P (kips ~
START OF TEST
~
-B,R vs. A, UPUFT CONN
• • • B,R vs. A, COMPRESSION CONN
- - -CALCULATED
Figure 8· 28 Bolt group force, pier reaction vs. applied load, W12 X 87 large scale test
131

COMPRESSION BEARING 500 I 400 I
~--------- ----. -.--;. • -~-~.~-£..:!!C ... " ~ --- ----
-800 -700 -600 -500 -400 -300 A = -3P (kips)
......
-200
...... ... ... ......
......
200
100
.... ' :J91J.:'00
-200
-600
-700
-800
-900
-1000
UPLIFT BEARING
---- -----~7~--------
START OF TEST ........... B=A
........... ....
............
100
.... ..... ...
400 500
START OFTEST
-B,R vs. A. UPLIFT CONN
- • • B,R V6. A. COMPRESSION CONN
- -CALCULATED
Figure 8·29 Bolt group force, pier reaction vs. applied load, W12 X1S2 large scale test
132

height. The failure of the W12X87 bearing was accompanied by a significant decrease in height and as a result the bolt group force decreased more rapidly toward the end the test.
The equations for the linear portions of the curves, obtained by a least squares fit of the data, are shown below, where B is the bolt group force, R is the pier reaction, and A is the reaction force (A = 2P for the uplift bearing and A = ·3P for the compression bearing). These equations will be analyzed in the following section.
Uplift Bearing, Bolt Group Force vs. Applied Tensile Load
B = 306 + O.lOA Wl2X152 Bearings
B = 305 + 0.10A Wl2X87 Bearings (8.1)
Uplift Bearing, Pier Reaction vs. Applied Tensile Load
R = ·301 + 0.80A Wl2X152 Bearings
R = -305 + 0.90A Wl2X87 Bearings (8.2)
Compression Bearing, Bolt Group Force vs. Applied Compressive Load
B = 309 + 0.077 A Wl2X152 Bearings
B = 321 + 0.20A Wl2X87 Bearings (8.3)
Compression Bearing, Pier Reaction vs. Applied Compressive Load
(804)
Stress Distribution in Bearings
The load in the compression bearing is the sum of the pretension load in the bolts and the reaction from the load applied at the end of the cap girder. The resultant of the compressive load produced by the anchor bolts coincides with the centerline of the bearing and should therefore produce a fairly uniform distribution of stress along the length of the bearing. The reaction produced by the applied load will not be concentric with the bearing, producing a non-uniform distribution of stress. Strain gages were placed at three locations along the top and bottom of the bearing to measure the stress distribution. Typical stress distributions are shown in Figure 8.30 to 8.33. The vertical axis shows the strain gage stress f59 (at the center the average of the two gages was used) normalized to the nominal
133
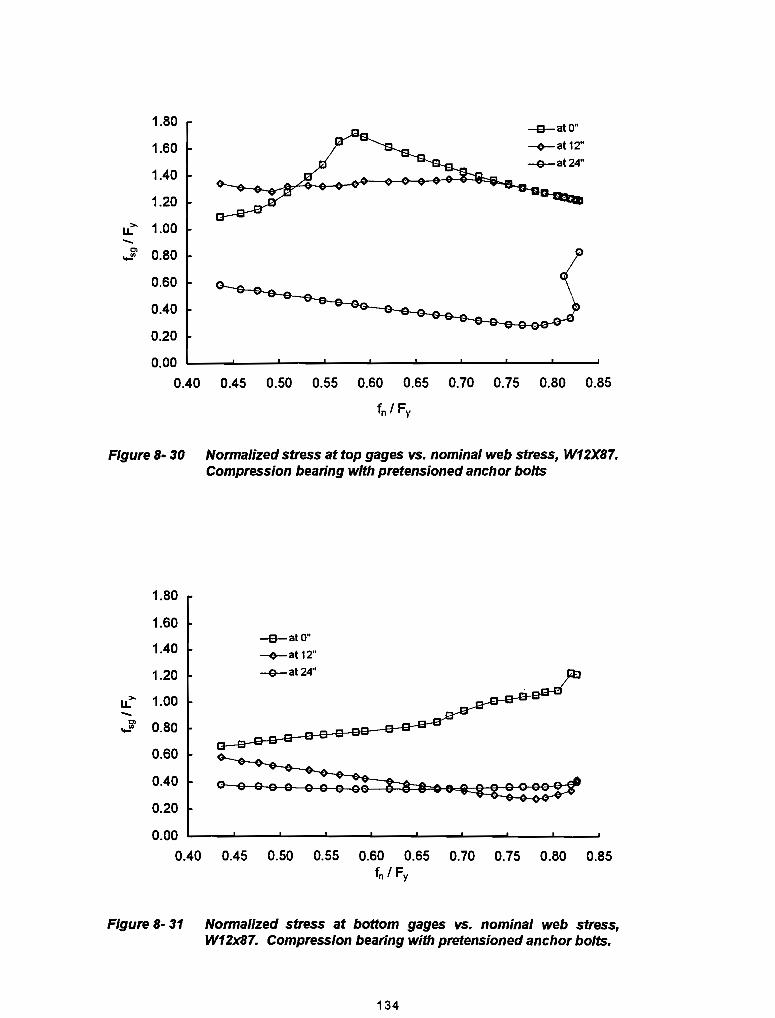
1.80 -e-atO"
1.60 -+-at12"
-e-at24" 1.40
1.20
u:- 1.00 -J 0.80
0.60
0.40
0.20
0.00 0.40 0.45 0.50 0.55 0.60 0.65 0.70 0.75 0.80 0.85
fn I Fy
Figure B· 30 Normalized stress at top gages vs. nominal web stress, W12XB7.
1.80
1.60
1.40
1.20
u:- 1.00 -"" ...:!' 0.80
0.60
0.40
0.20
0.00 0.40
Compression bearing with pretensioned anchor bolts
-e-atO"
-+-at12"
-e-at24"
0.45 0.50 0.55 0.60 0.65 0.70 0.75 0.80 0.85 fn I Fy
Figure B· 31 Normalized stress at bottom gages vs. nominal web stress, W12xB7. Compression bearing with pretensioned anchor bolts.
134

2.00
1.80
1.60 -a-at 0 inches
---+-at 12 inches 1.40 -e-at 24 inches
1.20 u...'" - 1.00 $ $ 0 .:J $-0 0-- $ $
0.80 / 0.60
0.40
0.20
0.00
0.00 0.05 0.10 0.15 0.20 0.25
fn I Fy
Figure 8· 32 Normalized stress at top gages vs. nominal web stress, W12X87.
2.00
1.80
1.60
1.40
1.20
1.00
0.80
0.60
0.40
0.20
Compression bearing, no pretension
-a-at 0 inches
---+-at 12 inches
-0- at 24 inches
0.00 I--___ J...-___ ""'--___ -'--___ ..J.... ___ .....I
-0.201. 0 ~.05 0 o -0.15 0 o O.2~ 0.25
-0.40
Figure 8· 33 Normalized stress at bottom gage vs. nominal web stress, W12xB7. Compression bearing, no pretension
135

stress fn, which is the compressive load in the bearing divided by the web area. The horizontal axis shows the nominal stress fn normalized to the transverse direction yield stress Fy• The stresses are shown for three locations: at the north end of the bearing, 0 inches; at the center of the bearing, 12 inches; and at the south end of the bearing, 24 inches. The plots apply to the tests using the W12X87 bearings. The results show that the normalized stress at each location remains fairly constant at the 12 inch and 24 inch locations. The only deviation from this generalization occurred for the stress at the north top of the bearing. At the 0 inch location at the top the stress increased with an increase in load until a certain point and then began dropping. This indicated a redistribution of the stress from the north end of the bearing towards the south end.
2.50
225
2.00
1.75
1.50
..t' 1.25 ....
.:; 1~OO
0.75
0.50
0.25
0.00
-0.25
Figure 8-34
2.50
2.25
2.00
1.75 1.50
..: 1.25 .... J 1~OO
0.75
0.50
0.25
0.00
-0.25
Figure 8-35
o
o
DISTANCE ALONG BEARING (inches)
Average ratio of gage stress to nominal stress (fSllI f,J, W12 x 87
12
TOP
24 o 12
BOn-OM
DISTANCE ALONG BEARING (inches)
24
Average gage stress vs. nominal stress (fa(l I f,J, W12X152
136
Comparison of the average normalized strain gage stresses at the three locations for the tests in which the anchor bolts were pretensioned and the tests in which the anchor bolts were not pretensioned are shown in Figures 8.34 and 8.35. The stress was maximum at the north end of the bearing in all cases and decreased toward the south end. The difference between the north end stress and the south end stress was most extreme for the tests in which the anchor bolts were not pretensioned. Pretensioning the anchor bolts tended to lessen the difference in the stresses at the three locations; the concentric compression force produced by the anchor bolts mitigated the non-uniform stresses of the eccentric compression reaction produced by the applied load. In the actual bearing the dead load reactions should perform a function similar to the pretensioned anchor bolts and produce a relatively uniform stress distribution.
The non-uniform stress distribution did not have any affect on the ultimate strength

of the bearings. The load vs. top flange lateral displacement curves of the two compression bearings are shown in Figure B.36. The ultimate loads from the full scale tests are compared with the ultimate loads from the bearing compression tests in Table B.6.
1000
900
800 'iii' Do
700 ;g, c « 9 600
500
400
300
0.00 0.02 0.04 0.06
-e-T15280 __ TOS7S0
O.OS 0.10 0.12 0.14 0.16
DISPLACEMENT 6rn:hes)
Figure 8- 36 Load vs. top flange lateral displacement, compression bearing
TableS- 6 Comparison of Bearing Capacities from Full Scale Tests and Component Tests
BEARING SIZE TEST Fer I Fy W12X87 Component 0.81
Full Scale 0.83 W12X152 Component 1.13
Full Scale 1.06
8.3 DISCUSSION OF RESULTS
B.3.1 Longitudinal Direction Behavior
The primary difference between the connection using the rocker and the connection using the wide-flange bearing is that the wide-flange bearing provides fixity from the cap girder to the pier cap. This fixity changes the horizontal and rotational stiffnesses of the pier column that were calculated in Section 4.2. The calculation of the anchor bolt system stiffness remains the same.
Pier Column
A model of the pier column and bearing with a horizontal force and a moment is shown in Figure B.37. The force and the moment will produce a deflection and a rotation
137

__ -------(E1\.J:, M I (E'>C H .J
I CENTER OF ROTATION
Of' ep;p GIRDER
8T \
~ H
y
Figure 8· 37 Pier column and bearing
and by relating the displacements to the forces the stiffnesses of the pier column can be determined. The derivation of the stiffnesses is shown in Appendix D.
The horizontal force was derived as
H = kH AH ( 1+ ~)
kMY (8.5)
and the moment at the top of the bearing was derived as
(8.6)
where
(8.7)
138

(8.8)
(8.9)
and y is the distance from the top of the bearing to the center of rotation, Lc is the length of the column, h is the height of the bearing, and (EI}i is the stiffness of the column (EI}c or the bearing (EI)b' In calculating the force and moment due to temperature change, the rotation may be approximated as zero since a uniform temperature change through the depth of the superstructure would produce equal horizontal displacements.
The horizontal force would be calculated as
(8.10)
and the moment would be
M== (8.11)
where .6t is the horizontal displacement due to the temperature change. The largest horizontal force and moment will be produced by the temperature change and therefore Equations 8.10 and 8.11 should be used. The fatigue loads will be produced by the longitudinal rotation of the cap girder and Equations 8.5 and 8.6 should be used.
Comparison of Calculated and Experimental Stiffnesses
The rotational stiffnesses of the anchor bolt systems for the Phase II connection were determined using Equation 4.16. There are no bearing pads and the axial stiffness of the anchor bolts is shown below:
• W12X87 Bearings : Lb = 75 in : AbE = 25944 kips: kb = 25944 175 = 346 k 1 in • W12X152 Bearings: 4 = 77 in: AbE = 25944 kips: kb = 25944/74 = 337 k 1 in
The rotational stiffness of the bearings with CoR = 0" is (EI)b 1 h and the rotational stiffness of the bearings with CoR = 34" can be determined by using Equation 8.6, dividing both sides by 9. The properties of the bearings are shown below:
• W12X87 Bearings : h = 10.94 in: {EI)b = 29000 (1/12) (2*24) (0.509)3 = 15298 in-kl rad
139

• W12X152 Bearings: h = 11.01 in: (EI)b = 29000 (1/12) (2*24) (0.891)3 = 82052 in-kl rad
A comparison of the experimental rotational stiffnesses, as measured at the bottom flange, and the calculated rotational stiffnesses are shown in Table 8.7. The calculated stiffnesses are the sum of the rotational stiffnesses of the anchor bolt system and the bearing.
Table 8· 7
TEST
R1520000 R1520001 R1520080 R1523400 R1523401 R1523480 R0870040
Comparison of Experimental and Calculated Longitudinal Rotational Stiffnesses
EXPERIMENTAL CALCULATED (in-k I rad) (in-k I rad)
6,500 7,450 25,000 34,800 59,500 62,000
-275,000 to 172,000 180,000 -275,000 to 174,000 207,000 -385,000 to 223,000 235,000
50,300 57,500
The calculated stiffnesses for the connections with CoR = 0" correlate well for no anchor bolts engaged and both set of anchor bolts engaged, but diverge somewhat for one set of anchor bolts engaged. For the connections with CoR = 34" the calculated stiffnesses are of the same order of magnitude as the experimentally determined stiffnesses. The negative sign indicates the negative rotation that occurred at the bottom flange of the cap girder. This behavior was explained in Section 8.2.1 and had to do with stiffeners only extending up half the depth of the web. If the stiffeners extended up the entire length of the
web the rotation at all points along the depth of the cap girder would be the same (ignoring any difference due to the bending of the stiffeners) and the values would correlate better with the calculated values. It will be recommended in a following section that the stiffeners should indeed extend the full depth of the web.
8.3.2 Transverse Direction Behavior
Equations Describing Connection Behavior
The behavior of a connection that has been pretensioned was described in section 1.2.1. If the bolt is pretensioned to a force Bo, all of the material between the bolt heads are compressed by a force Co that is equal to Bo. An applied tensile load produces an increase in the bolt force, but this increase is a small percentage of the applied load, as shown in Figure 1.7, region c). This behavior is quantified as
B = Bo + A [ 1 - !: ] (8.12)
where B is the bolt force, A is the applied load, and Bs is the force in the bolt at the initiation of uplift, or the point at which the plates separate, and is given as
(8.13)
where kt, is the axial stiffness of the bolt and kc is the axial stiffness of the elements in the grip. The applied tensile force necessary to produce uplift is termed Ts and is equal to Bs. For A ~ Ts, shown in Figure 1.7, region e.), the bolt force is equal to the applied load, or B = T. The magnitude of the reaction between the plates in response to applied tensile load, shown in Figure 1.8, region c.), is given as
140

(8.14)
where R is the reaction between the plates. For A;;:: Ts the plates have separated and R = 0, shown in Figure 1.8, region e.).
Equation 8.12 and 8.14 also apply for an applied compressive load and similar to the tensile force that produces plate separation there is a compressive force that produces separation of the plates from the bolt, given as
Cs
= _ Bo Bs Bs - Bo
(8.15)
For A $; Cs the plates and the bolt have separated and B = 0 and R = A, shown in Figures 1.7 and 1.8, region f.).
To apply the above equations to the Phase II connection the following modifications will be made:
• The bolt will be defined as the bolt group.
• The elements in the grip will be defined as the stiffeners, cap girder web, and cross-plate; the bearing hardware, conSisting of the wide-flange bearing and the grouting material; and the concrete above the bolt anchorage. These elements were described in Section 4.1.
• The applied load will be defined as -3P for the compression connection and as 2P for the uplift connection.
Determine Element Stiffnesses
The axial stiffness of the bolt groups were determined using Equation 4.3.
• W12X87 Bearings: 4, = 75 in: AbE = 25944 kips : ~ = 4(346) = 1384 k 1 in • W12X152 Bearings: 4, = 77 in : AbE = 25944 kips : ~ = 4(337) = 1348 k 1 in
The stiffness of the cap girder web, cross-plate. and stiffeners were determined using Equation 4.5.
• hst = 22" : Ast = 6(7)(0.75)(2/3) = 21 in2 : Aweb = 0.5625(24+16)/2 = 11.25 in2
• n = 4: Sst = 8 in: Icp=(1/12)(7)(2)3+(1112)(4)(1.25)3=5.32 in4 {includes anchor plate}
[ 1 1 J-1
kgird = -- + = 35914 k / inch 42511 231420
141

The bearing hardware stiffnesses for the connections were determined from measured loads and deflections, as described in section 4.1.4. Equations 8.12 and 8.14 using the calculated values are superimposed on Figures 8.28 and 8.29.
• W12X 152 : Compression Bearing : 11350 k I inch : Uplift Bearing : 9300 k I inch
·W12X87 : Compression Bearing : Uplift Bearing
: 6780 k I inch : 7880 k I inch
The total stiffness of the compression elements is
III k = -+--+-
[ ]
-1
c kgird kconc kh (8.17)
and the values of kt" kc, and Equations 8.12, 8.13, and 8.14 are listed in Table 8.8. Also shown are the experimentally determined equations presented in Section 8.2.3
TableB· B Equations for Bon Group Force and Pier Reaction
BEARING kb kc Eq.8.13 Eq.8.12 Eq.8.14 COMP (k I in) (k I in) as (kips) B (kips) R (kips)
W12X87 Calc 1384 5131 396{127Bo} 312 + 0.21A -312 + 0.79A
Exp 390{1.21 Bo} 321 + 0.20A -321 + 0.80A
W12X152 Calc 1348 7375 362{1.18Bo} 307 + 0.1SA -307 + 0.8SA
Exp 334{1.08Bo} 309+ 0.08A -309 + 0.92A
UPLIFT
W12X87 Calc 1384 5735 379{1.24Bo} 306 + 0.19A -306 + 0.81A
Exp 340{1.11 Bo} 305 + 0.10A -305 + 0.90A
W12X152 Calc 1348 6451 375{1.21 So} 310 + O.17A -310 + 0.83A Exp 344{1 .12Bo} 306 + 0.10A -306 + 0.80A
The results show that the tensile force needed to produce uplift varied from 1.Bo to 1.21 Bo for the experimentally determined values and from 1.21 So to ·1.27Bo for the calculated values. The calculated and the experimentally determined values compare reasonably well. The behavior of the connection is dependent primarily on the ratio of the bolt group stiffness to the stiffness of the compressed elements. The stiffer the compressive elements with respect to the bolt group, the smaller the tensile force that is necessary to produce uplift and the smaller the tensile stress range that the bolt group can cycle through (see Figure 1.7, regions c and d) Conversely, the stiffer the bolt group is with respect to the compressed elements, the larger the tensile force that is necessary to produce uplift and the larger the tensile stress range that the bolt group can cycle through. The bearing hardware, which consisted of the Wide-flange section and the grouting material, had the smallest stiffness of the compressed elements. The stiffness of the wide-flange bearing can be determined as kbear = AE I h where A is the area of the web. The grouting material, which was placed between two steel elements in the tests, will be placed between the bottom bearing plate and the concrete pier cap in the field. Localized deformations of grout and the concrete under the bearing plate will reduce the stiffness of the concrete element.
142
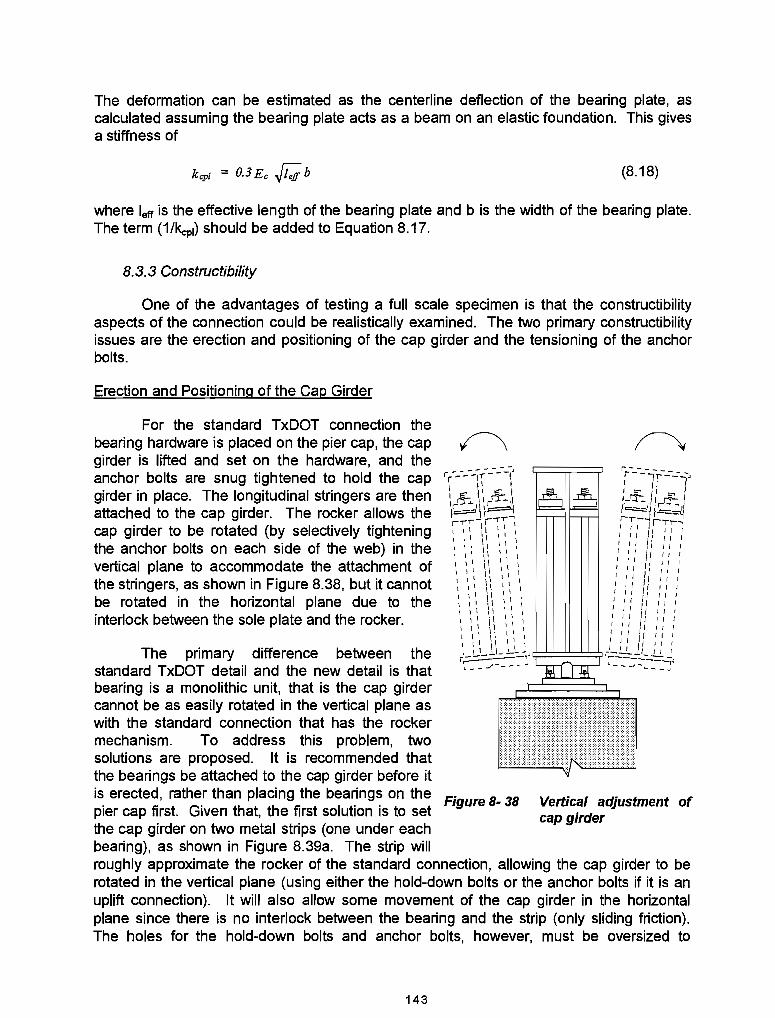
The deformation can be estimated as the centerline deflection of the bearing plate, as calculated assuming the bearing plate acts as a beam on an elastic foundation. This gives a stiffness of
kepi = 0.3 Ec .[i; b (8.18)
where leff is the effective length of the bearing plate and b is the width of the bearing plate. The term (1/kepl) should be added to Equation 8.17.
8.3.3 Constructibility
One of the advantages of testing a full scale specimen is that the constructibility aspects of the connection could be realistica"y examined. The two primary constructibility issues are the erection and positioning of the cap girder and the tensioning of the anchor bolts.
Erection and Positioning of the Cap Girder
For the standard TxDOT connection the bearing hardware is placed on the pier cap, the cap girder is lifted and set on the hardware, and the anchor bolts are snug tightened to hold the cap girder in place. The longitudinal stringers are then attached to the cap girder. The rocker allows the cap girder to be rotated (by selectively tightening the anchor bolts on each side of the web) in the vertical plane to accommodate the attachment of the stringers, as shown in Figure 8.38, but it cannot be rotated in the horizontal plane due to the interlock between the sole plate and the rocker.
The primary difference between the standard TxDOT detail and the new detail is that bearing is a monolithic unit, that is the cap girder cannot be as easily rotated in the vertical plane as with the standard connection that has the rocker mechanism. To address this problem, two solutions are proposed. It is recommended that the bearings be attached to the cap girder before it is erected, rather than placing the bearings on the f::l'gul1e 8- 38
r. Vertical adjustment of pier cap first. Given that, the first solution is to set cap girder the cap girder on two metal strips (one under each bearing), as shown in Figure 8.39a. The strip will roughly approximate the rocker of the standard connection, allowing the cap girder to be rotated in the vertical plane (using either the hold-down bolts or the anchor bolts if it is an uplift connection). It will also allow some movement of the cap girder in the horizontal plane since there is no interlock between the bearing and the strip (only sliding friction). The holes for the hold-down bolts and anchor bolts, however, must be oversized to
143

Figure 8- 39 Setting of bearing on pier cap
accommodate the movement. Once all of the stringers are in place the bearing, grout is used to prevent corrosion and to stabilize misalignment. The second solution, shown in Figure 8.39b, is to use levelling nuts under the bearing. This will allow a more precise adjustment of the cap girder, but it may difficult to tum the nuts if the dead load is too great. In addition, the flange will bend due to the axial load in the web and it must be checked.
The standard TxDOT connection simply sits on a 1/4 inch thick preformed fabric pad; no grout is used under the bearing plate. As a result, the groove in the sole plate and the rocker pin may be misaligned. This is why is seems uhjustified that the surfaces are machined with such precision (see Section 5.2.2). A type of misalignment was noted in erecting the test specimen cap girder; it had a distorted bottom flange and as a result it could not be levelled properly without using a grouting material. The wide-flange bearings will not have perfectly parallel flanges, so it would be very difficult to get a level cap girder by setting the bearings only on preformed fabric pad. The grouting process mentioned above would take care of any misalignment problems.
Tensioning the Anchor Bolts
The initial intent for tensioning the anchor bolts necessary for an uplift resistant compression was to use a partial height stiffener and do the tensioning within the depth of the cap girder. The height necessary for the standard tenSioning jacks, however, will preclude this option. It was necessary for the full scale tests to drill a hole through the top flange of the cap girder and do the tensioning from there (see Figure ~.9). A spacer had to be fabricated to prevent bending of the top flange. It is recommended that the anchor bolts extend through holes in the top flange and that the tenSioning be done from that point. The stiffeners will have to extend the entire depth of the cap girder web and must bear against the top flange to prevent its bending. It was explained, however, in Chapter 5 that requiring a tight fit to both the top and bottom flange by one stiffener is time-consuming and expensive. Therefore, a stiffener detail is proposed that would provide a tight fit to both flanges but would use two sets of stiffeners instead of one. The detail is shown in Figure 8AOa. The long lower stiffeners would have a tight fit to the lower cap girder flange and resist the compressive bearing loads. The short upper stiffeners would bear against the top flange of the cap girder and resist the anchor bolt bearing forces. The upper stiffeners should be long enough to allow the stiffener forces to be transferred to the cap girder web through the weld. The upper stiffeners should also extend below the uppermost pOSition of the clip angle connections to the longitudinal stringers; this will reduce the out-of-plane web flexure of the cap girder above the termination of the lower stiffeners. For the connection in which no uplift is present and the anchor bolts are not needed, only the lower set of
144

UPUFT NO UPLIFT
"';:.
....
I: " y
'"
~ ~
'4
Figure 8·40 Recommended connection details
.c::
"7
stiffeners is required and they should extend the full depth of the web, cut just short of the top flange. This is shown in Figure 8.40b. By extending the lower stiffener up to near the top of the top flange, the potential fatigue problem at the stiffener termination point is eliminated .
8.3.4 Design of Bolt Anchorage
The determination of the capacity of the bolt anchorage was not part of this research. It may be noted that there was no evidence of any problems in either the Phase I tests or the Phase II tests. There are
two failure modes related to the anchorage capacity of the concrete; one is the pull-out capacity of the anchor bolt, in which the anchor bolt pulls out of the concrete. This leaves the concrete mostly intact. The second failure mode is the break-out capacity of the concrete, in which a bolt or group of bolts breaks out a cone of concrete. The first failure mode can be prevented by providing sufficient bearing area for the anchoring nut or plate. The second failure mode cannot occur if the anchor bolts are pretensioned and the pretension load is not exceeded. A procedure for determining the capacity of a bolt anchorage has been developed by Shipp and Haninger [17].
145

146

CHAPTER 9
PHASE /I CONCLUSIONS
9.1 CONCLUSIONS
Bearing Compression Tests
The bearing compression tests showed that the wide-flange web buckles essentially as column and that the buckling loads were in the inelastic and strain hardening range. A procedure was developed such that the web could be designed using a simple interaction equation by limiting the slenderness ratio of the web. The tests also showed that the design procedure that TxDOT uses for design of the bearing plates is conservative and not based on the actual bearing stress distribution. A method was developed for a more realistic design of the bearing plates, treating them more properly as a beam on an elastic foundation, that takes into account the actual bearing stress distribution.
Fatigue Tests
The fatigue tests showed that a wide-flange bearing subject to an out-of-plane shearing load could be treated as a category A detail. Because a category A detail rarely controls the design of a bridge member, fatigue should not be a concern in the new detail. The tests also showed that for calculating the out-of-plane shear stiffness of the bearing, the height of the bearing can be taken as h = d-2t,.
Longitudinal Direction Tests
The longitudinal direction tests showed that the rotation is a linear function of the moment and that the elements in the connection resist moment in proportion to their rotational stiffness. The tests showed that stresses developed at the stiffener termination pOint that may be high enough to cause a concern regarding distortion-induced fatigue cracking. Relatively simple equations were developed for calculating the forces and moments in the wide-flange sections that result both from longitudinal rotation and temperature.
Transverse Direction Tests
The transverse direction tests showed that the new connection may used in situations in which uplift occurs. The connections behaved qualitatively as expected and that pretensioning of the connections will reduce substantially the tensile stress range in the anchor bolts. There was no reduction in the compressive load carrying capacity of the bearing webs as a result of the eccentric loading produced by the cap girder. Pretensioning of the connections increased the rotational stiffness of the connection system.
147

9.2 COMPARISON WITH STANDARD TxDOT CONNECTION
Economic Comparison
A primary objective of the research was to develop a more cost-effective connection design. The cost of test specimens used in the Phase I and Phase II full scale tests were used as the basis of comparison. The following items were used in the cost estimates:
• Plate Girder
• Stiffeners
• Bearing Hardware
• Anchor Bolts and Anchorage
• HOld-Down Bolts
The cost of the Phase I connection, representing the standard TxDOT connection, given in both absolute and relative terms, is shown in Table 9.1. The connection details account for 64% of the connection cost. Of this, the stiffeners comprise 41 % and the bearing hardware comprises 50% of the cost. It should be noted, however, that the cap girder used in the tests is about half the length that it would be in the field, so the percentages listed in table will be reduced for the connection details. If the costs are computed on the basis of dollars per pound, the following breakdown occurs:
• Bare Plate Girder:
• Anchor Bolts, Anchorage:
• Bearing Hardware:
• Stiffeners:
• Total:
$0.78/Ib
$ 1.00 lib
$1.40 lib
$ 1.89 lib
$ 1.1311b
The bearing hardware and the stiffeners are the most expensive components of the system on a per unit weight basis; this reflects the welding and machining necessary for the fabrication of the elements.
Table 9~ 1 Cost Analysis of Phase I Connection
11 EM ABSOLUTE COST RELATIVE COST Bare Plate Girder 2,978.29 36% Stiffeners Welded to Plate Girder 2,125.08 26% Bearing Hardware 2,615.91 32%
2 Rocker Plates 669.97 26% 2 Top Bearing Plates 968.47 37% 2 Middle Bearing Plates 432.13 16% 2 Bottom Bearing Plates 545.34 21%
!Anchor Bolts and Anchorage 529.41 6% 8-1.5" f A36 Galvanized rod 342.72 65% 8 Nut-Washer Plates 137.25 26% 24-1.5" f Galvanized HH Nuts 49.44 9%
Hold-Down Bolts 29.28 0% TOTAL $8,278
148

The major difference between the Phase I connection and the Phase " connection is that a wide-flange bearing section replaces the bearing hardware and that the anchor bolts are not necessary for the new detail if uplift does not occur. The no uplift connection will be used as the basis of comparison. The upper stiffeners were also not present in the Phase" connection. The cost of the Phase I stiffener detail was reduced by 30% to arrive at an estimate of the cost for the Phase " stiffener detail. The bearing used for the Phase II connection estimate was a two foot long W14X550, which has a web thickness (2.38") close to the thickness of the rocker pin used in the Phase I connection. It was assumed that the section cost $0.50 per pound. The cost analysis of the Phase II connection is shown in Table 9.2. The analysis shows that new detail is less expensive than a comparable standard TxDOT detail. The major savings comes from the replacement of the bearing hardware with the wide-flange section, a reduction in cost from $2616 to $1100, from $1.40 per pound to $0.50 per pound.
Table 9· 2 Cost Analysis of Phase II Connection
ITEM ABSOLUTE COST RELATIVE COST Bare Plate Girder 2,978.29 53% Stiffeners Welded to Plate Girder 1,478.50 27%
70% of Phase I Bearing Hardware 1,100.00 20%
2- W14X550 @ $0.50 lib 1,100.00 20% Hold-Down Bolts 29.28 0% TOTAL 5,586.00
General Comparison
The advantages of the new detail are that it
• can be used to resist uplift
• is redundant with respect to uplift (both the wide-flange bearing and the anchor bolts (threadbars) can resist uplift)
• needs no anchor bolts if uplift does not occur
• is less expensive and less labor intensive to fabricate
The major disadvantage of the new detail is that it cannot simply be set on the pier cap as is the standard TxDOT detail. It must be grouted in place.
With regard to the performance aspects of the two connections, the new detail is obviously superior to the standard TxDOT connection in that it can resist uplift. It may, however, become impractical to use the new detail for connections that must resist extremely high compression loads. The maximum web thickness of a rolled section is limited, but the rocker pin can be made in almost any thickness.
149

150

CHAPTER 10 DESIGN PROCEDURES
10.1 DESIGN PROCEDURE, NO UPLIFT
There are three basic steps in designing the new detail; determine the loads on the bearings, design the wide-flange bearing section, and design the stiffener detail. Design examples for the new connection detail are given in Appendix E. All length units are inches and all force units are kips (unless otherwise specified).
10.1.1 Determine the Loads on the Bearings
There are six load groups that are relevant to the design of a cap girder and its bearings; they are listed in Table 10.1. A description of the loads is given in Section 1.4.2. The first column shows the load group number as given in Table 3.22.1A of the AASHTO code; the second column shows the direction of the load; the third column shows the load combinations for each load direction; the fourth column shows the percent of the basic unit stress that may be used in the design. Load Group I is the basic gravity load case; Load Group II checks overtuming due to wind load; Load Group III is Group I plus the wind
Table 10. 1 Load Combinations
LOAD LOAD LOAD COMBINATIONS % BASIC GROUP DIRECTION UNIT STRESS
VERTICAL D + (L+I)n + CF I LONGITUDINAL - 100
TRANSVERSE CF VERTICAL D+W
II LONGITUDINAL . 125 TRANSVERSE -VERTICAL D + (L+I)n + CF +O.3W + WL
III LONGITUDINAL 0.3W+WL+LF 125 TRANSVERSE CF +O.3W+WL VERTICAL D + (L+I)n + CF
IV LONGITUDINAL T 125 TRANSVERSE CF VERTICAL D+W
V LONGITUDINAL T 140 TRANSVERSE -VERTICAL D + (L+l)n + CF + 0.3W + WL
VI LONGITUDINAL 0.3W+WL+ LF+T 140 TRANSVERSE CF+ O.3W+WL
151

loads, with an increase in the allowable stresses of 25%; Load Groups IV, V, and VI include the load combinations of the first three groups plus temperature, with a larger increase in the allowable stress.
The determination of the various loads was illustrated in Appendix A and will not be repeated here. The only load that cannot be determined prior to the beginning of the design process is the horizontal force due to temperature change. The horizontal shear stiffness of the bearing is needed before the temperature-induced force can be determined.
10.1.2 Design of Wide-Flange Bearing
Size the Bearing Web
1. Determine the section size 0N12 orW14) and establish the minimum web thickness.
h..{F; t >-\1/- 60
2. Size for Group I loading, axial load only.
p fa = - ~ 0.472Fy
b t\l/
Check Design for Remaining Load Cases
1. Calculate longitudinal direction stiffness constants
2. Determine horizontal displacement due to temperature change.
IlT = Lcs (.0003) 2
152
(10.1)
(10.2)
(10.3)
(10.4)
(10.5)
(10.6)

• The term 0.003 represents the temperature change, 50°F, times the coefficient of thermal expansion, 6.5E-61 of.
3. Calculate maximum bending stress in bearing due to temperature change.
M=
M fb =-Sbearing
(10.7)
(10.8)
4. Calculate maximum bending stress in bearing due to LF (longitudinal force).
M= LF PM kM
5. Check interaction equations and resize bearing if necessary.
Group III fa + fb S 1.25 OA72Fy O. 55 Fy
fa + fb S 1.25 OA72Fy O. 55 Fy
Group IV
fa + fb S 1.40 OA72Fy O.55Fy
Group V
Group VI: fa + fb S lAO OA72Fy 0.55 Fy
Check Bottom Flange for Bearing
1. Determine length of bearing flange effective
if ( )a7S
5 Es P leff = 3.2 -
Ec 0.55Fy b
153
(10.9)
(10.10)
(10.11)
(10.12)
(10.13)
(10.14)
(10.15)

2. Check flange thickness
3. Check bearing stress on concrete
p / =- </ ba - a'
Jeff b
Check Fatigue of Bearing
1. Determine Stress Range
M = f3 M ar
M Sr =-
Shearing
2. Check Stress Range Against Allowable
2.2St < Sa , 1.1Sr < Srp
(10.16)
(10.17)
(10.18)
(10.19)
(10.20)
• ar is the rotation range caused by the live load (or fatigue truck, see below), St is the tensile stress range (check against at, rotation range that produces tensile stress range), Sc is the compressive dead load stress, Sr is the total stress range caused byar, and Srp is the permissible stress range (category A detail).
• Equation 10.20 from "Guide Specifications for Fatigue Design of Steel Bridges," AASHTO, 1989. [1]
10.1.3 Design Bearing Stiffeners
This procedure is well established and has not been modified for the new detail. See Appendix A for sample calculations. The stiffeners should extend the full depth of the cap girder web, cut just short of the top flange.
10.1.4 Connection of Bearing to Pier Cap and Cap Girder
Since there is no uplift on the bearing the connection details used for the standard TxDOT connection should suffice. The erection and grouting procedures were explained in Section 8.3.3.
154

10.2 DESIGN PROCEDURE FOR UPLIFT
Prior to the design of the uplift connection, the bearing size should be determined using the procedure described in Section 10.1.
10.2.1 Determine the Uplift Load
Uplift Force (T~) Calculated as Largest of:
1. of calculated uplift, with live load plus impact increased by 100%
2. of calculated uplift at working load levels
• . the uplift resisting elements are designed at 150% of allowable basic stress
3. For fatigue loads, use 100% of live load (or fatigue truck [1] )
10.2.2 DeSign Uplift Resisting Elements
Hold-Down Bolts
To = 1.5 n (0.55 Fy At) 2= T"p
Wide-Flange Bearing
To = 1.5 (0.55 Fy b t'tll) 2= T"p
Anchor Bolts
To = 1.5 n (0.66 Ipu Aps) 2= Tup
Connection Between Bearing Top Flange and Cap Girder
(10.21)
(10.22)
(10.23)
• Recommend using fillet weld all-around, as is done with the standard TxDOT detail. Size weld to resist uplift load T up'
Design Anchorage
Recommend using "Design of Headed Anchor Bolts" by J.G. Shipp and E.R. Haningert Engineering Journal, AISC t Second Quarter 1983. [17]
Check capacity and development length of vertical steel.
10.2.3 Determine Pretension Force
Bo = TD + TL
To is the working dead load uplift force, T L is the working live load uplift force
155

10.2.4 Check Fatigue of Anchor Bolts
Calculate Connection Stiffnesses
1. Anchor Bolt
(10.24)
• . 4 is the free length of the anchor bolt plus one-half of the embedded length
2. Cap Girder and Stiffeners
k - E ( AM + Aweb) gird - hw (10.25)
3. Wide-Flange Bearing
b tw Es kb_ = h (10.26)
4. Concrete
( Abf!4t' + Aanch) Ee k ccnc = ~=----'-'=:';":"""""'''';;'' 2 Ld
(10.27)
5. Concrete Under Bearing Plate
kepI = 0.3 Ec .rz;; b (10.28)
6. Total Compression Element Stiffness
[ Jl
1 1 1 1 kc = -+ -+ -+-
k gird k beQl" k cone kepI (10.29)
Transverse Direction
Tr = n Aps Srp [ 1 + :: ] > TL (10.30)
• . T L is the working live load uplift; the live load uplift from the fatigue truck may also be used (see Guide Specs cited above)
156

Longitudinal Direction
Sr = d to 9r < Srp Aps
(10.31)
• . Check Against Category E detail at 2 million cycles (for truck loading)
• . d is distance from centerline of bolt to centerline of cap girder web
Since holes must be drilled in the top flange of the cap girder to accommodate the anchor bolts, it should be checked for fatigue as well, as a category B detail.
10.2.5 Design Bearing Stiffeners
1. Use split stiffeners that bear against the top and bottom flanges of cap girder. Length of top stiffener should be sufficient to transfer load through weld to cap girder. Upper stiffeners should also extend below the top of the clip angle connection.
2. Lower stiffeners should extend to bottom of upper stiffeners.
10.3 DESIGN PROCEDURE FOR STANDARD TxDOT CONNECTION
10.3.1 Design of Bearing Plates
The design procedure for the standard TxDOT connection is modified from the current design procedure by designing the bearing plates using Equations 10.15, 10.16, and 10.17. The top bearing and rocker pin may also be replaced with the half-section of a wide-flange, as shown below.
cJb-·[~~· 10.3.2 Design of Neoprene Bearing Pad
The neoprene bearing pad used in series with the anchor bolt can be sized based on the pretension force (using tum-of-the-nut method) in the bolt. It is recommended that a 1 inch thick, 70 durometer pad be used.
Determine Stiffness of Bearing Pad-Anchor Bolt System
1. Determine Compressive Stiffness of Bearing Pad
Ep = 3G (1 + 2CS2 )
157

• . G is the shear modulus, use 150 psi for 70 durometer pad
• . C is a constant that is 0.55 for a 70 durometer pad
• . S is the shape factor, compressed area divided by area free to bulge
• . Ep is given in psi; estimate size of pad to determine shape factor
• tp is the thickness of pad, use 1 inch
2. Determine Axial Stiffness of Anchor Bolt
• Lb is free length of anchor bolt plus one-half of embedded length
Determine Pretension Force in Anchor Bolt
Bo = number of turns past snug / pitch
[L + :.]
• Bo is the pretension force in one anchor bolt
Check Stress in Bearing Pad
fa = Bo ~ 880 lbs per square inch Ap
• allowable stress in non-reinforced pad with no shear is 880 psi (AASHTO 14.4.1.1)
158

CHAPTER 11
REINFORCED CONCRETE PIER CAPS UNDER CONCENTRA TED BEARING LOADS
11.1 INTRODUCTION
A schematic of the bridge support detail used by the Texas Department of Transportation (TxDOT) when space is limited is shown in Figure 11.1. Compressive load is transferred from the steel bent to the pier cap through bearing plates whose reactions do not lie within the column so the pier cap design must consider shear. The objectives of this phase of the research are a determination of the strength and behavior of the reinforced concrete pier cap under compression loads, and the formulation of design recommendations for the pier cap.
PROJECTION OF BEARING SURFACE
p p The steel bent cap BASE PLATE typically is supported on disc
bearings, pot bearings, or bearing plates which are subject to factored loads on the
---PIER CAP order of 2,000 kips. All of these supports are relatively
__ COLUM
small compared to the area on top of the pier cap, and place highly concentrated compressive loads on the top of the reinforced concrete pier cap.
Figure 11·1 Application of bridge loads to the pier cap There are two basic problems to sol.ve with respect to these concentrated loads. First, the
concrete under the bearing plate must not crush. Second, the concentrated loads on the pier cap must be transferred to the column. The design for bearing capacity is discussed in Chapter 6. The design of the pier cap region to allow transfer of load to the column is more difficult since it is an atypical section whose design is not explicitly covered in design codes. With the bearing placed outside of the interior of the column, the load is slightly eccentric to the column as shown in Figure 11.2. For the piers studied, the shear span is very small, with a span to depth ratio below 0.1. For reinforced concrete cantilevers with such small span to depth ratios, loads will be transferred primarily by the action of a tied arch (25). However, existing code provisions focus on the capacity of concrete in shear, not arching action. Thus, a design based on existing code provisions will be overly conservative because concrete can carry much less load in shear than in direct compression.
159
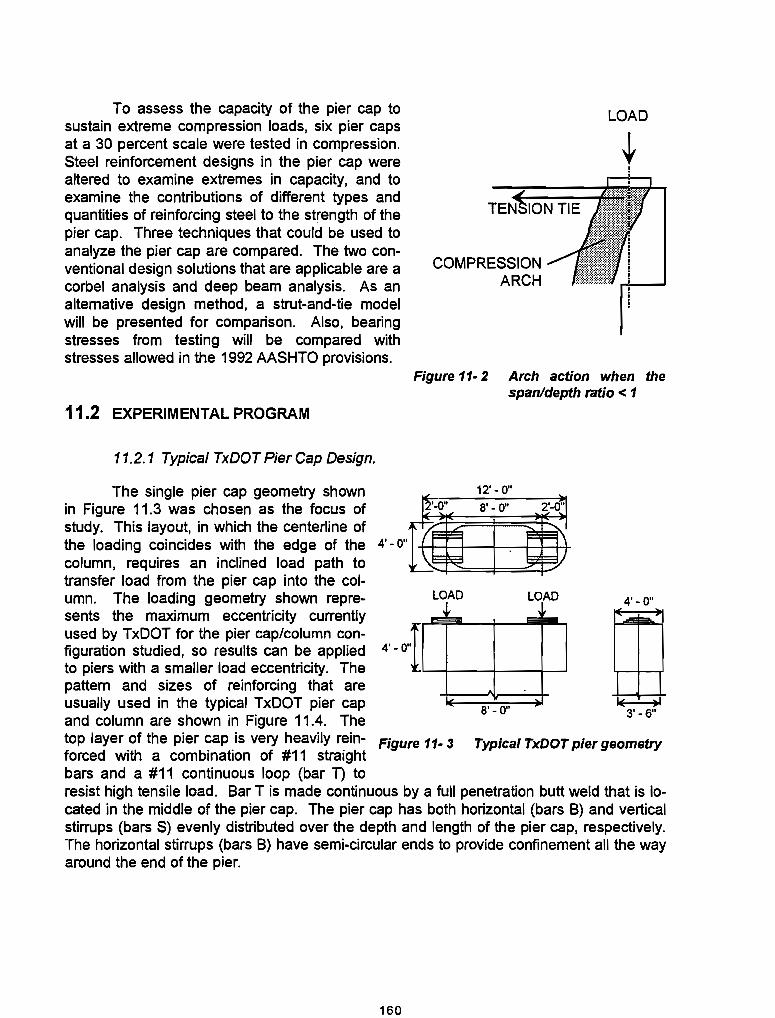
To assess the capacity of the pier cap to sustain extreme compression loads, six pier caps at a 30 percent scale were tested in compression. Steel reinforcement designs in the pier cap were altered to examine extremes in capacity, and to examine the contributions of different types and quantities of reinforcing steel to the strength of the pier cap. Three techniques that could be used to analyze the pier cap are compared. The two conventional design solutions that are applicable are a corbel analysis and deep beam analysis. As an alternative deSign method, a strut-and-tie model will be presented for comparison. Also, bearing stresses from testing will be compared with stresses allowed in the 1992 AASHTO provisions.
11.2 EXPERIMENTAL PROGRAM
11.2.1 Typical TxDOT Pier Cap Design.
The single pier cap geometry shown in Figure 11.3 was chosen as the focus of study. This layout, in which the centerline of the loading coincides with the edge of the 4' - a" column, requires an inclined load path to transfer load from the pier cap into the col-umn. The loading geometry shown repre-sents the maximum eccentricity currently used by TxDOT for the pier cap/column configuration studied, so results can be applied to piers with a smaller load eccentricity. The pattem and sizes of reinforcing that are usually used in the typical TxDOT pier cap and column are shown in Figure 11.4. The
LOAD
Figure 11· 2 Arch action when the span/depth ratio < 1
12' -0"
LOAD LOAD 4'-0"
~I 8' -0" 3' _6"
top layer of the pier cap is very heavily rein- Figure 11- 3 Typical TxDOT pier geometry forced with a combination of #11 straight bars and a #11 continuous loop (bar n to resist high tensile load. Bar T is made continuous by a full penetration butt weld that is located in the middle of the pier cap. The pier cap has both horizontal (bars B) and vertical stirrups (bars S) evenly distributed over the depth and length of the pier cap, respectively. The horizontal stirrups (bars B) have semi-circular ends to provide confinement all the way around the end of the pier.
160

u
A.
8 E. S. = 4' ·6"
COLUMN SECTION TOP REINFORCING
2'·0" 8 E. S ... S' - 0" 2' • 0"
B
BOTTOM REINFORCING
V extend 3' - 6~
min. into cap Z1 • 12" max. spa.
CAP DETAILS
PIER ELEVATION
6' - 6 112"
BARSB BARSS BARSU
S' - 0" 3' - 5 314" 3 11Z'
[~ cUl= =d + :;; + i ~ "'J~ <t. 01 &tnJc:lLl'e.' I _. _
I C') IC') •
Splice shaillMI made by BARS Z1 _M lull penetration butt VMld. S'
BARST BARSZ2
EAR A 8 S T U V Z1 Z2
Figure 11· 4 Typical TxDOT pier steel reinforcing pattern
161
SIZE
#11 #6 #5
#11 #6 #Q
#4 #4

11.2.2 Description of Test Specimens
The geometry of the typical TxDOT detail was used as the reference for design of the test specimens. Model specimens were constructed at approximately a 30% scale so that test machines available in the laboratory could be used to load the specimens. The final pier size used for all the scale test specimens is shown in Figure 11.5. Note that the test specimens have a column width equal to the pier cap width. This larger column size will slightly increase the strength of the test specimens by providing a slightly greater area over
50 - 1/2"
14-1/2 ++-+--+--t-:-i'-+--++
LOAD LOAD
36"
BASE PLATES 8-3/4" x 8-
14-1/2" r'i::r--!I
which to transfer load from the pier cap Figure 11· 5 to the column. Rebar sizes for the scale
Geometry of the test specimens
specimens were obtained by choosing the size rebar with an area closest to Table 11.1 30% of the full size of the rebar. Table 11.1 shows the sizes of the rebar used
Rebar Sizes for Full-Size Piers and Test Specimens (see Figure 11.4 for bar layout)
in the standard scale specimens, and the actual scale (based on area) of the rebar used. The hooped stirrups in the column (bars Z) are not at an appropriate scale because a minimum number of rebar sizes was desired. This discrepancy in scale was accepted since the column stirrups will have a negligible effect on the strength of the pier cap.
Six specimens were cast, all
Bar A B S T U V Z
Full Size Test Specimens Actual Scale #11 Ab=1.56 in2 #6 Ab=0.44 in2 28.20% #6 Ab=0.44 in2 #3 Ab=0.11 in2 25.00% #5 Ab=0.31 in2 #3 Ab=0.11 in2 35.40% #11 Ab=1.56 in2 #6 Ab=0.44 in2 28.20% #6 Ab=0.44 in2 #3 Ab=O.11 in2 25.00% #11 Ab=1.S6 in2 #6 Ab=0.44 in2 28.20% #4 Ab=O.20 in2 #3 Ab=0.11 in2 55.00%
using the exterior dimensions shown in Figure 11.5. The layout of steel reinforcing for each specimen is detailed below.
SPECIMEN A2 (Standard)
• all rebar sizes in this specimen were scaled directly from the standard detail, using the rebar sizes listed in Table 11.1
• this specimen is referred to as the standard specimen
• the steel detail used for this specimen is shown in Figure 11.6
• bars U were inadvertently placed outside of bars B as shown in Figure 11.7
162

7 E. S. =21-112"
COLUMN SECTION
A
TOP REINFORCING
7-1/4" 7 E. S. =3$" 7·114"
t.1/2"C 3 E.S. ···1 !+I:ri=I=##+=t'Wl = 11·314" _
1.1/4" I:!.b!;~;;:;i;al;~ii!=!t:±:!:!:j Zi
PIER ELEVATION
30"
BAASB
T
13"
BOTTOM REINFORCING
CAP DETAILS
~ ~L i-B-AA,.-S-S',.T. BARS U
s
Figure 11- 6 Steel reinforcing detail for the standard lOcale specimen (PierA2)
bar T I
bars U --l
- - "'~bars bars B
S
IMPROPER PLACEMENT OF BARS U
bar T
J bars U -
It--- ~bars bars B S
CORRECT LOCATION OF BARS U
Figure 11-7 Improper placement of bars U in Specimen A1 andA2
163

SPECIMEN A1
• this specimen is identical to Specimen A2, except that there are five sets of evenly spaced stirrups in the column portion.
• again, bars U were inadvertently misplaced as shown in Figure 11.7
SPECIMEN B
• the curved loop (bar T) in the top layer of the pier cap was replaced by two straight bars, also #6 bars, as shown in Figure 11.8
I
/
'"
bars A I
II
I
~ ;J
bars 5
• all other reinforcing follows the standard bars U specimen
replacement for bars
SPECIMEN C
• all steel in the top layer of the pier cap was decreased from #6 to #3 bars (bars A and T are now #3 bars)
• since bar T was changed to a #3 bar. it was made continuous by a lap weld, as opposed to the butt weld used for the standard scale specimen. The length of the weld was sized to develop the full ca~ pacity of the bar.
SPECIMEN 0
• all steel in the top layer was decreased in size from #6 to #3 bars (bars A and bars T), and bar T was lap welded as for Specimen C.
• bars U were omitted
• three sets of the pier cap horizontal stirrups (bars B) were omitted
• this detail is shown in Figure 11.9
SPECIMEN E
• bars A in the top layer of the pier cap were reduced to #3 bars
Figure 11- 8 Top layer pier cap reinforcing in Specimen S
1/
( ~
bars A
TOP REINFORCING IN PIER CAP
d bars S
~
bars Z1
PIER ELEVATION
,,~ bars S
J! bars T
/ bars T
I bars B
bar s V extend 3/4" into 11·
Figure 11· 9 Specimen D reinforcing
• bar T was replaced by a pair of overlapping bars B, which were #3 bars
164

Table 11· 2 Measured Material Propetties
Specimens Static Yield Strength of Rebar Concrete Cylinder Compressive Strength #3 bars #6 bars 7 day 28 day strength > 35 days strength
A1 and A2 60.S 60 2939 psi 3905 psi 4050 psi Bthrough E 47.4 60 2820 psi 3554 psi 4016 psi
The different specimens were designed to determine the strength and behavior of the standard detail, and the contribution of different types of reinforcing to the overall strength of the pier. The A specimens provided a direct test of the standard detail, and are used to compare the variability between specimens. Specimen B examines the ability of the looped bar to provide confinement for the end of the pier. Specimen C examines the effect of less top layer reinforcing on the behavior and strength of the specimen. Specimen D is used to set a minimum bound for the strength of the pier cap. Finally, Specimen E considers the necessity of a welded bar in the top layer of the pier cap.
11.2.3 Materials
All bars in the test specimens were either #3 or #6 in size. Specimens were constructed in two sets, so steel for each set of specimens was ordered from the same lot. Static yield strengths obtained from tensile tests on the bars are listed in Table 11.2. For Specimens B through E, the #3 bars had a low yield strength of 47.4 ksi. Inspection of stamps on these bars showed that the bars were not grade 60, but a lower grade of steel.
The concrete design strength for the TxDOT pier caps is 3,600 psi at 28 days, so a 4,000 psi mix was ordered from a local concrete supplier. The concrete had a maximum aggregate size of 3/4-in. to allow placement in the congested rebar cage, and to fit within the 3/4-in. cover. Two different pours were made, with the first pour for Specimens A 1 and A2, and the second for Specimens B through E. The cylinder compressive strengths are shown in Table 11.2. The long term strength is taken as the average of all cylinders tested after 35 days, and represents seven cylinders for Specimens A and 18 cylinders for Specimens C-E.
All specimens were constructed at the Ferguson Lab. The reinforcing cage for Specimen A2 is shown in Figure 11.10. All of the bent bars were ordered from a local fabricator, and met a reasonable tolerance - 3/8-in. for the dimensions. Spacers were placed on rebar parallel to the straight edges of the specimen to ensure equal cover on opposite sides of the specimen. Forms were made right side up, so the effect of bleeding and segregation would be the same as for actual piers. The specimens were poured monolithically, with no construction joint as used in the field.
11.2.4 Test Set-Up and Procedure
The test set-up was designed to allow two tests on each specimen. The configuration for applying load to the specimen is shown in Figure 11.11. The specimen and spreader beam were placed inside the frame of a 600-kip load machine as shown in Figure 11.12. The test machine was fitted with a swivel head so rotation of the girder would not
165
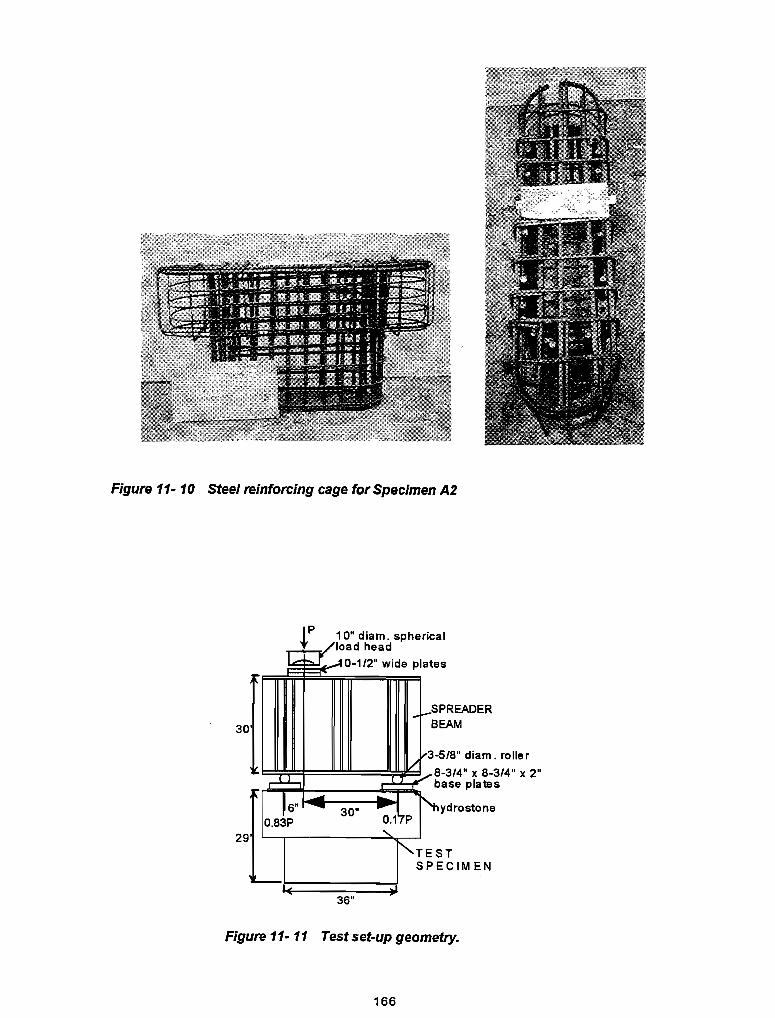
Figure 11· 10 Steel reinforcing cage for Specimen A2
30
29 .
~p 10" diam. spherical load head
l.=:: ~.-40-1/2" wide plate s
r- .c:""""" 1 • 6" ~ 30"
0.83P
36"
~I-S B
PREADER EAM
v3-1/ _8
r-!--f" b
5/8" diam. roller
-3/4" x 8-3/4" x 2" ase plates
_I
~ - ydrostone 0.1 P
" f'TE ST
ECIMEN SP
Figure 11· 11 Test set-up geometry.
166

Figure 11 .. 12 Test specimens in the test machine.
be restrained. A spreader beam was used to place load from the test machine on each end of the pier cap to prevent overturning of the specimen. The loading head of the 600-kip machine was offset from the centerline of the spreader beam to place most of the load at one end of the pier. The 3-5/8-in. diameter rollers under the spreader beam place two distinct line loads on the base plates. By idealizing load from the test machine as a line load on the spreader beam, the test setup is statically determinant. The end of the pier cap with the smaller portion of load did not sustain any damage while the opposite end was tested, so test results for the two ends of the specimens are directly comparable. Once one end of the pier was tested, the specimen was repositioned on the floor of the test machine and the other end of the specimen was tested.
Loading was applied in discrete increments, typically 20 to 30 kips on the linear portion of the 10ad-deHection curve. After an increment in load was applied, about five minutes passed while cracks were marked and inspected. At the end of this delay, load and deflection readings were taken electronically, giving the static capacity. The next load step was then applied. The first test on a specimen was stopped shortly after the peak load had been reached to avoid excessive damage to the specimen which could affect the second test. For Specimens B through E, the second test on the specimen was run to large deflections to examine the specimen ductility.
Specific details on the deflection instrumentation and strain gages are given in the detailed report (6).
167
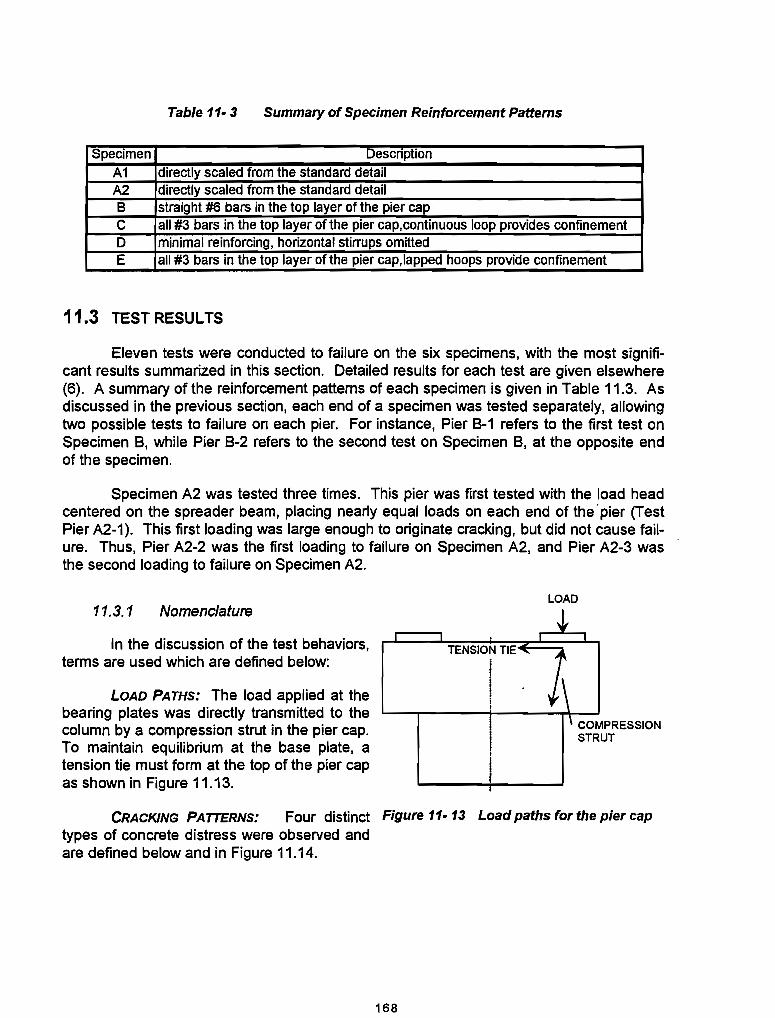
Table 11· 3 Summary of Specimen Reinforcement Patterns
SpeCimen Description A1 directly scaled from the standard detail A2 directly scaled from the standard detail B straight #6 bars in the top layer of the pier cap C aU #3 bars in the top layer of the pier cap,continuous loop provides confinement D minimal reinforcing, horizontal stirrups omitted E all #3 bars in the top layer of the pier cap,lapped hoops provide confinement
11.3 TEST RESULTS
Eleven tests were conducted to failure on the six specimens, with the most significant results summarized in this section. Detailed results for each test are given elsewhere (6). A summary of the reinforcement patterns of each specimen is given in Table 11.3. As discussed in the previous section, each end of a specimen was tested separately, allowing two possible tests to failure on each pier. For instance, Pier B-1 refers to the first test on Specimen B, while Pier B-2 refers to the second test on Specimen B, at the opposite end of the specimen.
Specimen A2 was tested three times. This pier was first tested with the load head centered on the spreader beam, placing nearly equal loads on each end of the' pier (Test Pier A2-1). This first loading was large enough to originate cracking, but did not cause failure. Thus, Pier A2-2 was the first loading to failure on Specimen A2, and Pier A2-3 was the second loading to failure on Specimen A2.
11.3.1 Nomenclature
In the discussion of the test behaviors, terms are used which are defined below:
LOAD PATHS: The load applied at the bearing plates was directly transmitted to the column by a compression strut in the pier cap. To maintain equilibrium at the base plate, a tension tie must form at the top of the pier cap as shown in Figure 11.13.
TENSION TIE
I I
LOAD
COMPRESSION STRUT
CRACKING PATTERNS: Four distinct Figure 11·13 Load paths for the pier cap types of concrete distress were observed and are defined below and in Figure 11.14.
168

• Flexural Cracks. Flexural cracks were seen extending across the top of the pier, and sometimes extended down the face of the pier as shown as failure "A" in Figure 11.14. These cracks are observed on the tension side of a reinforced concrete beam tested in bending.
TYPES OF CONCRETE DISTRESS:
• Flexure/Shear Cracks. These cracks were observed on the top and faces of the pier cap, shown as failure "S". The flexural com
C
A
ELEVATION VIEW
A - FLEXURAL CRACKS B - FLEXURE/SHEAR CRACKS C - SHEAR CRACK D- CRUSHING
ponent typically originated be- Figure 11. 14 Patterns of concrete distress tween the edges of a base plate, and the component on the top of the pier cap only extended from the base plate to the edge of the pier.
450.---...----r---...----.......--..,.--..,.----,
400
1350 & 300
-. .~ .. --+--+-
~2M .=:.:..:.....;:...::-r:G_1NS::.- i. j
~ 200 +----,.ii;----:'-==== ~ 150 -I--IV--i--+li3 a:
SEeN - ---t----t---;
°0 0..05 0.1 0.15 0.2 025 0.3 (l.35 0.4
DEFLECTION AT UNEAR POT 11 (INCHES)
CRACKING ON THE EAST FACE OF SPECIMEN A1·1
POINT'S" RESULTANT LOAD. 186 kips
1..1'11
CRACKING ON THE EAST FACE OFSPECIMENA1·1
POINT'C" RESULTANT LOAD .. 269 kips
Figure 11·15 Load·deflection behavior for Pier A1·1
169
The

cracks formed a small flexural component on the face of the pier (up to about three inches long) before the crack sloped in towards the center of the pier. These cracks typically grew to extend across the depth of the pier cap.
• Shear Cracks. These inclined cracks formed on the faces of the pier cap as shown as failure "C". The shear cracks were distinguished from flexure/shear cracks as they had no flexural component when they initially formed. A crack that began as a pure shear crack would often extend across the depth of the pier cap so that it eventually resembled a flexure/shear crack.
• Crushing. Crushing of concrete was located at the interface between the pier cap and column, and is shown as failure "0", The crushing was easily observed, with flaking of the concrete the first indication of failure followed by further spalling of the concrete with additional loading.
11.3.2 Load-Def/ection Behavior
The load-deflection curve and cracking patterns for a typical specimen, Pier A 1-1, is shown in Figure 11.15. The loading curve was initially linear until cracking occurred, then gradual nonlinear behavior began with plastiC behavior seen near the peak load. Cracking loads are shown on the graph, as well as sketches of cracking patterns on the east side of the pier with increasing loads. At pOint "B", cracking had just begun and consisted of small flexural, flexure/shear, and shear cracks. With cracking initiated, existing cracks continued to widen and lengthen, additional cracks formed, and crushing began as shown at point "C". At point "C", the compression strut was defined by the two inclined cracks, but crack widths were still less than 1/32 inch. Additional loads mainly opened the inclined cracks defining the compression strut further, and caused additional crushing at the pier cap/column interface. The failed specimen is shown in Figure 11.16 which shows a well-
Figure 11·16 Crack distribution of Pier A1·1 after failure.
170

defined compression strut and evenly distributed flexural cracking on the top of the pier. At the peak load, the largest inclined crack was 3/16 inches wide, while flexural cracks between the two base plates remained minute. There was also extensive crushing at the cap/column interface as shown in Fig ure 11.17. Loads marked on the specimen are the total load on the specimen, not the resultant load on the tested end of the pier. Figure 11- 17 Crushing of Pier A 1·1 after failure
Plots of resultant load on the tested end against the deflection at linear pot #1 at the top edge of the specimen are shown in Figure 11.18. To reduce clutter, deflections for Pier A2-2 and A2-3 were omitted. Tip deflections in the elastic region were very Similar, showing minimal effect from the different reinforcing patterns used in the pier cap. This similarity was expected, as the initial stiffness of the overhang largely is produced by the small span to depth ratio. Somewhat less stiff than the other piers were Specimens 0 and E. Since Specimen E had a smaller effective concrete strength, this reduced stiffness was expected. Specimen 0 was the least stiff, reflecting the speCimens minimal reinforcement, and the different behavior of Specimen D. Specimen 0 showed more of a flexural failure, with the bending action allowing more deformation than the compression struts formed in the other specimens. For all specimens, detail plots of resultant load against deflection at various locations in the specimens are shown elsewhere (6).
The specimens static ultimate strengths and concrete cylinder strengths on the day of testing are listed in Table 11.4. The specimen strength refers to the resultant load on
the end of the pier being tested, not Table 11· 4 Specimen CapaCities and Concrete the total load applied to the spreader
Strengths beam. Cylinder compressive
Static Cylinder Average Test Capacity Strength Capacity
(kips) (psi) (kips) A1-' 387 3961" 395
A2-2 368 3916 395 A2-3 430 4211* 395 B-1 304 3930 323 8-2 341 3869 323 C-1 299 4141 299 C-2 298 4100 299 0-1 203 4032 209 0-2 214 4021 209 E-1 258 3554 269 E-2 279 3747 269
* - only two cylinders tested
Effective fo
(psi) 4050 4050 4050 4016 4016 4016 4016 4016 4016 3651 3651
Age of Concrete (days)
83
51 69 39 45 85 87 53 74 23 30
171
strengths are the average of three cylinders unless noted. Also shown in Table 11.4 are the average capacities for each set of the specimens, and the "effective concrete strength" for the specimens (effective f:). The effective concrete strength represents an average strength for a concrete pour, and is presented to remove the small variability in concrete strength after prolonged curing.
All specimens except for Specimen E had essentially the same concrete strength, so only results for Specimen E need to be

U; Q..
g c (5 .... ~ ~ :...a :.:::> 1:3 a::
~ S2 -c "" 9 ~ z ~ :.....t ::J ffi a::
450
400
350
300
250
200
150
100
50
PlERA1 ~ 'W ,.
0 1----- ..........
~! PIER 81 \
~ /:1 ~~ -r~ tt-:':IEf C1 .. --..
~l'--;'':::::':t
.A 1 .... ---- ~\----.' ----"': ..... , ' -_ .. -f.
,. /If ..... . ... I PIER E1 I ~.~.~. r ..... ~ .. : .. I l···-;; PIER 01
""'jI ... f g 101
Iii' , . -
. ..,. I i I .. l --r r ! o
o 0.05 0.1 0.15 0.2 0.25 0.3 0.35
DEFLECTION AT LINEAR POT #1 (INCHES)
450 I IPIERAH
400
350
300
250
200
150
100
50
--l. II V-- i
If''' t;7-" · .. -·' ...... ~ .. "' ..... 1 ........ PIERS2' .. ' r ~.~~ ... .:::
ii>?Y·· ..
........ .-.. .- .... -:: ~-- ... - ./ PIERE2 ---
t. /' / .. ......... r-- --.. ~-..... ........... -... _" \ .. -;/ "'-i '''-... -
n ............... , •••• PIERC2 1!1' ./ PIER 02 ~ .......... tI'
T}' J'. ,LP.1 11./1'
W' ...
L, ~ . I I
o o 0.05 0.1 0.15 0.2 0.25 0.3 0.35
DEFLECTION AT LINEAR POT #1 (INCHES)
.--= "'-
. .. -
0.4
~
0.4
Figure 11- 18 Comparison of resultant load vs. deflection at Linear Pot #1
172

normalized. This smaller concrete strength at the time of testing Specimen E was reflected in the capacities for both tests on Specimen E. It was expected that Specimen E would have a strength very similar to Specimen C since the two piers are almost identical. Reinforcement pattems for the two piers differ only in that Specimen C has a continuous loop in the top layer of the pier cap, while Specimen E uses lapped hoops in the top layer as presented in Section 11.2. If the strength of Specimen E is normalized to the effective concrete strength of Specimen C by direct proportioning, its strength is 296 kips (multiply 269 kips by 4016 psi/3651 psi). The normalized strength for Specimen E matches very well with the tested strength for Specimen C, 299 kips.
Table 11· 5 Specimen Cracking Loads The loads at which different
Test Capacity Flexure
A1-1 387 186 A2-2 368 167 A2-3 430 174 8-1 304 166 C-1 299 99 0-1 203 67 E-1 258 118
Cracking Loads (kips) Flexure Shear Shear
154 154 145 205 150 112 166 276 153 168
none 152 152 224
Crushing 269 297 205 291 257 203 258
crack types were first observed on the virgin specimens are listed in Table 11.5. Cracking loads for Pier A2-2 and Pier A2-3 are grouped with the virgin test results since their cracking loads were obtained by examining results from Pier A2-1, which equally loaded the two ends of the pier cap. Typically, flexural and flexure/shear cracks formed at about the same time, followed by
the formation of shear cracks before crushing began. Specimens A 1 and A2 with #6 bars in the top layer had the highest flexural cracking loads, indicating the larger bars could absorb tensile force with less strain than the #3 bars, reducing strain the concrete. Specimen o allowed the earliest formation of flexural cracks, and also had the smallest stiffness as shown by the loading curves. Specimens C and 0 were identical except that Specimen 0 had no intermediate layers of horizontal stirrups. Thus, the layers of horizontal stirrups (bars 8) in the Specimen C help to reduce deflections, limiting the formation of flexural cracks. For specimens other than Specimen 0, flexure shear cracks formed at almost the same load, about 150 kips. This was expected, as all these specimens had the same distribution of horizontal stirrups (bars 8). Crushing loads for specimens other than Specimen o were reasonably close, indicating that the distribution of forces within the specimens was similar up until that point. After crushing began, specimens that could redistribute intemal forces and put more tension in the top layer of steel could add load, while those that could not redistribute loads failed with the onset of crushing.
11.3.3 Failure Modes
The test specimens showed three basic failure modes. The most common failure, seen in Specimens A, C and E, and represented in Figure 11.16, was caused by crushing of concrete in the compression strut and at the cap/column interface. For Specimens A, C, and E, flexure/shear and shear cracks propagated across the depth of the pier cap and began to open with increasing load, limiting the size of the compression strut Eventually the force in the strut caused crushing at the interface. With additional load, inclined cracks opened further and there was additional crushing at the interface and in the strut Eventually, crushing in the strut and at the cap/column interface resulted in failure. For Specimens A 1 and A2, there was considerable strength gain between the onset of crushing at
173

T1<T2
1. INl'TIAt. FORCe DISTRIBUTION 2. COMPReSSION STRUT MOVES FURTHER INTO COLUMN
the interface and the ultimate load. This indicates that the strut rotated in towards the pier cap once crushing began. This new geometry requires a larger force in the tension steel in the top layer of the pier to maintain equi-librium as shown in Figure 11.19. For Specimens C and E, formation of cracks was very similar to the A specimens. However, there was a
Figure 11·19 Redistribution of internal forces in much smaller lag between first the pier cap crushing at the interface and the ulti-
ct,ofroller
2-112"
st ra ig,,----lI+--__ -+-_+__' bars
4-3
mate load. Since SpeCimens C and E had much less reinforcing in the top layer than Specimen A. redistribution of the strut after crushing began was limited.
Specimen B showed a second failure mode. SpeCimen B initially performed like Specimens A 1 and A2, developing inclined cracks on the face of the pier cap. These cracks continued to grow across the depth of the pier and widen as for the A series specimens. However. soon after the onset of crushing the failure load was reached, indicat-ing as for Specimens C and E that additional
Figure 11- 20 Development lengths for top tensile force in the top layer of the pier cap layer reinforcing in Specimen B could not be developed. The inability to de-
velop additional tension in the top layer of reinforcing was the root cause of the failure.
Without the continuous loop (bar n around the end of the pier, the specimen had to develop tension solely through the straight bars which had very small development lengths as shown in Figure 11.20. The lack of development length became evident during testing,
Figure 11· 21 Splitting cracks due to bond distress in Specimen B
174

the pier as shown in Figure 11.21. Aside from reducing the ability to develop tension in the top layer, removal of the continuous loop around the top layer caused two major problems. First, a flexure/shear crack opened very wide at the face of the pier without any reinforcement to limit its growth. Second, when large deflections of the pier cap were forced on test B-2, the base plate began to punch into the cap, pushing out the unconfined concrete around the circumference of the cap as shown in Figure 11.22.
Specimen D, with its minimal reinforcing behaved quite differently than the other specimens with a cracking pattern shown in Figure 11.23. Flexural cracks formed initially, with long components on the faces of the pier. In particular, a flexural crack formed at the interior edge of the base plate. For other specimens, inclined cracked formed near the point of load application, forming a defined compression strut. For Specimen D, however, the cracks in this region were almost vertical, indicating minimal compression strut formation. With increasing loads, the flexural crack at the interior edge of the base plate grew across the depth of the pier. This eliminated the area available for direct transfer of shear, but left a bearing surface at the top of the column to handle strut forces as shown in Figure 11.24. Therefore, in both tests on Specimen D failure corresponded to the beginning of crushing at the cap/column interface since there was no possible redistribution of loads. Essentially, the specimen failed because flexural cracks opened so much that shear could not be directly transferred to the interior of the pier.
Figure 11· 22 Punching of the base plate into Pier 82·2
175

Figure 11· 23 Crack distribution on the face of Pier D·1 after failure.
Inspection of specimens after testing showed two significant behavior pattems of concrete directly under the base plates. First, there was only extremely minor cracking under the base plates due to the confinement provided by the base plate. Flexural cracks that formed on the edge of the pier did not continue under the base plate, but stopped at the edge of the base plate. Second, punching of the base plates into the top of the pier cap was seen to some extent for all specimens. The punching was magnified on the second tests on specimens, which were run to large deformations. While Specimens A 1 and A2 reached much greater loads than Specimens B, E, and C, excellent confinement in the top layer for A series specimens was provided by the #6 continuous loop (bar T) which
minimized punching. While the beginning of punching was seen, punching did not contribute to the failure of specimens and
f-----:'OC-+--:---'--v COMPRESSION became most notable only when damage STRUT to the specimens was forced.
1 11.4 ANALYSIS OF RESULTS
SECTION A-A In this section, test results are summarized and the specimen capacities predicted by different design methods are
Figure 11· 24 Force distribution in Specimen D compared with test results. First, con. after opening of the flexural crack ventional design methods from the 1992
AASHTO provisions and ACI 318-89 (ACI 1989) code are examined. The two design methods most suited to the problem geometry are the corbel and deep beam provisions from AASHTO Section 8.16.6.8 and ACI 318-89 Chapter 11. respectively. Next, the strut-and-tie method is used to predict the pier cap strength using two strut-and-tie models. To demonstrate the use of the strut-and-tie method, a sample design of a full-sized pier cap using this method is presented. The strutand-tie method is also used to predict the strength of a typical pier cap design. Finally,
176

criteria for judging constructed pier caps through field inspection are given. It should be noted that the above approaches for sizing a pier cap and its reinforcing are all design methods. Thus, the use of these methods as analysis tools requires making some judgments to predict the specimen strength based on the actual reinforcement used. The analyses focused on Specimens A and C because those two specimens are most representative of reinforcing that has been and would be used in the pier cap.
11.4. 1 Discussion of Test Results
The ultimate strengths of the test specimens are shown in Table 11.4. Specimen capacity is directly related to the amount of horizontal reinforcing, which is needed to develop the action of a tied arch. The effect of the amount of steel in the top layer of the pier cap is shown by a comparison of Specimens A and C. Specimen A, with #6 bars in the top layer, had a capacity Pu = 395 kips, while Specimen C, with #3 bars in the top layer, had a capacity of P u = 299 kips. The only difference in reinforcing for Specimens A and C is the size of the bars in the top layer. The ability to develop the strength of the bars in the top layer of the cap is also critical. Specimen 8 is identical to Specimens A, except that in the top layer of the pier cap only straight #6 bars are used, resulting in very small anchorage lengths. The small anchorage lengths provided for the top bars of Pier 8 are inadequate to develop the required bar force, as bond distress was observed during testing. The capacity of Specimen 8 was 323 kips, much less than Specimen A capacity.
The quantity and anchorage of steel in the top layer of the pier has a large influence on specimen strength, and the importance of the steel can be explained considering specimen failure modes. As load was increased on a specimen, crushing at the pier cap/column interface eventually occurred. To carry more load, the compression strut has to move further into the column, requiring a larger tie force to maintain equilibrium. In specimens 8, C, D, and E, the capacity of the bars in the top layer of the pier cap was limited, so failure was reached soon after crushing at the pier cap/column interface began.
The placement of the intermediate hoops (bars 8) also has a considerable effect on specimen strength as shown by a comparison of piers C and D. Piers C and D are identical except that bars 8 (and bars U) are removed from Specimen D. Without the intermediate hoops, Specimen D capacity was only 209 kips, as compared to 299 kips for Specimen C. The mechanism by which bars 8 contribute to the specimen capacity is not as clear as for the bars in the top layer of the pier cap. The intermediate hoops closest to the top of the pier see the largest force, so those bars act mainly as tension ties. The intermediate hoops also can resist loads by dowel action.
Examination of the specimens shows that bearing failure did not limit the capacity of any of the specimens, although punching of the base plates was seen on all specimens. The conclusion that bearing strength did not limit pier cap strength comes from a comparison of the concrete damage seen in the first and second tests on a specimen. For the first test on a specimen very limited punching occurred, while for the second test of a specimen in which large deformations were forced, more significant punching occurred. Thus, most of the punching occurs after a specimens capacity has already been reached. For specimens A, which had the greatest capacity. the average bearing stress sustained was 5.16 ksi, or 1.27 I: (I: = 4,050 psi). The bearing strength on top of the pier cap is helped by
177

d
C -ooIII>E~33
the continuous rebar (bar n around the perimeter of the cap, which provides confinement. The bearing stress, fb' sustained can be compared to the load factor design provisions for bearing of AASHTO (1992) Section 8.16 with the <I> factor removed is fb = 1.33 f:. Since the applied bearing stress was Slightly less than the code value, and bearing failure did not occur, no conclusions can be reached regarding the maximum permissible bearing stress. Further testing needs to be conducted to determine the bearing strength at the top of the pier caps.
Forces contributed by horizontal stirrups or ties are neglected
11.4.2 Corbel Analysis
The pier cap geometry studied looks quite similar to a corbel, so the corbel provisions were the first application of conventional analysis to predict specimen capacity. The action of a cor-bel as used in the 1992 AASHTO code is
Figure 11· 25 Force distribution assumed in Corbel Code Provisions (Salmon 1985)
shown in Figure 11.25. The corbel design technique is intended for span to depth ratios less than one, where ordinary flexural theory is not applicable (Salmon 1985, ACI 1989). In the AASHTO (1992) corbel code provisions, the shear strength comes entirely from shear friction.
The AASHTO (1992) code procedure gives an area of steel in the top layer of the corbel based on two checks. The first check considers shear, while the second check considers moment. The intermediate stirrups are sized based on the amount of steel in the top layer of the corbel. For the pier cap geometry chosen. the check.based on shear controls because the moment is extremely small. Using the AASHTO (1992) code as an analysis method gives:
Vn = 1.5Av fy u, the nominal shear strength :s; O.2fc,bdand[800psi]bd
where
Av = the area of steel in the top layer of the corbel
[bars A and T in the specimen]
J.l = coeffiCient offrictionfor normal weight concrete cast monolitically = 1.4
b = the corbel width
d == depth of reinforcing shown in Figure 4.1
178
(11.1)

The multiplier of 1.5 reflects the benefit of the additional layers of stirrups. A comparison of corbel design strengths and the test results for specimens A and C is shown in Table 11.6. For specimen A, the limiting shear strength controlled the corbel design strength. As the results show, the corbel provisions are inadequate to predict pier cap strength because they only consider shear friction to resist applied loads and ignore the inclination of the compression block.
Table 11- 6 Test Specimen Capacity Compared to the Strength Predicted by Conventional Design Methods
Average Test Corbel Design Deep Beam
Specimen Capacity Strength Strength Parameters
(kips) (kips) (kips) Av (in2) fy (ksi)
A 395 151 95 2.2 60 C 299 55 95 0.55 47.4
11.4.3 Deep Beam Analysis
The deep beam provisions in the ACI 318-89 code also appear applicable to the pier cap design. These provisions reflect the different behavior and capacity of beams with span to depth ratios less than five (Salmon 1985, ACI 1989). The deep beam provisions follow the same basic approach used to find the shear strength of a regular beam, with the concrete and stirrups both contributing to the shear resistance as shown in Equation 11.2.
where Vc Vs.
= =
shear strength from concrete shear strength from steel stirrups
(11.2)
F or the deep beam provisions, the V c term indudes the effect of the ratio MuIV u at the critical section. Also, the Vs. term considers the contribution of horizontal stirrups to the shear resistance. Using the deep beam provisions for specimens A and C, the upper limit on shear strength controlled. The design capacity for both specimens was 95 kips, much less than the test capacity given in Table 11.6. Thus, the deep beam provisions are also inadequate for the design of the pier cap region.
11.4.4 The Strut-and-Tie Design Method
Obviously, traditional deSign procedures for shear in the 1992 AASHTO and ACI 318-89 codes are inadequate to realistically predict the strength of the pier caps tested. The load carrying capacity of the pier cap comes from direct compression of an inclined strut (strut-and-tie model) and this action is not explicitly covered in the 1992 AASHTO provisions or the ACI 318-89 code. In contrast, the strut-and-tie method (26, 27) is well suited to the design of abnormal geometries because the method simplifies the behavior of
179

an indeterminate region into discrete load carrying members (27). Essentially, the strutand-tie method is a more general application of the classical truss analogy used for beams. The method is also similar to the tension field concept for the shear strength of steel plate girders. The strut-and-tie method is used to break a structure into a static force system composed of three elements (26):
1. compression struts
2. tension ties
3. nodes
A strut-and-tie model for the concrete pier in this research is shown in Figure 11.26. A summary of the state of the art of the strut-and-tie method and tests on strutand-tie elements is given by Bergmeister et al. (27) from which stress limits for the concrete are chosen.
In applying the strut-and-tie model, five major assumptions are made.
1. Failure coincides with the for-
C5
--STRUT -TIE
TOTAl. COMPRESSION LOAD IN STRUT IS C1
C1 -2" C3
BOm.ENECK DETAIL
mation of a mechanism Figure 11.26 Configuration of strut-and.tie caused by yielding of one or model 1 more of the ties.
2. Concrete does not crush prior to yielding of the ties. The crushing is prevented by limiting stress in the concrete.
3. Forces in the struts and ties are uniaxial.
4. All external loads are applied to nodes of the strut-and-tie model. When distributed loads exist, the model must realistically fit the applied loading.
5. Reinforcement is detailed so bond and anchorage failures are prevented.
11.4.4.1 The Model
Ties - Ties are tension carrying elements and in the pier cap can consist of reinforcing steel or concrete carrying tension. In this research, only reinforcing steel was considered. The strength available to a tie is taken as the yield capacity of the bars T = Asfy where As = the area of steel in the tension tie and fy = the yield stress of the steel. The strength check for the tension ties is very straightforward, but there are several other concerns. First, following the major assumptions of the strut-and-tie method, the main reinforcement should yield at the ultimate load. To allow a ductile failure, the bars must be able to undergo plastiC deformations before crushing of the concrete begins (27). Second, the bars must be able to develop the required strength at the node location. This condition
180

means that the bars must have adequate anchorage behind the node. Also, tension steel should be evenly distributed over the full width of the tension tie. Finally, consideration should be given to crack control under service loads.
Struts - Struts are compression-carrying elements and consist of concrete and compression steel that does not buckle. Three basic concrete compression struts are available. The models proposed for the pier cap use only the prismatic compression strut.
The allowable load in the strut is the sum of the contributions from the steel and concrete:
C = Cs
where Cc = Ac vi; = compression in the concrete
where Ac = area of the strut (11.3)
v = concrete efficiency factor
fs = stress in steel
The concrete efficiency factor accounts for the different strength of concrete in the structure as compared to the strength measured by cylinder compression tests. Bergmeister (27) suggests using the following concrete efficiency factors:
v = 0.8 for f: ~ 4,000 psi
v = 0.9 - 025 ~ for 4,000 < f: < 10,000 psi 10,000 (11.4)
v = 0.65 for f: ~ 10,000 psi
Since concrete strength was 4,000 psi for Specimens A and C, v is taken as 0.8 for the strut-and-tie models considered.
A detailed discussion of nodes is given elsewhere (6). The principle use of the nodes is to determine the forces required for the ties required within the strut. The forces at the nodes are determined by the geometry of the truss model which are related to the diffusion angle <I> (See Figure 11.26) and the indication of the strut O.
The layout of members and nodes of strut-and-tie model is shown in Figure 11.26. The heavy compression strut is modeled with a "bottle" strut which provides an indication of transverse tensile forces. The net compression load carried by the bottle strut is C1, and the angle of inclination of this strut is a. At nodes 1 and 2 struts C2 are separated by an angle 2*1/1. The strut diffusion angle defines the slope at which compression forces spread from under the base plate and is given by Equation 11.5. The compression field width in Equation 11.5 is not the same as a strut width, but represents an outer boundary to the compressive stress field under the base plate. The value for "h" is determined considering
181

the physical boundaries of the structure as shown in Figure 11.27. The limit on the distance "n" is found where a 45° line starting at the centerline of the base plate intersects the edge of the structure. The value of "h" is the smaller of m and 2*n. For the pier studied, the compression field width, h, is the depth of the pier cap (14.5") as shown in Figure 11.26.
p
base plate ""r--t+-. ....,
reaction
diffosion angle + = 12_3_
* (1.5) where
w = bearing plate width
h = compression field width
11.4.4.2 Analysis Results from Strut-and-Tie Model.
The analysis results using the strut-andtie model with several different levels of compression steel assumed to be active in the com-
Figure 11-27 Determination of the pression strut are shown in Table 11.7. For compression field width SpeCimen C, the model with Cs = 119 kips is not
listed as the column bars that were assumed to have yielded did not fit within the calculated compression field. The results from tests on SpeCimens A and C are summarized in Table 11.8. Physically. the analysis models agree with test results as the angles of Strut C1 inclination for the strut-and-tie models are close to the observed cracking patterns. For Pier At the loads predicted by the strut-and-tie analyses agreed very well with test results. For Pier C, however. the strut-and-tie model was extremely conservative, predicting less than half the tested capacity. The strut-and-tie results for Pier C showed better correlation to the load at which reinforCing in the top layer
Table 11· 7 Specimen Capacity and Member Forces for Sfrut-anc:J...Tie Model
Pier A PlerC Analysis 1-1 1-2 1-3 1-4 1-5 Capacity, P 311 344 373 132 159 ratio of theoryltest 0.79 0.87 0.94 0.44 0.53 InClination, q1 67 69 70.5 78.8 80.7 Compression in Steel 0 58 119 0 58
T1 132 132 132 26.1 26.1 T2, horizontal 44.3 49 53.1 18.8 22.7 T2,vertical 18.8 18.8 18.8 3.7 3.7
Forces C1 338 368 395 134 162 (kips) C2 176 191 206 69.9 84
C3 169 184 198 67.2 80.8 C4 132 132 132 26.1 26.1 C5 311 344 373 132 159
Centroid 4.68 4.35 4.09 2.52 2.11
182

Table 11. B Tested Capacities for Pier A and Pier C yielded during testing, about 200 to 217 kips. It is reasonable that
Pier A Average Capacity 395 Average Inclination of Main Strut Cracks 66° Test 1 Capacity (kips) 368 Test 2 Capacity (kips) 387 Test 3 Capacity (kips) 430
PierC 299 75° 298 299 -
the strut-and-tie model is more accurate in predicting the specimen yield load, because the strut-andtie method assumes failure occurs with yielding in the ties. The discrepancy between the Model strength predictions and the tested specimen capacities can be ac
counted for by load carrying components other than the tie/arch action accounted for in the strut-and-tie model. Additional strength may come from dowel action, aggregate interlock, and shear transfer in the uncracked concrete (2S).
The compression steel force assumed in strut CS had a significant impact on results of the strut-and-tie analyses. There was a direct correlation between Cs and the predicted pier capacity, with the pier capacity rising with larger Cs values. This trend can be explained by looking at the inclination of strut C1. As the force in the compression steel rises, the centroid of CS moves closer to the edge of the column, increasing the angle of inclination of strut C1. For a larger angle of inclination, the vertical component of the main strut increases, enlarging the predicted specimen capacity. The extent of this increase in capacity is limited by the allowable compression stress in the main compression strut, and the capacity of the tension tie T1.
Table 11· 9 Limitations on the Components of T2 Based on Reinforcing in the Test Specimens
Pier A PierC I~aximum T2 Horizontal 19.8 kips 15.6 kips Maximum T2 Vertical 6.6 kips 5.2 kips
The difficulty of using a strutand-tie model as an analysis tool can be seen by conSidering tie T2. The horizontal and vertical components of T2 are listed in Table 11.7 because those components match the orientation of stirrups (bars Band S) in the pier cap. Considering the layout of reinforcing in the test specimens, the
limits for the components of T2 are given in Table 11.9. For both Piers A and C, the strutand-tie analysis predicts larger forces than the stirrups can handle. However, the magnitude of T2 depends greatly on the diffusion angle, which is only generally known. Also, tension in the concrete has not been considered. Because of the uncertainty of the magnitude of transverse tensile forces, the inadequacy of stirrups as predicted by the strut-andtie model was ignored because all the analysis results were conservative. When examining member forces from an assumed model, the allowed stresses on T1 and C1 were used to judge the validity of the analysis as T1 and C1 are the most critical load carrying components of the model.
11.4.4.3 Summary Of Strut And Tie Results
While the strut-and-tie models did not accurately predict Pier C capacity, strength predictions from the models agreed quite well with SpeCimen A test results. The poor results for specimen C can be partially explained considering the assumption of the strut-and-
183
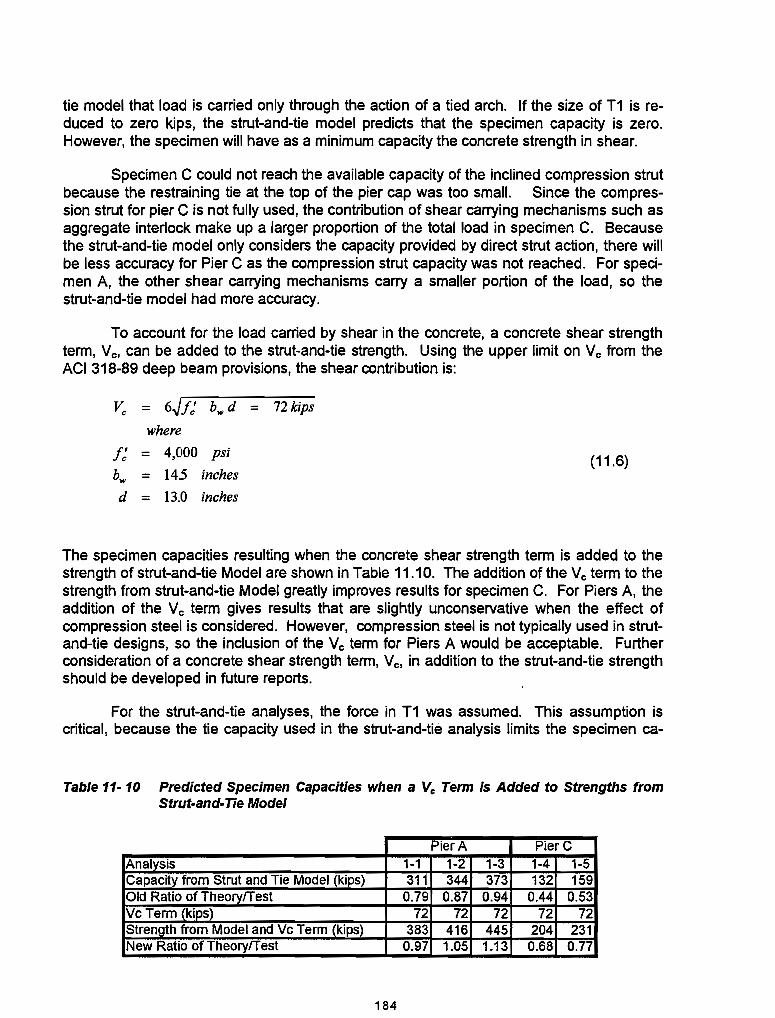
tie model that load is carried only through the action of a tied arch. If the size of T1 is reduced to zero kips, the strut-and-tie model predicts that the specimen capacity is zero. However, the specimen will have as a minimum capacity the concrete strength in shear.
Specimen C could not reach the available capacity of the inclined compression strut because the restraining tie at the top of the pier cap was too small. Since the compression strut for pier C is not fully used, the contribution of shear carrying mechanisms such as aggregate interlock make up a larger proportion of the total load in specimen C. Because the strut-and-tie model only considers the capacity provided by direct strut action, there will be less accuracy for Pier C as the compression strut capacity was not reached. For specimen A, the other shear carrying mechanisms carry a smaller portion of the load, so the strut-and-tie model had more accuracy.
To account for the load carried by shear in the concrete, a concrete shear strength term, V c. can be added to the strut-and-tie strength. Using the upper limit on V c from the ACI 318-89 deep beam provisions, the shear contribution is:
Vc = 6Jf: b",d = 72 kips
where
f: = 4,000 psi (11.6)
b", = 145 inches
d = 13.0 inches
The specimen capacities resulting when the concrete shear strength term is added to the strength of strut-and-tie Model are shown in Table 11.10. The addition of the V c term to the strength from strut-and-tie Model greatly improves results for specimen C. For Piers A, the addition of the V c term gives results that are slightly unconservative when the effect of compression steel is considered. However, compression steel is not typically used in strutand-tie deSigns, so the inclusion of the V c term for Piers A would be acceptable. Further consideration of a concrete shear strength term, V c. in addition to the strut-and-tie strength should be developed in future reports.
For the strut-and-tie analyses, the force in T1 was assumed. This assumption is critical, because the tie capacity used in the strut-and-tie analysis limits the specimen ca-
Table 11·10 Predicted Specimen Capacities when a Vc Term is Added to Strengths from Strut-and-Tie Model
Pier A PierC Analysis 1-1 1-2 1-3 1-4 1-5 Capacity from Strut and Tie Model (kips) 311 344 373 132 159 Old Ratio of TheorylTest 0.79 0.87 0.94 0.44 0.53 Vc Term (kips) 72 72 72 72 72 Strength from Model and Vc Term (kips) 383 416 445 204 231 New Ratio of TheorylTest 0.97 1.05 1.13 0.68 0.77
184

pacity by equilibrium at node 1. For specimen e, strain gages on the bars showed that all bars in the top layer of the pier had yielded before the peak load was reached, so the yield capacity of the bars was used for the strut-and-tie model. Since bars in the top layer of specimen A did not have strain gages, the force in the bars had to be assumed. For specimen A, the force for T1 was assumed as the full yield capacity of the bars in the top layer, 132 kips. This assumption gave strut-and-tie strength predictions that agreed well with tested results. However, it is very unlikely that the full yield strength of all bars in the top layer of pier A was reached. For specimen e, the #3 bars in the top layer of the pier yielded at a load of around 200 kips. Since the area of a #3 bar is 1/4 that of a #6 bar, the force in the #6 top layer bars of specimen A was probably 1/4 the yield capacity of the #6 bars at a load of 200 kips. Extrapolating to the capacity of specimen A, the #6 bars would probably see a load of about 1/2 their yield capacity at a load of 400 kips.
The anchorage of the bars can also be considered in predicting the actual force in tie T1. For specimen A, inspection of the failed specimen showed no signs of bond distress. However, for the straight bars in specimen A, the available development length for the bars was very small and inadequate to develop the yield strength of the bar. If the straight bars in specimen A had to develop a large portion of their capacity, bond distress would have been observed as for specimen B. This discrepancy between the assumed force and observed behavior can partially be explained by considering tension in the concrete. Also, the strut-and-tie model only considers the action of the tied arch to carry loads. However, other shear carrying mechanisms carry load, so the strut-and-tie model will overestimate the required steel in the top layer.
For strut-and-tie Models, the analyses considered the effect of compression in the column steel. The inclusion of the steel increased the angle of strut inclination, enlarging the predicted capacity of the pier. Since no strain gages were located on the column steel, the magnitude of es assumed was very arbitrary. Still, the inclusion of compression steel in the strut-and-tie model reflects the behavior of the specimen and increased the strut-andtie model accuracy. However, the effect of compression steel has not been considered in the general strut-and-tie theory at this point. One of the problems of using compression steel is an inability to check the stress at a eee node. Because the strut-and-tie theory has not yet developed procedures for considering compression steel, the effect of compression steel was ignored in the design example.
While the strut-and-tie model results give conservative estimates of the specimen strength, either model predicted strength much more accurately than a conventional analysis. To increase the strength predicted by a strut-and-tie model, a concrete shear
Table 11· 11 Comparison of Average Ratio of Theoryffest Capacity for Different Design Methods
Average Ratio of Theoretical Capacity to Tested Pier A PierC Strut and Tie Model Plus a Vc Term 1.05 0.73 Strut and Tie Model 0.87 0.49 Corbel Analysis 0.38 0.18 Deep Beam Analysis 0.24 0.32
185

strength term may be added to the strut-andtie capacity. The average ratios of the theoretical load to tested specimen capacity for all design methods are summarized in Table 11. 11. Additionally, all strengths predicted by the strut-and-tie models that met limit stresses in the main strut-and-tie were conservative.
11.4.5 Design Example Using Strut-and-Tie Model
A design example using the strut-and
L1=12'·0"
= 4'·0"
PLAN VIEW OF PIER CAP
p
}= 4' -0"
tie method for a typical pier cap geometry is A r-i---------I-..., A
presented. Strut-and-Tie Model is used, with the calculations presented identical to those used to analyze the scale specimens. For the design example, the benefit of compression steel in the column was not considered as explained previously. The example is based on ultimate strength design, which is the accepted procedure for use with the strut-and-tie method. For ultimate strength design, the criteria for specimen nominal strength is 4>Pn = Pu where Pu = factored load; Pn = nominal strength; and 4> = strength reduction factor.
PROBLEM STATEMENT
L2 = 12'· O·
PROFILE VIEW OF PIER CAP
SECTION A-A
Figure 11- 28 Pier cap geometry for the Example Problem
Determine the base plate size and pier cap reinforcing for the pier cap geometry shown in Figure 11.28 using the strut-and-tie model shown in Figure 11.29.
LOAD, DIMENSIONS, AND MATERIALS
P = 1,200 kips, a service load L1 = 12'-0" L2 = 12'-0" L3 = 8'-6" 81 = 4'-0" 82 = 3'-6" h = 4'-0" f r c; = 3,600 psi
fy = 60 ksi cover = 21/4"
The given load is a service load, so this must be transformed to a factored load. A load factor of 1.6 was used since individual load components were not known.
Pu = (load factor)P = 1.6*1,200 Pu = 1,920 kips
186

SIZE THE BASE PLATES
Base plates are sized using the 1992 AASHTO provisions, section 8.16.7.
where
= 1,920 kips
F = 0.7 for bearing
= nominal bearing strength
Pn required = PufF = 2,743 kips
Pn = 0.85 fe' A1(A2/A1)0.s
=
=
base plate area
surrounding area of concrete, taken as
_STRUT _TIE
TOTAL COMPRESSION LOAD IN STRUT IS C1
C1 =2* C3
BOTILENECK DETAIL
Figure 11· 29 strut·and·tie model for Example Problem
the area of a circle with a 4'-0" diameter = 1,810 in2
Try a base plate with w = 25"
so Pn = 0.85*3.6*625*(1810/625)0.s = Pn = 3,250 kips> Pn required
Obviously, a smaller base plate could be used. However, too small a plate will not adequately distribute load across the full pier cap width. For tested specimens, the ratio of base plate size to strut width (w/B) was 0.6 (8.75"/14.5'1. Using a 25 inch base plate gives a ratio of plate width to strut width wlB = 0.6 (25"/42") to conform with the tested specimens. The strut width is chosen as the column width, 42", which is smaller than the pier cap width, 48". The column width is used for the w/B ratio as the smaller width will control strut widths.
SIZE C5 AND FIND THE LOCATION OF ITS RESULTANT
To find forces in the struts and ties, the angle of inclination, 8, is needed. Since C5 = Pn, the centroid of C5 can be found knowing the applied load. The indination angle, 8, can then be determined based on the location of the centroid of C5. To find the required Pn for the pier cap. a (() factor is needed. One (() factor = 0.90 is used for the entire pier cap design.
= = =
1,920 kips 0.9 PuI(() = 2,130 kips = required pier cap strength
187

82 = 3' 6"
wC5
COLUMN CROSS SECTION
Figure 11· 30 Cross section of Strut C5
A 1 and A2, as shown in Figure 11.30
AC5 = A1 +A2
Knowing P n, the centroid of C5 can be found because C5 = P n.
fed = concrete design strength = ofe' for all struts in the model where 0 = 0.8 from section 4.4.4.2
=
AC5 =
ofe' = 2.88 ksi
area of strut C5 = C51fc:d = 740 in2
Consider the total area of strut C5 as two pieces,
A1 = 693 in2 so strut C5 must extend into the rectangular section of the column
A2 = AC5 - AC1 = 47 in2
z = A2/B2 = 1.1 in
wC5 = z + B2/2 = 22.1" = the width of strut C5.
The centroid of AC5 is then found,
= 12.7"
FIND THE INCLINA nON ANGLE OF THE BOTTLE STRUT, 9
The location of node 2 is the intersection of struts C1, C4, and C5, and is defined by Xc:g and e, the angle of inclination, as shown in Figure 11.31. The inclination angle, e, can be found knowing the centroid
d of strut C5, Xc:g. and the depth of reinforcing,
Xcg
Figure 11· 31 Location of Node 2 in the strut·and·tie model
d. .
d = h - cover - di/2
Assuming a #11 bar in the top layer, db = 1.41", so
d
e
=
=
48 - 2.25 - 1.41/2 = 45.0"
90° - 0.5 arc sin [2Xc:gld] = 72.8°

KNOWING 0, CHECK T1 AND ASSUMED d
T1 = AT1 =
P,/tan 0 = 2, 130ltan 72.8 = 659 kips
area of steel for 1"1 = T1/fy = 11.0 in2
Use 8 #11 bars, with As = 12.48 in2
=> this implies that 2 layers of steel will be needed
RECALCULATE 0 USING TWO LAYERS OF STEEL FOR T1
for 2 layers of steel, use clear spaCing of 2db = 2.82" for a #11 bar
d = h - cover - db - clear spacing/2 = 42.9"
so new 9 = 90° 0.5 arc sin [2XeJd1 = 71.8
Check T1 using the new 9
T1 = AT1 =
PJtan 9 = 2,130/tan 71.8 = 700 kips
T1/fy = 11.7 in2 < 12.48 in2 provided, OK
FIND ALL MEMBER FORCES
Compute the diffusion angle:
<I> = 2 + 3/[(wlh)o.~ = 16.2°
Pn = 2,130 kips
T1 = 700 kips
9 = 71.8°
C1 = P,/sin9 = 2,242 kips
C2 = 0.5 C1/cos <I> = 1,167 kips
C3 = C1/2 = 1,121 kips
C4 = T1 = 700 kips
C5 = Pn = 2,130 kips
T2 = .5 C1 tan <I> = 326 kips
T2horiz = T2 sin 9 = 310 kips = horizontal component of T2
189

T2vert = T2 cos e = 101 kips = vertical component of T2
CHECK STRESS AT THE CCC NODE, NODE 2
The layout of the CCC node is shown in Figure 11.32. AC1 is the area of compression strut C1 at this node. Since AC5 is a combination of a circular and a rectangular section, AC1 is found by projecting from AC5.
AC1 = AC5/sine = 740/sin 71.8 = 779 in2
b..q = 70.a
C1
wC4 = the width of strut C4
0.5 wC4 = cltan e = 3.09"
Figure 11· 32 Geometry of the CCC node (Node 2 in the strut·and·tie model)
wC4 = 6.18"
The column width is used to find AC4 as the column width limits the strut width.
AC4 = 82 wC4 = 260 in2
aC5 = the stress on strut C5 = C5/AC5
aC5 = 2.88 ksi = fed OK
aC1 = C1/AC1 = 2.88 ksi = fed OK
aC4 = C4/AC4 = 2.67 ksi < fed OK
All strut stresses at the node are less than or equal to the limiting concrete design stress, but a hydrostatic state of stress does not exist as all three stresses are not equal. Since the stress at the node is not hydrostatic, the checks suggested by Schlaich (26) are used:
1. All strut stresses at the node are within design limits.
2. The smallest stress ratio between faces of the node is greater than 0.5.
Check: 2.67/2.88 = 0.93 >0.5 OK.
Since both checks are met, this node is satisfactory.
DESIGN STEEL FOR T1 AND THE COMPONENTS OF T2
T1 = 700 kips
AT1 = T1/fy = 11.67 in2 = area of steel required for T1
190

BASEPLATES For T1, use 5 #11 bars and 4 #10 bars, As = 12.88 in2 _ /25" X 25" LAYER 1..... ,.....L.-, ----. a.EAR SPAONG = 2.8"
LAYER2"'1~1~~I~~I;~rEauALsPACES The layout of T1 steel at the top of the cap is shown in Figure 11.33.
For the components of T2, horizontal and vertical stirrups are used. Since there are two ties T2 in the bottle strut, steel must be provided to resist 2*T2. Since steel will be distributed on each face of the pier, the steel required for T2 is provided on each face of the pier cap.
T2horiz = 310 kips
A T2horiz = T2horizlfy = 5.17 in2
on one face of the cap
for T2hO? use 6 #9 bars, As =6.0in
baro 2t:P 1'ars E #9 #7
L2= 12'·0" )II
PROFILE VIEW OF PIER CAP
BARS A 1 AND A2
~II~ {"' RSE
2-114" COVER
; II~}EQUALSPACES BARS A 1 ANDA2 MADE CONTINUOUS BY A WELDED SPUCS
LAYER 1· BARSA1.A2AND B#11
BARSC1 ANDC2 4 *2.114" COVER
~;;;;;;;;;;;;;;;;;;;;:~]~J"~~G ICENTICAL BARSC1 AND C2 MADE CONTINUOUS BY A WELDED SPUCS
LAYER 2 - BARS C1 AND C2 #10
The horizontal stirrups for T2 are evenly spaced across the depth of the pier cap as shown in Figure 11.33.
Figure 11· 33 Steel reinforcing pattern from the Example Problem
T2vert
AT2vert
= 101 kips
= T2vert/fy = 1.68 in2 on one face of the cap
for T2vert use 3 #7 bars, As = 1.8 in2
The vertical stirrups for T2 are spaced across the width of the compression.
CHECK STRESSES AT THE CCT NODE
The geometry of the CCT node, node 1, is shown in Figure 11.34. Since the bearing stress is within its limit and T1 can be provided, only the stress in C1 needs to be checked.
w= 25" I( )01
P = 2,130k
~T1
#10
Figure 11- 34 Geometry of the CCT Node (Node To compute the area of C1 at this 1) in the strut-and.tie model
node the column width, 82, is used as the
191

strut width instead of the pier cap width, 81. The smaller width is used because loads from the base plate can only be distributed over a limited concrete area.
wT1 = db#11 + db#1o + S = 1.41 + 1.27 + 2.82 = 5.5"
wC1 = w sin 6 + wT1 cos 6 = 25.5"
C1 = 2,242 kips
AC1 = 82 wC1 = 1,071 in2
crC1 = C1/AC1 = 2.09 ksi < fed OK
CHECK STRESSES IN C2, C3, AND NODE 3
Since the stress in C1 has been checked at both nodes 1 and 2 and is satisfactory there, both crC2 and crC3 will meet allowable stresses. The stresses at the nodes are most critical, because the area at the nodes is smallest. For struts C2 and C3 the load can distribute over a larger area, reducing stress. Using a similar argument, nodes 3 do not need to be checked. Also, node 3 does not need to be checked as T2 is spread over several stirrups.
CHECK ANCHORAGE REQUIREMENTS FOR T1 TIE
At the CCT node, the strut-and-tie method requires the full tensile strength of the bars to be provided. The development length is calculated using the 1992 AASHTO provisions, section 8.25.
= {A B ... } Idb = the development length of a bar
A, B are multipliers based on rebar placement
Idb = 0.04 Ab fy/(fc·)o.5 = 62.4"
A = 1.4 = multiplier for top bars
B = 0.8 = multiplier for large lateral spacing
Id = A B Idb = 70"
Since the development length is extremely large, straight bars can not be used to provide the full strength of T1. Therefore, continuous loops are used to provide anchorage as shown in Figure 11.33. The AASHTO provisions do not specify a development length for a full U. so the 1992 AASHTO provisions for a standard 1800 hook, section 8.28, are examined.
=
=
{A B ... } Ihb = development length of the hook
1,200 dJ(fc,)o.5 = 28.2"
192

A = 0.7 = multiplier for cover
= A Ihb = 20.0"
This length can be provided under the base plate, so the development of the U hoops is considered adequate.
The area of steel that can be developed at the CCT node is thus the full strength of the U shaped hoops, and the developed strength of the straight bar. As suggested by Bergmeister (27), the development length begins at the edge of the base plate.
AT1 = 4 A#11 + 4 A#1 0 + A#11 (Id provideJld available)
Id provided = 20" based on the bar layout shown in Figure 11.33.
A T1 = 4(1.56) + 4(1.27) + 1.56(20170) = 11.77 in2 > 11.67 in2 reqd.
Thus, tie T1 can provide the full capacity needed at the CCT node.
SUMMARY OF THE EXAMPLE PROBLEM
The reinforcing design for the example problem pier cap is shown in Figure 11.33. Using the strut-and-tie method, steel reinforcing for the pier cap can readily be designed. The main considerations in the strut-and-tie analysis shown were checks of the nodes, selection of reinforcement, and anchorage of reinforcing. Since the column width is less than the pier cap width, the column width was used to limit strut widths. Also, the base plate width is kept larger than required to allow distribution of loads across the pier. The tested specimens had a ratio of base plate width to strut width of 0.60, so this ratio was used for the full size pier. The calculations in the design example are lengthy, so a Simplified procedure to predict the pier cap strength should be developed in future research.
COMPARISON OF EXAMPLE PROBLEM REINFORCING STEEL TO A TYPICAL TxDOT DETAIL
The amount of reinforcing required for the strut-and-tie design example is much greater than that typically used by TxDOT. For the given geometry, a pattern of reinforcing often used by TxDOT is shown in Figure 11.4. The TxDOT steel detail has only one layer of #11 bars in the top of the pier cap for the main tension tie, T1, as opposed to two layers in the strut-and-tie design -#11 and #10 bars. Also, the TxDOT detail uses 3 layers of #6 bars for the horizontal stirrups as opposed to 6 layers of #9 bars for the strut-and-tie design.
To judge whether the difference in the two steel reinforcing details represents an understrength of the TxDOT design or the conservatism of the strut-and-tie method, a strutand-tie analysis was made of the typical TxDOT design shown in Figure 11.4. The analysis used no compression steel, the full yield capacity of the of the bars in the top layer of the pier cap, and the column width as the strut width (the same parameters used for analysis 1-1 of Table 11.7). Using these parameters the strut-and-tie analysis predicts a capacity of the TxDOT design as Pu = 1,747 kips which was less than the Pn = 2,130 kips used in the strut-and-tie design. However, for the strut-and-tie analysis of the tested specimens using
193

the same assumptions (no Cs and full fy), the average tested specimen capacity was 27% greater than the strength from the strut-and-tie analysis (395/311 = 1.27), Thus, the true average capacity of the full size detail is probably closer to 1.27*1,747 = 2,220 kips. If the minimum tested strength for test specimen A is used, the tested pier capacity is only 18% larger than that predicted by the strut-and-tie analysis (365/311). Thus, the least capacity of the full size pier is likely 1.18*1,747 = 2,070 kips which is slightly less than the required design strength P n = 2,130 kips. This indicates that existing piers may have a factor of safety less than expected for bearing loads.
The above strut-and-tie analysis of a full size pier, and extrapolation of analysis results based on tested scale specimen capacity may be slightly inaccurate because there are several differences between the test specimens and full size piers. For the tested specimens, fe' = 4,000 psi as compared to 3,600 psi for the full size piers. The different concrete strength will change the concrete tensile strength, which may result in a different strut inclination. A different strut inclination will change the contribution to the pier cap strength of other shear carrying mechanisms such as aggregate interlock. The different concrete strength will also affect the development length of the reinforcing. For a larger concrete strength, the required anchorage length is smaller. Finally, for the scale specimens, the column width was the same as the pier cap width. For the full size pier caps, the column width is less than the pier cap width. This reduced column size will increase the concentration of stress on the end of the column, resulting in earlier spalling.
A determination of the adequacy of existing full size pier caps is difficult, and can only be made on a case by case basis considering both the load and geometry. As a further consideration of the adequacy of current deSigns, the performance of existing piers can be considered. To the authors knowledge, details as shown in Figure 11.4 have performed adequately. However, it is difficult to quantify the loads that existing piers have actually sustained. The calculated bearing loads are typically conservative, so the smaller magnitude of true bearing loads must be considered if the performance of existing pier caps is to be projected to new designs. Improved analysis techniques to more accurately calculate bearing loads are currently being developed in a related study concerning the behavior of the steel bent to pier cap connection.
To give criteria for evaluating the adequacy of pier caps from field inspections, cracking patterns on test specimens A at a service level are considered. For the A series specimens, the average service load is 395 kips/1.6 = 245 kips. At this service load, flexure/shear cracks extended about half way across the depth of the pier cap. Under a service load, cracks on full size piers should have a maximum size of 0.016" based on crack sizes observed on the scale specimens. Signs of concrete distress on the pier cap that would indicate overloads on the bridge or pier cap inadequacy are:
1. Significant crushing at the pier/cap column interface. If spalling of the concrete occurs, the pier cap has seen severe loadings.
2. Splitting cracks on the top of the pier indicating bond failure for the straight bars in the top layer of the pier cap.
3. Maximum crack openings on the pier significantly larger than 1/16".
194

4. Cracks extending across the full depth of the pier cap that have a significant width for the full length.
If any of the pattems of concrete distress listed above are observed, rehabilitation of the pier cap may be desirable.
Because there is some uncertainty as to the adequacy of the current steel reinforcing pattem, the strut-and-tie method is suggested for future designs. The strut-and-tie method is superior to conventional design techniques that could be used for the pier cap. The strut-and-tie method allows a logical design of reinforcing, and is a conservative design technique. To improve the efficiency of the strut-and-tie method, further research should be conducted into the addition of a concrete shear strength term to the strut-and-tie capacity.
195


CHAPTER 12 SUMMARY AND CONCLUSIONS
12.1 PROBLEM STATEMENT
At congested highway interchanges, horizontal and vertical clearance requirements may dictate the use of narrow piers and shallow depth cap girders to accommodate the various roadways and overpasses. In situations such as this the state of Texas uses horizontally curved steel plate girders as the bridge structural system, supported on integral steel cap girders at single column piers. Two bearings are used to connect the steel cap girder to the concrete pier. Due to the narrow pier, unbalanced loading may produce a transverse overturning moment at the pier; the bearings resist this moment by developing a couple, with one bearing loaded in compression and one bearing loaded in tension. When the unbalanced loading is caused by truck traffic, which is cyclic, the bearing reSisting the uplift is subject to fatigue loading.
The standard connection used by the state of Texas is an in-house design that comprises a line rocker bearing, which accommodates the longitudinal direction rotation, and embedded anchor bolts that are used to both resist potential uplift and to provide a positive connection from the cap girder to the pier. The anchor bolt stress that develops due to the longitudinal direction rotation is reduced by placing a bearing pad in series with each anchor bolt. The behavior of this connection is not well understood and the detailing is complex. The objectives of the research were to examine and categorize the behavior of the existing connection and to develop a new detail that is simpler and cost-effective. The steel reinforcement at the top of the concrete pier have a geometry whose design and behavior is not explicitly covered in design codes.
This research produced a new detail for the connection oetween an integral steel cap girder and a concrete pier, and provided a better understanding of the behavior of the current standard detail. The primary research method was the experimental testing of large-scale connection models, which was supplemented with mathematical modeling and finite element analyses.
12.2 PHASE I SUMMARY AND CONCLUSIONS
Summary
The first phase of the research centered on the experimental testing of the standard connection detail. Seven tests were conducted in both the longitudinal (direction parallel to traffic flow) and transverse (direction perpendicular to traffic flow) directions. The variable in the tests was the type of bearing pad used in series with the anchor bolt; the purpose of
197
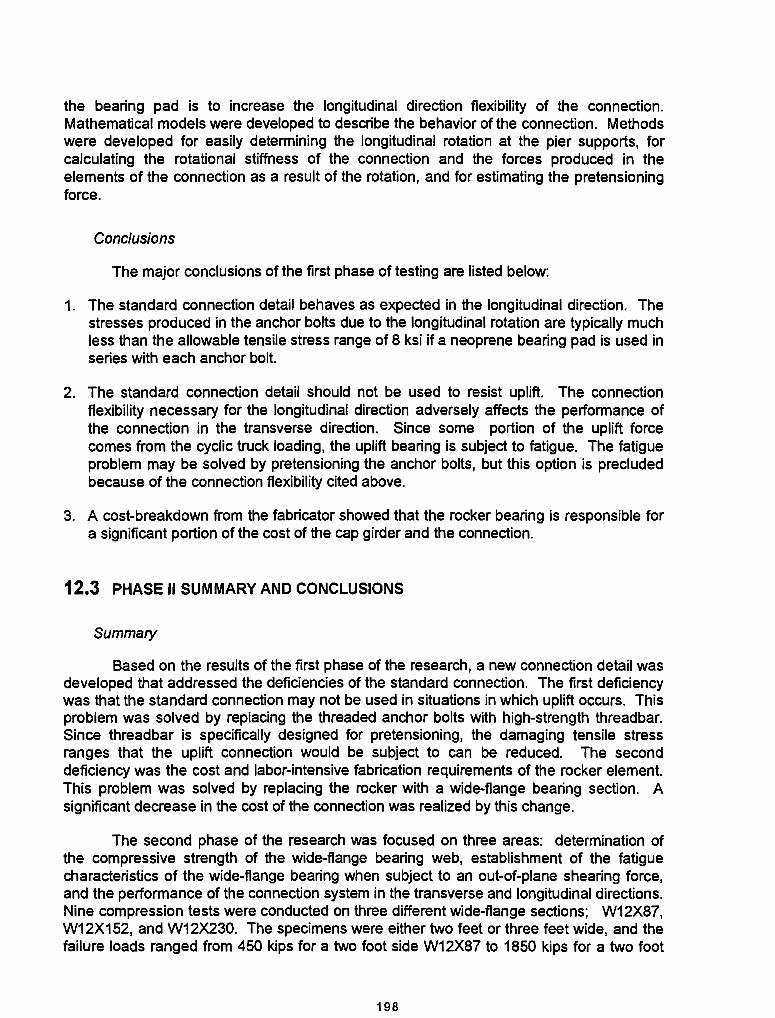
the bearing pad is to increase the longitudinal direction flexibility of the connection. Mathematical models were developed to describe the behavior of the connection. Methods were developed for easily determining the longitudinal rotation at the pier supports, for calculating the rotational stiffness of the connection and the forces produced in the elements of the connection as a result of the rotation, and for estimating the pretensioning force.
Conclusions
The major conclusions of the first phase of testing are listed below:
1. The standard connection detail behaves as expected in the longitudinal direction. The stresses produced in the anchor bolts due to the longitudinal rotation are typically much less than the allowable tensile stress range of 8 ksi if a neoprene bearing pad is used in series with each anchor bolt.
2. The standard connection detail should not be used to resist uplift. The connection flexibility necessary for the longitudinal direction adversely affects the performance of the connection in the transverse direction. Since some portion of the uplift force comes from the cyclic truck loading, the uplift bearing is subject to fatigue. The fatigue problem may be solved by pretensioning the anchor bolts, but this option is precluded because of the connection flexibility cited above.
3. A cost-breakdown from the fabricator showed that the rocker bearing is responsible for a significant portion of the cost of the cap girder and the connection.
12.3 PHASE II SUMMARY AND CONCLUSIONS
Summary
Based on the results of the first phase of the research, a new connection detail was developed that addressed the deficiencies of the standard connection. The first deficiency was that the standard connection may not be used in situations in which uplift occurs. This problem was solved by replacing the threaded anchor bolts with high-strength thread bar. Since threadbar is specifically designed for pretensioning, the damaging tensile stress ranges that the uplift connection would be subject to can be reduced. The second deficiency was the cost and labor-intensive fabrication requirements of the rocker element. This problem was solved by replacing the rocker with a wide-flange bearing section. A Significant decrease in the cost of the connection was realized by this change.
The second phase of the research was focused on three areas: determination of the compressive strength of the wide-flange bearing web, establishment of the fatigue characteristics of the wide-flange bearing when subject to an out-of-plane shearing force, and the performance of the connection system in the transverse and longitudinal directions. Nine compression tests were conducted on three different wide-flange sections; W12X87, W12X152, and W12X230. The specimens were either two feet or three feet wide, and the failure loads ranged from 450 kips for a two foot side W12X87 to 1850 kips for a two foot
198
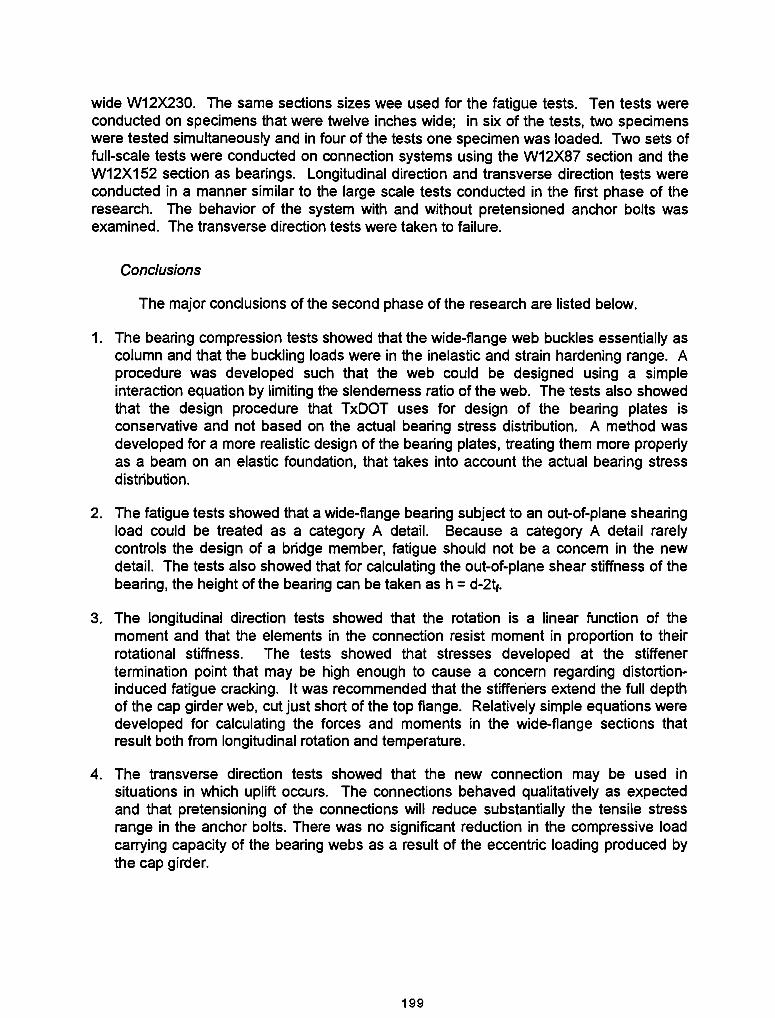
wide W12X230. The same sections sizes wee used for the fatigue tests. Ten tests were conducted on specimens that were twelve inches wide; in six of the tests, two specimens were tested simultaneously and in four of the tests one specimen was loaded. Two sets of full-scale tests were conducted on connection systems using the W12X87 section and the W12X152 section as bearings. Longitudinal direction and transverse direction tests were conducted in a manner similar to the large scale tests conducted in the first phase of the research. The behavior of the system with and without pretensioned anchor bolts was examined. The transverse direction tests were taken to failure.
Conclusions
The major conclusions of the second phase of the research are listed below.
1. The bearing compression tests showed that the wide-flange web buckles essentially as column and that the buckling loads were in the inelastic and strain hardening range. A procedure was developed such that the web could be designed using a simple interaction equation by limiting the slenderness ratio of the web. The tests also showed that the design procedure that TxDOT uses for design of the bearing plates is conservative and not based on the actual bearing stress distribution. A method was developed for a more realistic design of the bearing plates, treating them more properly as a beam on an elastic foundation, that takes into account the actual bearing stress distribution.
2. The fatigue tests showed that a wide-flange bearing subject to an out-of-plane shearing load could be treated as a category A detail. Because a category A detail rarely controls the design of a bridge member, fatigue should not be a concern in the new detail. The tests also showed that for calculating the out-of-plane shear stiffness of the bearing, the height of the bearing can be taken as h = d-2tf•
3. The longitudinal direction tests showed that the rotation is a linear function of the moment and that the elements in the connection resist moment in proportion to their rotational stiffness. The tests showed that stresses developed at the stiffener termination point that may be high enough to cause a concern regarding distortioninduced fatigue cracking. It was recommended that the stiffeners extend the full depth of the cap girder web, cut just short of the top flange. Relatively simple equations were developed for calculating the forces and moments in the wide-flange sections that result both from longitudinal rotation and temperature.
4. The transverse direction tests showed that the new connection may be used in situations in which uplift occurs. The connections behaved qualitatively as expected and that pretensioning of the connections will reduce substantially the tensile stress range in the anchor bolts. There was no significant reduction in the compressive load carrying capacity of the bearing webs as a result of the eccentric loading produced by the cap girder.
199

12.4 CONCRETE PIER SUMMARY AND CONCLUSIONS
Eleven static load test were conducted to failure on six pier caps. For all specimens, load on the pier cap was primarily carried by the action of a tied arch which transferred load from the base plates into the column. Overall, specimens that had a greater quantity of horizontal reinforcing steel and adequate development of horizontal reinforcing had a greater capacity. To investigate the necessity of the continuous steel loop around the perimeter of the pier cap, a specimen was constructed with only straight bars in the top layer of the pier cap. When the continuous loop was not included in the top layer of the pier cap reinforcement, shear cracks on the face of the pier opened extremely wide because there was no reinforcement at the top of the pier to limit their growth. Bond distress was also seen for the straight bars in the top layer of the pier cap because removal of the continuous loop left only straight bars with short development lengths. Without the continuous loop, concrete at the end of the pier cap was not confined and additional punching occurred. Bearing capacity of the pier cap was increased by the confinement provided by the continuous loop around the end of the pier cap so such a detail is highly recommended.
Three design methods were used to analyze the strength of the pier caps tested:
1. AASHTO (1992) Corbel Provisions
2. ACI 318-89 Deep Beam Provisions
3. Strut-and-Tie Method
The corbel and deep beam provisions were very conservative in predicting the capacity of the pier cap because they only consider concrete capacity in shear. On average these two methods underestimated the pier strength by a factor of 3 to 4. Testing showed that the pier cap resisted loads through a tied arch, which is a much stronger load-carrying mechanism than concrete in shear. The strut-and-tie models used were much more accurate than conventional design methods in predicting the capacity of the pier caps because they model the compression arch action observed during testing. The strut-andtie method is suggested for design because strut-and-tie analyses gave the best correlation with test results, modeled true behavior, and were still conservative.
12.5 FUTURE RESEARCH
The following are areas in which research is needed.
Fatigue strength of high-strength thread bar: No comprehensive research has been done in this area and the data would be useful for connections that are subject to uplift and require pretensioned high-strength thread bar.
Bearing plate design and concrete bearing strength: Simple methods were developed to design the bearing plates based on a few experimental results. More research is needed to verify the deSign methods proposed and to determine more accurately the bearing stress distribution in the concrete.
200

Flexural stiffness of concrete pier column: The horizontal forces developed in the bearings are very sensitive to the length of the supporting pier column. In design the length of the pier column is increased to account for the flexibility of the foundation. The determination of this added length is at the discretion of the engineer. A more accurate method for determining this foundation flexibility is needed.
Behavior of caD airder web: The interaction of the bearing stiffeners and the web when it is subject to out-of-plane rotation needs further study. Some preliminary finite element analysis studies were conducted to identify fatigue-sensitive areas at the termination pOints of partial height stiffeners. A more comprehensive study should be done to understand more fully the behavior of the cap girder web and its susceptibility to distortion-induced cracking caused by the rotation of the longitudinal stringers.
Simplification of the strut-and-tie model: The strut-and-tie models presented predicted strengths that were 20 to 50 percent less than the tested specimen capacities. Closer correlation to the tested pier cap strength was achieved by adding a concrete shear strength term to the strength predicted by the strut-and-tie model. Additional research should be conducted to refine the strut-and-tie model by adding a concrete shear strength term. Development of the strut-and-tie theory to allow consideration of compression steel is also desirable. Consideration of compression steel would more accurately model specimen behavior, and would improve the accuracy and efficiency of strut-and-tie designs.
Continuous U stirrup: The development length required for U-shaped continuous stirrups is not detailed in any code provisions. The U shape allows much shorter anchorage lengths than straight bars. The continuous U stirrup will behave differently than a standard 1800 hook as both ends of the continuous stirrup are being loaded.
201


APPENDIX A : DESIGN EXAMPLE FOR STANDARD TxDOT CONNECrION
The following example has been adapted from a design by an engineer at the Texas
Department of Transportation. The parameters of the bridge are listed below:
• Three span continuous plate girder bridge: 160' - 208' - 180' = 548' total length
• Radius of curvature is 1910'
• Seven longitudinal girders spaced at 8' - 8", composite with concrete deck:
• Bearings at pier supports spaced at 12'
• Pier Columns are 18' high with a 12' X 4' cross - section
This example focuses on the bearing connection design; the design of the cap girder itself is not
covered, nor is the design of the concrete pier cap. A schematic showing the location of the
forces acting on the cap girder and bearings are shown in Figure A 1. The sections of the
AASHTO bridge code relevant to each step are listed at the far right.
lANE 1 (12') LANE 2 (12') LANE 3 (12')
10' 10' 10' j TRUCK WlOTH [
LL+l LL+I LL+I 5 12' 11'
f. I i L •. __ , it •••••••• _ •• _ ••••••• ..J it ...................... ._ ..•......... --:::.-:--.-.... ---:::::--.. -.--~'"'::.~-- .. ---... -:: ; ....... _---_ .. :: .. n
~i f! ,',
. .. . . :~=-=F::-':::::::;;;;::J :-.. • .. ••• .... •••• .. ··!· .. •• .. • .... ···_·-:· .... ••• .. • ... _· .. ·r ..... · ..... ···· ..... !........... . .. -:-_ ..... __ ........ _j V
j ! k 8.57' T 14.5'1 ~ jl] .... .... .. .... .." .. .... .. . • .!:............ • • ..:.. .. .. .l. ...., •. l. 01 •. l.. • ........ ::~. T
I ........... J. .............. _ ..... 1._...... _ ....... ~ I ...... __ .......... L............. IOl tOL tOl OLt.L .. i OL L .J*OL 'fDl t
Figure A.1 Loads on Cap Girder
203

Detenoiae the Loads on the Cap Girder and Bearings
DEAOLOAD
L) Reactions from the 10Dgitudinal girders, including the V - loads
GIRDER LOAD DISTANCE TO CL MOMENT
(kips ) (feet) (ft - kips )
1 299 26.00 7,714.00
2 '297 17.33 5,147.01
3 294 8.67 2,548.98
4 284 0.00 0.00
5 282 -8.67 -2,444.94
6 Zl8 -17.33 -4,817.74
7 276 -26.00 -7,176.00
I: 2010 1,031.31
2.) Assumed self - weight of cap girder
• 7Z' X 1" web; 24" X Z' flanges; 52' long
Dc:ap = {2 (72*1 + 2*24 )/144 } * 490 * 52 = 30 kips
204

LIVE LOAD
:fI: OF LANES
1
2
3
LOAD
(kips)
211
422
570
TRANSVERSE' LOADS
1.) Centrifugal Forces
DISTANCE TO CL
c = 6.68 S2 ----=R=--
(feet )
23
23,11
23,11,-1
MOMENT
(ft-kips)
4,853
7,174
6,963
AASBTO '92 : 3J.OJ.
where S = truck speed in miles per hour
where R = radius of curve in feet
• Fcr :: C * (truck weight) = (6.68*702/1910) * 72 = 12.2 kips / truck
• Mcr = Fcr * (distance to top of bearings)
:fI: OF LANES LOAD DISTANCE TO BEARINGS "MOMENT
(kips) (feet ) (ft-kips)
1 12.2 14.5 176.90
2 24.4 14.5 353.80
3 33.0 14.5 478.50
205

WIND LOAD
1.) On Superstructure in Transverse Direction (WT) AASHTO '9Z : 3.15.2.1.1
which acts on the depth of the superstructure
• Fwr = h * L * WT = 10 * 194 * 0.05 = fJ7 kips
.Mwr = Fwr*~ = fJ7*7 = 679ft-kips
2.) On Superstructure in Longitudinal Direction (WJJ AASHTO '9Z : 3.15.2.13
which acts on the depth of the superstructure
• FWL = h * L * WL == 10 * 194 * 0.D12 = 233 kips
3.) On 1lve Load in Transverse Direction CWLr) AASHTO '9Z : 3.15.2.1.2
WLr = 100 pi!
which acts on an assumed line of trucks
• FWLT = L * WLr = 194 * 100 = 19.4 kips
• MWLT = FWLT * (distance to top of bearings) = 19.4 * 14.5 ;: 281 ft - kips
206

4.) On live Load in Longitudinal Direction (WI.,) AASHTO '92 : 3.15.2.1.3
Wl1., = 40 plf
which acts on an assumed line of trucks
• Fwu. = L • 'WLt. :: 194 • 40 ::: 7.76 kips
5.) On Underside of Bridge (OT) AASHTO '92 : 3.15.3
OT = 11) psi
which acts t on windward side at 1/4 point of deck
• FOT = Ow· L· OT = 58·194· 20 = 225 tips
• Mar = F OT • Ow • 0.25 = 225 • 58 • 0.25 = 3263 ft - kips
LONGITUDINAL FORCES
1.) Truck Braking Forces (LF) AASBTO '92 : 3.9
LF =5 %
which acts on the weight of a lane of trucks
• FIP = LL • LF • n = 182 • 0.05 • n = 9.1n kips
::: 9.1 tips ( 11ane ), 18.2 kips (21anes), 24.6 tips ( 3lanes)
2) Temperature (T) AASBTO '92 : 3.16
6; ::: a AT = 0'()OOO065 iF ( 50" ) = 3.25 E-4 ft / ft
which acts on the length of the center span
207

The hoIi:zon.tal force on the beIlrinSf is determined by multiplying
the f/emral stiffness of the column by the displacement of the
column. The displacement of the column is:
L 208 4 ;: 6 ...!!. :; 3.25£-4 - ;: J1338 ft
/IC 2 2
The jIexu:raI stijJness of the column is shown below. The length
of the pier column includes the depth of the pier ClJp and is
increased by ten feet to account for the base flexibilily and the
modulus of ekzsticity is decreased by 60% to account for creep.
lj. ;: 1.2 (El)pc = 1.2 ( 3420 • 1327104) = 98.5 t I inch
( L"c + L,.. 'f (261 + 120 'f
• FT = kocx It. = 98.5*.0338*12 = 40 kips
208

LOADS ON BEARINGS AASHTO '9Z : Table 3.22.1A
LC DL LL+I CF W OT WI... T LF RA RB
1.0 La 1.0 0.3 0.3 1.0 1.0 1.0
VERTICAL LOADS
1P 2040 211 - - -68 - - - 2183 1718 465
1M 1031 4853 177 204 m Z15 - - 7519 - -2P 2040 422 - - -68 - - - 2394 2032 362
2M 1031 7174 354 204 m Z15 - - 10017 -3P 2040 570 - - -68 - - - 2542 2099 443
3M 1031 6963 479 204 m Z15 - - 9931 -HORIZONTAL TRANSVERSE LOADS
3V 33 29 19 - I 81 41 41
HORIZONTAL LONGITUDINAL LOADS
3V 7 8 40 251
80 40 40
The P factor is a reduction factor to account for the improbability of the maximum wind occurring
simultaneously with the othu loads. The loads and moments are listed as iP for vertical load, iM
for overtuming moment, and iV for horizontal load where i is the number of lanes of live load.
209

Design of the Bearing Plates and Pin
Lower Bearing Plate
L) Calculate ADowable Bearing Stress on Concrete AASHTO '92 : 8.15.1.1.3
• let Pc = 3600 psi; ~ = 48 in2; ~ = 362
• fb = 0.3 (3.6) j( 4il / 362) = 1.44 ksi
2.) Determine Size of Plate
• L = J(P max 7 flJ = j(1J1J9 7 1.44) = 38.2 inches
• fb = 0.3 (3.6) j( 48l /:;s2) = 1.36 ksi
• L = J(1J1J9 /1.36) = 39.3 inches -+ use 39" X 39" plate
Middle and Up,per Bearing Plates
1.) Assume Three Stepped Plates (shown in F'JgUre A.2)
• P max = 2099 kips; L = 39"
• w = 1J1J9 / ~ = 1.38 kips / inch
• M = 1.38 (3~)/4 = 262 inch - kips
The bearing plates Q1'e asswned to resist (J. unifonnly distributed load..
2.) Determine ADowable BendiDg Stress
FB = Z7 ksi for 50 ksi steel
AASHTO '92 : Table 10.32.1A
210
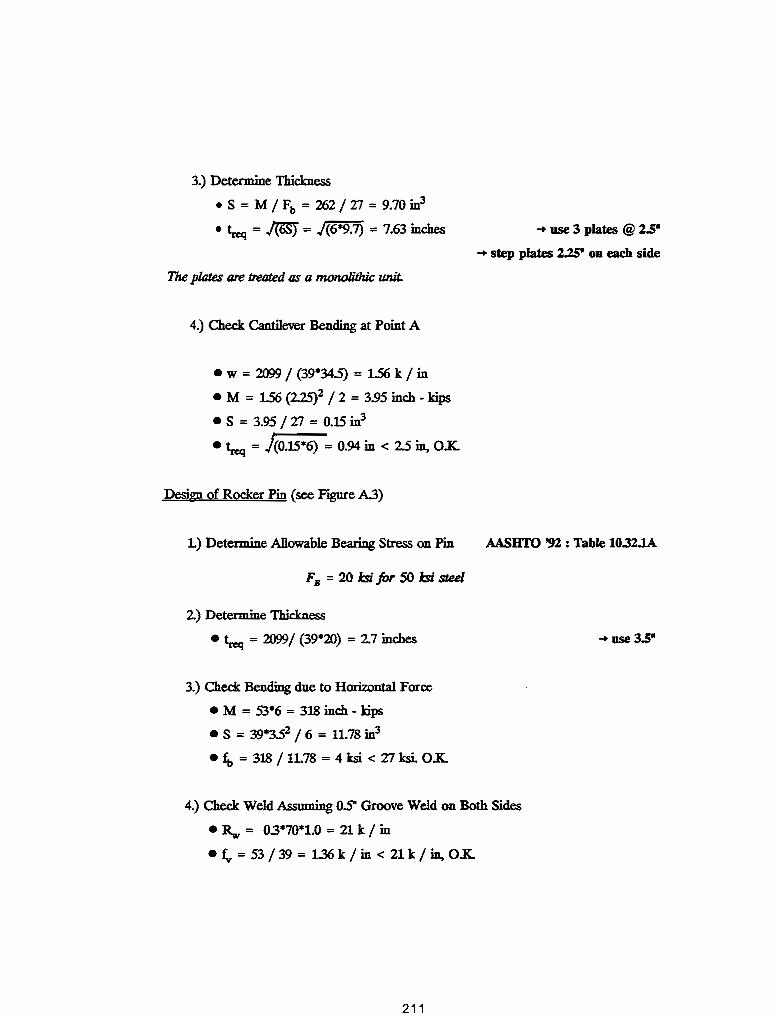
3.) Determine Thickness
• S = M / Fb = 262 / Z7 = 9.70 in3
• treq = /(fEj = J(6*9.7) == 7.63 inches
The pilltes are treated (IS a monolithic unit.
4.) Check Cantilever Bending at Point A
• w = 2099 / (39*34.5) = 1.56 k / in
• M = 1.56 (22Sl / 2 == 3.95 inch - kips
• S == 3.95 / Z7 :::: 0.15 in3
• treq = 1(0.15*6) == 0.94 in < 2.S in, ox.
Design of Rocker Pin (see FlgUI'e A.3)
1.) Determine Allowable Bearing Stress on Pin
2) Determine Thickness
• treq = 1fY}9 / (39*20) == 27 inches
3.) Check Bending due to Horizontal Force
• M = 53*6 == 318 inch -kips
• S = 39*3.52 /6 == 11.78 in3
• fb = 318 / 11.78 = 4 ksi < 27 ksi. Ox.
.... use 3 plates @ 2.5"
.... step plates 2.25" on each side
AASBTO '92 : Table 10.32.1A
.... use 3.5"
4.) Check Weld Assuming OS' Groove Weld on Both Sides
• Rw == 0.3*70*1.0 == 21 k / in
• fv == 53 / 39 == 1.36 k / in < 21 k / in, Ox.
211

Sizing of Cap Girder Web
1.) Determine Maximum Shear on Web
• Vmax = {299+297+294 }DL + {3O*20/52}CAP + {2U*1.5}LL= 1218 kips
2.) Determine Required Thickness
• Assume depth :;: 84- and no transverse stiffeners will be used
F = 733E7 ~!z t" (D/t",'1 3
AASBTO '92 : 10.34.4.1
• fy. :;: 1218000 / ( 84*CW) = 7:J3E7 / ( 84 / CW )2 : CW = L12 inchosuse 1.25"
• fy. = 1218 / ( 84*1.25 ) = lL6 ksi < Fy / 3 = 50 / 3 = 17 ksi, OX
Design Bearing Stiffeners (see FIgUre A.4)
1.) Determine Minimum Thickness to Preclude Bucldi:og AASBTO '92 : 16.34.6.1
• tuna = (13.5/12)J(5OCKXJ/33lXXJ) = 1.38 inches ... use 1.5"
2.) Calculate Properties
• Area = (13.5*1.5*6)ST + (2*14+ 2*9*1.25)*1.25WEB = 184.625 in2
• IXX = (1/12)*4.5*28.253 = 8454 in4
• r = J(8454/184.625) = 6.71 in
• KJ/r :;: 0.75*845/6.71 ::: 9.37 in
212

3.) Determine Compression Capacity AASHTO 10.32.1.A
F. = 23580 - 1.03 ( K1 'f r
• p cr = F zA = (23S80-L03*9.3~*184.625 = 23.5*184.625 = 4339 kips > 2099 kips, OX
4.) Check Stiffener Bearing Stress AASHTO '92 : 10.32.1.A
Fb = 40 Irsl for SO &i stul
• t., = 2099/(6*12*1.5) = 19.5 ksi < 40 ksi, Ox.
The 1.5" cope reduced stiffener width from 13.5" to 1.2".
5.) Check Stiffener to Web Weld
F., = 19 lsi for 10 Irsl weld material
• assume minimum fillet weld; size = 5/16-
• f'y = 2099/(12*76*.7f17*.3125) = 10.42 ksi < 19 ksi, Ox.
Size Anchor Bolts and Related Plates
AASBTO '92 : 10.3.2
1.) Minimum Ao.chor Bolt Diameter for Spans over 100 feet AASHTO '92 :10.29.6.2
db = 1.5 inches
• Ao.chor bolts embedded 2(k\, = 20(1.5) = 30 inches
• Use A193 B7 steel rod, Fy = 105 ksi
• Use 4 anchor bolts and 4 hold - down bolts per connection
The above specijicotions are typicd. Since uplift will not occur; the anchorage
need not be checked.
213

2.) Design Cross Plate
The cross plate is designed as a fixed - fixed beam with a point load at the center.
The magnitude of the load is equal to the tdlowable tensile stress of the anchor
bolt. AASBTO '9l : 10.3Z.1.A
• Ba = ~ (O.55F y) = 1.41*0.55*105 = 81 kips
• M = PL/8 = 81*14 /8 = 141 in-kips
• Sreq = 142 / Xl = S~ in3 : ~ = J(6*S~/14) = 1.50 inches .... use 1.5" plate
3.) Size Bearing Pad
Design bearing pad to resist o1lowable tensile load of anchor bolt.
• Use 1 inch thick preformed fabric pad (typicoJ)
• Allowable stress = 2000 psi
• Areq = (81/2) = 40.5 in2: t = /40.5 = 6.36 in
4.) Size Nut - Washer Plate
.... use 6.5" X 6.5" pad
Determine thickness in manner simiIiIJr to bearing plate design. See Figure 1. *. • w = 81 / 6.29- = 1.91 k / in / in : M = 1.91*3.252
/ 2 = 10.()9 in - kips
• Sreq = 10.09 / Xl = 0.37 in3: ~ = /(6*0.37) = 1.49 inches .... use 1.5" plate
5.) Design Anchorage
The anchorage comprises a template to hold the anchor bolts and hold -
down bolts in place and two hellvy hex nuts to hold the bolts in place.
Design Schematics of the cap girder and the connection detail are given in FlgUl'e AS,
A.6, andA7.
214

I I IE
Figure A.2 Model of Stepped Bearing Plates
6" t
Figure A.3 Forces on Rocker Pin
I( 14" )I( 14" )I
F'agure A.4 Bearing StUfener Properties
215

g Q
=
;, <> ., :e
~
(:,1 ~ .. . o
!
--------------~~
:c ., <>
z .. .. 0 Q
t 0 .. .. '" '"
1---1---+1 _ . . ___ .L
--------t- ~ I.I.l
0.. <: u
Figure A.5 Schematic of Cap Girder ( from Texas Department of Transportation)

Sf'O. Srt f'f'eN!:(" Pt. , Yl" )( t.l Y:*'
~Pl"'.cf. F'cor1c Pad
.. ; ~~a 'tY};")(9 '~,~.
DETAIL "A"
I"'
::s Keavy Ht'x ~r.s
HOLD-DOWN BOLT DETAIL ANCHOR BOLT DETAIL
FJg1I1"e A.6 Schematic of Connectioa Details ( from Te:ms Department of Transportation)
217

SECTION D-D
o Pt.. 3 !fl- x za't. .. x ) ... Jtv.! " - : .. $I hQIC$'
CD 1'1. 2 V.- • 30- " 3',)' (w/ .... 2- ~ nol<C$ t.
.... I Y .. " 1I.l'IOt~$)
CD?t.. 2 Yz· x ,. Y2- :Ie 3'-3-(ttl/ " .. 2" tt ....,tea '&
.. - 1 y". Sf t"IoOIC$}
Q f't.. Z Yz* x 39" x 3"·J(ttl.! .... 2· 1/1 holes Ir ...... , y.. 1:1 nol.,,'
c A.H'.S.t. '%5 flntsn on tleOt"tno 4Uf"'10c<$..
2 \1,- I
I
DETAIL B
, '0 r,-
...--t--- ,.....,..--+--1----+--....;-,
BOLT TEMPLATE
YJgDI'e A.7 Schematic of Connectioo Details (coot.) ( from Texas Department 0/ TTI1nSp01tIltion )
218

APPENDIX B : DERIVATION OF BEARING PLATE EQUATIONS
p (B.1)
k
I
where k is the foundation modulus per unit
width, EI is the beam sdffness per unit width
[5].
Determ.mation of k
For uniform stress over surface of square on elastic medium. (concrete or grout),
(B.2)
where ~ is the average deflection and q is the uniform load per unit width [19,20]. If k = q
/~
(&3)
If v = 0.17 for concrete, 1-v2 = O.r.n ~ 1, which gives
k = Ec (B.4) {i
substituting Eqnation B.4 into Equation B.l gives
219

Determine Effective I.aIgth of Beariug
At PI > 3, portions of plate ineffective. I..ett:iag PI = 3 and solving Equation B.5 for I
gives
(B.6)
The maximum moment at centerline of plate is
M =..!... cosh PI - cos PI = OJJ9Pl at PI = 3 ~ 413 sinh PI + sin PI
(8.7)
which gives the maximum stress as
M~ PI J. =-=QS4-II1II: S bt2
(B.8)
I.imjting the maximum stress to the allowable bending stress Fb and solving for t gives
(B.9)
where b is the width of the beam. Subst.itutiDg Equation B.9 into Equation B.6 gives
(B.10)
(B.11)
220

Defledion Under Load P
For determination of Equation 8.18. The deflection under load P is
a :; p 1. 2 + cos PI + cosh PI b k sin PI + sinh. PI
At PI = 3 and k = Ec / JI. localized stiffness of concrete under bearing plate is
221
(B.J.l)
(BD)

ID
F087LTID F087LBID F087LTID F087LTID F087LBID F087UT2D F087UB2D F087LT2D F087LB2D F087UT2D F087UB2D F087LT2D F087LB2D F152UTlD F152UBlD FI52LTID FI52LBID F152UI2D F152UB2D F15lLT2D FI52LB2D F152UT3D FI52UB3D F15lLTID F152LB3D
F152UBlS F230UTID F230UBID F230LTID F230LBID F230LBlS F230UB1S F230LB2S
APPENDIX C : WIDE-FLANGE BEARlNG PROPERTIES
Properties of Fatigue Specimens
d d-2tf T t..,avg t",sg k (in) (in) (in) (in) (in) (m)
12.53 10.88 9.62 0.508 0.525 1.455 12.53 10.88 9.62 0.508 0.525 1.455 12.53 10.88 9.62 0.508 0.525 1.455 12.53 10.88 9.62 0.508 0.525 1.455 12.53 10.88 9.62 0.508 0.525 1.455 12.51 10.89 9.59 0.509 0.537 1.460 12.51 10.89 9.59 0.509 0.544 1.460 12.52 10.89 9.46 0.509 0.539 1.530 12.52 10.89 9.46 0.509 0.542 1.530 12.51 10.89 9.59 0.509 0.539 1.460 12.51 10.89 9.59 0.509 0.543 1.460 12.52 10.89 9.46 0.509 0.540 1.530 12.52 10.89 9.46 0.509 3 1.530 13.89 11.00 9.43 0.884 0.869 2.230 13.89 11.00 9.43 0.884 0.864 2.230 13.90 11.00 9.21 0.885 0.865 2.345 13.90 11.00 9.21 0.885 0.869 2.345 13.90 11.00 9.40 0.878 0.878 2.250 13.90 11.00 9.40 0.878 0.866 2.250 13.88 10.96 9.13 0.877 0.869~ 13.88 10.96 9.13 0.877 0.870 2.375 13.89 10.99 9.39 0.873 0.864 2.250 13.89 10.99 9.39 0.873 0.869 2.250 13.88 10.98 9.42 0.876 0.865 2.230 13.88 10.98 9.42 0.876 0.869 2.230 13.90 11.00 9.21 0.885 0.869 2.345 15.00 10.82 9.63 1.30 1.32 2.685 15.00 10.82 9.63 1.30 1.31 2.685 15.00 10.84 9.60 1.30 1.32 2.700 15.00 10.84 9.60 1.30 1.31 2.700 15.00 10.84 9.60 1.30 1.31 2.700 15.00 10.82 9.63 1.30 1.31 2.685 15.00 10.82 9.63 1.30 1.31 2.685
NOMINAL VALUES FROM AISC MANUAL WI2X87 T=9.5" d= 12.53" t.,,= 0.515" k= 1.5"
W12X152 T=9.5" d= 13.71" t.,,= 0.870" k = 2.125"
WI2X230 T=9.5" d= 15.05" t.,,= 1.285" k=2.75"
222
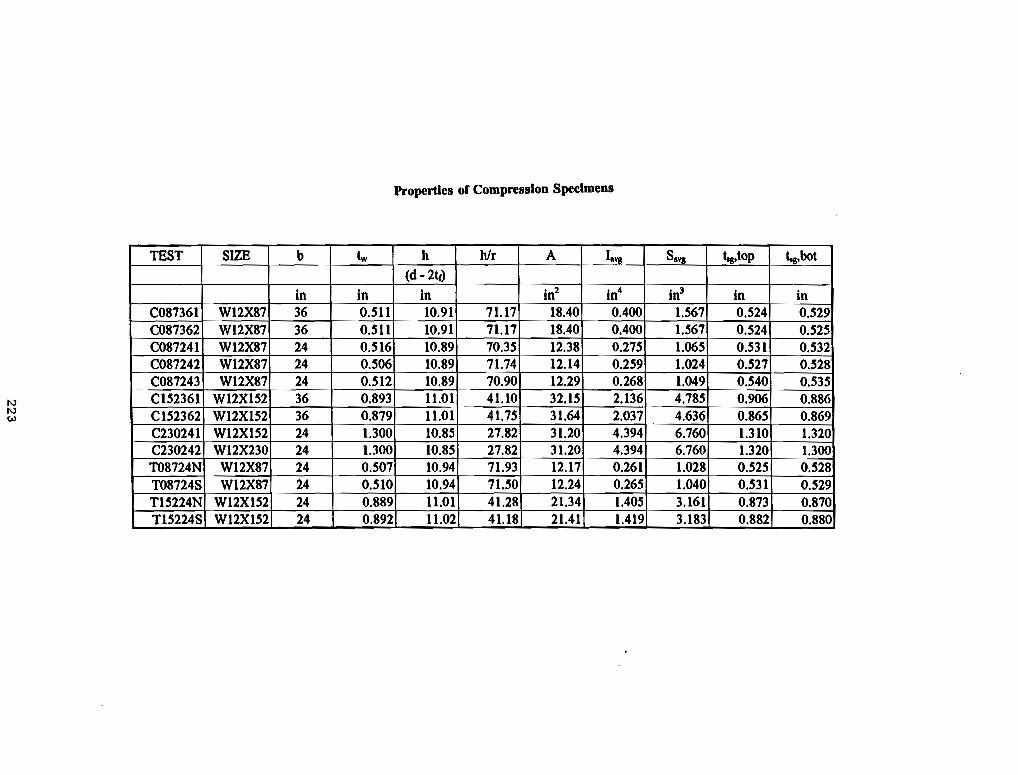
I\) I\)
w
TEST
C087361 C087362 C087241 C087242 C087243 C152361 C152362 C230241 C230242 T08724N T08724S T1S224N TlS224S
SIZE
W12X87 W12X87 W12X87 W12X87 W12X87
W12X152 W12X152 W12X152 W12X230 W12X87 W12X87
W12X152 W12X152
b tw
in in 36 0.511 36 0.511 24 0.516 24 0.506 24 0.512 36 0.893 36 0.879 24 1.300 24 1.300 24 0.507 24 0.510 24 0.889 24 0.892
Properties of Compression Specimens
h hlr A laYB SBYB t.g,top t.g,bot (d - 2te)
in in2 in4 in3 in in 10.91 71.17 18.40 0.400 1.567 0.524 0.529 10.91 71.17 18.40 0.400 1.567 0.524 0.525 10.89 70.35 12.38 0.275 1.065 0.531 0.532: 10.89 71.74 12.14 0.259 1.024 0.527 0.528; 10.89 70.90 12.29 0.268 1.049 0.540 0.535 11.01 41.10 32.15 2.136 4.785 0.906 0.886 11.01 41.75 31.64 2.037 4.636 0.865 0.869 10.85 27.82 31.20 4.394 6.760 1.310 1.320 10.85 27.82 31.20 4.394 6.760 1.320 1.300 10.94 71.93 12.17 0.261 1.028 0.525 0.528 10.94 71.50 12.24 0.265 1.040 0.531 0.529 11.01 41.28 21.34 1.405 3.161 0.873 0.870 11.02 41.18 21.41 1.419 3.183 0.882 0.880

APPENDIX D : DERIVATION OF MOMENT AND FORCE EQUATIONS
FOR WIDE-FLANGE BEARINGS
__ ----------------~E~LH ~ _____ (E_1>C ----!tJ J M
Lc h
I III
+
I ~+ t +
DisJ!1acement due to horizontal force
Rotation due to horizontal force
224
(D.1)
(D.2)

Dis,placement due to moment
(D.3)
Rotation due to moment
(D.4)
Stiffness Constant Definitions
(D.5)
(D.6)
A _ (El)c tiM -
L + h. ( (El)c ) c (El)b
(D.1)
Compatibility
(DoS)
(D.9)
225

Solve Eguations D.S and D.9 for Hand M
N= ka( Ar -¥ 1 ( 1 _ k~M )
M=
Rearrnneing Eguations D.IO and D.ll
H = I: A 'B T
M = A e t'J1 T
(D.10)
(D.11)
(D.12)
(D.13)
226

Assume a rotation is appned as shown below
• let '4: = -y iT [rotation (-)]
• '4: / iT = -y
• iT / .6.r = -(1/y)
I TOPOFBEARI
Rearranging Eguations 0.12 and 0.13
ceNTER OF ROTATION OF CAP GIF/fER
H
aT \
.:oIE---~ y
(D.14)
(D.1S)
For force and moment due to temperature change. assume 811 - 0 (from Eas. 0.10, 0.11)
(D.16)
(D.17)
227
For the moment at the top of the 'bearing due to longitudinal force (from Eg. D.9. iT- = 0)
(D.18)
228

APPENDIX E : DESIGN EXAMPLES FOR PROPOSED CONNEcrlON
NOUPLIFf
PLAN VIEW
115' 150' 115'
.ot--1Cf X 3.5" PIER COLUMN f~ • 3600 psi
LOADS
COMPRESSION BEAmNG (2lANES CONTROLS)
" UNIT STRESS
GROUP I
-t 938k
I
GROUP II
-t 645 k
I 125"
GROUP III
{-~k I Sk
125"
GROUP IV
{-~k I T
125"
Ec" 3420ksi
GRQUPV
~~k I T
140%
• BY INSPECTION, GROUP I, III, IV. OR VI WILL CONTROl
UPlIFT BEARING (2 lANES CONTROlS)
" UNIT STRESS
GROUP I
{- 338k
I 100%
GROUP II
{- 331 k
I 125"
GROUP 'II ~~7k I 3k
125"
• UPlIFT DOES NOT OCCLIR
GROUP IV
229
{-~k I T
125"
GROUP V
~~k I T
140%
GROUP VI
{-~k I 3k+T
140%

Size the Bearin& Web
1.) Try W14 using 50 ksi steel
t. ~ h.p; = 12.6.;so = 1.48 inc1u!s 11' 60 60
(10.1)
2.) Size for Group I loading, axial load only •
• Fa = 0.472Fy = 0.472(50) = 23.6 ksi : An:q = 938 / 23.6 = 39.8 in2
• @ fw = 1.48 inches, b = 26.9 inches : Try W14X370 @ 28 inches
fa .. L = 938 = 20.3 J::si < 23.6 hi, O.K. b 111' 28 (1.655)
(10.2)
Check Design for Remaining Load Cases
1.) Calculate longitudinal direction stiffness coDStaDts
• Bearing : :r., = (1/12)(28*2)*1.6553 = 21.15 in4 : ~ = 613,477 k_in2
• Pier Column : ~ = (1/12)(10*12)(35*12)3 = 740,880 in4 : (EI)c = 253E9 k_in2
• h = 12.6 in : Lc = (20+ 10)(12) = 360 inches : (El)c / (EI>t, = 4130
ill = 2.S3E9 ::: 132 .tp / bIch 36()2 (12.6) + 12.c;2 (360) + 300' + 12.6' (4130) (10.3) 233
iM ::: 2.S3E9 = 6370 .tp / rod 360 (12.6) + 36()2 + 12.c;2 (4130)
2 2
(10.4)
A - 2.S3E9 - 48284 bIch-r.r-/ rod I'M - 360 + 12.6 (4130) - '"¥"
(10.5)
230
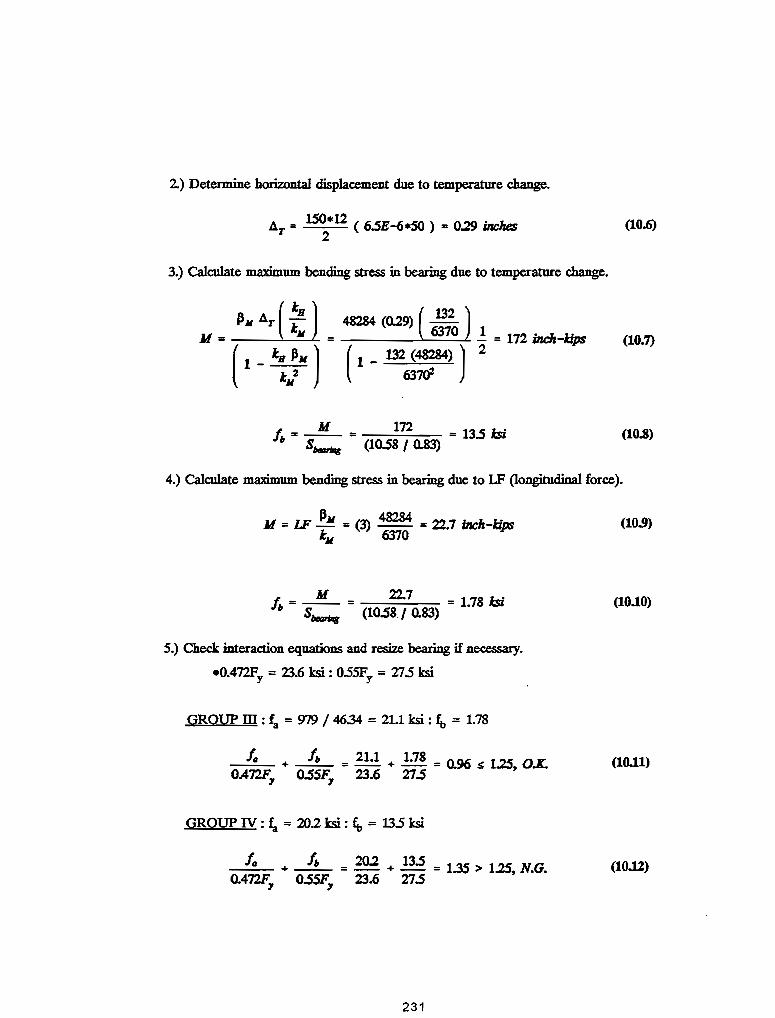
2) Determine horizontal displacement due to temperature change.
(10.6)
3.) Calculate maximum bending stress in bearing due to temperature change.
h = ~ = 172 = 13.5 hi (10.8) b Si1«riw (10.5S I Q.83)
4.) Calculate maximum bending stress in bearing due to LF Qongitudioal force).
PJI 48284 u M = U' - = (3) -- = 22.7 inch-M])S 1.11 6370
h = ~ = 22.7 = 1.7S hi b Si1«riw (10.5S./ 0.83)
5.) Checlc interaction equations and resize bearing if necessary •
• O.472Fy = 13.6 ksi: 055Fy = Z75 hi
GROup m : t'a = 979 / 46.34 = 21.1 ksi : tt, = 1.78
(10.9)
(10.10)
h + --1L = 21.1 + 1.7S = 0.96 ~ 1025 OL (10.11) O.472F, 0.55F, 23.6 27.5 '
GROUP IV : t'a = 20.2 ksi : tt, = 135 ksi
i(J + --1L .. 20.2 + 13.5 = 1.35 > 1025 N.G. (10.12) o.472F, 0.55F, 23.6 27.5 '
231

• Increase bearing width by 15%, b = 32 incl1es, A == L65S(32)=S3.0 in2
• t;. == 938 / 53 = 17.7 hi : ~ = 13.5 (28/32) = 11.8 hi
• No need to recalculate stiffness constants
It, + ~ :: 17.7 + 11.8 :: 1.18 < 1.25, OL o.472F, o.ssF, 23.6 27.5
GROUP VI: t;. == 21.1(28/32) == 18.5 hi: ~ = 11.8 + 1.78{28/32) = 13.4 hi
It, + ~ = 18.5 + 13.4 :: 1.27 < 1.40, OL (10.14) o.472F, o.5SF, 23.6 Z1.5
Check Bottom Flange for Bearins
1.) Determine length of bearing flange effective
,_ = 3.25 ....!. = 3.25 -- = 10.3 rnch4s ~ ( P )0.75 ~ 29000 ( 979 )0.75 . (IO.1S) .. Ec O.5SF, b 3420 27.5 (32)
2.) Check flange thickness
, > ~ PI., = ~ 979(10.3) = 2.51_ < , = 2.66 indies, OL (10.1", 'I F, b SO (32) 'I
3.) Check bearing stress on concrete
file = ~ = 979 = 2!J1 bi < f/ :: 3.6 isi, Ox. (10.17) '411 b 10.3 (32) c
232

Check Fatigue of Bearin& [ 1 J * L) Determine Stress Range
• 0end = .000654 radians: 0c:cnter = 0.cnrn5 radians: Or = 0.00143 radians
• Above rotations are maximum produced by fatigue truck on one striDger
• Position to produce max rotations at left interior support is shown in Fig. E.1
• Assume center of rotation at mid-depth of longitudinal stringer, y = 24+ 18=42"
8 == ~ = 76.5 = 6 J:si ,. BIIIIzrlnB (10.58 I 0.83)
8 = (6) .0CXJ77S == 3025 bI. t .00143
2.) Check Stress Range Against Allowable
• Sc = 488 / (53) = 9.21 ksi : Stp = 8.8 ksi for Category A
2.2S, = 2.2 (3.25) = 7.IS J:si < Be == 9.21, Ox.
1 - == 76.5 l1Ich-k 2
(10.18)
(10.19)
(10.20)
• Since tensile stress range does not exceed dead load comPressive stress
no need to check full stress range.
*Fatigue Design is based on the fatigue truck concept in Ref. [1]. This truck represents the typical service conditions which causes the most damage as determined from extensive weigh-in-motion studies.
233

Design BeariDg Stiffeners
• use three 9" wide stiffeners spaced at 11"
• let web thickness = 7/f!: and web height = 56-
L) Determine Minimum Thickness to Preclude BucldiDg
b/~ '-=- ~ 12 33,000
• 'min = (9/12)J(5f.XJ:1J/33f.XXJ) = 0.92 inches
2.) Calculate Properties
AASHTO '9l : 10.34.6J.
... use 1·
• Area = (9*1*6)ST + (2*11 + 2*9*1)*1WEB = 94 in2
• Ixx = (1/12)*3*18.8753 = 1681 in4
• r = J (1681/94) = 4.23 in
• Kl/r = 0.75*56/4.23 = 9.93 in
3.) Determine Compression Capacity AASHTO 10.31.1.A
• Per = FaA = (23580-1.03*9.~)*94 = 23.5*94 = '2:JJ17 kips> 938 kips, OX
.4.) Check Stiffener Bearing Stress
F" = 40 bi for SO bi steel
• ft, = 938/(6*7.5*1) = 20.8 ksi < 40 ksi, OX
The 1.5" cope reduced stiffener width from 9" to 7.5".
5.) Check Stiffener to Web Weld
F., = 19 bi for 70 I:si weld material
• assume minimum fillet weld; size = 5/16"
• fy = 938/(12*56*.707*.3125) = 6.32 ksi < 19 ksi, OX
The CODnec:tion is illustrated in FlglU'e E.2
234
·AASHTO '9l: 10.3l.1.A
AASHTO '9l : 10.3.2

24 kips 24 kips
t c:::::::::::
lFATiGUE-fRUCK1..§ ki~
L..I__ tJi __ lJ f J_OOO654 radians
~ ~ ~ ~ :IE )1: :k==-J-
45' 30' 14' 26'
END SPAN: L = 115'
24 kips 24 kips
~ FATiGUE TRUCK L'§'.!Q~
~~:-== __ OOO_775-=:=~===l_)~t=·-=3O'===i-~~t=~~:it.~f=:j j ===56'=:=::~-JJ CENTER SPAN = iSO'
YJgU.re E.1 Fatigue Truck Positiou for Maximum End Rotations
----"'- GROUT PAD
FJgU.re E.2 COnneetiOD Detail, No Uplift
235

UPLIFT
PLAN VIEW
150'
'-- • •• 'ps ,~ ., '~ 192 ki
115'
<E;--10' X 3.5' PIER COlUMN f~ -3600 psi
Ec:" 3420 ksi
• .. • .. I"
COMPRESSION 1 T SEARING
Tt UPU FT NG BEARI
."
LOADS
COMPRESSION BEARING (2 LANES CONTROLS)
% UNIT STRESS
GROUP I GROUP II
~1574k ~1096k
I I 100% 125%
GROUP III
~~1k I 3k
125%
GROUP IV
~~4k I T
125%
,.
GROUP V GROUP VI
~ ~k ~1~k I T I 3k+T
1~ 140%
• BY INSPECTION. GROUP I. III. IV. OR VI WILL CONTROL
UPUFT BEARING (2 LANES CONTROLS)
% UNIT STRESS
GROUP II
t120k
I
• GROUP III CONTROLS
GROUP III
~ t 325k lkI 203L
150%
236
GROUP IV t 298k
~I 203L
150%
GROlP V GROUP VI
t 331 k t325k
"'):I 3S1203L
150% 150%

From. design of compression bearing (calculations not shown)
• W14X455 @ 36" : lw = 2.015 .. : Fy = 50 hi
Determine the Uplift Load
• TD = 1.22 k : TL = 203 k (Group III)
1.) Tup = 1.22 + 2(203) = 528 kips
2.) Tup = 1.5(203 + 1.22) = 488 kips
Design Uplift Resisting Elements
Hold-Down Bolts
• use A193 GR B7 @ Fy = 105 ksi, 1-5 .. diameter
1- controls
• Drcq = 528/(0.55*105*1.41*1.5) = 4.32 bolts 1- use 6 bolts
Wide-Flange Bearing
T. = 1.5 ( o.sS (SO) (36) 2.015 ) = 2993 " ~ T. = S28 I;, O.K. (10.22)
Anchor Bolts
• use 150 ksi threadbar (ASTM A722). 4 anchor bolts per connection
• anchor bolts on 11" X 11" pattern
• Areq = 528/( 4~.66*150*1.5) = 0.88 in2
. Connection Between Bearing Top Aange and Om Girder
• perimeter length of top flange = 2*36+ 2*16.84 = 106 inches
• use fillet weld, Fv = OZT (65) = 17.6 ksi
.1rcq = 528/(0.707*17.6*1.5*106) = OZT in -+ use 5/1()'f (miDimnm size)
Desien Anchorage
• See "Design of Headed Anchor Bolts" by I.G. Shipp and E.R.
Haninger. EDgineering IournaJ, AISC, Second Quarter 1983.
[17]
237

• Embedment depth necessary to produce anchor bolt failure
before concrete breakout is 84 inches. A typical anchorage is
shown in FlgUI'e 8.5.
DetermiDe Pretension Force
• Bo = TD + TL = 122 + 203 = 325 kips
Check Fatigue of Anchor Bolts
Calculate Comlection Stiffnesses
1.) Anchor Boh
• Lt, = free length (69") + one·half of embedment depth (42-) = 109"
• use E = 30,000 ksi for threadbar
1. = 4 (1.25) (30000) = 1376 kips per inch 109
2) Cap Girder and Stiffeners
• same properties as in No Uplift Example
• hw = 56", Ast = 54 in2, ~ = (22 + 36)*.5*(7/8) = 25.4 in2
1pr1 = 29000 ( : + 25.4) = 41120 kips per inch
3.) Wide·F1ange Bearing
1 .... = 36 (20lS) 29000 = 167000 • per men 12.6
238
(10.25)
(10.26)

4.) Concrete
• ~ == 36(16.48) == S93 in2, ~ == 11(11) = 121 in2
t = (594 + 121 ) 3420 == 14560 14.... inch -- 284 ~per
(10.27)
5.) Concrete Under Bearing Plate
tc.pl = Q.3 (3420) J13.5 36 = 135700 • per inch (1D.28)
6.) Total Compression Element Stiffness
t = [ _1_ + 1 + _1_ + 1 ]-1 = 9400 J.n- r inch (10.29) c 41120 167000 14560 135700 "".f'V pe
Transverse Direction
• for lane loading, Srp = 13 ksi for category E; should also
check for multiple truck loading and single truck loading
(AASHTO '92 10.3.1- 10.3.2) or use Guide Spec [1].
T, = 4 (1.25) 13 [ 1 + 9400 J = S09 i; > T£ = 203, Ox. (10.30) 1376
Lopgitudinal Direction
• let (J r = 0.006 from simplified method described in Section 4.2.3
Sr = 5.5 (1376/4) 0.006 :: 9.1 hi < Srp :: 13 hi, O.K. (10.31) 1.25
239

Design BeariDg Stiffeners
Determine Length of To,p Stiffeners
• use minimum weld size 5/16"
• Lreq = 5"l13/(12·0.7fI1· .3125·17.6·1.5) = 7.54 in: add 15" for cope
• use lO"long stiffener, leave 2" gap for lower stiffener
• use 44" lower stiffener, all stiffeners 1" X 9"
Uplift detail shown below.
""--'1:*--:=:::=_1.25" • THREADBAR
2"GAP
1" X 9" STIFFENERS
W14X455 @ 36"
~~~L-, -----'- GROUT PAD
1.5", HOIJ)..OOWN BOLTS
F"JgDl"e E.3 Connection Detail, Uplift
240

REFERENCES
1. AASHTO, Guide Specifications for Fatigue Design of Steel Bridges, American Association of State Highway and Transportation Officials; Washington, D.C., 1989.
2. AASHTO, Standard Specifications for Highway Bridges, 15th Edition, American Association of State Highway and Transportation Officials; Washington, D.C., 1992.
3. AISC, Manual of Steel Construction, Allowable Stress Design, 9th Edition, American Institute of Steel Construction; Chicago, IL, 1989.
4. Chen, W.F., and Lui, E.M., Structural Stability: Theory and Implementation, Elsevier Science Publishing Co., Inc., 1987.
5. Den Hartog, J.P., Advanced Strength of Materials, Dover Publications, Inc., New York, 1952 (pp. 141-162).
6. Denio, R.J., Yura, J.A., and Kreger, M.E., Concrete Pier Caps Under Concentrated Bearing Loads, Research Report 1302-1, Center for Transportation Research, The University of Texas, February 1995,118 p.
7. DSI, DYWIDAG Threadbar Post-tensioning System, Brochure, DYWIDAG Systems International, April 1988.
8. DUPONT, Design of Neoprene Bridge Bearing Pads, Second Printing, Elastomer Chemical Department, E.I. duPont de Nemours and Co., Inc., Delaware, November 1959.
9. Fischer, F.L., and Frank, K.H., "Axial Tension Fatigue Strength of Anchor Bolts," Research report 172-1, Center for Highway Research, The University of Texas at Austin, March 1977.
10. Haaijer, G. and Thurlimann, B., "Inelastic Buckling in Steel," ASCE Transactions, Vol. 125, 1960 (pp. 308-338).
11. Joehnk, J.M., "Fatigue Behavior of Welded Joints Subjected to Variable Amplitude Stresses," Master's Thesis, The University of Texas at Austin, August 1982.
12. Kulak, G.L., Fisher, J.W., and Struik, J.H.A., Guide to Design Criteria for Bolted and Riveted Joints, 2nd Edition, John Wiley and Sons, New York, 1987.
13. Olsen, J.E., "Parametric Study of Curved Steel Girders Supported on Narrow Concrete Piers," Master's Thesis, The University of Texas at Austin, May 1994.
241

14. Ometron, SPATE 9000 User's Manual, John Deere and Co., 1988
15. Salmon, C.G., and Johnson, J.E., Steel Structures: Design and Behavior, 3rd Edition, Harper and Row, Publishers, Inc., New York, 1990.
16. SASI, ANSYS User's Manual, Revision 5.0, Swanson Analysis Systems, Inc., Houston, PA, 1992.
17. Shipp, J.G., and Haninger, E.R., "Design of Headed Anchor Bolts," Engineering Journal, AISC, Second Quarter, 1983.
18. Timoshenko, S.P., and Gere, J.M., Theory of Elastic Stability, 2nd Edition, McGrawHill Book Co., 1961.
19. Timoshenko, S.P., and Goodier, .. I.N., Theory of ElastiCity, 3rd Edition, McGraw-Hili Book Co., New York 1961.
20. Salmon, C.G., Schenker, L., and Johnston, B.G., "Moment-Rotation Characteristics of Column Anchorages," ASCE Transactions, Vol. 122, 1957 (pp. 132-154).
21. TSDHPT, Bridge Design Guide, 1st Edition, Texas Department of Highways and Public Transportation, 1990.
22. USS, "V-Load Analysis: An Approximate Procedure, .... ," United States Steel Corp. Highway Structures DeSign Handbook, Chapter 12, Volume 1,1984.
23. Witecki, A.A., and Raina, V.K, "Distribution of Longitudinal Horizontal Forces Among Bridge Supports," Concrete Bridge Design, ACI PaperSP23-45, Detroit, MI, 1969 (pp. 803-815).
24. Ales, J.M., Jr., "The Connection Between an Integral Steel Cap Girder and a Concrete Pier," Ph.D. Dissertation, The University of Texas at Austin, December 1994.
25. Salmon, C.G., and Wang, C.K, Reinforced Concrete Design, Fourth Edition, Harper & Row, New York, 1985.
26. Schlaich, J., Schafer, K, and Jennewein, M., "Towards a Consistent Design of Structural Concrete," PCI Journal, May-June 1987, pp. 75-150.
27. Bergmeister, K, Breen, J.E., Jirsa, J.~., and Kreger, M.E., "Detailing for Structural Concrete - Draft Report," Research Report 1127-3F, Center for Transportation Research, The University of Texas at Austin, October 1990.
242