Geotechnical Earthquake Engineering and Soil Dynamics IV ...

12. Geotechnical Soil Analysis Report
12. Geotechnical Soil Analysis Report
REPORT OF GEOTECHNICAL ENGINEERING SERVICES Holley Park Subdivision 33105 NE Ivy Avenue La Center, Washington For Compass Group, LLC January 14, 2019 GeoDesign Project: CompassGrp-1-01
703 Broadway Street, Suite 650 l Vancouver, WA 98660 l 360.693.8416 www.geodesigninc.com
January 14, 2019 Compass Group, LLC PO Box 1900 Battle Ground, WA 98604 Attention: Kevin Tapani
Report of Geotechnical Engineering Services Holley Park Subdivision
33105 NE Ivy Avenue La Center, Washington
GeoDesign Project: CompassGrp-1-01 GeoDesign, Inc. is pleased to submit this report for the proposed Holley Park subdivision located at 33105 NE Ivy Avenue in La Center, Washington. Our services for this project were conducted in accordance with our proposal dated November 6, 2018. We appreciate the opportunity to be of service to you. Please contact us if you have questions regarding this report. Sincerely, GeoDesign, Inc. Nick Paveglio, P.E. Brett A. Shipton, P.E. Senior Associate Engineer Principal Engineer cc: Seth Halling, AKS Engineering and Forestry (via email only) NNP:BAS:kt
Attachments
One copy submitted (via email only)
Document ID: CompassGrp-1-01-011419-geor.docx
© 2019 GeoDesign, Inc. All rights reserved.

i CompassGrp-1-01:011419
EXECUTIVE SUMMARY The primary geotechnical considerations for the project are summarized as follows:
The proposed buildings can be supported by conventional spread footings bearing on the
native soil at the site. Spread footings should not be established on agricultural tilled zones.
Minimum setback buffers of 25 and 50 feet should be established from the crests of the slopes in the north and south portions of the site, respectively. Buffer zones should remain undisturbed during construction, with the exception of trenches to dispose stormwater, unless additional geotechnical analysis is completed.
Based on the results of our explorations, the soil at the site is not susceptible to liquefaction or lateral spreading.
Site explorations encountered a tilled zone in the upper 12 to 30 inches of soil over a majority of the site from past agricultural activities. In general, the tilled zone is unconsolidated and will provide poor support for foundations, fills, floor slabs, and pavements. In roadways and beneath buildings where the tilled zone will not be removed by site cuts, we recommend that the tilled zone be improved by scarifying and re-compacting or cement treating as described in the “Construction” section.
The near-surface soil is sensitive to disturbance when at a moisture content that is above optimum. This can result in subgrade damage during construction and significant repair costs. We recommend that the project budget include subgrade protection. A discussion of subgrade protection is included in the “Construction” section.
Perched groundwater was observed within approximately 10 feet of the ground surface.
Based on our experience, groundwater could be within 5 feet of the ground surface during the wet season. The presence of shallow groundwater will affect construction of the proposed development. Earthwork contractors should be prepared to dewater excavations at all times of the year.
Based on the soil and groundwater conditions at the site, on-site infiltration systems are not recommended.

CompassGrp-1-01:011419
TABLE OF CONTENTS PAGE NO. ACRONYMS AND ABBREVIATIONS 1.0 INTRODUCTION 1 2.0 PROJECT UNDERSTANDING 1 3.0 PURPOSE AND SCOPE 1 4.0 SITE CONDITIONS 2 4.1 Surface Conditions 2 4.2 Subsurface Conditions 2 4.3 Geologic Hazards 3 5.0 DESIGN 6 5.1 Foundation Support 6 5.2 Seismic Design Criteria 7 5.3 Floor Slabs 7 5.4 Retaining Structures 7 5.5 Drainage 8 5.6 Permanent Slopes 9 5.7 Pavements 9 6.0 CONSTRUCTION 10 6.1 Site Preparation 10 6.2 Construction Considerations 10 6.3 Temporary Slopes 11 6.4 Erosion Control 11 6.5 Excavation 12 6.6 Materials 13 7.0 OBSERVATION OF CONSTRUCTION 17 8.0 LIMITATIONS 18 REFERENCES 19 FIGURES Vicinity Map Figure 1 Site Plan Figure 2 Site Plan - Slope Percentage Figure 3 APPENDICES Appendix A Field Explorations A-1 Laboratory Testing A-1 Exploration Key Table A-1 Soil Classification System Table A-2 Boring Logs Figures A-1 – A-3 Test Pit Logs Figures A-4 – A-13 Atterberg Limits Test Results Figure A-14 Summary of Laboratory Testing Figure A-15

CompassGrp-1-01:011419
TABLE OF CONTENTS PAGE NO. APPENDICES (continued) Appendix B Slope Stability Analysis B-1 Slope Stability Analysis Results

CompassGrp-1-01:011419
ACRONYMS AND ABBREVIATIONS AASHTO American Association of State Highway and Transportation Officials AC asphalt concrete ASTM American Society for Testing and Materials BGS below ground surface g gravitational acceleration (32.2 feet/second2) HMA hot mix asphalt H:V horizontal to vertical IBC International Building Code MCE maximum considered earthquake OSHA Occupational Safety and Health Administration pcf pounds per cubic foot PG performance grade psf pounds per square foot psi pounds per square inch SPT standard penetration test USDA U.S. Department of Agriculture USGS U.S. Geological Survey WSS Washington Standard Specifications for Road, Bridge, and Municipal
Construction (2018)
1 CompassGrp-1-01:011419
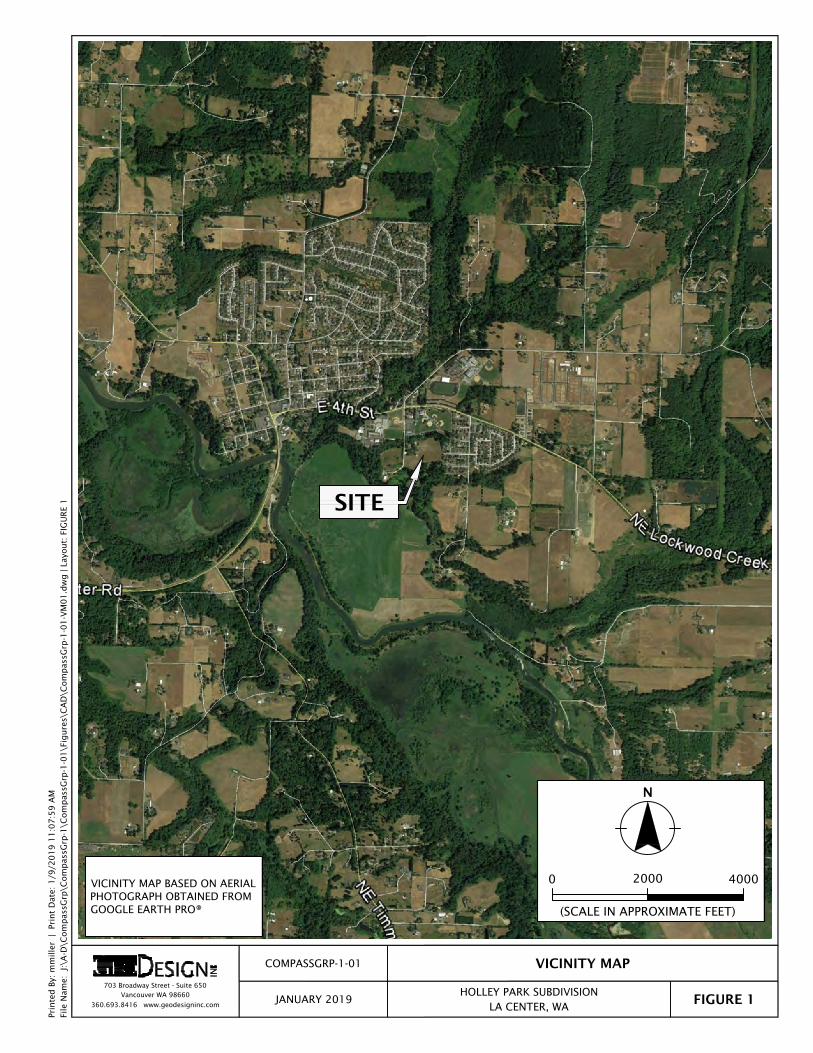
1.0 INTRODUCTION This report presents the results of our geotechnical engineering evaluation for the proposed Holley Park subdivision at 33105 NE Ivy Street in La Center, Washington. The site is shown relative to surrounding features on Figure 1. Figure 2 shows the locations of our explorations for this study. Acronyms and abbreviations used herein are defined above, immediately following the Table of Contents. 2.0 PROJECT UNDERSTANDING The project includes construction of a residential subdivision with detached single-family houses. Based on correspondence with AKS Engineering and Forestry (AKS), site cuts and fills are expected to be 5 feet or less. Stormwater generated from the development will be treated and disposed of off site. 3.0 PURPOSE AND SCOPE
The purpose of our services was to provide geotechnical engineering recommendations for design and construction of the proposed development. The specific scope of our services is summarized as follows: Reviewed readily available published geologic data and our in-house files for existing
information on subsurface conditions in the site vicinity. Coordinated and managed the field explorations, including locating utilities and scheduling
subcontractors and GeoDesign field staff. Drilled three borings to depths between 34.7 and 46.4 feet BGS. Excavated 10 test pits to depths between 16.0 and 18.0 feet BGS. Collected soil samples for laboratory testing at select depths from the explorations. Classified the materials encountered in the explorations. Maintained a detailed log of each exploration. Observed groundwater conditions in the
explorations. Completed a laboratory testing program that included the following:
Seventeen moisture content determinations in general accordance with ASTM D2216 Fourteen particle-size analyses in general accordance with ASTM C117 or ASTM D1140 Three Atterberg limits tests in general accordance with ASTM D4318
Prepared this geotechnical report summarizing our explorations, laboratory testing, analyses, geotechnical design criteria, and construction recommendations, including information relating to the following: Soil and groundwater conditions Geologic hazards and slope setbacks Earthwork guidelines Seismic design parameters Foundation Pavements

2 CompassGrp-1-01:011419
4.0 SITE CONDITIONS 4.1 SURFACE CONDITIONS The approximately 14.37-acre site is located southeast of downtown La Center, Washington. The site is bound by a small drainage and park to north; a residential subdivision to the east; undeveloped, sloping land to the south; and a large residential property to the west. The northwest corner of the site is occupied by a residence with multiple barns and outbuildings and the remainder of the site is undeveloped and likely used for agricultural purposes. The majority of the site slopes gently to the south between elevations of approximately 130 and 115 feet, with the exception of slopes along the north and south boundaries. The site slopes are discussed in greater detail in the “Geologic Hazards” section. The site is generally covered with grass and trees are present along the north and south slopes and around the residence. 4.2 SUBSURFACE CONDITIONS 4.2.1 General Subsurface conditions at the site were evaluated by drilling three borings (B-1 through B-3) to depths between 34.7 and 46.4 feet BGS and excavating 10 test pits (TP-1 through TP-10) to depths between 16.0 and 18.0 feet BGS. The approximate locations of the explorations are shown on Figure 2. Descriptions of the field explorations and laboratory testing programs, logs of the explorations, and results of the laboratory testing are presented in Appendix A. 4.2.2 Root and Agricultural Tilled Zones An approximately 12– to 30-inch thick tilled zone from agricultural activities is present at the site. The zone consists of very soft to soft, brown silt with variable fractions of sand. A root zone averaging approximately 5 to 6 inches with areas up to 12 inches is present within the tilled zone. 4.2.3 Silt and Sand (Flood Deposits) Native soil that underlies the tilled zone consists of Quaternary Age flood deposits comprised of soft to medium stiff silt and medium dense, silty sand. The sand content and stiffness of the flood deposits generally increases with depth. The flood deposits extends to depths between 25 and 30 feet BGS at the site. Laboratory testing indicates the silt has low plasticity silt and flood deposits had moisture contents between approximately 32 and 40 percent at the time of explorations. 4.2.4 Clay and Gravel (Conglomerate) Underlying the flood deposits is Pleistocene Age conglomerate. The conglomerate consists of an approximately 5- to- 10- foot-thick layer of very stiff clay underlain by dense gravel with clay and sand. Based on laboratory testing the moisture content of the conglomerate ranged from 30 to 32 percent at the time of our explorations. The conglomerate extends to the maximum depth explored of 46.4 feet BGS. Geologic mapping indicates the conglomerate is approximately 60 to 120 feet in thickness.

3 CompassGrp-1-01:011419
4.2.5 Groundwater Groundwater was generally encountered in the explorations between depths of 10 and 14 feet BGS. A review of water well logs and groundwater mapping suggests the regional static groundwater table is 50 feet BGS or more and the groundwater encountered during the explorations is perched. Based our experience, the perched groundwater could rise to within 5 feet of the ground surface during the wet season. 4.3 GEOLOGIC HAZARDS 4.3.1 General Site classes as defined in the IBC range from A to F, with E having the highest relative ground amplification. Site Class F requires a site-specific seismic study. Based on the results of our explorations, a Site Class D is appropriate for the site. 4.3.2 Liquefaction and Lateral Spread (Seismic Hazard Areas) Liquefaction is caused by a rapid increase in pore water pressure that reduces the effective stress between soil particles to near zero. Granular soil, which relies on interparticle friction for strength, is susceptible to liquefaction until the excess pore pressures can dissipate. In general, loose, saturated sand soil with low silt and clay content is the most susceptible to liquefaction. Silty soil with low plasticity is moderately susceptible to liquefaction under relatively higher levels of ground shaking. According to the Alternative Liquefaction Susceptibility Map of Clark County by Palmer et al. (2004), the site is described as having very low liquefaction susceptibility. Based on the results of our explorations, liquefaction is expected to be negligible at the site and is not a design consideration. Lateral spreading is a liquefaction-related seismic hazard and occurs on gently sloping or flat sites underlain by liquefiable sediment adjacent to an open face, such as a riverbank. Liquefied soil adjacent to an open face can flow toward the open face, resulting in lateral ground displacement. There are no major open faces, and the liquefaction potential at the site is low. Accordingly, the potential for lateral spreading at the site is not a design consideration for the project. 4.3.3 Fault Rupture Based on USGS mapping, the nearest mapped fault to the site is the Lacamas Lake fault, which is located approximately 14 miles to the southeast. As such, fault rupture is not considered a hazard at the site. 4.3.4 Landslides 4.3.4.1 Stability Analysis According to Chapter 18.300 (Critical Areas) of the La Center Municipal Code, slopes greater than 25 percent are considered “landslide hazard areas.” Based on this criteria, the slopes in the north and south portions of the site are considered landslide hazard areas. Figure 3 shows the slope percentages at the site.

4 CompassGrp-1-01:011419
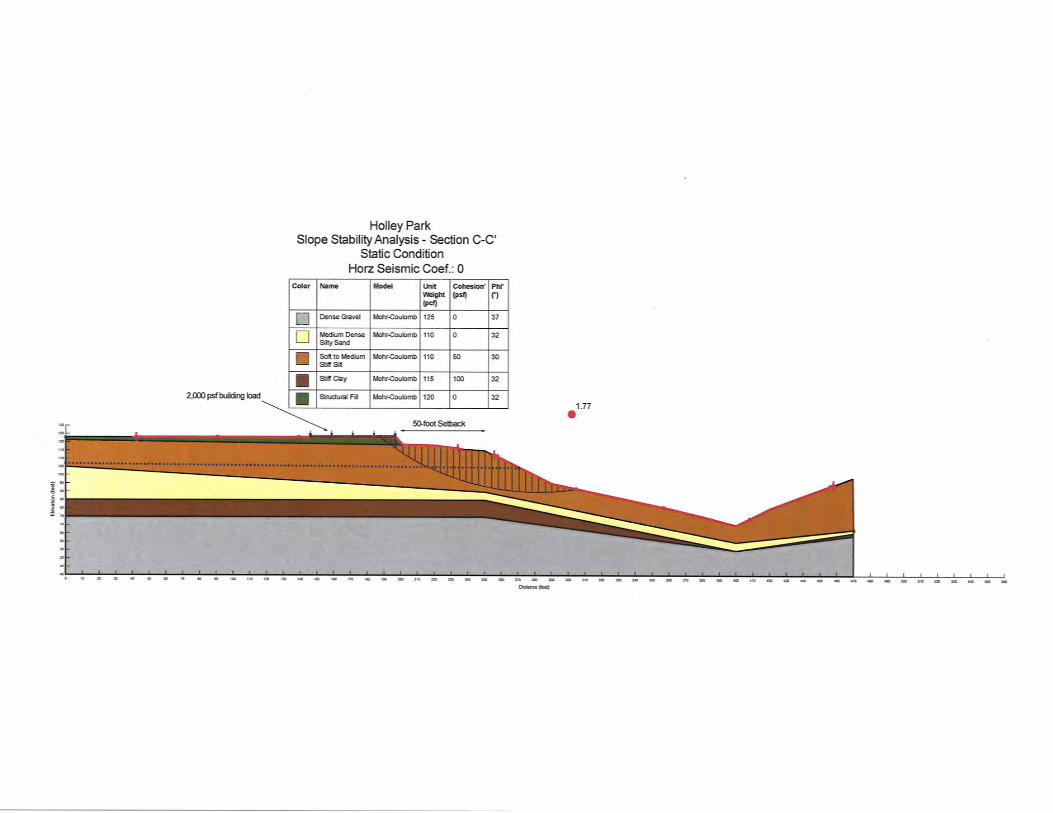
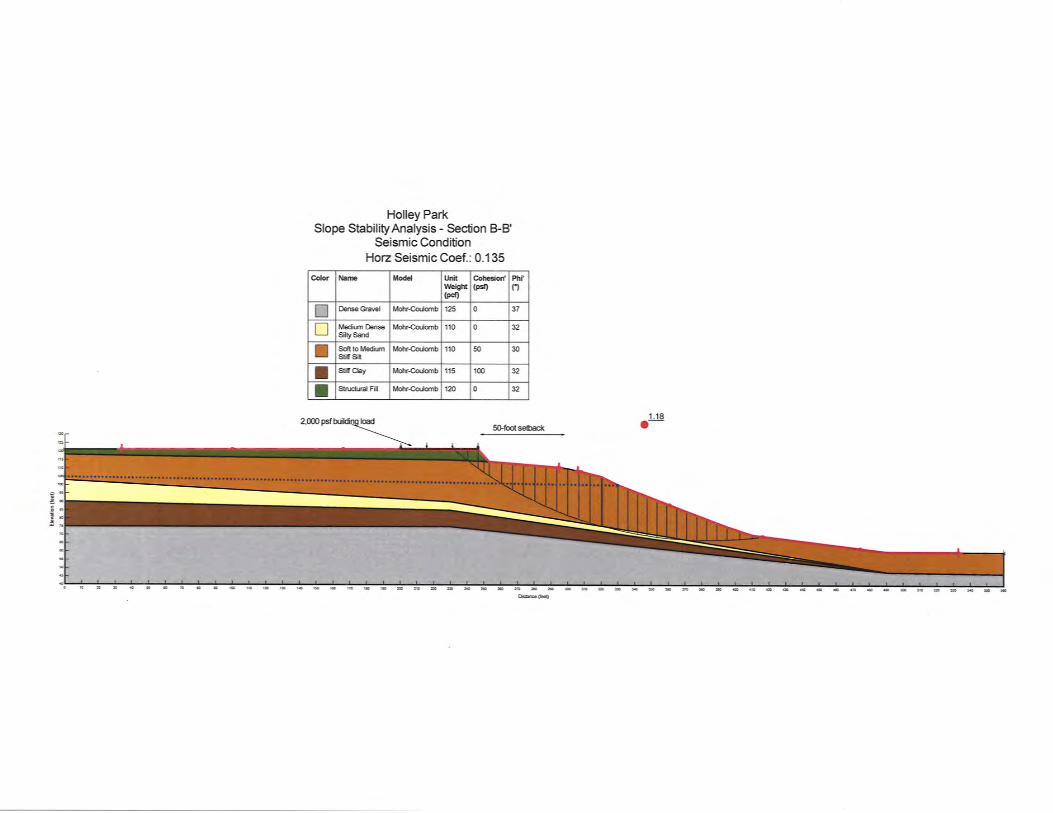
Due to the presence of landslide hazard areas, stability analysis was completed to determine appropriate setbacks in accordance with the La Center Municipal Code. Analysis was completed using Slope/W by Geo-Slope International, Ltd. Slope/W performs two-dimensional limiting equilibrium analysis to compute slope stability. The factor of safety against slope failure is simplistically defined as the ratio of the forces resisting slope movement (e.g., soil strength, soil mass, etc.) to the forces driving slope movement (e.g., soil weight, water pressure). The program predicts the location and geometry of “critical failures planes.” Critical failure planes are the zones with the lowest factors of safety. A factor of safety less than 1.0 infers that the model is not in equilibrium and slope movement is likely to occur. Standard of care generally dictates that a minimum factor of safety for static and seismic conditions be 1.5 and 1.1, respectively. Our analysis included one section (A-A’) in the north portion of site and two sections (B-B’ and C-C’) in the south portion of the site. The locations of the analysis are shown on Figures 2 and 3 and were chosen to represent “worst case” scenarios. The subsurface conditions were based on the results of our explorations, laboratory testing, and experience with similar soil. A conservative surcharge load of 2,000 psf was used for the entire footprint of residences and a maximum of 5 feet of fill was assumed per AKS. This is conservative where roadways are above slopes because the surcharge loading associated with the roadways would be 250 psf. A seismic coefficient of 0.135 g (one-half the site peak ground acceleration of 0.27 g) was used for the seismic condition. The configurations, soil parameters, and results of the analysis are presented in Appendix B. 4.3.4.2 Buffer Recommendation Minimum setback buffers of 25 and 50 feet should be established from the crests of the slopes in the north and south portions of the site, respectively. Buffer zones should remain undisturbed during construction, with the exception of trenches to dispose stormwater, unless additional geotechnical analysis is completed. The locations of the buffers should be clearly shown on the project plans. Provided design and construction of the development near the slopes are completed conformance with the recommendations of this report, it is our opinion that the proposed development will not adversely affect the short- or long-term stability of the slopes nor pose a significant risk to public safety. 4.3.4.3 Stormwater System Recommendations on Steep Slopes Surface water should not be allowed to sheet flow onto steep slope faces. Stormwater should be collected and transferred to the base of all steep slopes in solid pipes, and angular rock should be installed at the base of the outfall pipes to dissipate energy generated from the gradient. Granular backfill for pipes on steep slopes will create preferential flow paths for water that can generate moderate velocities within the trenches and a potential for piping. Where stormwater pipes are installed in slopes that exceed 15 percent, we recommend the trench backfill consist of fine-grained soil. If trenches are installed in the wet season and compaction of fine-grained soil

5 CompassGrp-1-01:011419
is not possible, granular backfill can be used provided cutoff trenches, consisting of low-strength concrete or high-plasticity clay, are installed every 25 feet to reduce subsurface water velocities with the pipe backfill. Stormwater infiltration systems are not recommended for the project. We recommend that stormwater detention ponds located within 200 feet of the crest of any slope be lined with an impermeable membrane or bentonite to prevent water from infiltrating into the subsurface soil. 4.3.5 Erosion Hazard The USDA Web Soil Survey indicates that the surficial soil at the site consists of Gee, Hillsboro, and Odne silt loam. The survey describes these soils as having very low to low permeability and slight to very severe erosion hazard when the soil is left bare, depending on slope gradient. Based on our experience with similar soils, the erosion hazard is moderate to very severe when the soil is left bare and where slope gradients are steeper than 15 percent. Where slope gradients are less than 15 percent, erosion hazard is low to moderate Currently, the ground surface at the site is covered with grass, brush, and trees. We consider the site (in its current state) to have a low to moderate erosion hazard. The proposed development of the site will remove much of the existing vegetation in the development area. This will temporarily increase the erosion hazard to moderate to severe. It is our understand that disturbance to slopes steeper than 25 percent will not occur during construction; therefore, very severe erosion hazards should not be present. During construction of the proposed development, erosion control measures as discussed in this report and as recommended by the project civil engineer shall be employed. With a properly implemented erosion control plan, the impact of erosion on the site during construction should be minimal and easily mitigated as part of finished grading. If suitable erosion control measures are implemented and maintained throughout construction until a new vegetative cover is established, there should be little or no adverse impact to the overall stability of the site or to neighboring sites. Upon completion of the proposed development, the majority of the development area will either be covered with pavement, sidewalks, or homes or will be landscaped with conventional residential ornamental shrubs and ground cover. We anticipate the open space areas will remain covered with native vegetation. Surface run-off will be greatly decreased due to the collection of surface water from the streets and roof tops. The collected run-off will then be directed to the stormwater detention pond in the southwest corner of the site. In our opinion, these final “built-out” conditions will result in a low future erosion hazard.

6 CompassGrp-1-01:011419
5.0 DESIGN 5.1 FOUNDATION SUPPORT 5.1.1 Bearing Capacity The proposed buildings can be supported on conventional spread footings bearing on undisturbed native soil or structural fill overlying undisturbed native soil. Foundation elements should not be supported on agricultural till. If present, the agricultural till should be removed and replaced with structural fill. 5.1.2 Bearing Capacity Continuous wall and isolated spread footings should be at least 18 and 24 inches wide, respectively. The bottom of exterior footings should be at least 18 inches below the lowest adjacent exterior grade. The bottom of interior footings should be established at least 12 inches below the base of the slab. Footings should be embedded so that a minimum of 10 feet of horizontal clearance exists between the toe of the footing and any adjacent slopes. Footings bearing on native silt or new structural fill on native soil should be designed assuming an allowable bearing pressure of 2,000 psf. This is a net bearing pressure; the weight of the footing and overlying backfill can be ignored in calculating footing sizes. Also, the allowable bearing pressures apply to the total of dead plus long-term live loads and can be increased by one-half for short-term loads, such as those resulting from wind or seismic forces. Total post-construction foundation settlement should be less than 1 inch, with differential settlement between similarly loaded foundations of less than ½ inch. 5.1.3 Resistance to Sliding Lateral loads on footings can be resisted by passive earth pressure on the sides of the structure and by friction on the base of the footings. An unfactored passive earth pressure of 350 pcf can be used for footings confined by firm native soil. Adjacent floor slabs, pavement, or the upper 12-inch depth of adjacent unpaved areas should not be considered when calculating passive resistance. In order to rely on passive resistance, a minimum of 10 feet of horizontal clearance must exist between the face of the footings and adjacent downslopes. For footings in contact with the native soil, a coefficient of friction equal to 0.35 may be used when calculating resistance to sliding. 5.1.4 Subgrade Observation All footing and floor subgrades should be evaluated by qualified personnel to evaluate the bearing conditions. Observations should also confirm that all loose or soft material, organics, unsuitable fill, prior topsoil zones, and softened subgrades (if present) have been removed. Localized deepening of footing excavations may be required to penetrate any deleterious material. 5.1.5 Construction Considerations If footing excavations are conducted during wet weather conditions, we recommend that a minimum of 3 inches of granular material be placed and compacted until well keyed at the base

7 CompassGrp-1-01:011419
of the footing excavations. The granular material reduces water softening of silt-rich subgrade soil, reduces subgrade disturbance during placement of forms and reinforcement, and provides clean conditions for the reinforcing steel. 5.2 SEISMIC DESIGN CRITERIA Table 1 provides seismic design parameters in accordance with IBC 2015. We selected a Site Class D based the results of explorations and testing.
Table 1. IBC 2015 Seismic Design Parameters
Parameter Short Period
(Ts = 0.2 second) 1 Second Period (T1 = 1.0 second)
MCE Spectral Acceleration, S Ss = 0.890 g S1 = 0.397 g
Site Class D
Site Coefficient, F Fa = 1.144 Fv = 1.606
Adjusted Spectral Acceleration, SM SMS = 1.018 g SM1 = 0.638 g
Design Spectral Response Acceleration Parameters, SD
SDS = 0.679 g SD1 = 0.425 g
5.3 FLOOR SLABS Satisfactory subgrade support for building floor slabs supporting up to 100 psf area loading can be obtained provided the building pad is prepared as described in the “Construction” section. The floor slab be supported on at least 6 inches of imported granular material to aid as a capillary break and to provide uniform support. The imported granular material should be placed and compacted as described in the “Structural Fill” section. Exterior slabs, such as those for patios, walkways, driveways, and garages, should be structurally independent from the building foundations. Expansion joints should be provided between floor slabs and foundations. This will allow minor movement of the slabs to occur as a result of vehicular loading, tree root growth, seasonal soil shifting, and other factors, while reducing the potential for slab cracking around the perimeter. Interior slabs may be tied to the building’s foundation system. Slabs should be reinforced according to their proposed use and per the structural engineer’s recommendations. 5.4 RETAINING STRUCTURES 5.4.1 Assumptions Our retaining wall design recommendations are based on the following assumptions: (1) the walls consist of conventional, cantilevered retaining walls, (2) the walls are less than 8 feet in height, (3) the backfill is drained and consists of imported granular material, and (4) the backfill has a slope flatter than 4H:1V. Re-evaluation of our recommendations will be required if the retaining wall design criteria for the project varies from these assumptions.

8 CompassGrp-1-01:011419
5.4.2 Wall Design Parameters Permanent retaining structures free to rotate slightly around the base should be designed for active earth pressures using an equivalent fluid unit pressure of 35 pcf. If retaining walls are restrained against rotation during backfilling, they should be designed for an at-rest earth pressure of 55 pcf. Seismic lateral forces can be calculated using a dynamic force equal to 7H2 pounds per linear foot of wall, where H is the wall height. The seismic force should be applied as a distributed load with the centroid located at 0.6H from the wall base. Footings for retaining walls should be designed as recommended for shallow foundations. If surcharges (i.e., slopes steeper than 2H:1V, foundations, vehicles, etc.) are located within a horizontal distance of twice the height of the wall from the back of the wall, additional pressures will need to be accounted for in the wall design. Our office should be contacted for appropriate wall surcharges based on the actual magnitude and configuration of the applied loads. 5.4.3 Wall Drainage and Backfill The above design parameters have been provided assuming drains will be installed behind walls to prevent buildup of hydrostatic pressures behind all walls. If a drainage system is not installed, our office should be contacted for revised design forces. Backfill material placed behind the walls and extending a horizontal distance of ½H, where H is the height of the retaining wall, should consist of retaining wall select backfill placed and compacted in conformance with the “Structural Fill” section. A minimum 6-inch-diameter, perforated collector pipe should be placed at the base of the walls. The pipe should be embedded in a minimum 2-foot-wide zone of angular drain rock that is wrapped in a drainage geotextile fabric and extends up the back of the wall to within 1 foot of the finished grade. The drain rock and drainage geotextile fabric should meet specifications provided in the “Materials” section. The perforated collector pipes should discharge at an appropriate location away from the base of the wall. The discharge pipe(s) should not be tied directly into stormwater drain systems, unless measures are taken to prevent backflow into the drainage system of the wall. Settlement of up to 1 percent of the wall height commonly occurs immediately adjacent to the wall as the wall rotates and develops active lateral earth pressures. Consequently, we recommend that construction of flatwork adjacent to retaining walls be postponed at least four weeks after backfilling of the wall, unless survey data indicates that settlement is complete prior to that time. 5.5 DRAINAGE 5.5.1 Temporary During work at the site, the contractor should be made responsible for temporary drainage of surface water as necessary to prevent standing water and/or erosion at the working surface. During rough and finished grading of the site, the contractor should keep all pads and subgrade free of ponding water.

9 CompassGrp-1-01:011419
5.5.2 Surface The ground surface at finished pads should be sloped away from their edges at a minimum 2 percent gradient for a distance of at least 5 feet. Roof drainage from the buildings should be directed into solid, smooth-walled drainage pipes that carry the collected water to the storm drain system. Trapped planter areas should not be created adjacent to roadways and structures without providing means for positive drainage (e.g., swales or catch basins). 5.5.3 Subsurface Based on the soil and groundwater conditions, it is prudent to install perimeter drains around the buildings. Drains should consist of a filter fabric-wrapped, drain rock-filled trench that extends at least 12 inches below the lowest adjacent grade (i.e., slab subgrade elevation). A perforated pipe should be placed at the base to collect water that gathers in the drain rock. The drain rock and filter fabric should meet specifications outlined in the “Materials” section. Discharge for the footing drain should not be tied directly into the stormwater drainage system, unless mechanisms are installed to prevent backflow. 5.5.4 Stormwater Infiltration Based on the subsurface and groundwater conditions at the site, on-site infiltration systems are not recommended for the development. 5.6 PERMANENT SLOPES All cut and fill slopes should be located outside the slope buffer zone and should not exceed 2H:1V. Upslope roads and pavements should be located at least 5 feet from the top of cut and fill slopes. The setback should be increased to 10 feet for buildings. The slopes should be planted with appropriate vegetation to provide protection against erosion as soon as possible after grading. Surface water runoff should be collected and directed away from slopes to prevent water from running down the face of the slope. 5.7 PAVEMENTS Pavements for new roadways will be installed as part of the development. Pavements should be installed on improved agricultural till, firm native soil, structural fill, or cement-treated subgrade prepared in conformance with the “Site Preparation” and “Materials” sections. The pavement section will be in conformation with City of La Center standard detail ST-14. Based on explorations and testing, the AASHTO soil classification at the site is A-5, resulting in a section of 0.35 foot of AC over 0.90 foot of aggregate base. If the roadway is constructed during the wet season and the subgrade is cement treated, a reduction in aggregate base may be suitable. GeoDesign should be contacted to provide recommendations if cement treated. AC and aggregate base should meet the requirements in the “Materials” section. The material thicknesses are intended to be minimum acceptable values for the final condition. The aggregate base thickness does not account for construction traffic, and haul roads and staging areas should be used as described in the “Construction” section.

10 CompassGrp-1-01:011419
6.0 CONSTRUCTION 6.1 SITE PREPARATION The existing topsoil zone should be stripped and removed from all fill areas. Based on our explorations, the average depth of stripping will be approximately 5 to 6 inches, although greater stripping depths will be required to remove localized zones of loose or organic soil. Greater stripping depths (approaching 12 inches) are anticipated in areas with thicker vegetation and shrubs, in all forested areas, and along the base of draws. The actual stripping depth should be based on field observations at the time of construction. Stripped material should be transported off site for disposal or used in landscaped areas. Trees and shrubs should be removed from fill areas. In addition, root balls should be grubbed out to the depth of the roots, which could exceed 3 feet BGS. Depending on the methods used to remove the root balls, considerable disturbance and loosening of the subgrade could occur during site grubbing. We recommend that soil disturbed during grubbing operations be removed to expose firm, undisturbed subgrade. The resulting excavations should be backfilled with structural fill. 6.1.1 Tilled Zone An approximately 12- to 36-inch-thick agricultural tilled zone was observed directly beneath the ground surface in our explorations over a majority of the site. We recommend that the tilled zone be improved during site preparation in areas where cuts do not remove the tilled zone. Prior to fill placement and construction, the tilled zone should be improved by removing and replacing with structural fill or scarifying and compacting as structural fill. The native soil can be sensitive to small changes in moisture content and will be difficult, if not impossible, to compact adequately during wet weather. While scarification and compaction of the subgrade is the best option for subgrade improvement, it will likely only be possible during extended dry periods and following moisture conditioning of the soil. As discussed further on in this report, cement amendment is an option for conditioning the soil for use as structural fill during periods of wet weather or when drying the soil is not an option. 6.1.2 Subgrade Evaluation Upon completion of stripping and prior to the placement of any structural fill or pavement, the exposed subgrade should be evaluated by proof rolling to identify soft, loose, or unsuitable areas. Proof rolling should be conducted with a fully loaded dump truck or similar heavy, rubber tire construction equipment. Qualified personnel should observe proof rolling to evaluate yielding of the ground surface. The subgrade should be evaluated by probing with a foundation probe when the subgrade is too wet. If soft or yielding subgrade is identified, the subgrade should be excavated and replaced with structural fill. 6.2 CONSTRUCTION CONSIDERATIONS The fine-grained soil present on this site is easily disturbed. If not carefully executed, site preparation, utility trench work, and roadway excavation can create extensive soft areas and significant repair costs can result. Earthwork planning, regardless of the time of year, should include considerations for minimizing subgrade disturbance.

11 CompassGrp-1-01:011419
If construction occurs during or extends into the wet season, or if the moisture content of the surficial soil is more than a couple percentage points above optimum, site stripping and cutting may need to be accomplished using track-mounted equipment. Likewise, the use of granular haul roads and staging areas will be necessary for support of construction traffic during the rainy season or when the moisture content of the surficial soil is more than a few percentage points above optimum. The amount of staging and haul road areas, as well as the required thickness of granular material, will vary with the contractor’s sequencing of a project and type/frequency of construction equipment. Based on our experience, between 12 and 18 inches of imported granular material is generally required in staging areas and between 18 and 24 inches in haul roads areas. Stabilization material may be used as a substitute provided the top 4 inches of material consists of imported granular material. The actual thickness will depend on the contractor’s means and methods and should be the contractor’s responsibility. In addition, a geotextile fabric should be considered to assist in developing a barrier between the subgrade and imported granular material in areas of repeated construction traffic. The imported granular material, stabilization material, and geotextile fabric should meet the specifications in the “Materials” section. As an alternative to thickened crushed rock sections, haul roads and utility work zones may be constructed using cement-amended subgrades overlain by a crushed rock wearing surface. If this approach is used, the thickness of granular material in staging areas and along haul roads can typically be reduced to between 6 and 9 inches. This recommendation is based on an assumed minimum unconfined compressive strength of 100 psi for subgrade amended to a depth of 12 to 16 inches. The actual thickness of the amended material and imported granular material will depend on the contractor’s means and methods and should be the contractor’s responsibility. Cement amendment is discussed in the “Materials” section. 6.3 TEMPORARY SLOPES Temporary slopes less than 10 feet high should be no steeper than 1½H:1V, provided groundwater seepage does not occur. If slopes greater than 10 feet high are required, GeoDesign should be contacted to make additional recommendations. We recommend a minimum horizontal distance of 5 feet from the edge of the existing improvements to the top of the temporary slope. All cut slopes should be protected from erosion by covering them during wet weather. If sloughing or instability is observed, the slope should be flattened or supported by shoring. Excavations should not undermine adjacent utilities, foundations, walkways, streets, or other hardscapes unless special shoring or underpinned support is provided. 6.4 EROSION CONTROL The on-site soil is susceptible to erosion. Consequently, we recommend that slopes be covered with an appropriate erosion control product if construction occurs during periods of wet weather. We recommend that all slope surfaces be planted as soon as practical to minimize erosion. Surface water runoff should be collected and directed away from slopes to prevent water from running down the slope face. Erosion control measures, such as straw bales, sediment fences, and temporary detention and settling basins, should be used in accordance with local and state ordinances.
12 CompassGrp-1-01:011419
6.5 EXCAVATION 6.5.1 General Perched groundwater was generally observed between depths of 10 and 14 feet BGS in the explorations. Based on our experience in the area, perched groundwater could be present within approximately few feet of the ground surface during the wet season. Cuts in the near-surface soil should be readily completed with conventional excavation equipment. Temporary excavation sidewalls should stand vertical to a depth of approximately 4 feet, provided groundwater seepage is not observed in the sidewalls. Open excavation techniques may be used to excavate trenches with depths between 4 and 8 feet, provided the walls of the excavation are cut at a slope of 1H:1V and groundwater seepage is not present. Excavations should be flattened to 1½H:1V or 2H:1V if excessive sloughing or raveling occurs. If groundwater is present, caving and raveling could occur. In lieu of large and open cuts, approved temporary shoring may be used for excavation support. A wide variety of shoring and dewatering systems are available. Consequently, we recommend that the contractor be responsible for selecting the appropriate shoring and dewatering systems. If box shoring is used, it should be understood that box shoring is a safety feature used to protect workers and does not prevent caving. If the excavations are left open for extended periods of time, caving of the sidewalls may occur. The presence of caved material will limit the ability to properly backfill and compact the trenches. The contractor should be prepared to fill voids between the box shoring and the sidewalls of the trenches with sand or gravel before caving occurs. If shoring is used, we recommend that the type and design of the shoring system be the responsibility of the contractor, who is in the best position to choose a system that fits the overall plan of operation. All excavations should be made in accordance with applicable OSHA and state regulations. 6.5.2 Dewatering Dewatering may be required for excavations at the site, particularly during the wet season. If encountered, pumping from a sump located within the trench may be effective in dewatering localized sections of trench. However, this method is unlikely to prove effective in dewatering long sections of trench or large excavations. In addition, the sidewalls of trench excavations will need to be flattened or shored if seepage is encountered. Where groundwater seepage into shored excavations occurs, we recommend placing at least 1 foot to 2 feet of stabilization material at the base of the excavations. Trench stabilization material should meet the requirements provided in the “Structural Fill” section. We note that these recommendations are for guidance only. Dewatering of excavations is the sole responsibility of the contractor, as the contractor is in the best position to select these systems based on their means and methods.

13 CompassGrp-1-01:011419
6.6 MATERIALS 6.6.1 Structural Fill Fills should only be placed over subgrade that has been prepared in conformance with the “Site Preparation” section. A variety of material may be used as structural fill at the site. However, all material used as structural fill should be free of organic matter or other unsuitable material and should meet the specifications provided in WSS 9-03 – Aggregates, depending on the application. A brief characterization of some of the acceptable materials and our recommendations for their use as structural fill are provided below. 6.6.2 On-Site Soil The on-site soil is suitable for structural fill provided it is free of organic matter and unsuitable materials. Based on laboratory testing results, the moisture content of the on-site soil is above the optimum required for compaction at the time of our explorations and moisture conditioning, including drying and mixing, will be required to use the on-site soil for structural fill. Accordingly, extended dry weather and sufficient area to dry the soil will be required to adequately condition the soil for use as structural fill. The on-site fine-grained soil should not be used as structural fill during the wet season. When used as structural fill, the on-site fine-grained soil should be placed in lifts with a maximum uncompacted thickness of 8 inches and compacted to not less than 92 percent of the maximum dry density, as determined by ASTM D1557. 6.6.3 Imported Granular Material Imported granular material used during periods of wet weather, for building pad subgrades, and for staging areas should be pit- or quarry-run rock, crushed rock, or crushed gravel and sand and should meet the specifications provided in WSS 9-03.9(1) – Ballast, WSS 9-03.14(1) – Gravel Borrow, or WSS 9-03.14(2) – Select Borrow. The imported granular material should be fairly well graded between coarse and fine material, have less than 5 percent by dry weight passing the U.S. Standard No. 200 sieve, and have a minimum of two mechanically fractured faces. Imported granular material should be placed in lifts with a maximum uncompacted thickness of 8 to 12 inches and compacted to not less than 95 percent of the maximum dry density, as determined by ASTM D1557. During the wet season or when wet subgrade conditions exist, the initial lift should be approximately 18 inches in uncompacted thickness and should be compacted with a smooth-drum roller without using vibratory action. Where imported granular material is placed over wet or soft soil subgrades, we recommend a geotextile be placed as a barrier between the subgrade and imported granular material. Depending on site conditions, the geotextile should meet the specifications provided in WSS 9-33.2(1) – Geotextile Properties (Table 3) for soil separation or stabilization. The geotextile should be installed in conformance with WSS 2-12 – Construction Geosynthetic. 6.6.4 Stabilization Material Stabilization material used to create haul roads for construction traffic or at the base of unstable trenches should consist of pit- or quarry-run rock or crushed rock. The material should have a maximum particle size of 6 inches and less than 5 percent by dry weight passing the

14 CompassGrp-1-01:011419
U.S. Standard No. 4 sieve, have at least two mechanically fractured faces, and be free of organic matter and other deleterious material. Material meeting the specifications provided in WSS 9-27.3(6) – Stone is generally acceptable for use. Stabilization material should be placed in lifts between 12 and 18 inches thick and compacted to a firm condition with a smooth-drum roller without using vibratory action. Where the stabilization material is used to stabilize soft subgrade beneath pavements or construction haul roads, a geotextile should be placed as a barrier between the soil subgrade and the imported granular material. Geotextile is not required where stabilization material is used at the base of utility trenches. 6.6.5 Trench Backfill Trench backfill placed beneath, adjacent to, and for at least 2 feet above utility lines (i.e., the pipe zone) should consist of well-graded, granular material with a maximum particle size of 1½ inches and less than 7 percent by dry weight passing the U.S. Standard No. 200 sieve and should meet the specifications provided in WSS 9-03.12(3) – Gravel Backfill for Pipe Zone Bedding. The pipe zone backfill should be compacted to at least 90 percent of the maximum dry density, as determined by ASTM D1557, or as required by the pipe manufacturer or local building department. Within roadway alignments or beneath proposed or future building pads, the remainder of the trench backfill should consist of well-graded, granular material with a maximum particle size of 2½ inches and less than 7 percent by dry weight passing the U.S. Standard No. 200 sieve and should meet the specifications provided in WSS 9-03.19 – Bank Run Gravel for Trench Backfill. This material should be compacted to at least 92 percent of the maximum dry density, as determined by ASTM D1557, or as required by the pipe manufacturer or local building department. The upper 2 feet of the trench backfill should be compacted to at least 95 percent of the maximum dry density, as determined by ASTM D1557. Outside of structural improvement areas (e.g., roadway alignments or building pads), trench backfill placed above the pipe zone may consist of general fill material that is free of organics and material over 6 inches in size and meets the specifications provided in WSS 9-03.14(3) – Common Borrow and WSS 9-03.15 – Native Material for Trench Backfill. This general trench backfill should be compacted to at least 90 percent of the maximum dry density, as determined by ASTM D1557, or as required by the pipe manufacturer or local building department. Refer to the “Geologic Hazards” section for a discussion of trench backfill on slopes. 6.6.6 Aggregate Base Rock Imported granular material placed beneath pavements and floor slabs should be clean crushed rock or crushed gravel and sand that are fairly well graded between coarse and fine. The granular material should not contain deleterious material, should have a maximum particle size of 1½ inches, should meet the specifications provided in WSS 9-03.9(3) – Crushed Surfacing and WSS 9-03.10 – Aggregate for Gravel Base, should have less than 5 percent by dry weight passing the U.S. Standard No. 200 sieve, and should have a minimum of two mechanically fractured faces. The imported granular material should be placed in one lift and compacted to not less than 95 percent of the maximum dry density, as determined by ASTM D1557.

15 CompassGrp-1-01:011419
6.6.7 Retaining Wall Select Backfill Backfill material placed behind retaining walls and extending a horizontal distance of ½H, where H is the height of the retaining wall, should consist of select granular material that meets the requirements provided in WSS 9-03.12(2) – Gravel Backfill for Walls. We recommend the select granular wall backfill be separated from general fill, native soil, and/or topsoil using a geotextile fabric that meets the specifications provided below for drainage geotextiles. The wall backfill should be compacted to a minimum of 95 percent of the maximum dry density, as determined by ASTM D1557. However, backfill located within a horizontal distance of 3 feet from a retaining wall should only be compacted to approximately 90 percent of the maximum dry density, as determined by ASTM D1557. Backfill placed within 3 feet of the walls should be compacted in lifts less than 6 inches thick using hand-operated tamping equipment (such as a jumping jack or vibratory plate compactor). If flatwork (sidewalks or pavements) will be placed atop the wall backfill, we recommend that the upper 2 feet of material be compacted to 95 percent of the maximum dry density, as determined by ASTM D1557. 6.6.8 Geotextile Separation Fabric A geotextile separation fabric will be required at the interface of the existing soil and imported granular material beneath the proposed walls. In addition, geotextile fabric may be required where soft subgrade is encountered. The separation fabric should meet the specifications provided in WSS 9-33.2(1) – Geotextile Properties (Table 3) for soil separation. The geotextile should be installed in conformance the specifications provided in WSS 2-12 – Construction Geosynthetic. 6.6.9 AC 6.6.9.1 General The AC pavement should conform to WSS 5-04 - Hot Mix Asphalt. AC should consist of ½-inch HMA. The asphalt cement binder should be PG 64-22 Performance Grade Asphalt Cement conforming to WSS 9-02.1(4) – Performance Graded Asphalt Binder. The layer thickness should be 2.0 to 3.5 inches. The job mix formula should meet the requirements for non-statistical ½-inch HMA (WSS 5-04 – Hot Mix Asphalt and WSS 9-03.8 – Aggregates for Hot Mix Asphalt) and be compacted to 91 percent of the maximum specific gravity or as required by the local jurisdiction in public right-of-way areas. 6.6.9.2 Cold Weather Paving Considerations In general, AC paving is not recommended during cold weather (temperatures less than 40 degrees Fahrenheit). Compacting under these conditions can result in low compaction and premature pavement distress. Each AC mix design has a recommended compaction temperature range that is specific for the particular AC binder used. In colder temperatures, it is more difficult to maintain the temperature of the AC mix as it can lose heat while stored in the delivery truck, as it is placed, and in the time between placement and compaction. The AC surface temperature during paving should be at least 40 degrees Fahrenheit for lift thickness greater than 2.5 inches and at least 50 degrees Fahrenheit for lift thickness between 2.0 and 2.5 inches.

16 CompassGrp-1-01:011419
If paving activities must take place during cold-weather construction as defined above, the project team should be consulted and a site meeting should be held to discuss ways to lessen low compaction risks. 6.4.9 Soil Amendment with Cement 6.4.9.1 General As an alternative to the use of imported granular material or as an alternative to scarification and compaction during wet periods, an experienced contractor may be able to amend the on-site fine-grained soil with portland cement to obtain suitable support properties. It is generally less costly to amend on-site soil than to remove and replace soft soil with granular material. Based on the moisture contents, soil types, and processing speed, cement amendment would be more suitable at this site than lime amendment. The amount of cement used during treatment should be based on an assumed soil dry unit weight of 100 pcf. 6.4.9.2 Subbase Stabilization Specific recommendations based on exposed site conditions for soil amending can be provided if necessary. However, for preliminary design purposes, we recommend a target strength for cement-amended subgrade for building and pavement subbase (below aggregate base) soil of 100 psi. The amount of cement used to achieve this target generally varies with moisture content and soil type. It is difficult to predict field performance of soil to cement amendment due to variability in soil response, and we recommend laboratory testing to confirm expectations. Generally, 6 percent cement by weight of dry soil can be used when the soil moisture content does not exceed approximately 20 percent. If the soil moisture content is in the range of 25 to 35 percent, 7 to 9 percent by weight of dry soil is recommended. The amount of cement added to the soil may need to be adjusted based on field observations and performance. Moreover, depending on the time of year and moisture content levels during amendment, water may need to be applied during tilling to appropriately condition the soil moisture content. For pavement subbase, we recommend assuming a minimum cement ratio of 6 percent (by dry weight). If the soil moistures are in excess of 30 percent, a cement ratio of 7 to 8 percent will likely be needed. Due to the higher organic content and moisture, we recommend using a cement ratio of 8 percent when stabilizing topsoil (tilled) zone material for building and pavement subbase and anticipate that the cement will need to be applied in two 4 percent applications followed by multiple tilling passes with each application. We recommend cement-spreading equipment be equipped with balloon tires to reduce rutting and disturbance of the fine-grained soil. A static sheepsfoot or segmented pad roller with a minimum static weight of 40,000 pounds should be used for initial compaction of the fine-grained soil. A smooth-drum roller with a minimum applied linear force of 700 pounds per inch should be used for final compaction. The amended soil should be compacted to at least 92 percent of the achievable dry density at the moisture content of the material, as defined in ASTM D1557.

17 CompassGrp-1-01:011419
A minimum curing time of four days is required between treatment and construction traffic access. Construction traffic should not be allowed on unprotected, cement-amended subgrade. To protect the cement-treated surfaces from abrasion or damage, the finished surface should be covered with 4 to 6 inches of imported granular material. Treatment depths for building/pavement, haul roads, and staging areas are typically on the order of 12, 16, and 12 inches, respectively. The crushed rock typically becomes contaminated with soil during construction. Contaminated base rock should be removed and replaced with clean rock in pavement areas. The actual thickness of the amended material and imported granular material for haul roads and staging areas will depend on the anticipated traffic, as well as the contractor’s means and methods and should be the contractor’s responsibility. Cement amending should not be attempted when air temperature is below 40 degrees Fahrenheit or during moderate to heavy precipitation. Cement should not be placed when the ground surface is saturated or standing water exists. 6.4.9.3 Cement-Amended Structural Fill On-site soil that would not otherwise be suitable for structural fill may be amended and placed as fill over a subgrade prepared in conformance with the “Site Preparation” section. The cement ratio for general cement-amended fill can generally be reduced by 1 percent (by dry weight). Typically, a minimum curing of four days is required between treatment and construction traffic access. Consecutive lifts of fill may be treated immediately after the previous lift has been amended and compacted (e.g., the four-day wait period does not apply). However, where the final lift of fill is a building or roadway subgrade, the four-day wait period is in effect for the final lift of cement-amended soil. 6.4.9.4 Other Considerations Portland cement-amended soil is hard and has low permeability. This soil does not drain well and it is not suitable for planting. Future planted areas should not be cement amended, if practical, or accommodations should be made for drainage and planting. Moreover, cement amending soil within building areas must be done carefully to avoid trapping water under floor slabs. We should be contacted if this approach is considered. Cement amendment should not be used if runoff during construction cannot be directed away from adjacent wetlands (if any). 7.0 OBSERVATION OF CONSTRUCTION Satisfactory earthwork and foundation performance depends to a large degree on the quality of construction. Subsurface conditions observed during construction should be compared with those encountered during the subsurface explorations. Recognition of changed conditions often requires experience; therefore, qualified personnel should visit the site with sufficient frequency to detect whether subsurface conditions change significantly from those anticipated. In addition, sufficient observation of the contractor's activities is a key part of determining that the work is completed in accordance with the construction drawings and specifications.

18 CompassGrp-1-01:011419
8.0 LIMITATIONS We have prepared this report for use by Compass Group, LLC and members of the design and construction teams for the proposed development. The data and report can be used for estimating purposes, but our report, conclusions, and interpretations should not be construed as a warranty of the subsurface conditions and are not applicable to other sites. Soil explorations indicate soil conditions only at specific locations and only to the depths penetrated. They do not necessarily reflect soil strata or water level variations that may exist between exploration locations. If subsurface conditions differing from those described are noted during the course of excavation and construction, re-evaluation will be necessary. The site development plans and design details were not finalized at the time this report was prepared. When the design has been finalized and if there are changes in the site grades or location, configuration, design loads, or type of construction, the conclusions and recommendations presented may not be applicable. If design changes are made, we should be retained to review our conclusions and recommendations and to provide a written evaluation or modification. The scope of our services does not include services related to construction safety precautions, and our recommendations are not intended to direct the contractor's methods, techniques, sequences, or procedures, except as specifically described in our report for consideration in design. Within the limitations of scope, schedule, and budget, our services have been executed in accordance with the generally accepted practices in this area at the time this report was prepared. No warranty or other conditions, express or implied, should be understood.
We appreciate the opportunity to be of service to you. Please call if you have questions concerning this report or if we can provide additional services. Sincerely, GeoDesign, Inc. Nick Paveglio, P.E. Senior Associate Engineer Brett A. Shipton, P.E. Principal Engineer
Signed 01/14/2019

19 CompassGrp-1-01:011419
REFERENCES Clark County GIS, 2018. Website: http://gis.clark.wa.gov/imf/imf.jsp?site=digitalatlas. International Building Code, 2015. Palmer et al., 2004. Liquefaction Susceptibility of Clark County. Washington Division of Geology and Earth Resources Open File Report, 2004-20. September 2004. Washington State Department of Transportation, 2018. Standard Specifications for Road, Bridge, and Municipal Construction, M41-10.

FIGURES
SITE
360.693.8416 www.geodesigninc.com
Vancouver WA 98660
Prin
ted B
y: m
mille
r |
Prin
t D
ate:
1/9
/20
19
11
:07
:59
AM
703 Broadway Street - Suite 650
File
Nam
e:
J:\A
-D\C
om
pas
sGrp
\Com
pas
sGrp
-1\C
om
pas
sGrp
-1-0
1\F
igure
s\C
AD
\Com
pas
sGrp
-1-0
1-V
M0
1.d
wg | L
ayout:
FIG
UR
E 1
VICINITY MAP
HOLLEY PARK SUBDIVISIONLA CENTER, WA
COMPASSGRP-1-01
JANUARY 2019 FIGURE 1
0
(SCALE IN APPROXIMATE FEET)
N
2000 4000VICINITY MAP BASED ON AERIALPHOTOGRAPH OBTAINED FROMGOOGLE EARTH PRO®

E 2ND STREET
E IV
Y A
VE
NU
E
TP-1
TP-4
TP-5
TP-3
TP-10
TP-9
TP-7
TP-6
TP-2
B-2
TP-8
B-3
B-1
B-4A'
A
B'
B
C'
C
Prin
ted B
y: a
day
| P
rint
Dat
e: 1
/11
/20
19
2:4
6:0
5 P
M
36
0.6
93
.84
16
w
ww
.geo
des
ignin
c.co
m
Van
couve
r W
A 9
86
60
70
3 B
road
way
Str
eet
- Su
ite
65
0
File
Nam
e:
J:\A
-D\C
om
pas
sGrp
\Com
pas
sGrp
-1\C
om
pas
sGrp
-1-0
1\F
igure
s\C
AD
\Com
pas
sGrp
-1-0
1-S
P01
.dw
g | L
ayout:
FIG
UR
E 2
SIT
E P
LA
N
HO
LLEY
PA
RK
SU
BD
IVIS
ION
LA C
ENTER
, W
A
CO
MPA
SSG
RP-
1-0
1
JAN
UA
RY 2
019
FIG
UR
E 2
0
(SCALE IN FEET)
N
120 240
TP-1
LEGEND:
SITE BOUNDARY
BORING
TEST PIT
EXISTING TOPOGRAPHY (1-FOOTINTERVALS; 5-FOOT INDEX CONTOURS)
CROSS SECTION
B-1
NOTES:1. SITE PLAN BASED ON DRAWING FROM AKS
ENGINEERING & FORESTRY, LLC JANUARY 3, 2019.2. AERIAL IMAGE OBTAINED FROM GOOGLE EARTH
PRO JANUARY 7, 2019.
A'A

E 2ND STREET
E IV
Y A
VE
NU
E
TP-1
TP-4
TP-5
TP-3
TP-10
TP-9
TP-7
TP-6
TP-2
B-2
TP-8
B-3
B-1
B-4A'
A
B'
B
C'
C
Prin
ted B
y: a
day
| P
rint
Dat
e: 1
/11
/20
19
4:1
7:5
0 P
M
36
0.6
93
.84
16
w
ww
.geo
des
ignin
c.co
m
Van
couve
r W
A 9
86
60
70
3 B
road
way
Str
eet
- Su
ite
65
0
File
Nam
e:
J:\A
-D\C
om
pas
sGrp
\Com
pas
sGrp
-1\C
om
pas
sGrp
-1-0
1\F
igure
s\C
AD
\Com
pas
sGrp
-1-0
1-S
P01
.dw
g | L
ayout:
FIG
UR
E 3
SIT
E P
LA
N - S
LO
PE P
ER
CEN
TA
GE
HO
LLEY
PA
RK
SU
BD
IVIS
ION
LA C
ENTER
, W
A
CO
MPA
SSG
RP-
1-0
1
JAN
UA
RY 2
019
FIG
UR
E 3
0
(SCALE IN FEET)
N
120 240
NOTE:1. SITE PLAN BASED ON DRAWING FROM AKS
ENGINEERING & FORESTRY, LLC JANUARY 3, 2019.
SLOPES TABLE
COLOR MINIMUM SLOPE
15%
25%
50%
75%
MAXIMUM SLOPE
24.9%
49.9%
74.9%
53270.0%>75%
TP-1
LEGEND:
SITE BOUNDARY
BORING
TEST PIT
EXISTING TOPOGRAPHY (1-FOOTINTERVALS; 5-FOOT INDEX CONTOURS)
CROSS SECTION
B-1
A'A

APPENDIX A
A-1 CompassGrp-1-01:011419
APPENDIX A FIELD EXPLORATIONS We explored subsurface conditions at the site by drilling three borings (B-1 through B-3) and excavating 10 test pits (TP-1 through TP-10). The borings were drilled to depths between 34.7 and 46.4 feet BGS, and the test pits were excavated to depths between 16.0 and 18.0 feet BGS. Drilling services were provided by Dan Fisher Excavating, Inc. of Forest Grove, Oregon. Excavation services were provided by Tapani Underground, Inc. of Battle Ground, Washington. The exploration logs are presented in this appendix. The locations of the explorations are shown on Figure 2. Locations were determined in the field by pacing and taping from existing site features. This information should be considered accurate only to the degree implied by the methods used. A member of our geotechnical staff observed the explorations. We collected representative samples of the various soils encountered in the explorations for geotechnical laboratory testing. SOIL SAMPLING Samples were collected from the borings using 1½-inch-diameter split-spoon SPT samplers in general accordance with ASTM D1586. The samplers were driven into the soil with a 140-pound automatic trip hammer free-falling 30 inches. The sampler was driven a total distance of 18 inches. The number of blows required to drive the sampler the final 12 inches is recorded on the exploration logs, unless otherwise noted. Disturbed samples of the soil observed in the test pits were collected from the walls or base of the test pits using the excavator bucket. Sampling methods and intervals are shown on the exploration logs. SOIL CLASSIFICATION The soil samples were classified in accordance with the “Exploration Key” (Table A-1) and “Soil Classification System” (Table A-2), which are presented in this appendix. The exploration logs indicate the depths at which the soils or their characteristics change, although the change actually could be gradual. If the change occurred between sample locations, the depth was interpreted. Classifications are shown on the exploration logs. LABORATORY TESTING CLASSIFICATION The soil samples were classified in the laboratory to confirm field classifications. The laboratory classifications are included on the exploration logs if those classifications differed from the field classifications. MOISTURE CONTENT We tested the natural moisture content of select soil samples in general accordance with ASTM D2216. The test results are presented in this appendix.

A-2 CompassGrp-1-01:011419
PARTICLE-SIZE ANALYSIS We completed particle-size analysis on select soil samples in order to determine the distribution of soil particle sizes. The testing consisted percent fines determination (percent passing the U.S. Standard No. 200 sieve) analyses completed in general accordance with ASTM C117 or ASTM D1140. ATTERBERG LIMITS The plastic limit and liquid limit (Atterberg limits) of select soil samples were determined in accordance with ASTM D4318. The Atterberg limits and the plasticity index were completed to aid in the classification of the soil. The test results are presented in this appendix.

SYMBOL SAMPLING DESCRIPTION
Location of sample obtained in general accordance with ASTM D 1586 Standard Penetration Test with recovery Location of sample obtained using thin-wall Shelby tube or Geoprobe® sampler in general accordance with ASTM D 1587 with recovery Location of sample obtained using Dames & Moore sampler and 300-pound hammer or pushed with recovery Location of sample obtained using Dames & Moore and 140-pound hammer or pushed with recovery Location of sample obtained using 3-inch-O.D. California split-spoon sampler and 140-pound hammer Location of grab sample Rock coring interval Water level during drilling Water level taken on date shown
GEOTECHNICAL TESTING EXPLANATIONS
ATT
CBR
CON
DD
DS
HYD
MC
MD
NP
OC
Atterberg Limits
California Bearing Ratio
Consolidation
Dry Density
Direct Shear
Hydrometer Gradation
Moisture Content
Moisture-Density Relationship
Nonplastic
Organic Content
P
PP
P200
RES
SIEV
TOR
UC
VS
kPa
Pushed Sample
Pocket Penetrometer
Percent Passing U.S. Standard No. 200 Sieve
Resilient Modulus
Sieve Gradation
Torvane
Unconfined Compressive Strength
Vane Shear
Kilopascal
ENVIRONMENTAL TESTING EXPLANATIONS
CA
P
PID
ppm
Sample Submitted for Chemical Analysis
Pushed Sample
Photoionization Detector Headspace Analysis
Parts per Million
ND
NS
SS
MS
HS
Not Detected
No Visible Sheen
Slight Sheen
Moderate Sheen
Heavy Sheen
703 Broadway Street - Suite 650
Vancouver WA 98660 360.693.8416 www.geodesigninc.com
EXPLORATION KEY TABLE A-1
Graphic Log of Soil and Rock Types
Inferred contact between soil or rock units (at approximate depths indicated)
Observed contact between soil or rock units (at depth indicated)

RELATIVE DENSITY - COARSE-GRAINED SOIL
Relative Density Standard Penetration
Resistance Dames & Moore Sampler
(140-pound hammer) Dames & Moore Sampler
(300-pound hammer)
Very Loose 0 – 4 0 - 11 0 - 4
Loose 4 – 10 11 - 26 4 - 10
Medium Dense 10 – 30 26 - 74 10 - 30
Dense 30 – 50 74 - 120 30 - 47
Very Dense More than 50 More than 120 More than 47
CONSISTENCY - FINE-GRAINED SOIL
Consistency Standard
Penetration Resistance
Dames & Moore Sampler
(140-pound hammer)
Dames & Moore Sampler (300-pound hammer)
Unconfined Compressive Strength (tsf)
Very Soft Less than 2 Less than 3 Less than 2 Less than 0.25
Soft 2 - 4 3 – 6 2 - 5 0.25 - 0.50
Medium Stiff 4 - 8 6 – 12 5 - 9 0.50 - 1.0
Stiff 8 - 15 12 – 25 9 - 19 1.0 - 2.0
Very Stiff 15 - 30 25 – 65 19 – 31 2.0 - 4.0
Hard More than 30 More than 65 More than 31 More than 4.0
PRIMARY SOIL DIVISIONS GROUP SYMBOL GROUP NAME
COARSE-GRAINED SOIL
(more than 50%
retained on No. 200 sieve)
GRAVEL
(more than 50% of coarse fraction
retained on No. 4 sieve)
CLEAN GRAVEL (< 5% fines)
GW or GP GRAVEL
GRAVEL WITH FINES (≥ 5% and ≤ 12% fines)
GW-GM or GP-GM GRAVEL with silt
GW-GC or GP-GC GRAVEL with clay
GRAVEL WITH FINES (> 12% fines)
GM silty GRAVEL
GC clayey GRAVEL
GC-GM silty, clayey GRAVEL
SAND
(50% or more of coarse fraction
passing No. 4 sieve)
CLEAN SAND (<5% fines)
SW or SP SAND
SAND WITH FINES (≥ 5% and ≤ 12% fines)
SW-SM or SP-SM SAND with silt
SW-SC or SP-SC SAND with clay
SAND WITH FINES (> 12% fines)
SM silty SAND
SC clayey SAND
SC-SM silty, clayey SAND
FINE-GRAINED SOIL
(50% or more
passing No. 200 sieve)
SILT AND CLAY
Liquid limit less than 50
ML SILT
CL CLAY
CL-ML silty CLAY
OL ORGANIC SILT or ORGANIC CLAY
Liquid limit 50 or greater
MH SILT
CH CLAY
OH ORGANIC SILT or ORGANIC CLAY
HIGHLY ORGANIC SOIL PT PEAT
MOISTURE CLASSIFICATION
ADDITIONAL CONSTITUENTS
Term Field Test Secondary granular components or other materials
such as organics, man-made debris, etc.
Percent
Silt and Clay In:
Percent
Sand and Gravel In:
dry very low moisture, dry to touch
Fine-Grained Soil
Coarse-Grained Soil
Fine-Grained Soil
Coarse-Grained Soil
moist damp, without visible moisture
< 5 trace trace < 5 trace trace
5 – 12 minor with 5 – 15 minor minor
wet visible free water, usually saturated
> 12 some silty/clayey 15 – 30 with with
> 30 sandy/gravelly Indicate %
703 Broadway Street - Suite 650
Vancouver WA 98660 360.693.8416 www.geodesigninc.com
SOIL CLASSIFICATION SYSTEM TABLE A-2

LL = 45%PL = 26%
P200 = 68%
10.0
15.0
25.0
ATT
P200
Medium stiff, brown SILT with sand(ML); moist.
stiff at 5.0 feet
medium stiff at 7.5 feet
Stiff, brown with gray mottled CLAY(CL), minor sand; moist.
Medium stiff, brown with orangemottled, sandy SILT (ML); moist.
Very stiff, dark gray CLAY (CL), minorsand; moist.
INSTALLATION ANDCOMMENTS
MOISTURE CONTENT %
CORE REC%RQD%
BLOW COUNT
BORING B-1
COMPLETED: 12/12/18
ELEV
AT
ION
DEP
TH
SAM
PLE
FIGURE A-1
BORING BIT DIAMETER: 4 inches
LA CENTER, WA
COMPASSGRP-1-01
HOLLEY PARK SUBDIVISION
GR
APH
IC L
OG
MATERIAL DESCRIPTION
TES
TIN
G
DEPTHFEET
LOGGED BY: Z. Rogers
JANUARY 2019703 Broadway Street - Suite 650
Vancouver WA 98660360.693.8416 www.geodesigninc.com
BORING METHOD: solid-stem auger (see document text)
DRILLED BY: Dan J. Fischer Excavating, Inc.
BO
RIN
G L
OG
C
OM
PASS
GR
P-1
-01
-B1
_3-T
P1_1
0.G
PJ
GEO
DES
IGN
.GD
T
PRIN
T D
AT
E: 1
/11
/19
:KM
:KT
0 50 100
0 50 100
0.0
2.5
5.0
7.5
10.0
12.5
15.0
17.5
20.0
22.5
25.0
27.5
30.0
7
14
6
3
5
7
24

Surface elevation was notmeasured at the time ofexploration.
33.0
34.7
medium stiff at 30.0 feet
Very dense, gray with yellow mottled,clayey GRAVEL with sand (GC); moist towet.
Exploration terminated at a depth of34.7 feet due to auger refusal.
Hammer efficiency factor is unknown.SPT completed using two wraps with acathead.
INSTALLATION ANDCOMMENTS
MOISTURE CONTENT %
CORE REC%RQD%
BLOW COUNT
BORING B-1
COMPLETED: 12/12/18
ELEV
AT
ION
DEP
TH
SAM
PLE
FIGURE A-1
BORING BIT DIAMETER: 4 inches
LA CENTER, WA
COMPASSGRP-1-01
HOLLEY PARK SUBDIVISION
GR
APH
IC L
OG
MATERIAL DESCRIPTION
TES
TIN
G
(continued)
DEPTHFEET
LOGGED BY: Z. Rogers
JANUARY 2019703 Broadway Street - Suite 650
Vancouver WA 98660360.693.8416 www.geodesigninc.com
BORING METHOD: solid-stem auger (see document text)
DRILLED BY: Dan J. Fischer Excavating, Inc.
BO
RIN
G L
OG
C
OM
PASS
GR
P-1
-01
-B1
_3-T
P1_1
0.G
PJ
GEO
DES
IGN
.GD
T
PRIN
T D
AT
E: 1
/11
/19
:KM
:KT
37-50/2"
0 50 100
0 50 100
30.0
32.5
35.0
37.5
40.0
42.5
45.0
47.5
50.0
52.5
55.0
57.5
60.0
6

P200 = 71%
P200 = 42%
5.0
7.5
25.0
P200
P200
Medium stiff, brown with gray mottledSILT with sand (ML); moist.
Loose to medium dense, brown withgray-black mottled SAND with silt (SP-SM); moist.
Medium stiff, brown with gray mottled,sandy SILT (ML); moist.
brown with orange mottles at 10.0 feet
Medium dense, dark gray, silty SAND(SM); wet.
INSTALLATION ANDCOMMENTS
MOISTURE CONTENT %
CORE REC%RQD%
BLOW COUNT
BORING B-2
COMPLETED: 12/12/18
ELEV
AT
ION
DEP
TH
SAM
PLE
FIGURE A-2
BORING BIT DIAMETER: 4 inches
LA CENTER, WA
COMPASSGRP-1-01
HOLLEY PARK SUBDIVISION
GR
APH
IC L
OG
MATERIAL DESCRIPTION
TES
TIN
G
DEPTHFEET
LOGGED BY: Z. Rogers
JANUARY 2019703 Broadway Street - Suite 650
Vancouver WA 98660360.693.8416 www.geodesigninc.com
BORING METHOD: solid-stem auger (see document text)
DRILLED BY: Dan J. Fischer Excavating, Inc.
BO
RIN
G L
OG
C
OM
PASS
GR
P-1
-01
-B1
_3-T
P1_1
0.G
PJ
GEO
DES
IGN
.GD
T
PRIN
T D
AT
E: 1
/11
/19
:KM
:KT
0 50 100
0 50 100
0.0
2.5
5.0
7.5
10.0
12.5
15.0
17.5
20.0
22.5
25.0
27.5
30.0
6
10
5
6
5
5
23

LL = 39%PL = 23%
P200 = 41%
Surface elevation was notmeasured at the time ofexploration.
30.0
40.0
41.0
46.4
ATT
P200
Very stiff, dark gray CLAY (CL), minorsand; moist.
stiff to very stiff, trace sand at 35.0 feet
Medium dense, dark gray, clayey SAND(SC); wet.Very dense, dark gray-blue GRAVEL withclay and sand (GP-GC); moist to wet.
Exploration completed at a depth of46.4 feet.
Hammer efficiency factor is unknown.SPT completed using two wraps with acathead.
INSTALLATION ANDCOMMENTS
MOISTURE CONTENT %
CORE REC%RQD%
BLOW COUNT
BORING B-2
COMPLETED: 12/12/18
ELEV
AT
ION
DEP
TH
SAM
PLE
FIGURE A-2
BORING BIT DIAMETER: 4 inches
LA CENTER, WA
COMPASSGRP-1-01
HOLLEY PARK SUBDIVISION
GR
APH
IC L
OG
MATERIAL DESCRIPTION
TES
TIN
G
(continued)
DEPTHFEET
LOGGED BY: Z. Rogers
JANUARY 2019703 Broadway Street - Suite 650
Vancouver WA 98660360.693.8416 www.geodesigninc.com
BORING METHOD: solid-stem auger (see document text)
DRILLED BY: Dan J. Fischer Excavating, Inc.
BO
RIN
G L
OG
C
OM
PASS
GR
P-1
-01
-B1
_3-T
P1_1
0.G
PJ
GEO
DES
IGN
.GD
T
PRIN
T D
AT
E: 1
/11
/19
:KM
:KT
28-41-50/5"
0 50 100
0 50 100
30.0
32.5
35.0
37.5
40.0
42.5
45.0
47.5
50.0
52.5
55.0
57.5
60.0
28
15
17

P200 = 73%
P200 = 40%
5.0
7.5
10.0
25.0
P200
P200
Medium stiff, brown with gray mottledSILT with sand (ML); moist.
Medium dense, brown with orangemottled, clayey SAND (SC); moist to wet.
Soft to medium stiff, brown with graymottled CLAY with sand (CH); moist towet.
Medium stiff, brown with orangemottled SILT with sand (ML); moist towet.
Medium dense, dark gray, silty SAND(SM); wet.
INSTALLATION ANDCOMMENTS
MOISTURE CONTENT %
CORE REC%RQD%
BLOW COUNT
BORING B-3
COMPLETED: 12/12/18
ELEV
AT
ION
DEP
TH
SAM
PLE
FIGURE A-3
BORING BIT DIAMETER: 4 inches
LA CENTER, WA
COMPASSGRP-1-01
HOLLEY PARK SUBDIVISION
GR
APH
IC L
OG
MATERIAL DESCRIPTION
TES
TIN
G
DEPTHFEET
LOGGED BY: Z. Rogers
JANUARY 2019703 Broadway Street - Suite 650
Vancouver WA 98660360.693.8416 www.geodesigninc.com
BORING METHOD: solid-stem auger (see document text)
DRILLED BY: Dan J. Fischer Excavating, Inc.
BO
RIN
G L
OG
C
OM
PASS
GR
P-1
-01
-B1
_3-T
P1_1
0.G
PJ
GEO
DES
IGN
.GD
T
PRIN
T D
AT
E: 1
/11
/19
:KM
:KT
0 50 100
0 50 100
0.0
2.5
5.0
7.5
10.0
12.5
15.0
17.5
20.0
22.5
25.0
27.5
30.0
6
11
4
5
7
8
25

Surface elevation was notmeasured at the time ofexploration.
30.0
40.0
40.9
Very stiff, gray CLAY with sand (CL);moist.
hard, dark gray at 35.0 feet
Very dense, dark gray GRAVEL withsand and silt (GP-GM); wet.Exploration completed at a depth of40.9 feet.
Hammer efficiency factor is unknown.SPT completed using two wraps with acathead.
INSTALLATION ANDCOMMENTS
MOISTURE CONTENT %
CORE REC%RQD%
BLOW COUNT
BORING B-3
COMPLETED: 12/12/18
ELEV
AT
ION
DEP
TH
SAM
PLE
FIGURE A-3
BORING BIT DIAMETER: 4 inches
LA CENTER, WA
COMPASSGRP-1-01
HOLLEY PARK SUBDIVISION
GR
APH
IC L
OG
MATERIAL DESCRIPTION
TES
TIN
G
(continued)
DEPTHFEET
LOGGED BY: Z. Rogers
JANUARY 2019703 Broadway Street - Suite 650
Vancouver WA 98660360.693.8416 www.geodesigninc.com
BORING METHOD: solid-stem auger (see document text)
DRILLED BY: Dan J. Fischer Excavating, Inc.
BO
RIN
G L
OG
C
OM
PASS
GR
P-1
-01
-B1
_3-T
P1_1
0.G
PJ
GEO
DES
IGN
.GD
T
PRIN
T D
AT
E: 1
/11
/19
:KM
:KT
23-50/5"
0 50 100
0 50 100
30.0
32.5
35.0
37.5
40.0
42.5
45.0
47.5
50.0
52.5
55.0
57.5
60.0
21
34

PP = 0.25 tsf
P200 = 91%
PP = 0.25 tsf
PP = 0.75 tsf
Slow groundwater seepageobserved at 14.0 feet.
No caving observed to the depthexplored.
Surface elevation was notmeasured at the time ofexploration.
13.0
17.0
PP
P200
PP
PP
Soft, brown SILT (ML), minor sand andorganics; moist (24-inch-thick tilledzone, 5-inch-thick root zone).
without organics at 2.0 feet
medium stiff, brown with orange andgray mottles, sandy at 8.0 feet
Medium dense, brown with orangemottled, silty SAND (SM); moist.
Exploration completed at a depth of17.0 feet.
COMMENTS MOISTURECONTENT %
TEST PIT TP-1
TES
T P
IT L
OG
- 1
PER
PA
GE
CO
MPA
SSG
RP-
1-0
1-B
1_3
-TP1
_10
.GPJ
G
EOD
ESIG
N.G
DT
PR
INT
DA
TE:
1/1
1/1
9:K
M:K
T
MATERIAL DESCRIPTION
GR
APH
IC L
OG
TES
TIN
G
HOLLEY PARK SUBDIVISIONLA CENTER, WA
DEPTHFEET
JANUARY 2019 FIGURE A-4
COMPLETED: 12/13/18
SAM
PLE
COMPASSGRP-1-01
LOGGED BY: Z. Rogers
ELEV
AT
ION
DEP
TH
703 Broadway Street - Suite 650Vancouver WA 98660
360.693.8416 www.geodesigninc.com
EXCAVATION METHOD: excavator (see document text)
EXCAVATED BY: Tapani, Inc.
0 50 100
0 50 1000.0
2.5
5.0
7.5
10.0
12.5
15.0
17.5
20.0
22.5
25.0
27.5
30.0

PP = 0.25 tsf
PP = 3.0 tsf
PP = 0.5 tsf
Slow groundwater seepageobserved at 12.0 feet.
P200 = 40%
No groundwater seepage observedto the depth explored.
Surface elevation was notmeasured at the time ofexploration.
14.0
17.0
PP
PP
PP
P200
Soft, brown SILT (ML), minor sand andorganics; moist, sand is fine (12-inch-thick tilled zone, 6-inch-thick rootzone).
very stiff, brown with gray mottles,without organics at 2.5 feet
soft, sandy at 7.0 feet
Medium dense, brown with orangemottled, silty SAND (SM); moist.
Exploration completed at a depth of17.0 feet.
COMMENTS MOISTURECONTENT %
TEST PIT TP-2
TES
T P
IT L
OG
- 1
PER
PA
GE
CO
MPA
SSG
RP-
1-0
1-B
1_3
-TP1
_10
.GPJ
G
EOD
ESIG
N.G
DT
PR
INT
DA
TE:
1/1
1/1
9:K
M:K
T
MATERIAL DESCRIPTION
GR
APH
IC L
OG
TES
TIN
G
HOLLEY PARK SUBDIVISIONLA CENTER, WA
DEPTHFEET
JANUARY 2019 FIGURE A-5
COMPLETED: 12/13/18
SAM
PLE
COMPASSGRP-1-01
LOGGED BY: Z. Rogers
ELEV
AT
ION
DEP
TH
703 Broadway Street - Suite 650Vancouver WA 98660
360.693.8416 www.geodesigninc.com
EXCAVATION METHOD: excavator (see document text)
EXCAVATED BY: Tapani, Inc.
0 50 100
0 50 1000.0
2.5
5.0
7.5
10.0
12.5
15.0
17.5
20.0
22.5
25.0
27.5
30.0

PP = 0.25 tsf
PP = 0.25 tsf
PP = 3.5 tsf
P200 = 68%Slow groundwater seepageobserved at 13.0 feet.
No caving observed to the depthexplored.
Surface elevation was notmeasured at the time ofexploration.
13.5
17.0
PP
PP
PP
P200
Soft, brown SILT (ML), minor sand andorganics; moist (30-inch-thick tilledzone, 12-inch-thick root zone).
very stiff, brown with gray-orangemottles, without organics at 2.5 feet
sandy at 12.0 feet
Medium dense, brown-orange, siltySAND (SM); moist.
brown-dark gray at 15.0 feet
Exploration completed at a depth of17.0 feet.
COMMENTS MOISTURECONTENT %
TEST PIT TP-3
TES
T P
IT L
OG
- 1
PER
PA
GE
CO
MPA
SSG
RP-
1-0
1-B
1_3
-TP1
_10
.GPJ
G
EOD
ESIG
N.G
DT
PR
INT
DA
TE:
1/1
1/1
9:K
M:K
T
MATERIAL DESCRIPTION
GR
APH
IC L
OG
TES
TIN
G
HOLLEY PARK SUBDIVISIONLA CENTER, WA
DEPTHFEET
JANUARY 2019 FIGURE A-6
COMPLETED: 12/13/18
SAM
PLE
COMPASSGRP-1-01
LOGGED BY: Z. Rogers
ELEV
AT
ION
DEP
TH
703 Broadway Street - Suite 650Vancouver WA 98660
360.693.8416 www.geodesigninc.com
EXCAVATION METHOD: excavator (see document text)
EXCAVATED BY: Tapani, Inc.
0 50 100
0 50 1000.0
2.5
5.0
7.5
10.0
12.5
15.0
17.5
20.0
22.5
25.0
27.5
30.0

PP = 0.25 tsf
PP = 1.0 tsf
Slow groundwater seepageobserved at 12.0 feet.
No caving observed to the depthexplored.
Surface elevation was notmeasured at the time ofexploration.
12.0
18.0
PP
PP
Very soft, brown SILT with sand andorganics (ML); moist (12-inch-thick tilledzone, 6-inch-thick root zone).medium stiff to stiff, gray with orangemottles, without organics at 1.0 foot
Medium dense, brown with orangemottled, silty SAND (SM); moist.
dark gray at 15.0 feet
Exploration completed at a depth of18.0 feet.
COMMENTS MOISTURECONTENT %
TEST PIT TP-4
TES
T P
IT L
OG
- 1
PER
PA
GE
CO
MPA
SSG
RP-
1-0
1-B
1_3
-TP1
_10
.GPJ
G
EOD
ESIG
N.G
DT
PR
INT
DA
TE:
1/1
1/1
9:K
M:K
T
MATERIAL DESCRIPTION
GR
APH
IC L
OG
TES
TIN
G
HOLLEY PARK SUBDIVISIONLA CENTER, WA
DEPTHFEET
JANUARY 2019 FIGURE A-7
COMPLETED: 12/13/18
SAM
PLE
COMPASSGRP-1-01
LOGGED BY: Z. Rogers
ELEV
AT
ION
DEP
TH
703 Broadway Street - Suite 650Vancouver WA 98660
360.693.8416 www.geodesigninc.com
EXCAVATION METHOD: excavator (see document text)
EXCAVATED BY: Tapani, Inc.
0 50 100
0 50 1000.0
2.5
5.0
7.5
10.0
12.5
15.0
17.5
20.0
22.5
25.0
27.5
30.0

PP = 0.25 tsf
PP = 1.0 tsf
PP = 2.75 tsfLL = 49%PL = 25%
Groundwater seepage observed at11.0 feet.P200 = 54%
No caving was observed to thedepth explored.
Surface elevation was notmeasured at the time ofexploration.
15.0
17.0
PP
PP
ATTPP
P200
Soft, brown SILT with sand and organics(ML); moist (24-inch-thick tilled zone,12-inch-thick root zone).
soft to medium stiff, brown with graymottles, without organics at 2.0 feetvery stiff at 3.0 feet
medium stiff; wet at 11.0 feet
Medium dense, dark gray, silty SAND(SM); moist.
Exploration completed at a depth of17.0 feet.
COMMENTS MOISTURECONTENT %
TEST PIT TP-5
TES
T P
IT L
OG
- 1
PER
PA
GE
CO
MPA
SSG
RP-
1-0
1-B
1_3
-TP1
_10
.GPJ
G
EOD
ESIG
N.G
DT
PR
INT
DA
TE:
1/1
1/1
9:K
M:K
T
MATERIAL DESCRIPTION
GR
APH
IC L
OG
TES
TIN
G
HOLLEY PARK SUBDIVISIONLA CENTER, WA
DEPTHFEET
JANUARY 2019 FIGURE A-8
COMPLETED: 12/13/18
SAM
PLE
COMPASSGRP-1-01
LOGGED BY: Z. Rogers
ELEV
AT
ION
DEP
TH
703 Broadway Street - Suite 650Vancouver WA 98660
360.693.8416 www.geodesigninc.com
EXCAVATION METHOD: excavator (see document text)
EXCAVATED BY: Tapani, Inc.
0 50 100
0 50 1000.0
2.5
5.0
7.5
10.0
12.5
15.0
17.5
20.0
22.5
25.0
27.5
30.0

PP = 0.25 tsf
PP = 0.25 tsf
Slow groundwater seepageobserved at 4.0 feet.Minor caving observed at 4.0 feet.
P200 = 94%
Surface elevation was notmeasured at the time ofexploration.
17.0
PP
PP
P200
Soft, brown SILT with sand and organics(ML); moist, sand is fine (12-inch-thicktilled zone, 6-inch-thick root zone).brown with gray mottles, withoutorganics at 1.0 foot
medium stiff at 5.0 feet
Exploration completed at a depth of17.0 feet.
COMMENTS MOISTURECONTENT %
TEST PIT TP-6
TES
T P
IT L
OG
- 1
PER
PA
GE
CO
MPA
SSG
RP-
1-0
1-B
1_3
-TP1
_10
.GPJ
G
EOD
ESIG
N.G
DT
PR
INT
DA
TE:
1/1
1/1
9:K
M:K
T
MATERIAL DESCRIPTION
GR
APH
IC L
OG
TES
TIN
G
HOLLEY PARK SUBDIVISIONLA CENTER, WA
DEPTHFEET
JANUARY 2019 FIGURE A-9
COMPLETED: 12/13/18
SAM
PLE
COMPASSGRP-1-01
LOGGED BY: Z. Rogers
ELEV
AT
ION
DEP
TH
703 Broadway Street - Suite 650Vancouver WA 98660
360.693.8416 www.geodesigninc.com
EXCAVATION METHOD: excavator (see document text)
EXCAVATED BY: Tapani, Inc.
0 50 100
0 50 1000.0
2.5
5.0
7.5
10.0
12.5
15.0
17.5
20.0
22.5
25.0
27.5
30.0

PP = 1.0 tsf
PP = 0.75 tsf
Slow groundwater seepageobserved at 13.0 feet.
No caving observed to the depthexplored.
Surface elevation was notmeasured at the time ofexploration.
13.0
18.0
PP
PP
Very soft, brown SILT with sand andorganics (ML); moist (12-inch-thick tilledzone, 6-inch-thick root zone).medium stiff to stiff, brown with gray-orange mottles, without organics at 1.0foot
Medium dense, light brown, silty SAND(SM); moist.orange at 14.0 feet
Exploration completed at a depth of18.0 feet.
COMMENTS MOISTURECONTENT %
TEST PIT TP-7
TES
T P
IT L
OG
- 1
PER
PA
GE
CO
MPA
SSG
RP-
1-0
1-B
1_3
-TP1
_10
.GPJ
G
EOD
ESIG
N.G
DT
PR
INT
DA
TE:
1/1
1/1
9:K
M:K
T
MATERIAL DESCRIPTION
GR
APH
IC L
OG
TES
TIN
G
HOLLEY PARK SUBDIVISIONLA CENTER, WA
DEPTHFEET
JANUARY 2019 FIGURE A-10
COMPLETED: 12/13/18
SAM
PLE
COMPASSGRP-1-01
LOGGED BY: Z. Rogers
ELEV
AT
ION
DEP
TH
703 Broadway Street - Suite 650Vancouver WA 98660
360.693.8416 www.geodesigninc.com
EXCAVATION METHOD: excavator (see document text)
EXCAVATED BY: Tapani, Inc.
0 50 100
0 50 1000.0
2.5
5.0
7.5
10.0
12.5
15.0
17.5
20.0
22.5
25.0
27.5
30.0

PP = 0.25 tsf
P200 = 85%PP = 2.0 tsf
Slow groundwater seepageobserved at 11.0 feet.
No caving observed to the depthexplored.
Surface elevation was notmeasured at the time ofexploration.
14.0
18.0
PP
P200PP
Soft, brown SILT with sand and organics(ML); moist, sand is fine (24-inch-thicktilled zone, 12-inch-thick root zone).
without organics at 2.0 feet
Medium dense, light brown-gray SANDwith silt (SP-SM); moist.
Exploration completed at a depth of18.0 feet.
COMMENTS MOISTURECONTENT %
TEST PIT TP-8
TES
T P
IT L
OG
- 1
PER
PA
GE
CO
MPA
SSG
RP-
1-0
1-B
1_3
-TP1
_10
.GPJ
G
EOD
ESIG
N.G
DT
PR
INT
DA
TE:
1/1
1/1
9:K
M:K
T
MATERIAL DESCRIPTION
GR
APH
IC L
OG
TES
TIN
G
HOLLEY PARK SUBDIVISIONLA CENTER, WA
DEPTHFEET
JANUARY 2019 FIGURE A-11
COMPLETED: 12/13/18
SAM
PLE
COMPASSGRP-1-01
LOGGED BY: Z. Rogers
ELEV
AT
ION
DEP
TH
703 Broadway Street - Suite 650Vancouver WA 98660
360.693.8416 www.geodesigninc.com
EXCAVATION METHOD: excavator (see document text)
EXCAVATED BY: Tapani, Inc.
0 50 100
0 50 1000.0
2.5
5.0
7.5
10.0
12.5
15.0
17.5
20.0
22.5
25.0
27.5
30.0

PP = 0.25 tsf
PP = 6.5 tsf
Slow groundwater seepageobserved at 10.0 feet.P200 = 62%
No caving observed to the depthexplored.
Surface elevation was notmeasured at the time ofexploration.
15.0
16.0
PP
PP
P200
Very soft, brown SILT with sand andorganics (ML); moist, sand is fine (24-inch-thick tilled zone, 12-inch-thick rootzone).soft to medium stiff, gray with orangemottles, without organics at 2.0 feet
brown, sandy at 9.0 feet
Medium dense, brown with orangemottled, silty SAND (SM); moist.Exploration completed at a depth of16.0 feet.
COMMENTS MOISTURECONTENT %
TEST PIT TP-9
TES
T P
IT L
OG
- 1
PER
PA
GE
CO
MPA
SSG
RP-
1-0
1-B
1_3
-TP1
_10
.GPJ
G
EOD
ESIG
N.G
DT
PR
INT
DA
TE:
1/1
1/1
9:K
M:K
T
MATERIAL DESCRIPTION
GR
APH
IC L
OG
TES
TIN
G
HOLLEY PARK SUBDIVISIONLA CENTER, WA
DEPTHFEET
JANUARY 2019 FIGURE A-12
COMPLETED: 12/13/18
SAM
PLE
COMPASSGRP-1-01
LOGGED BY: Z. Rogers
ELEV
AT
ION
DEP
TH
703 Broadway Street - Suite 650Vancouver WA 98660
360.693.8416 www.geodesigninc.com
EXCAVATION METHOD: excavator (see document text)
EXCAVATED BY: Tapani, Inc.
0 50 100
0 50 1000.0
2.5
5.0
7.5
10.0
12.5
15.0
17.5
20.0
22.5
25.0
27.5
30.0

PP = 0.25 tsf
PP = 0.75 tsf
Slow groundwater seepageobserved at 12.0 feet.
P200 = 44%
No caving observed to the depthexplored.
Surface elevation was notmeasured at the time ofexploration.
15.0
16.5
PP
PP
P200
Very soft, brown SILT with sand andorganics (ML); moist, sand is fine (24-inch-thick tilled zone, 18-inch-thick rootzone).without organics at 2.0 feet
medium stiff at 3.0 feet
light brown, sandy at 10.0 feet
Medium dense, brown with orangemottled, silty SAND (SM); moist.
Exploration completed at a depth of16.5 feet.
COMMENTS MOISTURECONTENT %
TEST PIT TP-10
TES
T P
IT L
OG
- 1
PER
PA
GE
CO
MPA
SSG
RP-
1-0
1-B
1_3
-TP1
_10
.GPJ
G
EOD
ESIG
N.G
DT
PR
INT
DA
TE:
1/1
1/1
9:K
M:K
T
MATERIAL DESCRIPTION
GR
APH
IC L
OG
TES
TIN
G
HOLLEY PARK SUBDIVISIONLA CENTER, WA
DEPTHFEET
JANUARY 2019 FIGURE A-13
COMPLETED: 12/13/18
SAM
PLE
COMPASSGRP-1-01
LOGGED BY: Z. Rogers
ELEV
AT
ION
DEP
TH
703 Broadway Street - Suite 650Vancouver WA 98660
360.693.8416 www.geodesigninc.com
EXCAVATION METHOD: excavator (see document text)
EXCAVATED BY: Tapani, Inc.
0 50 100
0 50 1000.0
2.5
5.0
7.5
10.0
12.5
15.0
17.5
20.0
22.5
25.0
27.5
30.0

0
10
20
30
40
50
60
MH or OH
ML or OL
0 10 20 30 40 50 60 70 80 90 100 110
CL-ML
CL or OL
ATTERBERG LIMITS TEST RESULTS
CH or OH
"A" LINE
LIQUID LIMIT
PLA
ST
ICIT
Y I
ND
EX
COMPASSGRP-1-01
JANUARY 2019 HOLLEY PARK SUBDIVISIONLA CENTER, WA FIGURE A-14
703 Broadway Street - Suite 650Vancouver WA 98660
360.693.8416 www.geodesigninc.com
MOISTURE CONTENT(PERCENT)
5.0
35.0
3.0
32
32
32
EXPLORATIONNUMBER
SAMPLE DEPTH(FEET)
19
16
24
45
39
49
26
23
25
B-1
B-2
TP-5
KEY LIQUID LIMIT PLASTIC LIMIT PLASTICITY INDEX
AT
TER
BER
G_L
IMIT
S 7
C
OM
PASS
GR
P-1
-01
-B1
_3-T
P1_1
0.G
PJ
GEO
DES
IGN
.GD
T
PRIN
T D
AT
E: 1
/11
/19
:KT

B-1 5.0 32 45 26 19
B-1 20.0 33 68
B-2 10.0 36 71
B-2 25.0 32 42
B-2 35.0 32 39 23 16
B-2 40.0 30 41
B-3 15.0 37 73
B-3 25.0 35 40
TP-1 2.0 39 91
TP-2 14.0 37 40
TP-3 12.0 40 68
TP-5 3.0 32 49 25 24
TP-5 11.0 39 54
TP-6 10.0 40 94
TP-8 2.0 36 85
TP-9 10.0 34 62
TP-10 15.0 34 44
GRAVEL(PERCENT)
SAMPLEDEPTH(FEET)
SUMMARY OF LABORATORY DATA
ELEVATION(FEET)
P200(PERCENT)
SIEVE
PLASTICLIMIT
PLASTICITYINDEX
ATTERBERG LIMITSMOISTURECONTENT(PERCENT)
SAMPLE INFORMATION
EXPLORATIONNUMBER
SAND(PERCENT)
DRYDENSITY
(PCF)LIQUIDLIMIT
COMPASSGRP-1-01
JANUARY 2019 HOLLEY PARK SUBDIVISIONLA CENTER, WA FIGURE A-15
703 Broadway Street - Suite 650Vancouver WA 98660
360.693.8416 www.geodesigninc.com
LAB S
UM
MA
RY
CO
MPA
SSG
RP-
1-0
1-B
1_3
-TP1
_10
.GPJ
G
EOD
ESIG
N.G
DT
PR
INT
DA
TE:
1/1
1/1
9:K
T

APPENDIX B

B-1 CompassGrp-1-01:011419
APPENDIX B SLOPE STABILITY ANALYSIS This appendix contains the outputs of the slope stability analysis from the software program Slope/W by GeoStudio. The locations of the analyzed sections are shown on Figures 2 and 3 and a discussion of the results is present in the main report.