
1. 10/24/20152 3 Upon completion of this module, you will be able to: Use Thread Checker to detect...
80
1
-
Upload
roy-charles -
Category
Documents
-
view
217 -
download
3
Transcript of 1. 10/24/20152 3 Upon completion of this module, you will be able to: Use Thread Checker to detect...

1

04/20/23 2
3
Upon completion of this module, you will be able to:
• Use Thread Checker to detect and identify a variety of threading correctness issues in Windows* threaded applications
• Determine if library functions are thread-safe

• What is Intel® Thread Checker?• Detecting race conditions • Thread Checker as threading assistant• Some other threading errors• Checking library thread-safety• Other features of Thread Checker

Developing threaded applications can be a complex task.
New class of problems are caused by the interaction between concurrent threads:
• Data races or storage conflictso More than one thread accesses memory without synchronization
• Deadlocks o Thread waits for an event that will never happen

Debugging tool for threaded software
Finds threading bugs in Windows*, POSIX*, and OpenMP* threaded software
Locates bugs quickly that can take days to find using traditional methods and tools
◦ Isolates problems, not the symptoms◦ Bug does not have to occur to find it!
Plug-in to VTune™ Performance Analyzer◦ Same look, feel, and interface as VTune™ environment

7
Supports several different compilers◦ Intel® C++ and Fortran Compilers, v7 and higher◦ Microsoft* Visual* C++, v6◦ Microsoft* Visual* C++ .NET* 2002, 2003 & 2005 Editions
Integrated into Microsoft Visual Studio .NET* IDE
View (drill-down to) source code for DiagnosticsOne-click help for diagnostics
◦ Possible causes and solution suggestions
API for user-defined synchronization primitives

8
Dynamic as software runs:◦ Data (workload) -driven execution
Includes monitoring of:◦ Thread and Sync APIs used◦ Thread execution order
Scheduler impacts results◦ Memory accesses between threads
Code path must be executed to be analyzed

9
Instrumentation: background◦ Adds calls to library to record information
Thread and Sync APIs Memory accesses
◦ Increases execution time and size
Use small data sets (workloads)◦ Execution time and space is expanded◦ Multiple runs over different paths yield best results
Workload selection is important!Workload selection is important! Workload selection is important!Workload selection is important!

10
Execute problem code once per thread to be identified
Use smallest possible working data set ◦ Minimize data set size
Smaller image sizes◦ Minimize loop iterations or time steps
Simulate minutes rather than days◦ Minimize update rates
Lower frames per second
Finds threading errors Finds threading errors faster!faster!
Finds threading errors Finds threading errors faster!faster!
04/20/23 11
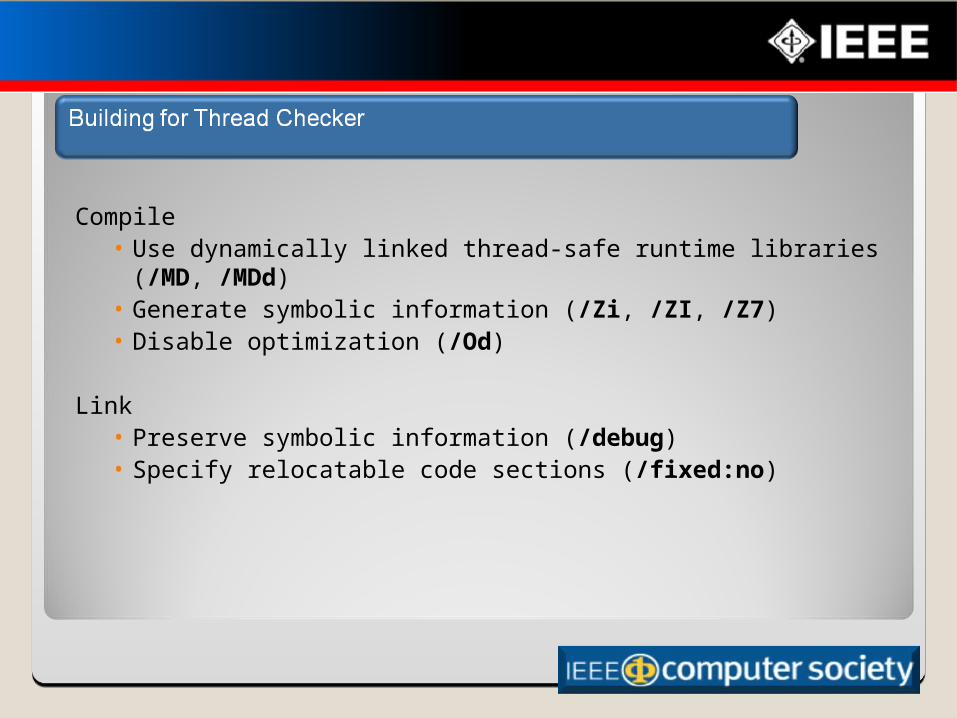
Compile• Use dynamically linked thread-safe runtime libraries (/MD, /MDd)• Generate symbolic information (/Zi, /ZI, /Z7)• Disable optimization (/Od)
Link • Preserve symbolic information (/debug)• Specify relocatable code sections (/fixed:no)

12
Build with supported compiler
Running the application◦ Must be run from within Thread Checker◦ Application is instrumented when executed◦ External DLLs are instrumented as used

13
Intel® C++ or Fortran Compilers• Compile with /Qtcheck
Running the application• Start in VTune™ environment• Start from Windows* command lineo Data collected in threadchecker.thr results fileo View results (.thr file) in VTune™ environmento Additional DLLs not instrumented or analyzed
More detailed diagnosticsMore detailed diagnosticsMore detailed diagnosticsMore detailed diagnostics

14
Intel® Thread Checker WizardIntel® Thread Profiler WizardAdvanced Activity Configuration
1) Must Select1) Must Select
2) To see these Wizards
2) To see these Wizards

15

16
17

18
1) Right-click here . . .
1) Right-click here . . .
2) More help!2) More help!

19
Build and run serial version
Build threaded version
Run application in Thread Checker to identify threading problems

20
Consider the serial code:
Flow dependence between S1 and S2◦ Value of A updated in S1 is used in S2
Anti dependence between S2 and S3◦ Value of A is read in S2 before written in S3
Output dependence between S3 and S4◦ Value of A assigned in S3 must occur before assignment in S4
S1: A = 1.0;S2: B = A + 3.14;S3: A = 1/3 * (C – D);. . . . . . . . . . . . S4: A = (B * 3.8) / 2.7;

21
Thread Checker Dependencies:Output dependence
◦ Write-Write conflict: one thread updates a variable that is subsequently updated by another thread
Anti-dependence
◦ Read-Write conflict: one thread reads a variable that is subsequently updated by another thread
Flow dependence
◦ Write-Read conflict: one thread updates a variable that is subsequently read by another thread
22
Execution order is assumed but cannot be guaranteed◦ Concurrent access of same variable by multiple threads
Most common error in multithreaded programs
May not be apparent at all times

23
Solution: Scope variables to be local to threads
When to use◦ Value computed is not used outside parallel region◦ Temporary or “work” variables
How to implement◦ OpenMP scoping clauses (private, shared)◦ Declare variables within threaded functions◦ Allocate variables on thread stack◦ TLS (Thread Local Storage) API

24
Solution: Control shared access with critical regions
When to use◦ Value computed is used outside parallel region◦ Shared value is required by each thread
How to implement◦ Mutual exclusion and synchronization◦ Lock, semaphore, event, critical section, atomic…◦ Rule of thumb: Use one lock per data element

25
Fix errors found by Thread Checker

04/20/23
When implementing threads◦ Obvious shared and private variables can be identified and handled◦ Should you analyze remaining variables for dependencies?◦ What if parallel code is 100’s of lines long?◦ What about variable use in called functions?◦ Can you tell if pointers refer to same memory location?
Use Thread Checker as a threading assistant◦ Speculatively insert threading (OpenMP prototype?)◦ Compile and run program in Thread Checker◦ Review diagnostics ◦ Update directives and/or restructure
Let Thread Checker do the “heavy lifting”Let Thread Checker do the “heavy lifting”

04/20/23 27
Caused by thread waiting on some event that will never happenMost common cause is locking hierarchies
◦ Always lock and un-lock in the same order◦ Avoid hierarchies if possible
DWORD WINAPI threadA(LPVOID arg){ EnterCriticalSection(&L1); EnterCriticalSection(&L2); processA(data1, data2); LeaveCriticalSection(&L2); LeaveCriticalSection(&L1); return(0);}
DWORD WINAPI threadB(LPVOID arg)DWORD WINAPI threadB(LPVOID arg){{ EnterCriticalSection(&L2);EnterCriticalSection(&L2);
EnterCriticalSection(&L1);EnterCriticalSection(&L1); processB(data2, data1) ;processB(data2, data1) ; LeaveCriticalSection(&L1);LeaveCriticalSection(&L1);LeaveCriticalSection(&L2);LeaveCriticalSection(&L2);
return(0);return(0);}}
ThreadA: L1, then L2ThreadA: L1, then L2ThreadA: L1, then L2ThreadA: L1, then L2
ThreadB: L2, then L1ThreadB: L2, then L1ThreadB: L2, then L1ThreadB: L2, then L1
04/20/23 28
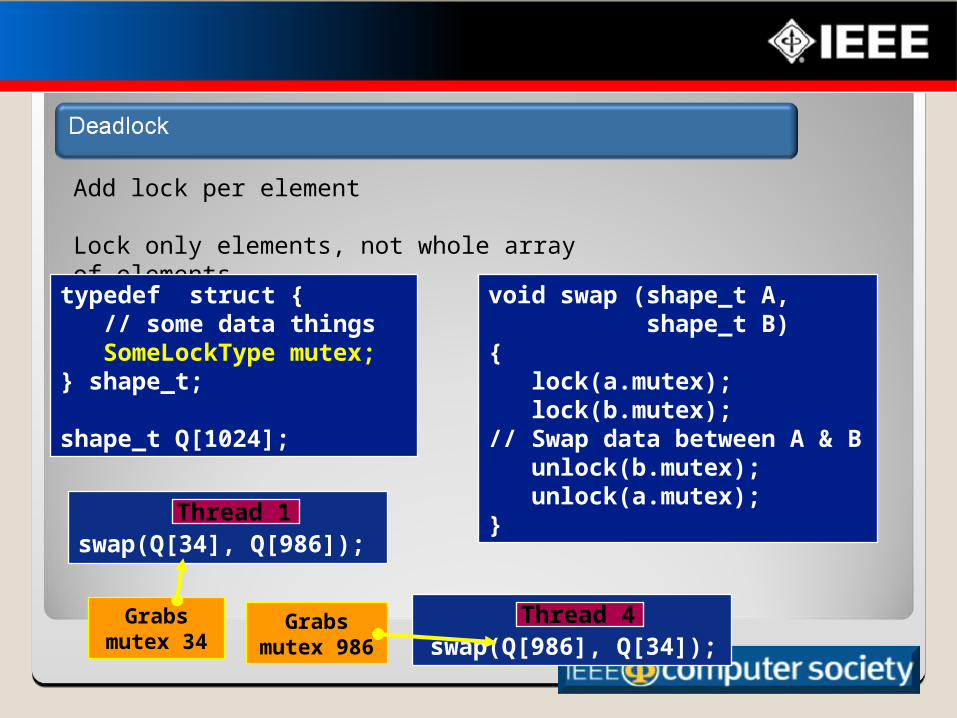
Add lock per element
Lock only elements, not whole array of elements
void swap (shape_t A, shape_t B){ lock(a.mutex); lock(b.mutex);// Swap data between A & B unlock(b.mutex); unlock(a.mutex);}
typedef struct { // some data things SomeLockType mutex;} shape_t;
shape_t Q[1024];
swap(Q[986], Q[34]);Thread 4
swap(Q[34], Q[986]);Thread 1
Grabs mutex 34
Grabs mutex
986
04/20/23 29
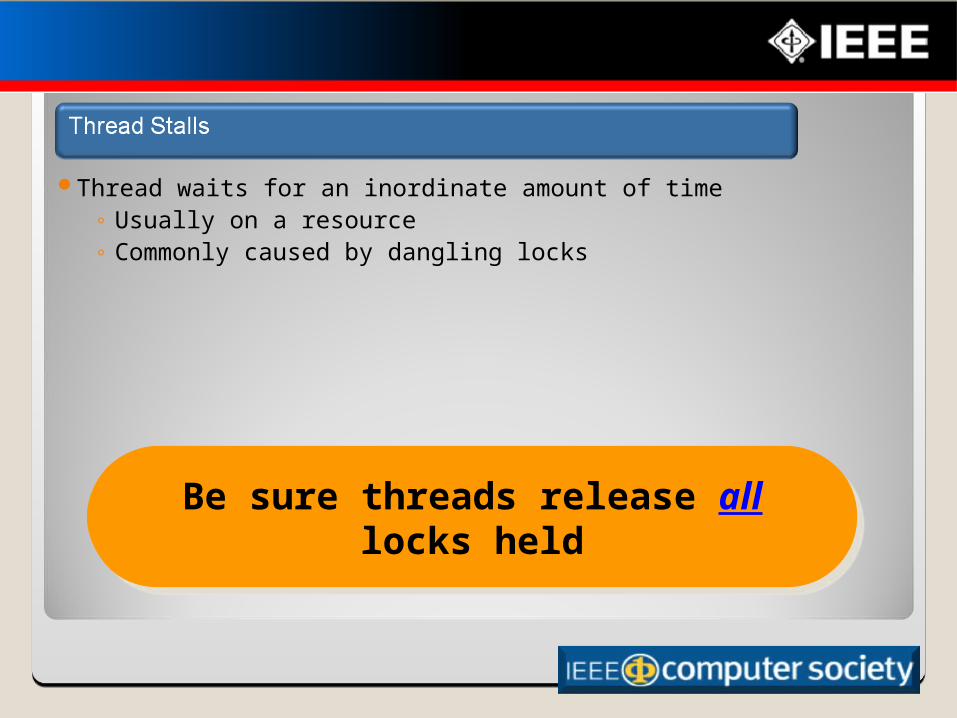
Thread waits for an inordinate amount of time◦ Usually on a resource◦ Commonly caused by dangling locks
Be sure threads release all locks heldBe sure threads release all locks held

04/20/23 30
int data;
DWORD WINAPI threadFunc(LPVOID arg){ int localData; EnterCriticalSection(&lock); if (data == DONE_FLAG) return(1); localData = data; LeaveCriticalSection(&lock);
process(local_data); return(0);}
Lock Lock never never
releasedreleased
Lock Lock never never
releasedreleased
04/20/23 31
Use Intel® Thread Checker to find and correct the potential deadlock problem.
04/20/23 32
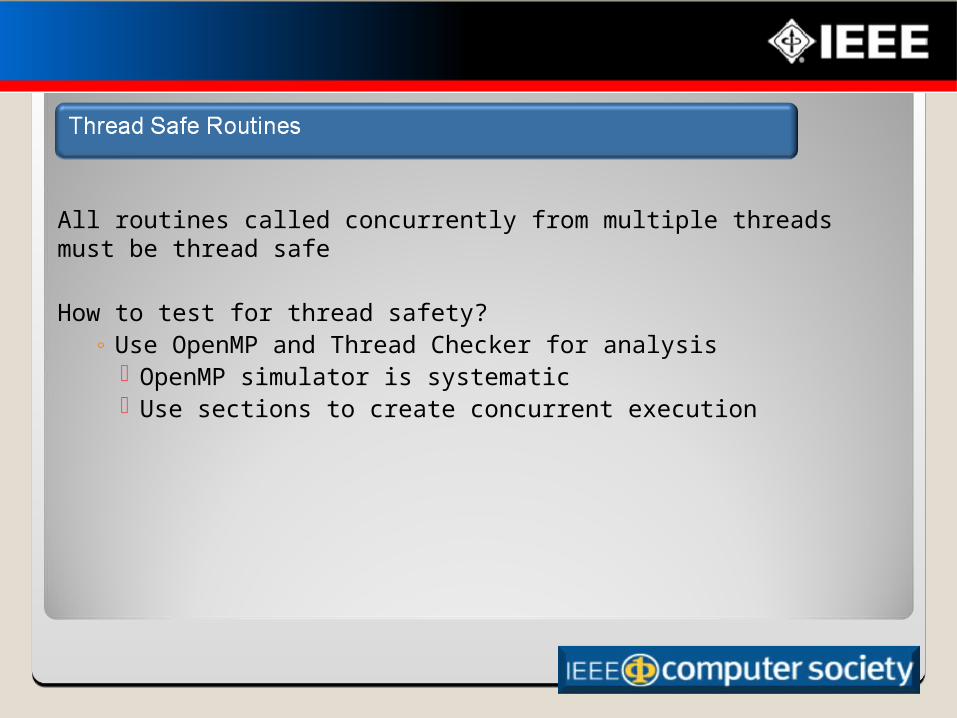
All routines called concurrently from multiple threads must be thread safe
How to test for thread safety?◦ Use OpenMP and Thread Checker for analysis
OpenMP simulator is systematic Use sections to create concurrent execution

04/20/23 33
Check for safety issues between
◦ Multiple instances of routine1()
◦ Instances of routine1() and routine2()
Set up sections to test all permutations
Still need to provide data sets that exercise relevant portions of code
#pragma omp parallel sections
{
#pragma omp section
routine1(&data1);
#pragma omp section
routine1(&data2);
#pragma omp section
routine2(&data3);
}

04/20/23 34
Routines can be written to be reentrant ◦ Any variables changed by the routine must be local to each
invocation Don’t modify globally shared variables
Routines can use mutual exclusion to avoid conflicts with other threads
◦ If accessing shared variables cannot be avoided
What if third-party libraries are not thread safe?◦ Will likely need to control threads access to library
It is better to make a routine reentrant It is better to make a routine reentrant than to add synchronizationthan to add synchronization
Avoids potential overhead Avoids potential overhead

04/20/23 35
Use OpenMP framework to call library routines concurrently◦ Three library calls = 6 combinations to test
A:A, B:B, C:C, A:B, A:C, B:C

04/20/23 36
Higher levels increase memory usage and analysis time, but provide more details
Binary instrumentation lowers level from default until successful
Manually adjust level of instrumentation to increase speed or control amount of information gathered
Instrumentation Level
Description
Full Image Each instruction in the module is instrumented to be checked to see if it might generate a diagnostic message.
Custom Image Same as “Full Image” except user can disable selected functions from instrumentation.
All Functions Turns on full instrumentation for those parts of a module that were compiled with debugging information.
Custom Functions
Same as “All Functions” except user can disable selected functions from instrumentation.
API Imports Only system API functions that are needed to be instrumented by the tool will be instrumented. No user code is instrumented.
Module Imports Disables instrumentation. This is default on system images, images without base relocations, and images not containing debug information.

04/20/23 37
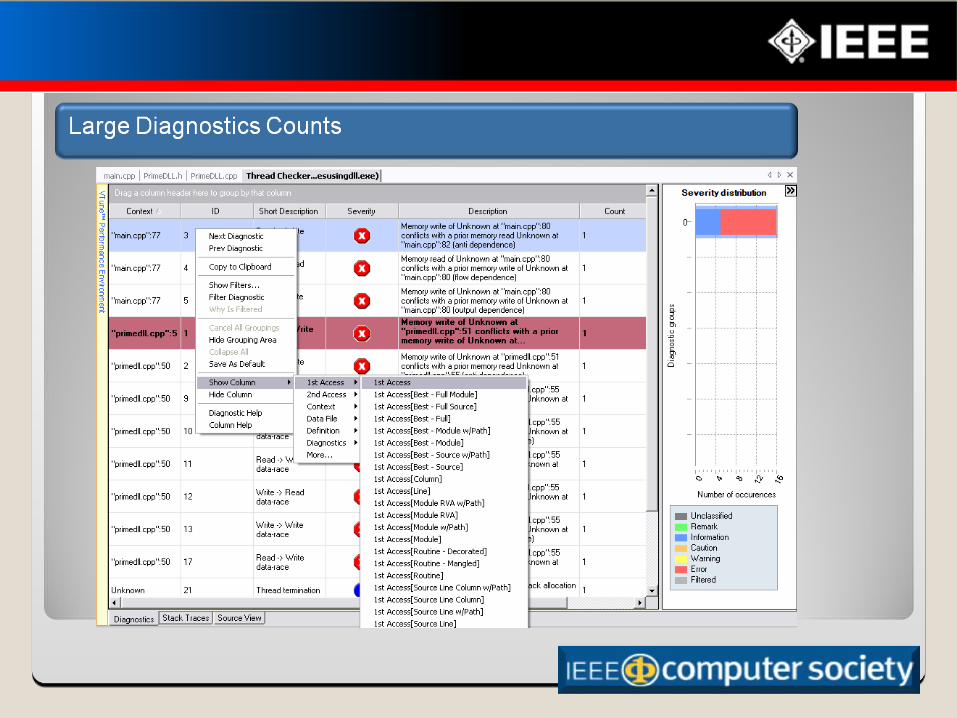
What do you do if you have 5000 diagnostics?Where do you begin debugging?Are all the diagnostic messages equally important/serious?
Suggestions for organizing and prioritizing◦ Add “1st Access” column◦ Group by “1st Access”◦ Sort by “Short Description” column
04/20/23 38

04/20/23 39
04/20/23 40
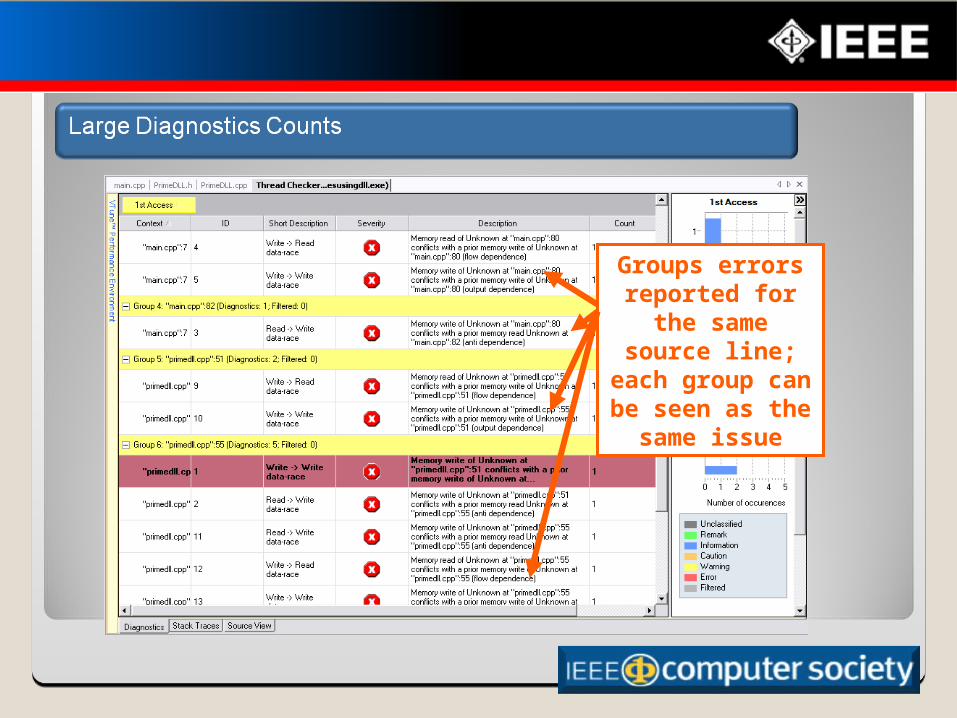
Groups errors reported for the
same source line; each group can be seen as the
same issue

04/20/23 41
Sort on the “Short description”
04/20/23 42
Threading errors are easy to introduce
Debugging these errors by traditional techniques is hard
Intel® Thread Checker catches these errors◦ Errors do not have to occur to be detected◦ Greatly reduces debugging time◦ Improves robustness of the application
04/20/23 43
04/20/23 44

04/20/23 45
After successful completion of this module you will be able to…
• Use Thread Profiler to recognize and fix common performance problems in applications using Windows* threads

04/20/23 46
Look at Intel® Thread Profiler features
Define Critical Path Analysis
Examine Thread Profiler data views available Review common performance issues of multithreaded applications
◦ Focus on Load imbalance◦ Focus on Synchronization contention
Describe general optimizations to gain better performance

04/20/23 47
Developing efficient multithreaded applications is hard
New performance problems are caused by the interaction between concurrent threads:
◦ Load imbalance◦ Contention on synchronization objects◦ Threading overhead

04/20/23 48
Supports several different compilers◦ Intel® C++ and Fortran Compilers, v7 and higher◦ Microsoft* Visual* C++, v6◦ Microsoft* Visual* C++ .NET* 2002, 2003 & 2005 Editions
Integrated into Microsoft Visual Studio .NET* IDE
Binary instrumentation of applications
Different views and filters available to assist and organize analysis
Uses critical path analysis

04/20/23 49
Threaded applications contain multiple execution flows:
• A new flow is created when a thread is created or resumes• Flow ends when a thread terminates or blocks on a
synchronization primitive
The critical pathcritical path is the longest is the longest execution flowexecution flow

04/20/23 50
System Utilization• Relative to the system executing the application
Thread interaction categories
If the If the critical pathcritical path is shortened, the application will run is shortened, the application will run in less timein less time

04/20/23 51
Examines processor utilization to determine concurrency level of the application.
Concurrency is the number of active threads
Categorization shown for a system configuration with 2 processors

04/20/23 52
Analyze thread interaction and behavior along critical path
Record objects that cause CP transitions
Categorization shown for a system configuration with 2 processors

04/20/23 53
Concurrency Level Critical Path Thread Behavior
0
15
5
10
Tim
e
Start with system utilization
Further categorize by behavior

04/20/23 54
Critical Path View◦ Shows breakdown of the critical path
Profile View◦ Shows the breakdown of selected critical paths◦ User can select other views of the selected profile◦ Concurrency level, threads, objects
Timeline View◦ Shows thread activity and critical path transitions for the entire
applicationSource View
◦ Transition source view, creation source view

04/20/23 55
Threaded version of potential code◦ Is there a performance issue?
Goal◦ Run application through Thread Profiler◦ Examine thread activities by reviewing different views

04/20/23 56
Profile Pane
Timeline Pane

04/20/23 57
Concurrency Level View
Two threads ran in parallel ~33% of the time
Ran single threaded ~65% of the time
Let’s look at the Thread View

04/20/23 58
Time on the Critical Path
Active time of the thread
Lifetime of the thread
Let’s look at the Object View

04/20/23 59
This object caused all of the impact
Let’s look at Timeline View

04/20/23 60

04/20/23 61

04/20/23 62
Threaded version of potential code◦ Is there a performance issue?
Goal◦ Examine thread activities by reviewing different views◦ Determine system utilization◦ Identify any performance issues

04/20/23 63
Concurrency Level view can be used to determine system utilization by the application
Timeline view enables you to understand the thread activity in your application
Instrumentation time will be included in first run results; Instrumentation time will be included in first run results; thus, for applications running in a short amount of time, a thus, for applications running in a short amount of time, a
second run may produce more realistic timings.second run may produce more realistic timings.

04/20/23 64
Load balance◦ Improper distribution of parallel work
Synchronization◦ Excessive use of global data, contention for the same
synchronization object
Parallel Overhead◦ Due to thread creation, scheduling..
Granularity◦ No sufficient parallel work

04/20/23 65
Busy
Idle
Time
Thread 0
Thread 1
Thread 2
Thread 3
Start threads
Join threads

04/20/23 66
Static assignment
• Are the same number of tasks assigned to each thread?• Do tasks take different processing time?oDo tasks change in a predictable pattern?
Rearrange (static) order of assignment to threadsoUse dynamic assignment of tasks

04/20/23 67
Dynamic assignment
• Is there one big task being assigned?oBreak up large task to smaller parts
• Are small computations agglomerated into larger task?oAdjust number of computations in a taskoMore small computations into single task?o Fewer small computations into single task?oBin packing heuristics

04/20/23 68
Threads are unbalanced
Active Times not equal
04/20/23 69
Threaded version of potential code with thread pools◦ Has a load balance performance issue

04/20/23 70
Threads view can be used to determine activity levels of each thread within the application
Timeline view enables you to understand the thread activity in your application

04/20/23 71
By definition, synchronization serializes execution
Lock contention means more idle time for threads
Busy Idle In Critical
Thread 0
Thread 1
Thread 2
Thread 3
Time

04/20/23 72
Eliminate synchronization◦ Expensive but necessary “evil”◦ Use storage local to threads
Use local variable for partial results, update global after local computations
Allocate space on thread stack (alloca) Use thread-local storage API (TlsAlloc)
◦ Use atomic updates whenever possible Some global data updates can use atomic operations
(Interlocked API family)

04/20/23 73
Use Win32 Interlocked* intrinsics in place of synchronization object
static long counter;
// FastInterlockedIncrement (&counter);
// SlowerEnterCriticalSection (&cs); counter++;LeaveCriticalSection (&cs);

04/20/23 74
Reduce size of critical regions protected by synchronization object
• Larger critical regions tie up sync objects longer; other threads sit idle longer waiting to acquire objects
• Only accesses to shared variables need to be protected

04/20/23 75
Use best synchronization object for job• Critical Sectiono Local objectoAvailable to threads within the same processo Lower overhead (~8X faster than mutex)
• Mutexo Kernel objectoAccessible to threads within different
processesoDeadlock safety (can only be released by
owner)Other objects are available

04/20/23 76
These four threads…
…are impacting threads by this
object

04/20/23 77
Threaded version of numerical integration◦ Has serious performance issues
Goal◦ Understand thread activity ◦ Use the Thread Profiler groupings ◦ Examine synchronization and its effect on performance◦ Fix performance issue

04/20/23 78
Grouping objects and threads provides the information on which objects impact what threads
Apply the heuristics from labs for locating bottlenecks in the source code
For longer running applications, the difference in first and second run-times is negligible

04/20/23 79
Serial Optimizations◦ Serial optimizations along the critical path should affect
execution time
Parallel Optimizations◦ Reduce synchronization object contention◦ Balance workload◦ Functional parallelism
Analyze benefit of increasing number of processors
Analyze the effect of increasing the number of threads on scaling performance

04/20/23 80
Identifying performance issues can be time consuming without tools
Tools are required to understand and to optimize parallel efficiency and hardware utilization
Thread Profiler helps you understand your applications thread activity, system utilization, and scaling performance