1 Chapter 17 Data Analysis: Investigation of Association © 2005 Thomson/South-Western.
date post
21-Dec-2015Category
view
212download
0
1 1 Slide
Slide
© 2006 Thomson/South-Western© 2006 Thomson/South-Western
Chapter 1Chapter 1 Data and Statistics Data and Statistics
I need I need help!help!Applications in Business and Economics
Data
Data Sources
Descriptive Statistics
Statistical Inference
Computers and Statistical Analysis

2 2 Slide
Slide
© 2006 Thomson/South-Western© 2006 Thomson/South-Western
Data and Data SetsData and Data Sets
DataData are the facts and figures collected, are the facts and figures collected, summarized, analyzed, and interpreted.summarized, analyzed, and interpreted.
The data collected in a particular study The data collected in a particular study areare referred to as the referred to as the data setdata set..

3 3 Slide
Slide
© 2006 Thomson/South-Western© 2006 Thomson/South-Western
The The elementselements are the entities on which data are are the entities on which data are collected.collected.
A A variablevariable is a characteristic of the elements. is a characteristic of the elements.
The set of measurements collected for a particularThe set of measurements collected for a particular element is called an element is called an observationobservation..
Elements, Variables, and ObservationsElements, Variables, and Observations

4 4 Slide
Slide
© 2006 Thomson/South-Western© 2006 Thomson/South-Western
Stock Annual Earn/Stock Annual Earn/Exchange Sales($M) Share($)Exchange Sales($M) Share($)
Data, Data Sets, Data, Data Sets, Elements, Variables, and ObservationsElements, Variables, and Observations
CompanyCompany
DataramDataram
EnergySouthEnergySouth
KeystoneKeystone
LandCareLandCare
PsychemedicsPsychemedics
AMEXAMEX 73.10 73.10 0.86 0.86
OTCOTC 74.00 74.00 1.67 1.67
NYSENYSE 365.70365.70 0.86 0.86
NYSENYSE 111.40111.40 0.33 0.33
AMEXAMEX 17.60 17.60 0.13 0.13
VariableVariablessElemenElemen
tt NamesNames
Data SetData Set
ObservatioObservationn
5 5 Slide
Slide
© 2006 Thomson/South-Western© 2006 Thomson/South-Western
Scales of MeasurementScales of Measurement
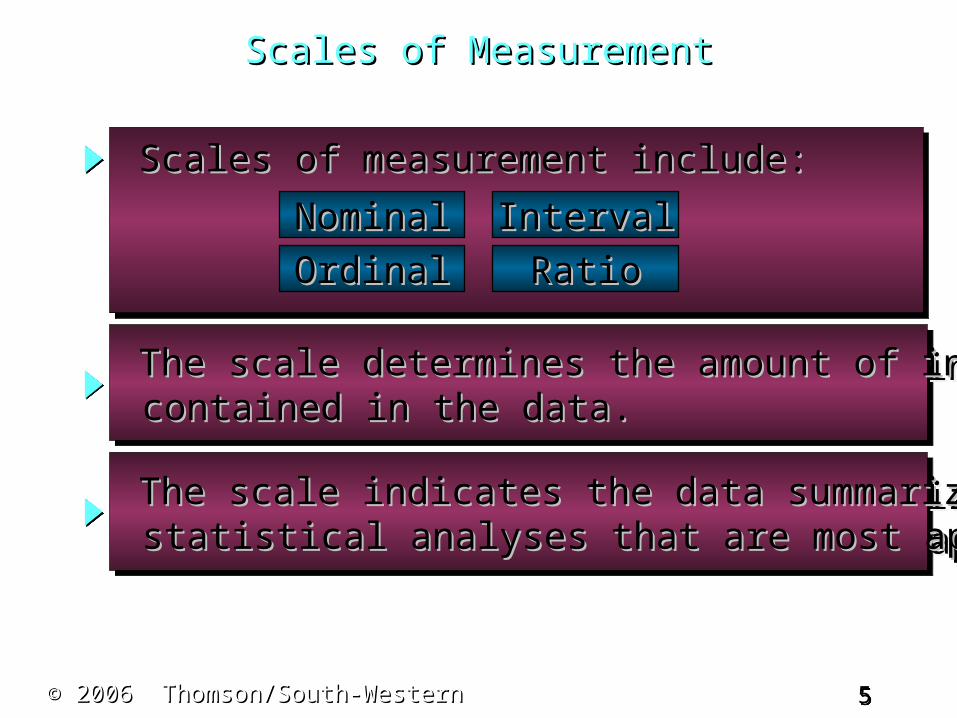
The scale indicates the data summarization andThe scale indicates the data summarization and statistical analyses that are most appropriate.statistical analyses that are most appropriate. The scale indicates the data summarization andThe scale indicates the data summarization and statistical analyses that are most appropriate.statistical analyses that are most appropriate.
The scale determines the amount of informationThe scale determines the amount of information contained in the data.contained in the data. The scale determines the amount of informationThe scale determines the amount of information contained in the data.contained in the data.
Scales of measurement include:Scales of measurement include: Scales of measurement include:Scales of measurement include:
NominalNominal
OrdinalOrdinalIntervalInterval
RatioRatio

6 6 Slide
Slide
© 2006 Thomson/South-Western© 2006 Thomson/South-Western
Scales of MeasurementScales of Measurement
Nominal = name categories, count Nominal = name categories, count frequenciesfrequencies
A A nonnumeric labelnonnumeric label or or numeric codenumeric code may may be used.be used. A A nonnumeric labelnonnumeric label or or numeric codenumeric code may may be used.be used.
Data are Data are labels or nameslabels or names used to identify an used to identify an attribute of the element.attribute of the element. Data are Data are labels or nameslabels or names used to identify an used to identify an attribute of the element.attribute of the element.

7 7 Slide
Slide
© 2006 Thomson/South-Western© 2006 Thomson/South-Western
Example:Example: Students of a university are classified by theStudents of a university are classified by the schoolschool in which they are enrolled using a in which they are enrolled using a nonnumeric label such as Business, Humanities,nonnumeric label such as Business, Humanities, Education, and so on.Education, and so on.
Example:Example: Students of a university are classified by theStudents of a university are classified by the schoolschool in which they are enrolled using a in which they are enrolled using a nonnumeric label such as Business, Humanities,nonnumeric label such as Business, Humanities, Education, and so on.Education, and so on.
Scales of MeasurementScales of Measurement
NominalNominal

8 8 Slide
Slide
© 2006 Thomson/South-Western© 2006 Thomson/South-Western
Scales of MeasurementScales of Measurement
Ordinal = rank categories in order, but Ordinal = rank categories in order, but no meaningful distanceno meaningful distance
A A nonnumeric labelnonnumeric label or or numeric codenumeric code may may be used.be used. A A nonnumeric labelnonnumeric label or or numeric codenumeric code may may be used.be used.
The data have the properties of nominal data The data have the properties of nominal data And And order or rank of the data is meaningfulorder or rank of the data is meaningful.. The data have the properties of nominal data The data have the properties of nominal data And And order or rank of the data is meaningfulorder or rank of the data is meaningful..

9 9 Slide
Slide
© 2006 Thomson/South-Western© 2006 Thomson/South-Western
Scales of MeasurementScales of Measurement
OrdinalOrdinal
Example:Example: Students of a university are classified by theirStudents of a university are classified by their class standingclass standing using a nonnumeric label such as using a nonnumeric label such as Freshman, Sophomore, Junior, or Senior.Freshman, Sophomore, Junior, or Senior.
Example:Example: Students of a university are classified by theirStudents of a university are classified by their class standingclass standing using a nonnumeric label such as using a nonnumeric label such as Freshman, Sophomore, Junior, or Senior.Freshman, Sophomore, Junior, or Senior.

10 10 Slide
Slide
© 2006 Thomson/South-Western© 2006 Thomson/South-Western
Scales of MeasurementScales of Measurement
Interval = equal distance between Interval = equal distance between scores; numericalscores; numerical
Interval data are Interval data are always numericalways numeric.. Interval data are Interval data are always numericalways numeric..
The data have the properties of ordinal data,The data have the properties of ordinal data, and the interval between observations is and the interval between observations is a fixed unit of measure.a fixed unit of measure.
The data have the properties of ordinal data,The data have the properties of ordinal data, and the interval between observations is and the interval between observations is a fixed unit of measure.a fixed unit of measure.

11 11 Slide
Slide
© 2006 Thomson/South-Western© 2006 Thomson/South-Western
Scales of MeasurementScales of Measurement
IntervalInterval
Example:Example: Melissa has an Melissa has an SAT scoreSAT score of 1205, while Kevin of 1205, while Kevin has an SAT score of 1090. Melissa scored 115has an SAT score of 1090. Melissa scored 115 points more than Kevin.points more than Kevin.
Example:Example: Melissa has an Melissa has an SAT scoreSAT score of 1205, while Kevin of 1205, while Kevin has an SAT score of 1090. Melissa scored 115has an SAT score of 1090. Melissa scored 115 points more than Kevin.points more than Kevin.

12 12 Slide
Slide
© 2006 Thomson/South-Western© 2006 Thomson/South-Western
Scales of MeasurementScales of Measurement
Ratio = equal distance, meaningful zeroRatio = equal distance, meaningful zero
The data have all the properties of interval The data have all the properties of interval data and the data and the ratio of two values is meaningfulratio of two values is meaningful.. The data have all the properties of interval The data have all the properties of interval data and the data and the ratio of two values is meaningfulratio of two values is meaningful..
Distance, height, weight, and timeDistance, height, weight, and time use the ratio scale.use the ratio scale.
Distance, height, weight, and timeDistance, height, weight, and time use the ratio scale.use the ratio scale.
This This scale must contain a zero valuescale must contain a zero value for for which nothing exists for the variablewhich nothing exists for the variable This This scale must contain a zero valuescale must contain a zero value for for which nothing exists for the variablewhich nothing exists for the variable

13 13 Slide
Slide
© 2006 Thomson/South-Western© 2006 Thomson/South-Western
Scales of MeasurementScales of Measurement
RatioRatio
Example:Example: Melissa’s college record shows 36 Melissa’s college record shows 36 credit hourscredit hours earned, while Kevin’s record shows 72 credit earned, while Kevin’s record shows 72 credit hours earned. Kevin has twice as many credithours earned. Kevin has twice as many credit hours earned as Melissa.hours earned as Melissa.
Example:Example: Melissa’s college record shows 36 Melissa’s college record shows 36 credit hourscredit hours earned, while Kevin’s record shows 72 credit earned, while Kevin’s record shows 72 credit hours earned. Kevin has twice as many credithours earned. Kevin has twice as many credit hours earned as Melissa.hours earned as Melissa.

14 14 Slide
Slide
© 2006 Thomson/South-Western© 2006 Thomson/South-Western
Qualitative DataQualitative Data
Labels or namesLabels or names used to identify an attribute of each used to identify an attribute of each elementelement Labels or namesLabels or names used to identify an attribute of each used to identify an attribute of each elementelement
Often referred to as Often referred to as categorical datacategorical data Often referred to as Often referred to as categorical datacategorical data
Use either the nominal or ordinal scale ofUse either the nominal or ordinal scale of measurementmeasurement Use either the nominal or ordinal scale ofUse either the nominal or ordinal scale of measurementmeasurement
Can be either numeric or nonnumericCan be either numeric or nonnumeric Can be either numeric or nonnumericCan be either numeric or nonnumeric
Appropriate statistical analyses are rather limitedAppropriate statistical analyses are rather limited Appropriate statistical analyses are rather limitedAppropriate statistical analyses are rather limited

15 15 Slide
Slide
© 2006 Thomson/South-Western© 2006 Thomson/South-Western
Quantitative DataQuantitative Data
Quantitative data indicate Quantitative data indicate how many or how much:how many or how much: Quantitative data indicate Quantitative data indicate how many or how much:how many or how much:
discretediscrete, if measuring how many, if measuring how many discretediscrete, if measuring how many, if measuring how many
continuouscontinuous, if measuring how much, if measuring how much continuouscontinuous, if measuring how much, if measuring how much
Quantitative data are Quantitative data are always numericalways numeric.. Quantitative data are Quantitative data are always numericalways numeric..
Ordinary arithmetic operations are meaningful forOrdinary arithmetic operations are meaningful for quantitative data.quantitative data. Ordinary arithmetic operations are meaningful forOrdinary arithmetic operations are meaningful for quantitative data.quantitative data.

16 16 Slide
Slide
© 2006 Thomson/South-Western© 2006 Thomson/South-Western
Scales of MeasurementScales of Measurement
QualitativeQualitativeQualitativeQualitative QuantitativQuantitativee
QuantitativQuantitativee
NumericalNumericalNumericalNumerical NumericalNumericalNumericalNumericalNonnumericalNonnumericalNonnumericalNonnumerical
DataDataDataData
NominaNominallNominaNominall
OrdinaOrdinallOrdinaOrdinall
NominalNominalNominalNominal OrdinalOrdinalOrdinalOrdinal IntervalIntervalIntervalInterval RatioRatioRatioRatio

17 17 Slide
Slide
© 2006 Thomson/South-Western© 2006 Thomson/South-Western
Descriptive StatisticsDescriptive Statistics
Descriptive statisticsDescriptive statistics are the tabular, are the tabular, graphical, and numerical methods used graphical, and numerical methods used to to summarizesummarize data. data.

18 18 Slide
Slide
© 2006 Thomson/South-Western© 2006 Thomson/South-Western
Example: Hudson Auto RepairExample: Hudson Auto Repair
The manager of Hudson AutoThe manager of Hudson Auto
would like to have a betterwould like to have a better
understanding of the costunderstanding of the cost
of parts used in the engineof parts used in the engine
tune-ups performed in thetune-ups performed in the
shop. She examines 50shop. She examines 50
customer invoices for tune-ups. The costs of customer invoices for tune-ups. The costs of parts,parts,
rounded to the nearest dollar, are listed on the rounded to the nearest dollar, are listed on the nextnext
slide.slide.

19 19 Slide
Slide
© 2006 Thomson/South-Western© 2006 Thomson/South-Western
91 78 93 57 75 52 99 80 97 6271 69 72 89 66 75 79 75 72 76104 74 62 68 97 105 77 65 80 10985 97 88 68 83 68 71 69 67 7462 82 98 101 79 105 79 69 62 73
91 78 93 57 75 52 99 80 97 6271 69 72 89 66 75 79 75 72 76104 74 62 68 97 105 77 65 80 10985 97 88 68 83 68 71 69 67 7462 82 98 101 79 105 79 69 62 73
Example: Hudson Auto RepairExample: Hudson Auto Repair
Sample of Parts Cost for 50 Tune-upsSample of Parts Cost for 50 Tune-ups

20 20 Slide
Slide
© 2006 Thomson/South-Western© 2006 Thomson/South-Western
Tabular Summary:Tabular Summary: Frequency and Percent Frequency Frequency and Percent Frequency
50-5950-59
60-6960-69
70-7970-79
80-8980-89
90-9990-99
100-109100-109
22
1313
1616
77
77
55
5050
44
2626
3232
1414
1414
1010
100100
(2/50)10(2/50)1000
PartsParts Cost ($)Cost ($)
PartsParts FrequencyFrequency
PercentPercentFrequencyFrequency

21 21 Slide
Slide
© 2006 Thomson/South-Western© 2006 Thomson/South-Western
Graphical Summary: HistogramGraphical Summary: Histogram
22
44
66
88
1010
1212
1414
1616
1818
PartsCost ($) PartsCost ($)
Fre
qu
en
cy
Fre
qu
en
cy
5059 6069 7079 8089 9099 100-1105059 6069 7079 8089 9099 100-110
Tune-up Parts CostTune-up Parts Cost

22 22 Slide
Slide
© 2006 Thomson/South-Western© 2006 Thomson/South-Western
Inferential StatisticsInferential Statistics
Uses samples from larger populationsUses samples from larger populations Draw conclusions from sample dataDraw conclusions from sample data Conclusions apply to whole populationConclusions apply to whole population Estimate a population valueEstimate a population value Test a hypothesisTest a hypothesis State probability of errorState probability of error