1- 1 Corporate Finance and Applications – Review of Financial Topics for Case Studies Fall 2015...
38
1- 1 Corporate Finance and Applications – Review of Financial Topics for Case Studies Fall 2015 Dr. Richard Michelfelder
-
Upload
willa-davidson -
Category
Documents
-
view
225 -
download
0
Transcript of 1- 1 Corporate Finance and Applications – Review of Financial Topics for Case Studies Fall 2015...

1- 1
Corporate Finance and Applications – Review of Financial Topics for Case
Studies
Fall 2015
Dr. Richard Michelfelder
1- 2
Course Outline - Topics
1. Introductions to Financial Statements2. Business Financial Planning & Forecasting3. Risk, Returns and Cost of Capital 4. Project Investment Decision-making5. Stock and Bond Valuation6. Capital Structure7. Dividend Policy8. Mergers & Acquisitions
1- 3Outline 1 Introduction to Financial Statements
1.1 The Balance Sheet1.2 The Income Statement1.3 The Statement of Cash Flows1.4 Accounting Practice1.5 Income Taxes1.6 Financial Ratios1.7 DuPont Equations1.8 Using Financial Ratios1.9 Measuring Company Performance1.10 The Role of Financial Ratios

1- 4
The Balance Sheet
Definition
Financial statements that show the value of the firm’s assets and liabilities at a particular point in
time (from an historic cost accounting, not market value
perspective).
1- 5
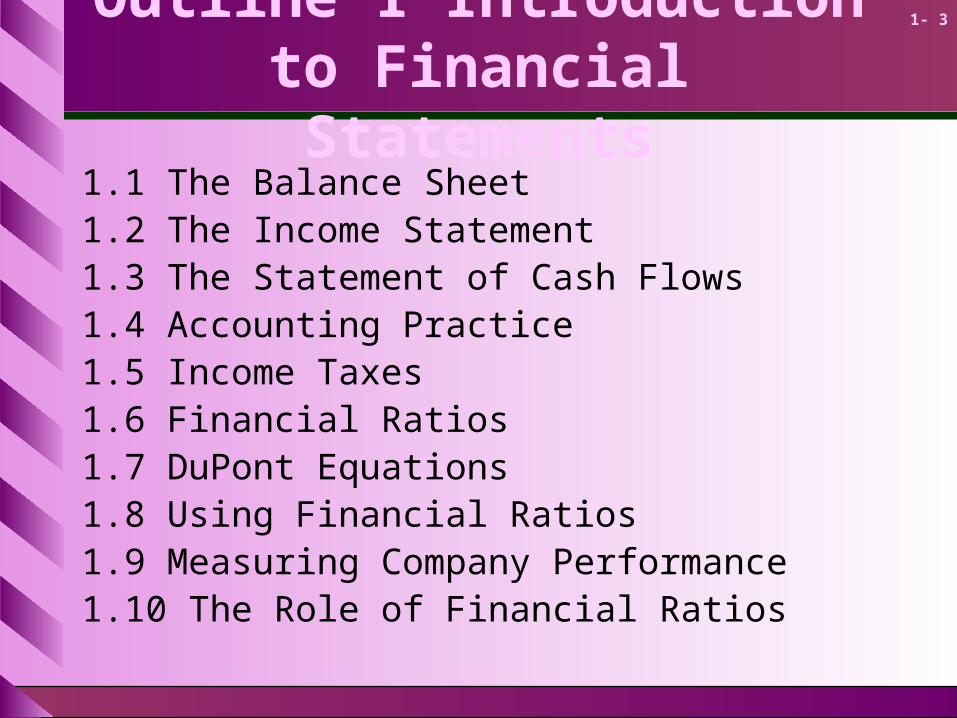
The Balance Sheet
The Main Balance Sheet Items
Current AssetsCash & SecuritiesReceivablesInventories
+
Fixed AssetsTangible AssetsIntangible Assets
Current LiabilitiesPayablesShort-term Debt
+
Long-term Liabilities
+
Shareholders’ Equity
=

1- 6
The Balance Sheet
Shareholder’s Equity = Total Assets – Total LiabilitiesShareholders’ Equity: consists of paid
in investment capital plus retain earnings
- may be greater or less than market value of equity- for comparison look at Market-to-Book ratio:
- Stock Market Price (P) /Shareholder’s Equity (B) or P/B ratio
Shareholders’ Equity = Total Assets – Total Liabilities
1- 7
Market Value vs. Book Value
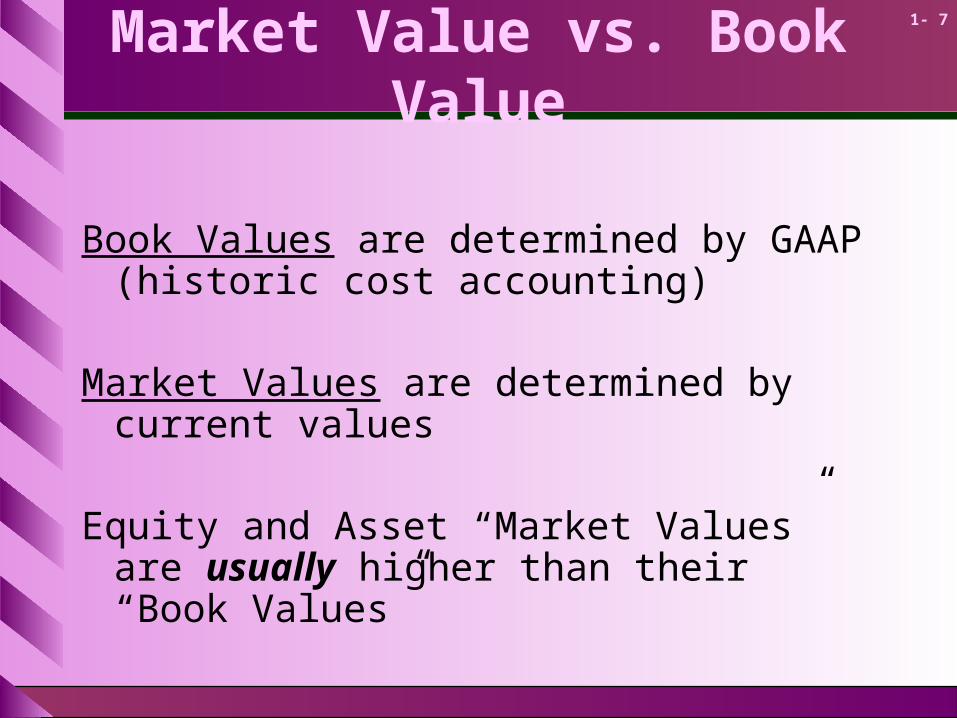
Book Values are determined by GAAP (historic cost accounting)
Market Values are determined by current values
Equity and Asset “Market Values” are usually higher than their “Book Values”
1- 8
Market Value vs. Book Value
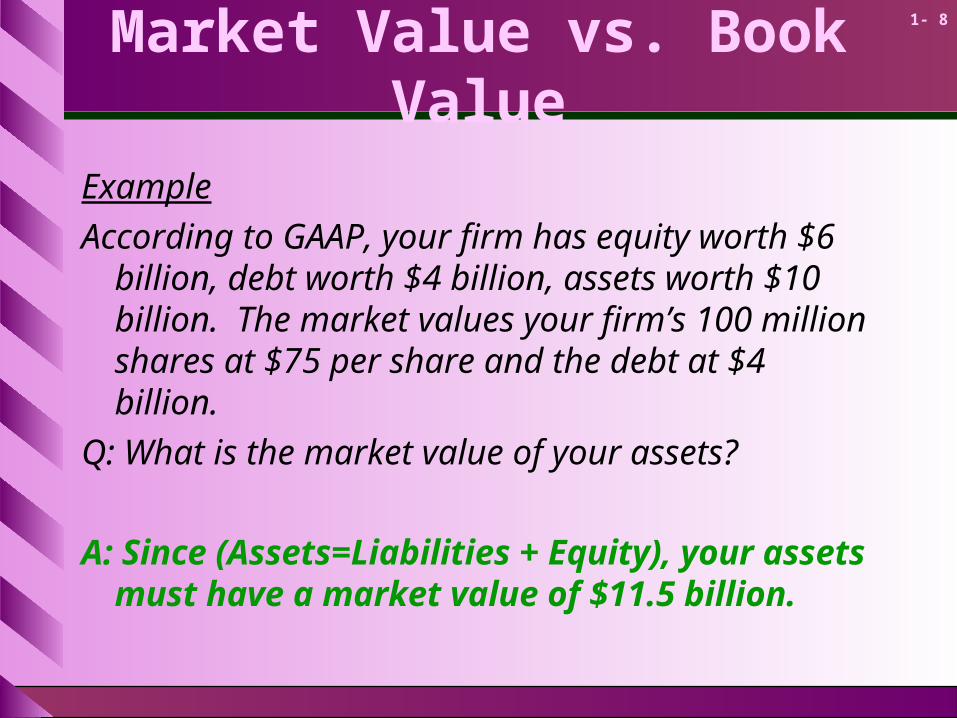
Example
According to GAAP, your firm has equity worth $6 billion, debt worth $4 billion, assets worth $10 billion. The market values your firm’s 100 million shares at $75 per share and the debt at $4 billion.
Q: What is the market value of your assets?
A: Since (Assets=Liabilities + Equity), your assets must have a market value of $11.5 billion.
1- 9
Market Value vs. Book Value
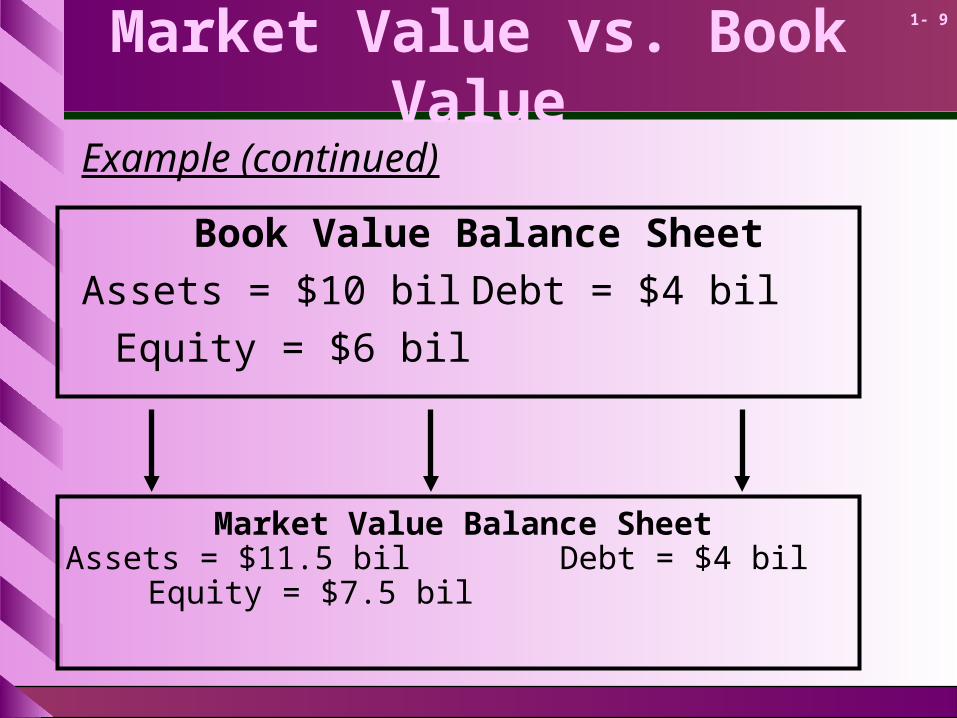
Example (continued)
Book Value Balance Sheet
Assets = $10 bil Debt = $4 bil
Equity = $6 bil
Market Value Balance SheetAssets = $11.5 bil Debt = $4 bil
Equity = $7.5 bil

1- 10
Market and Book Value
Review Market to Book Value for S&P 500 Market Trends
1- 11
The Income Statement
Definition
Financial statement that shows the revenues, expenses, and net income of a firm over a period
of time.

1- 12
The Income Statement
Earnings Before Income & Taxes, Depreciation & Amortization (EBITDA)
Measure of profit less subject to “financial engineering” as EBITDA is gross of interest, taxes, depreciation & amortization.

1- 13
The Income StatementPepsico Income Statement 2012 2011
Net Sales $65,492 $66,504Cost of Goods Sold 31,291 31,593Other Expenses (Dep. Intang.) 119 133Selling, Gen. &Adm. expenses 22,281 22,408Depreciation expense 2,689 2,737Operating Profit 9,112 9,633Other Income 91 57Earnings Before Interest & Taxes 9,203 9,690Net Interest Expense (899) (856)Taxable Income 8,304 8,834Income Taxes 2,090 2,372Net Income 6,214 6,462
1- 14
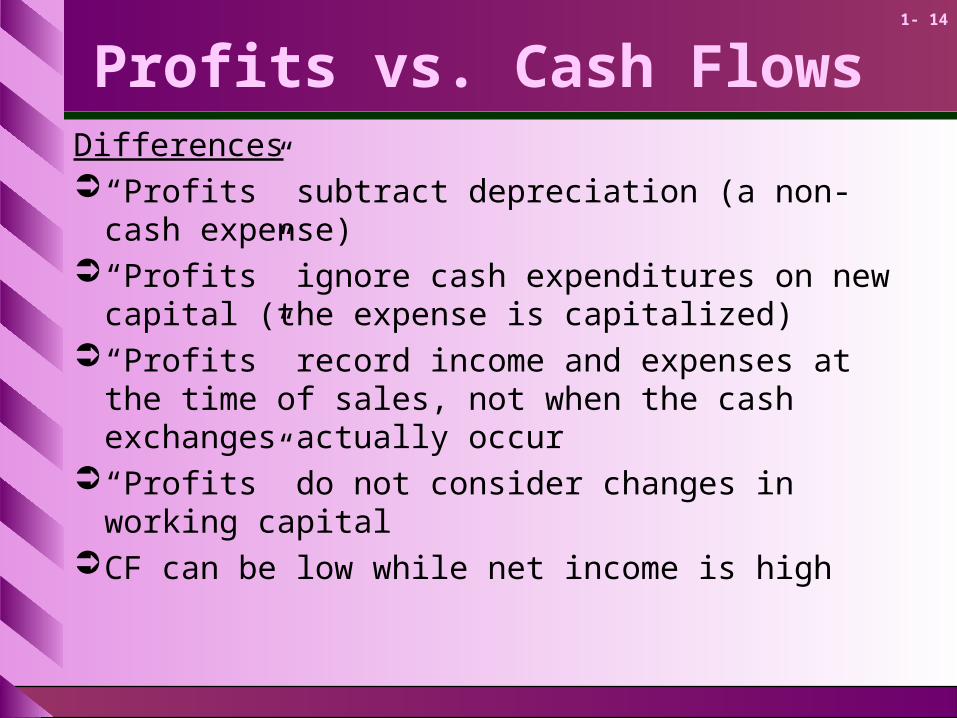
Profits vs. Cash FlowsDifferences“Profits” subtract depreciation (a non-cash expense)“Profits” ignore cash expenditures on new capital
(the expense is capitalized)“Profits” record income and expenses at the time of
sales, not when the cash exchanges actually occur“Profits” do not consider changes in working capitalCF can be low while net income is high

1- 15
The Statement of Cash Flows
Definition Financial statement that shows the firm’s cash receipts and cash payments over a period of time.
CF = Cash Inflow – Cash Outflow
1- 16
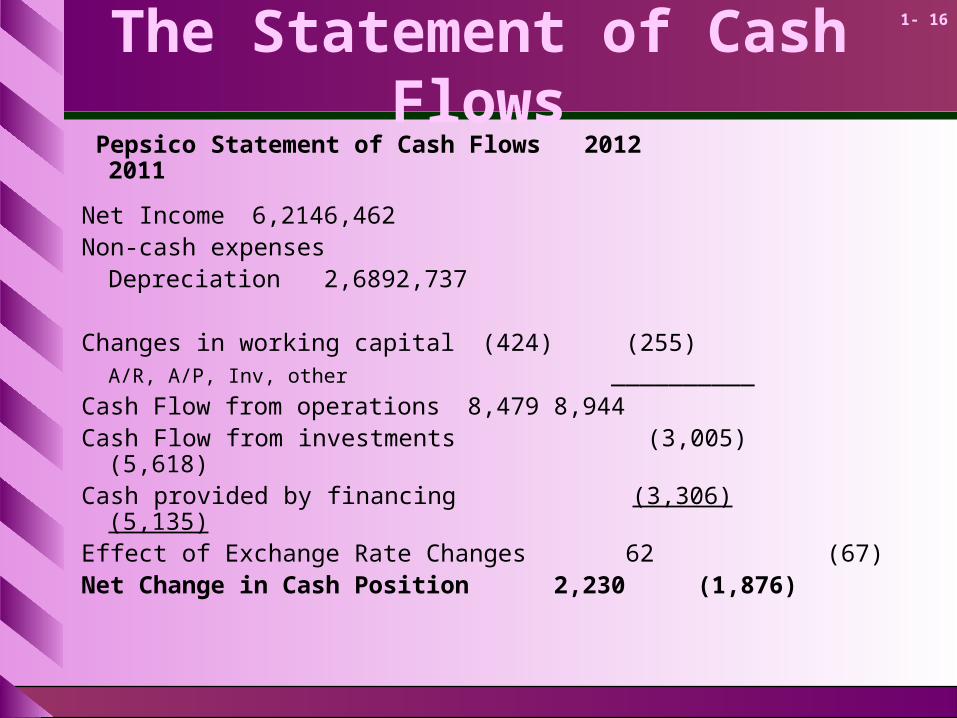
The Statement of Cash Flows Pepsico Statement of Cash Flows 2012 2011
Net Income 6,214 6,462Non-cash expenses
Depreciation 2,689 2,737
Changes in working capital (424) (255)A/R, A/P, Inv, other _____ _____
Cash Flow from operations 8,479 8,944Cash Flow from investments (3,005) (5,618)Cash provided by financing (3,306) (5,135)Effect of Exchange Rate Changes 62 (67)Net Change in Cash Position 2,230 (1,876)

1- 17
Accounting Practice
There are many accounting issues subject to subjective judgment. A few examples are:Revenue recognitionOff-balance-sheet financing
• Operating v. capital leases
Expensing v. capitalizing an “expenditure”

1- 18
Income Taxes
Taxes have a major impact on financial decisions
Marginal Tax Rate is the tax that the individual pays on each extra dollar of income.
Average Tax Rate is the total tax bill divided by total income.

1- 19
Income TaxesExample - Taxes and Cash Flows can be changed by
the use of debt. Firm A pays part of its profits as debt interest. Firm B does not.
Firm A Firm BEBIT 100 100Interest 40 0Pretax Income 60 100Taxes (35%) 21 35Net Income 39 65
Example - Taxes and Cash Flows can be changed by the use of debt. Firm A pays part of its profits as debt interest. Firm B does not.
Firm AEBIT 100Interest 40Pretax Income 60Taxes (35%) 21 Net Income 39

1- 20
Income Taxes
If you were both the debt and equity holders of the firm, which would generate more cash flow to you? (assume Net Income = Cash Flow)
Firm A Firm B
EBIT 100 100
Interest 40 0
Pretax Income 60 100
Taxes (35%) 21 35
Net Income 39 65
?
1- 21
Income Taxes
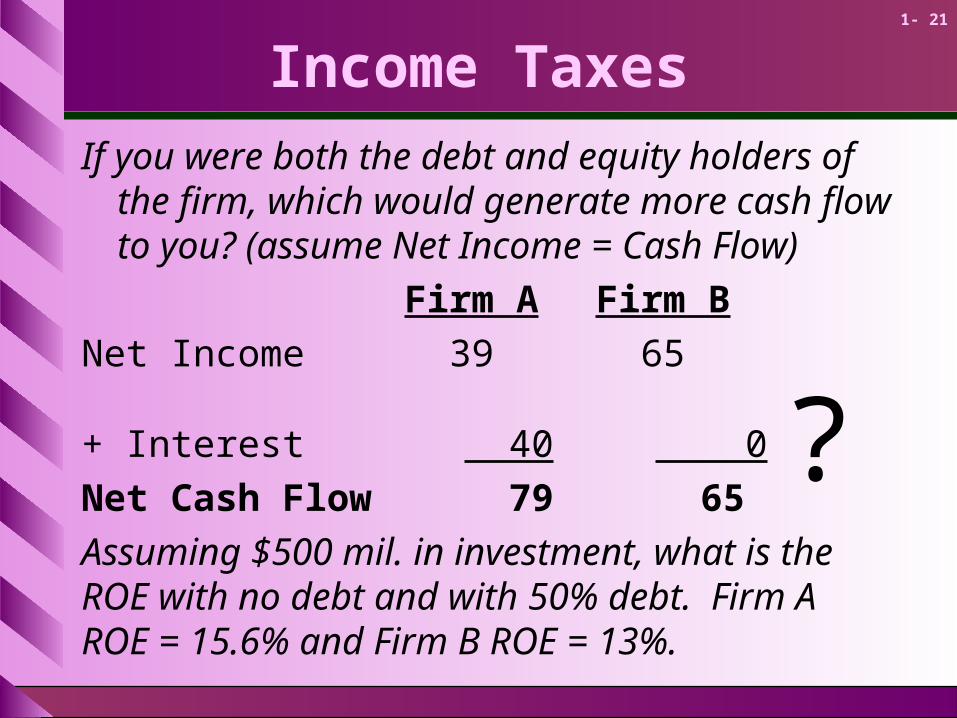
If you were both the debt and equity holders of the firm, which would generate more cash flow to you? (assume Net Income = Cash Flow)
Firm A Firm B
Net Income 39 65
+ Interest 40 0
Net Cash Flow 79 65
Assuming $500 mil. in investment, what is the ROE with no debt and with 50% debt. Firm A ROE = 15.6% and Firm B ROE = 13%.
?

1- 22Financial Ratios (Financial Statement Analysis)
Five General Categories:Valuation
• Value of firm or specific assets
Leverage• Measures use of debt and associated fixed expenses
Liquidity• Measures firm’s access to cash
Profitability• Measures return on investments
Efficiency• Productivity of the use of firm’s assets
1- 23
Leverage Ratios
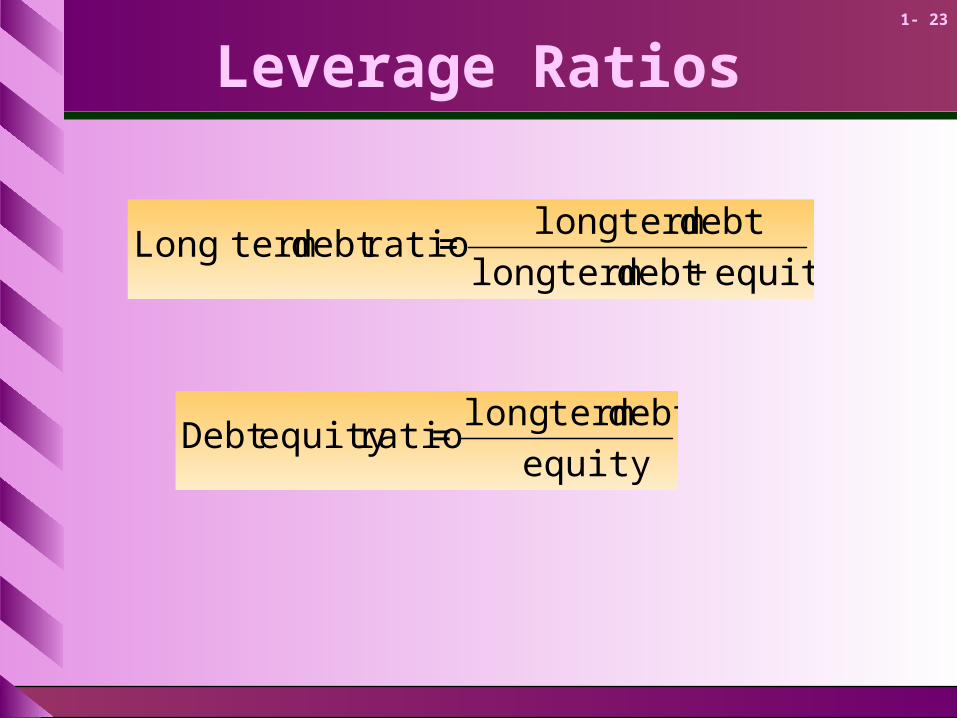
equity+debt termlong
debt termlong=ratiodebt termLong
equity
debt termlong=ratioequity Debt

1- 24
Leverage Ratios
Total debt ratio =total liabilities
total assets
Times interest earned =EBIT
interest payments
Cash coverage ratio =EBIT + depreciation
interest payments
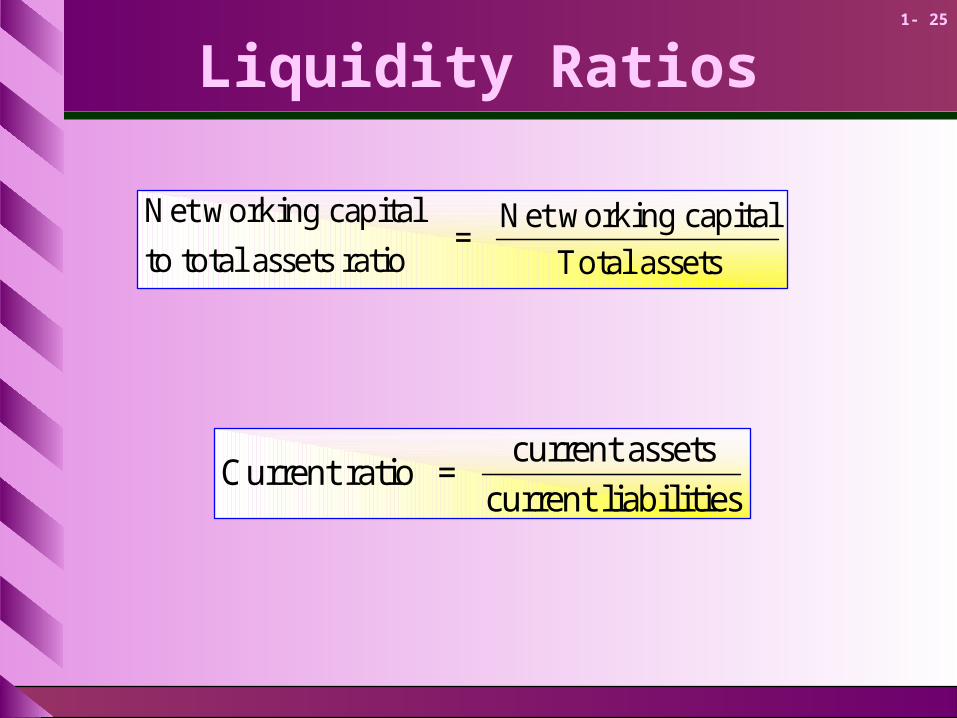
1- 25
Liquidity Ratios
Net working capital
to total assets ratio=
Net working capital
Total assets
Current ratio =current assets
current liabilities
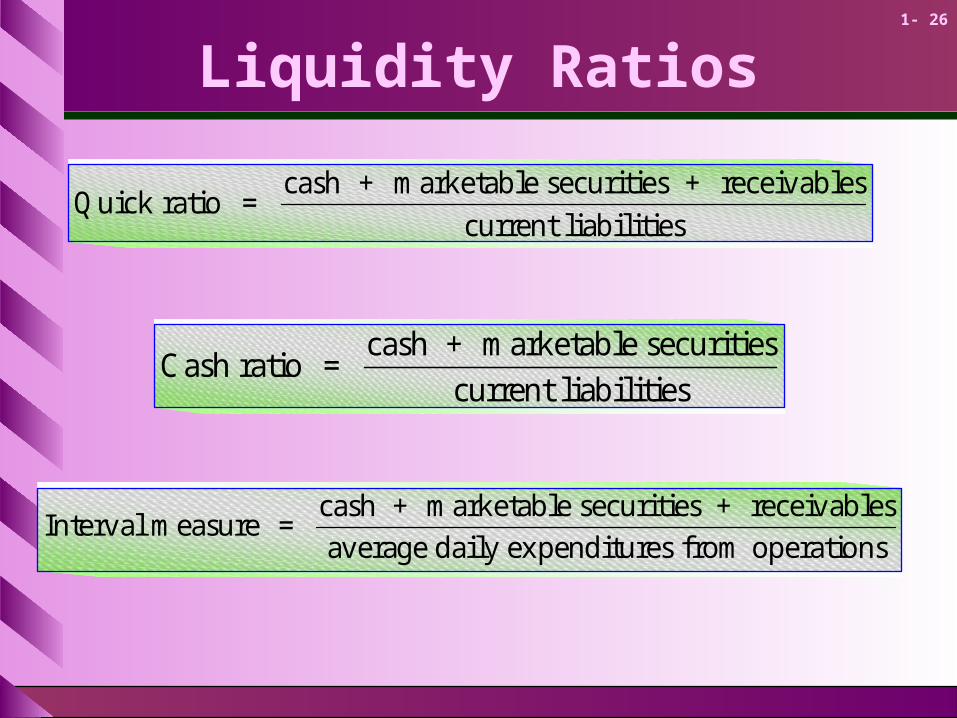
1- 26
Liquidity Ratios
Cash ratio =cash + marketable securities
current liabilities
Quick ratio =cash + marketable securities + receivables
current liabilities
Interval measure =cash + marketable securities + receivables
average daily expenditures from operations
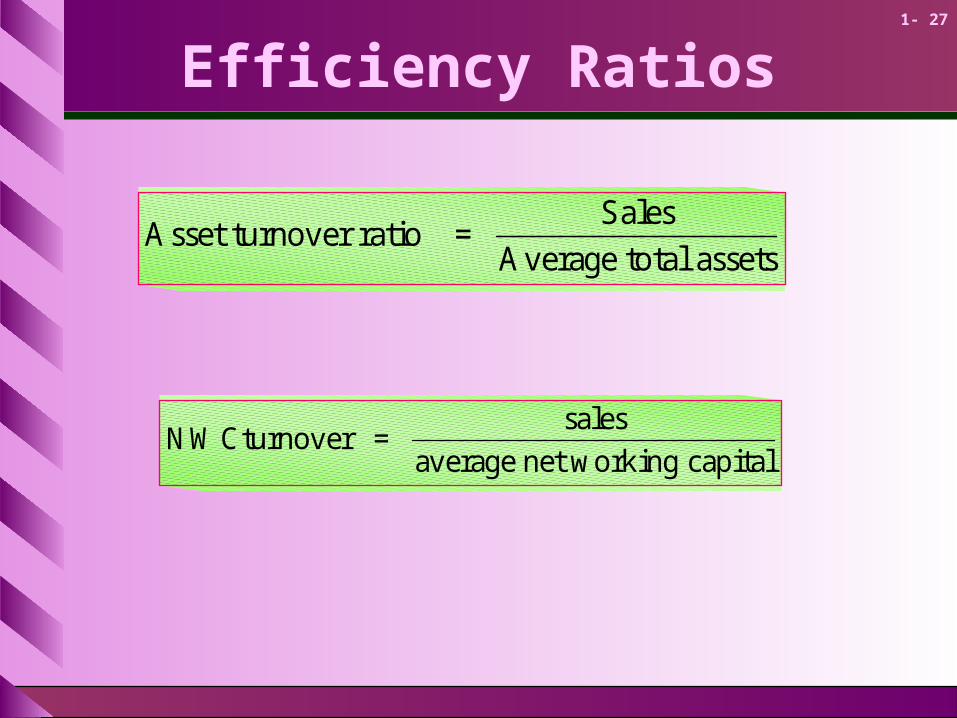
1- 27
Efficiency Ratios
Asset turnover ratio =Sales
Average total assets
NW Cturnover =sales
average net working capital
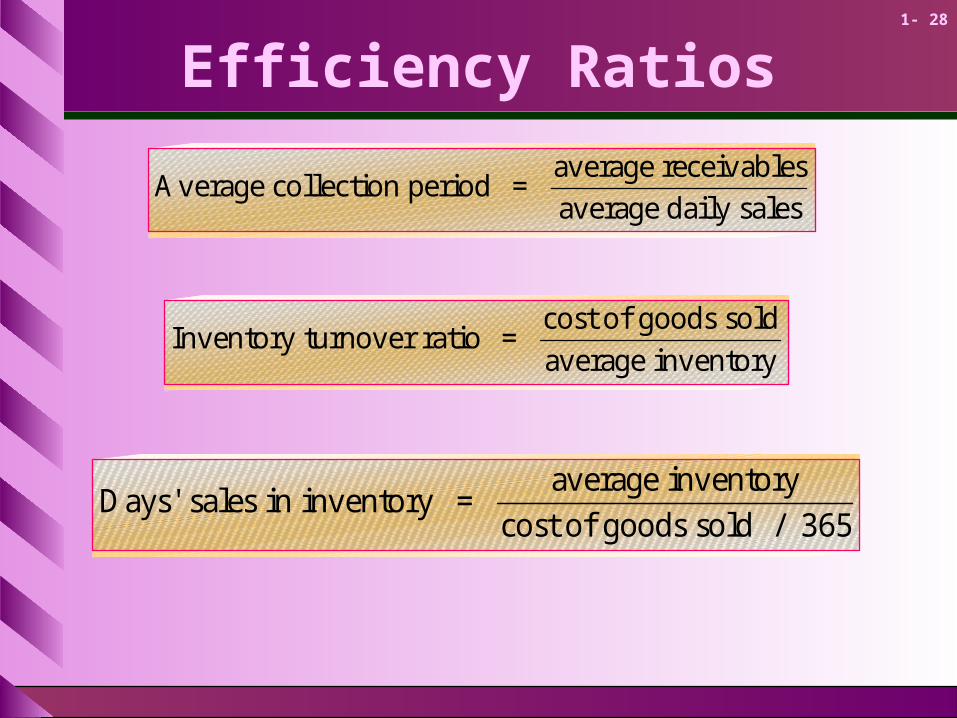
1- 28
Efficiency Ratios
Days' sales in inventory =average inventory
cost of goods sold / 365
Inventory turnover ratio =cost of goods sold
average inventory
Average collection period =average receivables
average daily sales

1- 29
Profitability Ratios
assets totalaverage
Interest IncomeNet =assetson Return
sales
incomenet =marginprofit Net
equity average
incomenet =equityon Return
sales
interest incomenet =marginprofit Operating

1- 30
Profitability Ratios
Plowback ratio =earnings - dividends
earnings
= 1 - payout ratio
Payout ratio =dividends
earnings
ROE*earnings
dividends-earnings=plowback fromequity in Growth

1- 31
Market Value Ratios
g-r
1
EPS avg
P=ratio PE Forecasted
1
1
1
0 xEPS
Div
PE Ratio =stock price
earnings per share
Dividend yield =dividend per share
stock price

1- 32
Market Value Ratios
Market to book ratio =stock price
book value per share
Price per share = P =Div
r - g01
Tobins Q =market value of assets
estimated replcement cost

1- 33
The DuPont Equations
A breakdown of ROE and ROA into component ratios
equity
stock commonfor available earnings=ROE
assets
interest IncomeNet =ROA

1- 34
The DuPont Equations
sales
interestIncomeNet x
assets
sales=ROA
assetturnover
Operating profitmargin

1- 35
The DuPont Equations
interestIncomeNet
IncomeNet x
sales
interestIncomeNet x
assets
salesx
equity
assets=ROE
leverageratio
assetturnover
Operating profitmargin
debtburden
1- 36
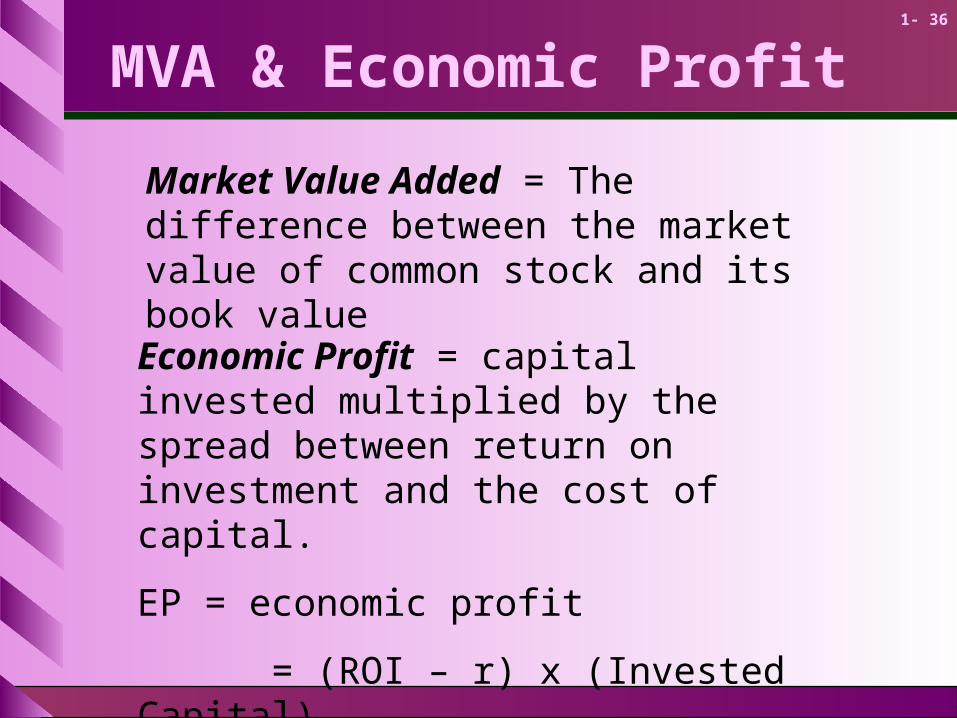
MVA & Economic Profit
Economic Profit = capital invested multiplied by the spread between return on investment and the cost of capital.
EP = economic profit
= (ROI – r) x (Invested Capital)
Market Value Added = The difference between the market value of common stock and its book value

1- 37
Residual Income & EVA
Residual Income or EVA = Net Dollar return after deducting the cost of capital
EVA = Residual Income
= Income Earned - Income Required
= Income Earned – [cost of capital x invested capital]
© EVA is copyrighted by Stern-Stewart Consulting Firm and used with permission.

1- 38
Measuring Performance
Measures of Company Performance (ranked by MVA)Market to book ratio
MVA ($bil)
Return on assets (%)
EVA ($bil)
GE 6.6 426.6 20.4 5.9Microsoft 8.8 217.2 39.1 5.9Wal-Mart Stores 4.4 206.2 12.8 1.6Merck & Co. 7.1 203.7 24.0 4.8Phillip Morris 2.1 72.0 17.4 6.1ExonMobil 1.9 155.9 10.5 5.4Viacom 1.3 22.6 2.0 -4.4General Motors 0.7 -29.2 5.7 -1.1WorldCom 0.7 -31.8 6.3 -5.4AT&T 0.6 -87.2 4.5 -10.0


![Hot Topics in Parallel Computing - Vuducvuduc.org/teaching/cse8803-hpc-fa10/01--intro--posted.pdf · Hot Topics in Parallel Computing Prof. Richard (Rich) Vuduc CSE 8803-HPC [01]](https://static.fdocuments.us/doc/165x107/5f66c3da7fe9de2fc916552a/hot-topics-in-parallel-computing-hot-topics-in-parallel-computing-prof-richard.jpg)