0'N Veracruz- Llave Caym an Q uintana Is lands Oil-Spill ...
64
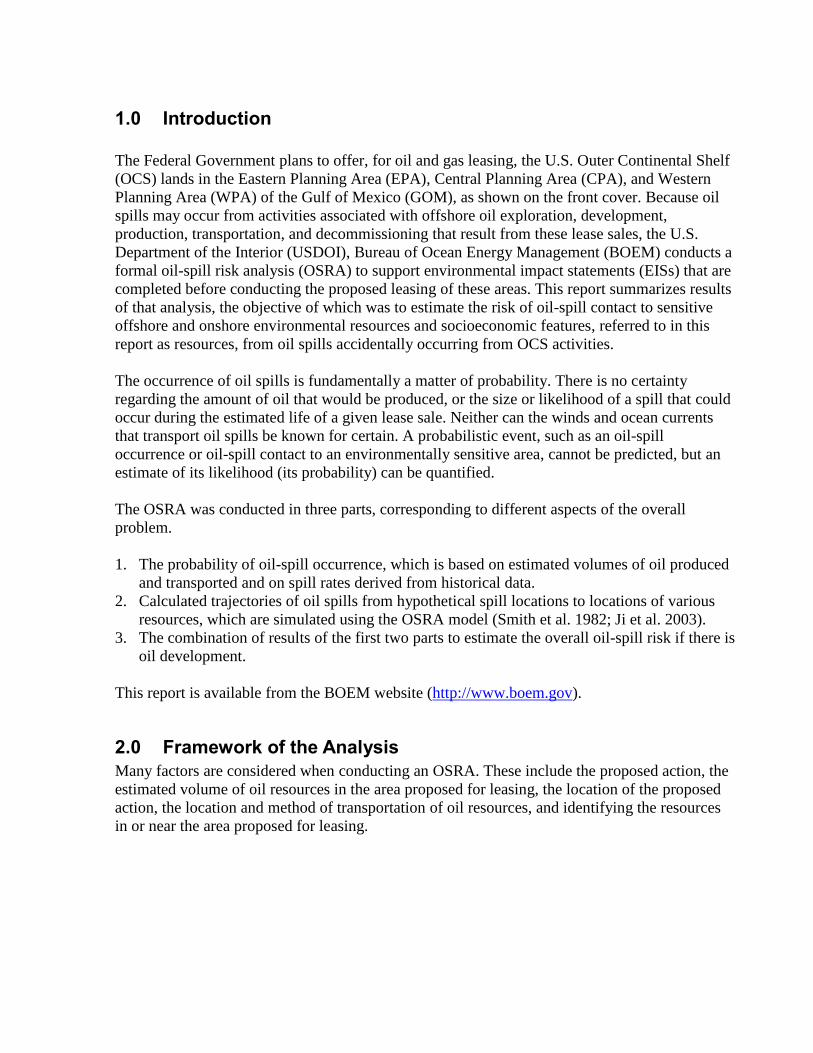
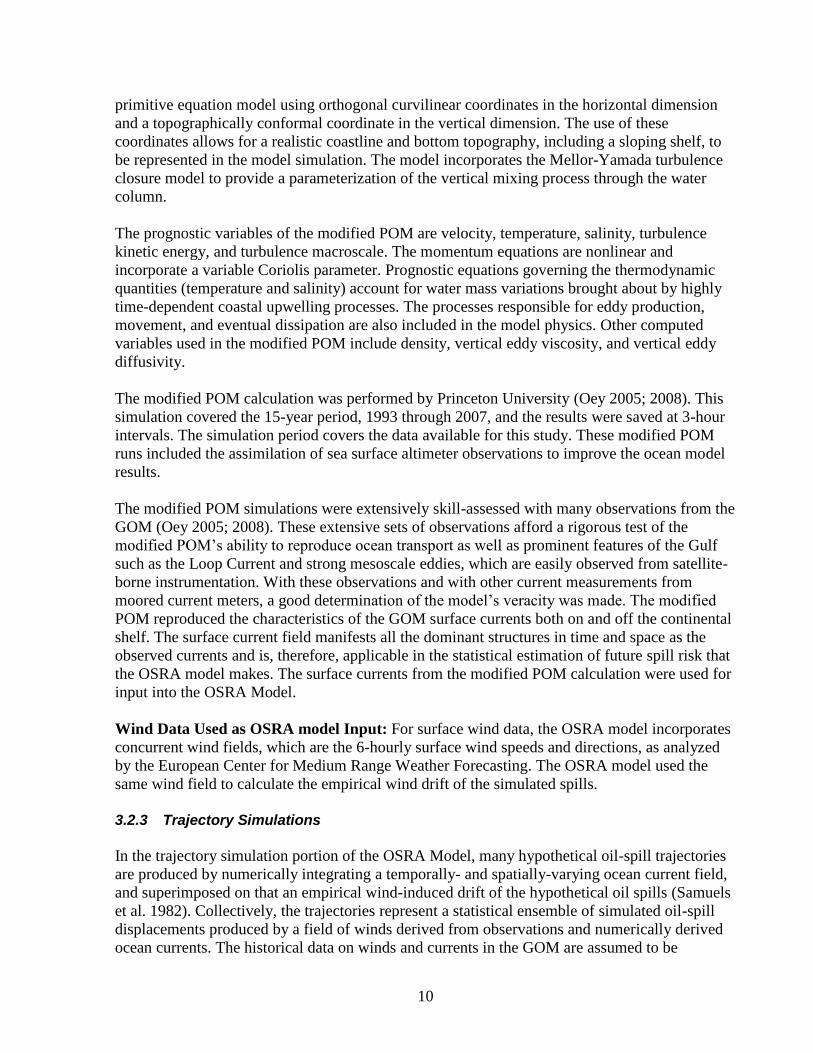
______________ OCS Report BOEM 2017-010 U.S. Department of the Interior Bureau of Ocean Energy Management Division of Environmental Sciences Sterling, VA Oil-Spill Risk Analysis Gulf of Mexico Outer Continental Shelf (OCS) Lease Sales, Eastern Planning Area, Central Planning Area, and Western Planning Area, 2017–2022, and Gulf-wide OCS Program, 2017–2086 Zhen-Gang Ji Walter R. Johnson Christopher M. DuFore January 2017 Eastern Planning Area Central Planning Area Western Planning Area 77°0'W 78°0'W 79°0'W 80°0'W 81°0'W 82°0'W 83°0'W 84°0'W 85°0'W 86°0'W 87°0'W 88°0'W 89°0'W 90°0'W 91°0'W 92°0'W 93°0'W 94°0'W 95°0'W 96°0'W 97°0'W 98°0'W 99°0'W 32°0'N 31°0'N 30°0'N 29°0'N 28°0'N 27°0'N 26°0'N 25°0'N 24°0'N 23°0'N 22°0'N 21°0'N 20°0'N 19°0'N 18°0'N 17°0'N 0 150 300Kilometers 0 150 300Miles Domain Boundary Texas Louisiana Mississippi Alabama Florida Cuba Jamaica Cayman Islands Bahamas Belize Tabasco Campeche Yucatan Quintana Roo Veracruz- Llave Tamaulipas
Transcript of 0'N Veracruz- Llave Caym an Q uintana Is lands Oil-Spill ...

______________ OCS Report
BOEM 2017-010
U.S. Department of the Interior Bureau of Ocean Energy Management Division of Environmental Sciences Sterling, VA
Oil-Spill Risk Analysis
Gulf of Mexico Outer Continental Shelf (OCS) Lease Sales, Eastern Planning Area, Central Planning Area, and Western Planning Area, 2017–2022, and Gulf-wide OCS Program, 2017–2086
Zhen-Gang Ji Walter R. Johnson Christopher M. DuFore
January 2017
Eastern PlanningArea
Central PlanningArea
Western PlanningArea
77°0'W78°0'W79°0'W80°0'W81°0'W82°0'W83°0'W84°0'W85°0'W86°0'W87°0'W88°0'W89°0'W90°0'W91°0'W92°0'W93°0'W94°0'W95°0'W96°0'W97°0'W98°0'W99°0'W
32°0'N
31°0'N
30°0'N
29°0'N
28°0'N
27°0'N
26°0'N
25°0'N
24°0'N
23°0'N
22°0'N
21°0'N
20°0'N
19°0'N
18°0'N
17°0'N
0 150 300Kilometers
0 150 300 Miles
Domain Boundary
Texas
Louisiana
Mississippi Alabama
Florida
Cuba
Jamaica
CaymanIslands
Bahamas
Belize
TabascoCampeche
Yucatan
QuintanaRoo
Veracruz-Llave
Tamaulipas

OCS Report BOEM 2017-010
U.S. Department of the Interior Bureau of Ocean Energy Management Division of Environmental Sciences
Sterling, VA January 2017
Oil-Spill Risk Analysis
Gulf of Mexico Outer Continental Shelf (OCS) Lease Sales, Eastern Planning Area, Central Planning Area, and Western Planning Area, 2017–2022, and Gulf-wide OCS Program, 2017–2086 Authors: Zhen-Gang Ji Walter R. Johnson Christopher M. DuFore


iv
Contents
List of Tables .............................................................................................................................. v
List of Figures .............................................................................................................................vi
Abbreviations and Acronyms ..................................................................................................... vii
1.0 Introduction ..................................................................................................................... 1
2.0 Framework of the Analysis .............................................................................................. 1
2.1 The Proposed Actions and the OCS Program ............................................................. 2
2.2 Estimated Volume of Oil Resources ............................................................................ 2
2.3 Location of the Proposed Action (Compared with Domain and Study Areas) .............. 4
2.4 Resources Considered in the Analysis ........................................................................ 4
3.0 Oil-Spill Risk Analysis ..................................................................................................... 5
3.1 Probability of Oil Spills Occurring ................................................................................ 6
3.2 Oil-Spill Trajectory Simulations ................................................................................... 8
3.2.1 Hypothetical Spill Locations and Timing ................................................................................. 8
3.2.2 Ocean Current Data and Wind Simulations as Inputs to OSRA ............................................. 9
3.2.3 Trajectory Simulations ........................................................................................................... 10
3.2.4 Spill-Resource Contact Probabilities ..................................................................................... 11
3.2.5 Factors Not Considered in the OSRA Model ........................................................................ 12
3.3 Conditional Probabilities of Contact ........................................................................... 12
3.4 Combined Probabilities of Contact ............................................................................ 13
4.0 Discussion .................................................................................................................... 14
5.0 References ................................................................................................................... 15
Appendix A. Oil-Spill Risk Analysis Tables ............................................................................ 18
Appendix B. Oil-Spill Risk Analysis Figures ........................................................................... 45

v
List of Tables
Table 1. ... Projected Oil Production for the OCS Program and for a Typical Proposed Lease Sale ................................................................................................................................................... 3
Table 2. Oil Spill Rates ......................................................................................................... 7
Table A-1. ..... Oil-spill occurrence probability estimates for offshore spills ≥1,000 barrels resulting from each alternative (2017–2066) and the cumulative OCS oil and gas program (2017–2086). ................................................................................................................................................. 19
Table A-2. ... Oil-spill occurrence probability estimates for offshore spills ≥10,000 barrels resulting from each alternative (2017–2066) and the cumulative OCS oil and gas program (2017–2086). ................................................................................................................................................. 20
Table A-3. Probabilities (expressed as percent chance) of one or more offshore spills ≥1,000 barrels occurring and contacting certain offshore resources within 10 and 30 days for low and high oil production estimates for Alternative A. ......................................................................... 21
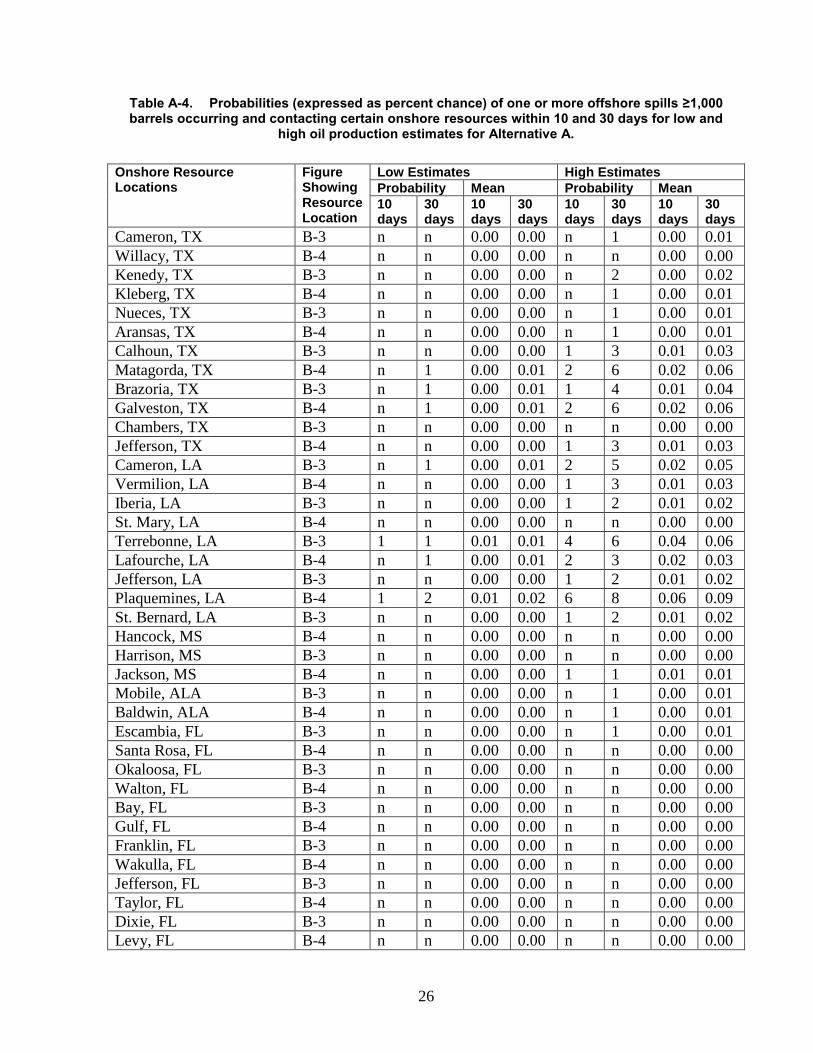
Table A-4. Probabilities (expressed as percent chance) of one or more offshore spills ≥1,000 barrels occurring and contacting certain onshore resources within 10 and 30 days for low and high oil production estimates for Alternative A. ......................................................................... 26
Table A-5. Probabilities (expressed as percent chance) of one or more offshore spills ≥1,000 barrels occurring and contacting certain offshore resource locations within 10 and 30 days for low and high oil production estimates for Alternative B. ............................................................ 29
Table A-6. Probabilities (expressed as percent chance) of one or more offshore spills ≥1,000 barrels occurring and contacting certain onshore resource locations within 10 and 30 days for low and high oil production estimates for Alternative B. ............................................................ 34
Table A-7. Probabilities (expressed as percent chance) of one or more offshore spills ≥1,000 barrels occurring and contacting certain offshore resource locations within 10 and 30 days for low and high oil production estimates for Alternative C. ............................................................ 37
Table A-8. Probabilities (expressed as percent chance) of one or more offshore spills ≥1,000 barrels occurring and contacting certain onshore resources within 10 and 30 days for low and high oil production estimates for Alternative C. ......................................................................... 42

vi
List of Figures
Figure B-1a. ....Domain, planning areas, and locations of countries and U.S. and Mexican states. ................................................................................................................................................. 46
Figure B-1b. Locations of cluster subareas for launching hypothetical spills. ......................... 47
Figure B-2. Locations of state offshore waters for Mexico, Texas, Louisiana, Mississippi, Alabama, and Florida. .............................................................................................................. 48
Figure B-3. Locations of Gulf of Mexico counties and parishes (set 1). ................................ 49
Figure B-4. Locations of Gulf of Mexico counties and parishes (set 2). ................................ 50
Figure B-10. Locations of recreational beaches. .................................................................... 51
Figure B-11. Locations of nearshore (“N”, 0–20 m), shelf (“S”, 20–300 m), and deepwater (“D”, 300 m to outer jurisdiction) seafloor polygons. .......................................................................... 52
Figure B-14. Locations of topographic features. ..................................................................... 53
Figure B-15. Locations of Habitat Areas of Particular Concern (HAPC). ................................ 54
Figure B-16. Locations of recreational dive areas in the western Gulf of Mexico. ................... 55
Figure B-17. Locations of recreational dive areas in the eastern Gulf of Mexico. ................... 56

vii
Abbreviations and Acronyms
bbl barrel= 42 U.S. gallons
Bbbl Billion barrels = 109 barrels
BOEM Bureau of Ocean Energy Management
CPA Central Planning Area
EIS Environmental Impact Statement
EPA
FPSO
Eastern Planning Area
Floating Production, Storage and Offloading
GOM Gulf of Mexico
HAPC Habitat Areas of Particular Concern
MMS Minerals Management Service
OCS Outer Continental Shelf
OSRA Oil Spill Risk Analysis
POM Princeton Ocean Model
WPA Western Planning Area
USDOI United States Department of the Interior
1.0 Introduction
The Federal Government plans to offer, for oil and gas leasing, the U.S. Outer Continental Shelf
(OCS) lands in the Eastern Planning Area (EPA), Central Planning Area (CPA), and Western
Planning Area (WPA) of the Gulf of Mexico (GOM), as shown on the front cover. Because oil
spills may occur from activities associated with offshore oil exploration, development,
production, transportation, and decommissioning that result from these lease sales, the U.S.
Department of the Interior (USDOI), Bureau of Ocean Energy Management (BOEM) conducts a
formal oil-spill risk analysis (OSRA) to support environmental impact statements (EISs) that are
completed before conducting the proposed leasing of these areas. This report summarizes results
of that analysis, the objective of which was to estimate the risk of oil-spill contact to sensitive
offshore and onshore environmental resources and socioeconomic features, referred to in this
report as resources, from oil spills accidentally occurring from OCS activities.
The occurrence of oil spills is fundamentally a matter of probability. There is no certainty
regarding the amount of oil that would be produced, or the size or likelihood of a spill that could
occur during the estimated life of a given lease sale. Neither can the winds and ocean currents
that transport oil spills be known for certain. A probabilistic event, such as an oil-spill
occurrence or oil-spill contact to an environmentally sensitive area, cannot be predicted, but an
estimate of its likelihood (its probability) can be quantified.
The OSRA was conducted in three parts, corresponding to different aspects of the overall
problem.
1. The probability of oil-spill occurrence, which is based on estimated volumes of oil produced
and transported and on spill rates derived from historical data.
2. Calculated trajectories of oil spills from hypothetical spill locations to locations of various
resources, which are simulated using the OSRA model (Smith et al. 1982; Ji et al. 2003).
3. The combination of results of the first two parts to estimate the overall oil-spill risk if there is
oil development.
This report is available from the BOEM website (http://www.boem.gov).
2.0 Framework of the Analysis
Many factors are considered when conducting an OSRA. These include the proposed action, the
estimated volume of oil resources in the area proposed for leasing, the location of the proposed
action, the location and method of transportation of oil resources, and identifying the resources
in or near the area proposed for leasing.

2
2.1 The Proposed Actions and the OCS Program
The proposed Federal actions addressed in this report are region-wide oil and gas lease sales
within the EPA, CPA, and WPA of the Gulf of Mexico OCS (Figure B-1). Under the “Outer
Continental Shelf Oil and Gas Leasing Program: 2017-2022 (Five-Year Program)” (USDOI-
BOEM, 2016b), ten region-wide lease sales are scheduled: one sale in 2017 and 2022, and two
sales in 2018, 2019, 2020, and 2021. The purpose of the proposed Federal actions is to offer for
lease those areas that may contain economically recoverable oil and natural gas resources. The
development scenario assumes that the oil produced in the lease areas will be transported to
shore predominantly by pipelines, with a small quantity transported by vessels including barges,
shuttle tankers and floating production, storage and offloading (FPSO) units.
The proposed action analyzed in this report is one “typical” region-wide lease sale. A set of
ranges for resource estimates and projected exploration and development activities developed for
each planning area over a 50-year analysis period (2017–2066) was used to analyze the region-
wide spill risk. The analyses of oil-spill risk for the “typical” proposed action are expected to be
“typical” of any of the other proposed region-wide lease sales scheduled in the Five-Year
Program. In other words, each of the proposed region-wide lease sales in the Five-Year Program
is expected to be within the combined ranges of resource estimates for each planning area used
for the analyzed “typical” proposed action.
In addition, an analysis of the Cumulative OCS Oil and Gas Program is performed based on
estimates representative of all anticipated production over a 70-year analysis period (2017–2086)
from proposed, existing, and future leases.
2.2 Estimated Volume of Oil Resources
For this analysis, both benefits and risks are functions of the volume of oil produced and are
mutually dependent. For example, greater volumes of produced oil are associated with greater
economic benefits, as well as greater risks. If the benefits are evaluated by assuming production
of a specific amount of oil, then the corresponding risks should be stated conditionally, such as
“the risks are…, given that the volume is…” Any statements about the likelihood of a particular
volume of oil being developed also apply to the likelihood of the corresponding benefits and
risks.
The resource estimates are presented for the following scenarios:
Proposed Action: the range of oil resources estimated to be leased, discovered, and produced
over a 50-year time period as a result of a typical lease sale, as found in the proposed Five-Year
Program for 2017-2022 (USDOI-BOEM 2016b)
OCS Program: the range of oil resources estimated to be leased, discovered, and produced as a
result of prior lease sales, the proposed actions, and future lease sales that will occur during the
life of a proposed action, which in this case is 70 years (USDOI-BOEM 2016b).
The range in oil resource projections used to develop the proposed actions and OCS Program
scenarios are based on resource and reserves estimates as presented in “2016 Assessment of
Undiscovered Technically Recoverable Oil and Gas Resources of the Nation’s Outer Continental

3
Shelf” (USDOI-BOEM 2016a). The resource estimates for the proposed actions are based on
two factors:
(1) the conditional estimates of undiscovered, unleased, conventionally recoverable oil and gas
resources in the proposed lease sale areas; and
(2) estimates of the portion or percentage of these resources assumed to be leased, discovered,
developed, and produced as a result of the proposed actions.
The estimates of undiscovered, unleased, conventionally recoverable oil and gas resources are
based on a comprehensive appraisal of the conventionally recoverable petroleum resources of
the US. Due to the inherent uncertainties associated with an assessment of undiscovered
resources, probabilistic techniques were employed, and the results were reported as a range of
values corresponding to different probabilities of occurrence. A thorough discussion of the
methodologies used and the results obtained in the assessment are presented. The estimates of
the portion of the resources assumed to be leased, discovered, developed, and produced as a
result of the proposed actions are based upon logical sequences of events that incorporate past
experience, current conditions, and foreseeable development strategies. A wealth of historical
data and information derived from more than 50 years of oil and gas exploration, development,
and production activities were used extensively by BOEM (formerly the Minerals Management
Service [MMS]). The undiscovered, unleased, conventionally recoverable resource estimates for
the proposed actions are expressed as ranges, from low to high. The range reflects a range of
projected economic valuations of the produced oil and gas.
The projected life of all exploration, development, production, and decommissioning activities
that result from a typical proposed lease sale is assumed to be 50 years. This is based on the
average length of time required for these activities to occur over the life of a typical Gulf of
Mexico (GOM) lease.
Based on the resource estimates described above, an estimate of amount of oil to be produced
from a given area is estimated, and the estimate is presented in billion barrels (Bbbl). The
projected oil production in Bbbl for a typical proposed lease sale and the OCS Program are
shown in Table 1 below.
Table 1. Projected Oil Production for the OCS Program
and for a Typical Proposed Lease Sale
Planning Area Estimated Production
(Bbbl)1
Analysis Period
Proposed Action
Regionwide 0.210–1.118 50 years
CPA/EPA 0.185–0.970 50 years
WPA 0.026–0.148 50 years
Cumulative OCS Program
Regionwide 15.482–25.806 70 years
CPA/EPA 13.590–22.381 70 years
WPA 1.892–3.425 70 years 1Bbbl = billion (109) barrels; 1 barrel = 42 U.S. Gallons
4
2.3 Location of the Proposed Action (Compared with Domain and Study Areas)
The proposed action involves leasing scenarios based on three alternatives described in “Gulf of
Mexico OCS Oil and Gas Lease Sales: 2017-2022 Gulf of Mexico Lease Sales
249,250,251,252,253,254,256,257,259, and 261 Draft Environmental Impact Statement”
(USDOI-BOEM 2016c), and the study area includes the entire GOM and surrounding area
(Figure B-1a).
The geographic boundaries that encompass the resources at risk from a hypothetical oil spill
from OCS operations in the lease areas are shown in Figure B-1a. This area is called the domain.
Although few hypothetical oil spills were likely to extend beyond the borders of the domain
within 30 days after release (the maximum elapsed time considered), we have tracked and
tabulated some spills that would travel beyond the open-ocean boundaries. These spills could
contact land or other resources outside the domain.
2.4 Resources Considered in the Analysis
The resources considered in this analysis were selected by BOEM analysts in the Gulf of Mexico
OCS Region with supplementary input from the National Marine Fisheries Service and the U.S.
Fish and Wildlife Service. BOEM analysts also used information from its Environmental Studies
Program results, literature reviews, and professional exchanges with other scientists to define
resources. The analysts used geographic digital information on the biological, physical, and
socioeconomic resources that could be exposed to contact from OCS oil spills to create maps of
resource locations vulnerable to oil-spill impact. These maps (Figures B-2 through B-17) depict
locations that were analyzed by the OSRA Model, representing either the locations of onshore
resources or the surface waters overlying or surrounding offshore resources. Each map may
represent the location of a resource or resource habitat, but may be used to assess risk to multiple
resources, even though the map is not labeled with the names of those resources. Discussions of
risks to all considered resources can be found in the multisale environmental impact statement
(EIS) (USDOI-BOEM 2016c) or the forthcoming EISs that are prepared for each individual
lease sale (proposed action).
All of the onshore, coastal resource locations were represented by one or more partitions of the
coastline (herein called “land”). The study area coastline was partitioned into 210 equidistant
land segments of approximately 10-mile (16-kilometer) length. The partitions were formed by
creating straight lines between two points projected onto the coast; therefore, the actual miles of
shoreline represented by each land segment vary, depending upon the complexity of the coastal
area.
In addition, the state offshore waters were included as resources. The limits of State waters are
defined by the States and range from 3 to 9 nautical miles. Texas and Florida state offshore
waters extend 3 marine leagues (just over 9 nautical miles) seaward from the baseline from
which the breadth of the territorial sea is measured (1 marine league = 1,8228.3 feet). Louisiana
state offshore waters extend 3 imperial nautical miles seaward of the baseline from which the
breadth of the territorial sea is measured (1 imperial nautical mile = 6,080 feet). Mississippi and

5
Alabama State offshore waters extend 3 nautical miles seaward of the baseline from which the
breadth of the territorial sea is measured (1 nautical mile = 6,076 feet).
The offshore and onshore resources that are examined in this OSRA Report are listed in Tables
A-3 through A-8. Periods of habitat or beach use are identified in parentheses. These tables also
indicate which figures illustrate the areas associated with each resource. Appendix B contains
the figures, which show the locations of each potentially affected resource (Figures B-2 through
B-17).
3.0 Oil-Spill Risk Analysis
The OSRA was conducted in three parts, corresponding to different aspects of the overall
problem:
1. The probability of oil-spill occurrence (discussed in Section 3.1),
2. The trajectories of oil spills from hypothetical spill locations to various resources (described
in Section 3.2), and
3. A combination of the first two analyses to estimate the overall oil-spill risk of both spill
occurrence and spill contact if there is oil development (presented in Section 3.3).
Risk analyses may be characterized as “hazard-based” or “risk-based.” A hazard-based analysis
examines possible events regardless of their low (or high) likelihood. For example, a potential
impact would not lose significance because the risk has been reduced due to an increase in the
level of control, such as engineering standards. A risk-based analysis, on the other hand, does
take into account the likelihood of the event occurring or the measures that can be taken to
mitigate its potential impacts.
This OSRA is designed for use as a risk-based assessment. Therefore, the likelihood of oil spills
( 1,000 barrels [bbl] in size) occurring on the OCS plays an integral role in the analysis. In
addition to the estimated chance of spills occurring, the analysis entails an extensive oil-spill
trajectory model. Results from the trajectory analysis provide input to the final product by
estimating where spills might travel on the ocean’s surface and what resources could be
contacted.
Results from the OSRA are, therefore, expressed as the combined probability of spills both
occurring and contacting modeled offshore and coastal resource locations.
Note that the analysis estimates spill contacts, not spill impacts. Further measures that should be
evaluated to determine impacts, such as the natural weathering of oil spills and the effects of
cleanup activities, are not directly factored into the analysis but should be added to the
interpretation of its results.

6
3.1 Probability of Oil Spills Occurring
The probability of oil spills occurring assumes that spills occur independently of each other as a
Poisson process. The Poisson process is a statistical distribution that is commonly used to model
random events. The probability of oil spills occurring is based on spill rates derived from the
historical OCS platform and OCS pipeline spill record and the historical tanker spill record in
U.S. waters, and it depends on the volume of oil produced and transported. All types of
accidental spills greater than or equal to 1,000 bbl were considered in this analysis. These spills
include those from well blowouts, other accidents that occur on platforms, and during
transportation of oil to shore. These spills were classified as platform, pipeline, or tanker spills.
This classification allows the analyst to compare the risks from each spill source due to a
proposed action, relative to the risks of spill occurrence and contact due to the alternatives being
considered.
Anderson et al. (2012) examined oil-spill occurrence rates applicable to the OCS. Their results
are adjusted for recent experience and based upon more complete databases than were available
for earlier analyses (Anderson and LaBelle, 1990, 1994, 2000; Lanfear and Amstutz, 1983); their
results indicated that some significant changes had occurred in the spill rates for platforms,
pipelines, and tankers. This report uses the updated spill occurrence rates from Anderson et al
(2012).
Spill rates are expressed as number of spills per billion barrels (spills/Bbbl) of oil produced or
transported. A billion barrels (Bbbl) is defined as 109 bbl of oil. Spills of different sizes are
analyzed when calculating the rates of spills per Bbbl of oil produced. Spills less than 1,000 bbls
are addressed in the EIS for each proposed action without the use of trajectory modeling because
smaller spills may not persist in the environment long enough to be simulated by trajectory
modeling. Spills greater than or equal to 1,000 bbl persist in the environment long enough to be
modeled and are addressed in OSRA reports. Larger spills are likely to be identified and
reported; therefore, these records are more comprehensive than those of smaller spills. For
potential catastrophic oil spills for a volume greater than 1 million bbl, Ji et al. (2014) used the
extreme value theory to analyze the probability of catastrophic spills. A catastrophic spill is not
considered as part of the proposed actions in the proposed program and is therefore not part of
this analysis. For information pertaining to a catastrophic spill event please refer to Ji et al.
(2014).
Two basic criteria were used in selecting the volume of oil handled as the risk exposure variable:
(1) the exposure variable should be simple to define, and
(2) it should be a quantity that can be estimated.
The volume of oil produced or transported was the chosen exposure variable primarily for the
following reasons: historical volumes of oil produced and transported are well documented;
using these volumes makes the calculation of the estimated oil-spill occurrence rate simple—the
ratio of the number of historical spills to the volume of oil produced or transported; and future
volumes of oil production and transportation are routinely estimated. The volume of oil and gas
to be produced for a proposed action and for the Gulf-wide OCS Program is estimated from an
assessment of oil resources by using comprehensive geological and geophysical databases and
related models. In addition, the BOEM analysts estimate other exposure variables, such as

7
number of platforms and tanker trips, as a function of the volume of oil estimated to be produced
or transported.
Anderson et al. (2012) analyzed platform and pipeline spills in Federal waters that occurred from
OCS oil and gas development from 1964 through 2010 and crude oil tanker spills that occurred
in U.S. waters from 1974 through 2008. In these analyses, every spill record was examined and
verified to the furthest extent possible. Each spill was classified for size, product spilled, and
spill source according to its applicability to the analysis. Spill rates (in spills per Bbbl of oil
produced at platforms on the OCS or transported by pipelines on the OCS or tankers traversing
the OCS) were estimated for platforms, pipelines and tankers on the OCS, as shown in Table 2.
Table 2. Oil Spill Rates
Spill Source Number of Spills
>1,000 bbl1 (spills/Bbbl)2 >10,000 bbl1 (spills/Bbbl)2
OCS Platforms 0.25 0.13
OCS Pipelines 0.88 0.18
OCS Tankers 0.34 0.11 1bbl = barrels = 42 U.S. gallons 2Bbbl = Billion barrels = 109 barrels Source: Anderson et al. 2012
The spill rates in Table 2, which are based on a 15-year period (1996-2010) for OCS platforms
and pipelines and a 20-year period (1989–2008) for tankers, as found in Anderson et al. (2012)
were used in this OSRA study as best representing current technology.
Using Bayesian techniques, Devanney and Stewart (1974) showed that the probability of n
oil-spill contacts can be described by a negative binomial distribution. Smith et al. (1982),
however, noted that when actual exposure is much less than historical exposure, as is the case
here, the negative binomial distribution can be approximated by a Poisson distribution. The
Poisson distribution has a significant advantage in calculations because it is defined by only one
parameter, the assumed number of spills. If p(n,i) is the probability of exactly n contacts to a
resource i, then:
( , )!
n i
i ep n i
n
where n is the specific number of spills (0, 1, 2, ..., n), e is the base of the natural logarithm, and
λ is the parameter of the Poisson distribution. For oil spills, the Poisson parameter (λ) is equal to
the spill rate multiplied by the volume of oil to be produced or transported. The spill rate has
dimensions of number of spills/Bbbl, and the volume is expressed in Bbbl. Therefore, λ denotes
the mean number of spills estimated to occur as a result of production or transportation of a
specific volume of oil.
Oil-spill occurrence estimates for spills greater than or equal to 1,000 bbl were calculated for

8
production and transportation of oil during the 50-year analysis period associated with the
proposed action in the OCS Program (2017–2066). These probabilities are based on the volume
of oil estimated to be found, produced, and transported over the life of a typical lease sale and on
the rates that have been calculated for oil spills from OCS platforms, pipelines, and tankers by
Anderson et al. (2012). The probabilities of one or more oil spills greater than or equal to 1,000
bbl occurring as a result of OCS exploration, development, and production and transportation
resulting from a typical lease sale or resulting from the OCS Program are found in Table A-2.
The probabilities for spills greater than or equal to 10,000 bbl are also shown in Table A-2.
3.2 Oil-Spill Trajectory Simulations
The goal of an oil-spill risk analysis is to answer the question: What is the probability of oil and
gas development from a platform in a given area to cause oil, if it is spilled, to contact specific
shorelines or sensitive resources? To achieve this goal, the OSRA model must estimate where an
oil spill might begin, where it is likely to move, and where the shorelines and resources are,
relative to that potential movement. From these analyses, the probability of contact to a given
area is calculated.
Locations of hypothetical spill sites are addressed in Section 3.2.1. Ocean current and wind
inputs used in the OSRA model are described in Section 3.2.2, and the trajectories of
hypothetical spills are addressed in Section 3.2.3. The outputs from the OSRA model are a series
of probabilities of contact between a hypothetical spill in a specific area and a resource or a
specific segment of the shoreline. These are introduced in Section 3.2.4. Finally, Section 3.2.5
lists factors that are not included in OSRA modeling and discusses how the exclusion of those
factors affects the model’s results.
3.2.1 Hypothetical Spill Locations and Timing
To model where a spill might go, one needs to know where and when it began. To provide a
location from which a hypothetical spill begins, the OSRA model uses hypothetical spill
locations called launch points. The OSRA model initiates hypothetical oil spills uniformly in
space and time from within the study area, as shown in Figure B-1a.
At distance intervals of one-tenth of a degree (1/10o) of latitude
(about 11 kilometers) and
intervals of 1/10o
of longitude (about 10 kilometers), 6045 launch points for hypothetical spills
were identified in the study area. The spatial resolution of the spill simulations (1/10o
north-south
and 1/10
o east-west)
was selected to reflect the spatial resolution of the input data.
The OSRA model estimates and tracks one spill per launch point per day for the 15 years of the
available wind and current data. Trajectories of hypothetical spills were initiated every day (a 1-
day interval) from each of the launch points in space over the simulation period from January 1,
1993 to December 31, 2007. A total of one spill per day for each of the 6045 launch points for
15 years was calculated.
The OSRA model integrates the spill velocities (a linear superposition of surface ocean currents
and empirical wind drift) by integrating velocity in time to produce the spill trajectories. The

9
time step selected was 1 hour to fully utilize the spatial resolution of the ocean current field and
to achieve a stable set of trajectories. The velocity field was bi-linearly interpolated from the 3-
hourly or 1-hourly grid to get velocities at 1-hour intervals. Time steps smaller than 1 hour were
analyzed previously (Price et al. 2002) and were found to not produce significant differences in
the simulated trajectories after 30 model days, so the 1-hour time step was chosen for this
analysis.
The chosen number of trajectories was small enough to be computationally practical and large
enough to reduce the random sampling error to an insignificant level. Also, the weather-scale
changes in the winds are at least minimally sampled with simulated spills started daily. The
interval of time between releases (1 day) was sufficiently short to sample weather-scale changes
in the input winds (Price et al. 2002).
Sensitivity tests on the OSRA model (Price et al. 2002) indicated that, statistically, the above-
mentioned spatial resolution (1/10o
by 1/10o) and time resolution (1-day) are sufficient to
represent the spatial and time variations of the oil-spill trajectories in the area. At this resolution,
over 33 million oil-spill trajectories were tracked from the launch points in the study area, based
on the wind and current data during the period from 1993 to 2007.
3.2.2 Ocean Current Data and Wind Simulations as Inputs to OSRA
This section describes two major inputs for the OSRA model: the model that is used to provide
ocean currents, and the data that are used for wind speeds and wind directions.
Ocean currents and winds move spilled oil on the ocean surface. Complex surface ocean currents
exert a shear force on the spilled oil from below. In addition, prevailing winds exert an
additional shear forces on the spill from above. The combination of these two forces causes the
movement of spilled oil away from its initial spill location.
The OSRA model: The OSRA model was designed to track the movements of potential oil
spills before they happen. The model, which was originally developed by Smith et al. (1982) and
enhanced by BOEM over the years (LaBelle and Anderson 1985; Ji et al. 2002, 2004, 2011,
2014), simulates oil-spill transport using realistic data fields of winds and ocean currents in the
GOM. The model calculates the movement of hypothetical spills by successively integrating
time sequences of two spatially gridded input fields: the surface ocean currents and the sea-level
winds. In this fashion, the OSRA model generates time sequences of hypothetical oil-spill
locations–essentially, oil-spill trajectories.
Conducting an oil-spill risk analysis requires detailed information on ocean currents and wind
fields (Ji 2004). The ocean currents inputs are numerically computed from an ocean circulation
model of the GOM that is driven by meteorological forces (the near-surface winds and the total
heat fluxes) that have been analyzed and by observed river inflow into the GOM (Oey 2005;
2008).
The Modified Princeton Ocean Model: The model used to provide ocean current data for the
OSRA model is a version of the Princeton Ocean Model (POM), which is an enhanced version
of the earlier-constructed Mellor-Blumberg Model. It is a three-dimensional, time-dependent,
10
primitive equation model using orthogonal curvilinear coordinates in the horizontal dimension
and a topographically conformal coordinate in the vertical dimension. The use of these
coordinates allows for a realistic coastline and bottom topography, including a sloping shelf, to
be represented in the model simulation. The model incorporates the Mellor-Yamada turbulence
closure model to provide a parameterization of the vertical mixing process through the water
column.
The prognostic variables of the modified POM are velocity, temperature, salinity, turbulence
kinetic energy, and turbulence macroscale. The momentum equations are nonlinear and
incorporate a variable Coriolis parameter. Prognostic equations governing the thermodynamic
quantities (temperature and salinity) account for water mass variations brought about by highly
time-dependent coastal upwelling processes. The processes responsible for eddy production,
movement, and eventual dissipation are also included in the model physics. Other computed
variables used in the modified POM include density, vertical eddy viscosity, and vertical eddy
diffusivity.
The modified POM calculation was performed by Princeton University (Oey 2005; 2008). This
simulation covered the 15-year period, 1993 through 2007, and the results were saved at 3-hour
intervals. The simulation period covers the data available for this study. These modified POM
runs included the assimilation of sea surface altimeter observations to improve the ocean model
results.
The modified POM simulations were extensively skill-assessed with many observations from the
GOM (Oey 2005; 2008). These extensive sets of observations afford a rigorous test of the
modified POM’s ability to reproduce ocean transport as well as prominent features of the Gulf
such as the Loop Current and strong mesoscale eddies, which are easily observed from satellite-
borne instrumentation. With these observations and with other current measurements from
moored current meters, a good determination of the model’s veracity was made. The modified
POM reproduced the characteristics of the GOM surface currents both on and off the continental
shelf. The surface current field manifests all the dominant structures in time and space as the
observed currents and is, therefore, applicable in the statistical estimation of future spill risk that
the OSRA model makes. The surface currents from the modified POM calculation were used for
input into the OSRA Model.
Wind Data Used as OSRA model Input: For surface wind data, the OSRA model incorporates
concurrent wind fields, which are the 6-hourly surface wind speeds and directions, as analyzed
by the European Center for Medium Range Weather Forecasting. The OSRA model used the
same wind field to calculate the empirical wind drift of the simulated spills.
3.2.3 Trajectory Simulations
In the trajectory simulation portion of the OSRA Model, many hypothetical oil-spill trajectories
are produced by numerically integrating a temporally- and spatially-varying ocean current field,
and superimposed on that an empirical wind-induced drift of the hypothetical oil spills (Samuels
et al. 1982). Collectively, the trajectories represent a statistical ensemble of simulated oil-spill
displacements produced by a field of winds derived from observations and numerically derived
ocean currents. The historical data on winds and currents in the GOM are assumed to be
11
statistically similar to those that will occur in the Gulf during future offshore activities. In other
words, the oil-spill risk analysts assume that the frequency of strong wind events in the wind
field is the same as what will occur during future offshore activities. By inference, the
frequencies of contact by the simulated oil spills are the same as what could occur from actual
oil spills during future offshore activities.
A cluster analysis (Everitt 1993) is used to further divide the planning areas into hypothetical
spill subareas. Cluster analysis is a multivariate technique that groups entities based on similar
characteristics. In the case of the CPA and the WPA of the GOM, BOEM used the probability of
contact to shoreline segments to identify offshore areas that showed similar risk, based on
similarity in patterns of trajectories. In the case of the EPA, a single cluster was assumed for the
entire planning area because the portion of the EPA being considered for leasing is very small in
comparison to the size of the CPA and WPA.
To account for the risk of spills occurring from the transportation of oil to shore via pipeline,
generalized pipeline corridors originating within the offshore cluster area(s) and terminating at
existing major oil pipeline shore bases were identified. These pipeline corridors represent the
complex matrix of pipeline systems existing offshore that are likely to be used in support of each
proposed action. The oil volume estimated to be produced within the cluster area was
proportioned among likely pipeline corridor routes, representing the transportation of the oil
beginning within the cluster area and terminating at State/Federal boundaries proximate to
known pipeline shore bases.
3.2.4 Spill-Resource Contact Probabilities
In addition to the ocean current, and the surface wind data, and the hypothetical spill locations,
another portion of the OSRA model tabulates the simulated oil spill contacts to specific locations
or resources.
To locate resources, the model contains the geographical boundaries of a variety of identified
environmental features. At each successive time step, the OSRA model compares the location of
the hypothetical spills against the geographic boundaries of shoreline and designated offshore
resources. The OSRA model then counts the number of “contacts,” which is comprised of the
number of oil-spill contacts to segments of shoreline (counties/parishes) plus the occurrences of
oil-spill contact to offshore resources during the time periods that the habitat is known to be used
by the resource. A contact to a shoreline will stop the trajectory of an oil spill; no re-washing is
assumed in this model. A contact to an offshore resource that is not a shoreline (a wildlife refuge
area in the middle of the ocean, for example) will not stop the calculation of the trajectory in
OSRA.
After specified periods of time, the OSRA model will divide the total number of contacts by the
total number of simulated oil spills from a given geographic location. Recall that the number of
simulated spills for this OSRA report is one hypothetical spill per day multiplied by 15 years
multiplied by 360 days. The ratios between the total number of contacts and total simulated
spills are the estimated probabilities of oil-spill contact from offshore activities at that
geographic location, assuming spill occurrence.

12
Finally, the frequencies of oil-spill contact are computed for designated oil-spill travel times
(e.g., 3, 10, or 30 days). This is calculated by dividing the total number of oil-spill contacts by
the total number of hypothetical spills initiated in the model from a given hypothetical spill
location. The frequencies of oil-spill contact are the model-estimated probabilities of oil-spill
contact. The OSRA model output provides the estimated probabilities of contact to all identified
offshore resources and segments of shoreline from locations chosen to represent hypothetical oil
spills from oil production and transportation facilities, at several selected oil-spill travel times.
The OSRA model combines the statistics for shoreline contacts by the trajectories to calculate
the average probabilities of shoreline contact.
3.2.5 Factors Not Considered in the OSRA Model
There are factors not explicitly considered by the OSRA model that can affect the transport of
spilled oil as well as the dimensions, volume, and nature of the oil spills contacting resources or
the shoreline. These include possible cleanup operations, chemical composition of the spilled oil,
weathering of oil spills, or the spreading and splitting of oil spills. The OSRA analysts have
chosen to take a more conservative approach by presuming that no oil-spill-response activities
occur and by assuming complete persistence of spilled oil over the selected time duration of the
trajectories. These assumptions make the OSRA model’s calculated probabilities conservative.
3.3 Conditional Probabilities of Contact
The probability that an oil spill will contact a specific resource within a given time of travel from
a certain location or spill point is termed a “conditional probability,” the condition being that a
spill is assumed to have occurred. Each trajectory was allowed to continue for as long as 30
days. However, if the hypothetical spill contacted shoreline sooner than 30 days after the start of
the spill, the spill trajectory was terminated, and the contact was recorded.
The trajectories simulated by the model represent only hypothetical pathways of oil slicks; they
do not involve any direct consideration of cleanup, dispersion, or weathering processes that
could alter the quantity or properties of oil that might eventually contact the resource locations.
However, an implicit analysis of weathering and decay can be considered by choosing a travel
time for the simulated oil spills when they contact resource locations that represent the likely
persistence of the oil slick on the water surface. BOEM performed an analysis of the likely
weathering of a typical offshore oil spill of 1,000 bbl or greater occurring under the proposed
action scenarios (USDOI, BOEM 2016). The analysis of the slick’s fate showed that a typical
GOM oil slick of 1,000 bbl or greater, exposed to typical winds and currents, would not persist
on the water surface beyond 30 days. Therefore, OSRA model trajectories were analyzed only
up to 30 days. Any spill contacts occurring on or before the 30-day period are reported in the
probability tables. Conditional probabilities of contact with resource locations and land segments
within 10, 20 and 30 days of travel time were calculated for each of the hypothetical spill sites
by the model to serve as input into the final calculation of risk.

13
3.4 Combined Probabilities of Contact
A critical difference exists between the conditional probabilities and the combined probabilities
calculated. Conditional probabilities depend only on the winds and currents in the study area.
Combined probabilities, on the other hand, depend not only on the winds and currents, but also
on the chance of spill occurrence, the estimated volume of oil to be produced or transported, and
the oil transportation scenario. The combined probabilities for this analysis of the proposed
action activities are presented in Tables A-3 through A-8.
In calculating the combined probabilities of both oil-spill contact and oil-spill occurrence, the
following steps are performed:
1. To address the probability of spill contact for a set of nt resources and nl launch points,
the conditional probabilities can be represented in a matrix form. Let [C] be an nt nl matrix,
where each element ci,j is the probability that an oil spill will contact resource i, given that a spill
occurs at launch point j. Note that launch points can represent potential starting points of spills
from production areas or from transportation routes.
2. Oil-spill occurrence can be represented by another matrix [S]. With nl launch points and
ns production sites, the dimensions of [S] are nl ns. Let each element sj,k be the estimated mean
number of spills occurring at launch point j owing to production of a unit volume (1 Bbbl) of oil
at site k. These spills can result from either production or transportation. The sj,k can be
determined as a function of the volume of oil (spills/Bbbl). Each column of [S] corresponds to
one production site and one transportation route. If alternative and mutually exclusive
transportation routes are considered for the same production site, they can be represented by
additional columns of [S], thus increasing ns.
3. The unit risk matrix [U] is defined as:
[U] = [C] [S]
[U] has dimensions nt ns.. Each element ui,k corresponds to the estimated mean number of spills
occurring and contacting resource i, owing to the production of a unit volume (1 Bbbl) of oil at
site k.
4. To convert this number into a number that reflects the expected oil production volume, a
value for volume must be included. With [U], the mean contacts to each resource are estimated,
given a set of oil volumes at each site. Let [V] be a vector of dimension ns where each element vk
corresponds to the volume of oil expected to be found at production site k. Then, if [L] is a
vector of dimension nt, where each element λi corresponds to the mean number of contacts to
resource i, the formula is:
[L] = [U] [V]
Thus, estimates of the mean number of oil spills that are likely to occur and contact resources (or
land segments) can be calculated. (Note that, as a statistical parameter, the mean number can
assume a fractional value, even though fractions of oil spills have no physical meaning.)
14
4.0 Discussion
Tables A-3 through A-8 give the combined probabilities of three alternative leasing scenarios
(USDOI, BOEM 2016c). As one might expect, resource locations closest to the spill sites have
the greatest risk of contact. As the model run duration increases, more of the identified resources
and shoreline segments could have meaningful probabilities of contact (>0.5%). The longer
transit times (up to 30 days) allowed by the model enable more hypothetical spills to reach the
resources and the shoreline from more distant spill locations. With increased travel time, the
complex patterns of wind and ocean currents produce eddy-like motions of the oil spills and
multiple opportunities for a spill to make contact with any given resource or shoreline segment.
For instance, Table A-3 provides the probabilities (expressed as percent chance) of one or more
offshore spills greater than or equal to 1,000 bbl, and the number of spills (mean) that could
occur and could contact a certain offshore resource within 10 days and within 30 days, given the
estimated volume of oil produced from a proposed action for the Alternative A leasing scenario.
This table shows that Texas State Waters, which is illustrated on Figure B-2, has a probability of
2 percent of being contacted by spilled oil within 10 days, if there is an oil spill from a proposed
action with an estimated oil production volume of 0.210 Bbbl (Table 1). Its probability increases
to 5 percent of being contacted by the spilled oil within 30 days.
15
5.0 References
Anderson, C.M., and R.P. LaBelle. 1990. Estimated occurrence rates for accidental oil spills on
the U.S. Outer Continental Shelf. Oil Chem. Pollution 6:21-35. Available at:
http://www.boem.gov/Environmental-Stewardship/Environmental-Assessment/Oil-Spill-
Modeling/Oil-Spill-Modeling-Program---Additional-References.aspx
Anderson, C.M., and R.P. LaBelle. 1994. Comparative occurrence rates for offshore oil spills.
Spill Sci. Technol. Bull. 1(2):131-141. Available at:
http://www.boem.gov/Environmental-Stewardship/Environmental-Assessment/Oil-Spill-
Modeling/Oil-Spill-Modeling-Program---Additional-References.aspx
Anderson, C.M., and R.P. LaBelle. 2000. Update of comparative occurrence rates for offshore
oil spills. Spill Sci. Technol. Bull. 6(5-6):303-321. Available at:
http://www.boem.gov/Environmental-Stewardship/Environmental-Assessment/Oil-Spill-
Modeling/Oil-Spill-Modeling-Program---Additional-References.aspx
Anderson, C.M., M. Mayes, and R.P. LaBelle. 2012. Oil spill occurrence rates for offshore
spills. Herndon, VA. Bureau of Ocean Energy Management Division of Environmental
Assessment, OCS Report 2012-069, and Bureau of Safety and Environmental
Enforcement, Report No. 2012-069. Available at:
http://www.boem.gov/uploadedFiles/BOEM/Environmental_Stewardship/Environmental
_Assessment/Oil_Spill_Modeling/AndersonMayesLabelle2012.pdf
Devanney, M.W., III, and R.J. Stewart. 1974. Analysis of oil spill statistics (April 1974) Report
No. MITSG-74-20. Massachusetts Institute of Technology. Cambridge, MA. Available
at: http://www.boem.gov/Environmental-Stewardship/Environmental-Assessment/Oil-
Spill-Modeling/Oil-Spill-Modeling-Program---Additional-References.aspx
Everitt, B.S. 1993. Cluster Analysis. 3rd
edition. John Wiley and Sons, New York.
Ji, Z.-G. 2004. Use of physical sciences in support of environmental management.
Environmental Management, 34(2), Springer-Services and Business Media., New York,
NY, pp. 159-169.
Ji, Z.-G., W.R. Johnson, C.F. Marshall, G.B. Rainey, and E.M. Lear. 2002. Oil-spill risk
analysis: Gulf of Mexico Outer Continental Shelf (OCS) lease sales, central planning
area and western planning area, 2003-2007, and Gulf-wide OCS program, 2003-2042.
OCS Report 2002-032. Minerals Management Service. Herndon, VA. 61 pp. Available
at: http://www.boem.gov/Environmental-Stewardship/Environmental-Assessment/Oil-
Spill-Modeling/Oil-Spill-Risk-Analysis-Reports.aspx

16
Ji, Z.-G., W.R. Johnson, and C.F. Marshall. 2004. Deepwater oil-spill modeling for assessing
environmental impacts. Coastal Environment V (Brebbia et al., eds), WIT Press,
Southampton, MA. pp. 349-358.
Ji, Z.-G., W.R. Johnson, and Z. Li. 2011. Oil spill risk analysis model and its application to the
Deepwater Horizon oil spill using historical current and wind data, in Monitoring and
Modeling the Deepwater Horizon Oil Spill: A Record-Breaking Enterprise, Geophys.
Monogr. Ser., doi:10.1029/2011GM001117, pp 227-236. Available at:
http://www.agu.org/books/gm/v195/2011GM001117/2011GM001117.shtml
Ji, Z.-G., W.R. Johnson, J.W. Price, and C.F. Marshall. 2003. Oil-spill risk analysis for assessing
environmental impacts. In Proceedings of the 2003 International Oil Spill Conference,
Vancouver, Canada.
Ji, Z.G., W.R. Johnson, and G.L. Wikel. 2014. Statistics of extremes in oil spill risk analysis.
Environmental science & technology. 48(17):10505-10510.
LaBelle, R.P., and C.M. Anderson. 1985. The application of oceanography to oil-spill modeling
for the Outer Continental Shelf oil and gas leasing program. Mar. Technol. Soc. J.
19(2):19-26. Available at: https://www.boem.gov/Environmental-
Stewardship/Environmental-Assessment/Oil-Spill-Modeling/Oil-Spill-Modeling-
Program---Additional-References.aspx
Lanfear, K.J., and D.E. Amstutz. 1983. A Reexamination of Occurrence Rates for Accidental Oil
Spills on the U.S. Outer Continental Shelf: Proceedings of the Eighth Conference on the
Prevention, Behavior, Control, and Cleanup of Oil Spills, San Antonio, Texas, February
28–March 3, 1983. Available at: https://www.boem.gov/Environmental-
Stewardship/Environmental-Assessment/Oil-Spill-Modeling/Oil-Spill-Modeling-
Program---Additional-References.aspx
Price, J.M., W.R. Johnson, Z.-G. Ji, C.F. Marshall, and G.B. Rainey. 2002. Sensitivity Testing
for Improved Efficiency of a Statistical Oil Spill Risk Analysis Model. Unpublished.
Oey, L.-Y. 2005. Circulation model of the Gulf of Mexico and the Caribbean Sea: Development
of the Princeton Regional Ocean Forecast (& Hindcast) System - PROFS, and Hindcast
experiment for 1992–1999. Final Report. OCS Study MMS 2005-049. U.S. Dept. of the
Interior, Minerals Management Service, Environmental Division. Herndon, Virginia. 174
pp. Available at: http://www.data.boem.gov/PI/PDFImages/ESPIS/4/4262.pdf
Oey, L.-Y. 2008, Loop Current and deep eddies. J. Phys. Oceanogr. 38: 1426-1449.
17
Samuels, W.B., N.E. Huang, and D.E. Amstutz. 1982. An oil spill trajectory analysis model with
a variable wind deflection angle. Ocean Eng. 9:347-360.
Smith, R.A., J.R. Slack, T. Wyant, and K J. Lanfear. 1982. The oil spill risk analysis model of
the U.S. Geological Survey. U.S. Geological Survey Professional Paper 1227. Available
at: https://www.boem.gov/Environmental-Stewardship/Environmental-Assessment/Oil-
Spill-Modeling/Oil-Spill-Modeling-Program---Additional-References.aspx
U.S. Department of the Interior (USDOI), Bureau of Ocean Energy Management (BOEM).
2016a. Assessment of undiscovered technically recoverable oil and gas resources of the
Nation’s Outer Continental Shelf, 2016. BOEM Fact Sheet RED-2016-01b U.S.
Department of the Interior, Bureau of Ocean Energy Management, Resources Evolution
Division, Sterling, VA. 8 pp. Available at: https://www.boem.gov/2016-National-
Assessment-Fact-Sheet/
U.S. Department of the Interior (USDOI), Bureau of Ocean Energy Management (BOEM).
2016b. 2017-2022 Outer continental shelf oil and gas leasing proposed program.
Available at: https://www.boem.gov/2017-2022-Proposed-Program-Decision/
U.S. Department of the Interior (USDOI), Bureau of Ocean Energy Management (BOEM).
2016c. Gulf of Mexico OCS Oil and Gas Lease Sales: 2017-2022 Gulf of Mexico lease
sales 249, 250, 251, 252, 253, 254, 256, 257, 259, and 261 draft environmental impact
statement (OCS EIS/EA BOEM 2016-018). Volume I available at:
https://www.boem.gov/BOEM-2016-018-v1/ Volume II available at:
https://www.boem.gov/BOEM-2016-018-v2/

Appendix A. Oil-Spill Risk Analysis Tables

19
Table A-1. Oil-spill occurrence probability estimates for offshore spills ≥1,000 barrels resulting from each alternative (2017–2066) and the cumulative OCS oil and gas program (2017–2086).
Forecasted
Oil Production
(Bbbl)1
Mean Number of Spills Estimated to Occur Estimates of Probability (% chance)
of One or More Spills
Platforms Pipelines Tankers Total Platforms Pipelines Tankers Total
Single Lease Sale Alternatives
Alternative A2 0.210 0.05 0.19 0 0.24 5 17 <0.5 21
1.118 0.28 0.98 0.01 1.27 24 63 <0.5 72
Alternative B3 0.185 0.05 0.16 0 0.21 5 15 <0.5 19
0.970 0.24 0.85 0 1.10 22 57 <0.5 67
Alternative C4 0.026 0.01 0.02 0 0.03 1 2 <0.5 3
0.148 0.04 0.13 0 0.17 4 12 <0.5 15
Cumulative OCS Oil and Gas Program
Regionwide 15.482 3.87 13.62 0.08 17.57 98 >99.5 7 >99.5
25.806 6.45 22.71 0.13 29.29 >99.5 >99.5 12 >99.5
CPA/EPA 13.590 3.40 11.96 0.07 15.42 97 >99.5 7 >99.5
22.381 5.60 19.70 0.11 25.40 >99.5 >99.5 11 >99.5
WPA 1.892 0.47 1.66 0 2.14 38 81 <0.5 88
3.425 0.86 3.01 0 3.87 58 95 <0.5 98
Notes: Bbbl = billion barrels.
“Platforms” refers to facilities used in exploration, development, or production. 1Values represent the low and high resource estimates. 2Regionwide proposed lease sale. 3Regionwide proposed lease sale excluding blocks in the WPA. 4Regionwide proposed lease sale excluding blocks in the CPA/EPA.

20
Table A-2. Oil-spill occurrence probability estimates for offshore spills ≥10,000 barrels resulting from each alternative (2017–2066) and the cumulative OCS oil and gas program (2017–2086).
Forecasted Oil Production
(Bbbl)1
Mean Number of Spills Estimated to Occur Estimates of Probability (% chance)
of One or More Spills
Platforms Pipelines Tankers Total Platforms Pipelines Tankers Total
Single Sale Alternatives
Alternative A2 0.210 0.03 0.04 0 0.07 3 4 <0.5 6
1.118 0.15 0.20 0 0.35 14 18 <0.5 29
Alternative B3 0.185 0.02 0.03 0 0.06 2 3 <0.5 6
0.970 0.13 0.17 0 0.30 12 13 <0.5 26
Alternative C4 0.026 0 0 0 0.01 <0.5 <0.5 <0.5 1
0.148 0.02 0.03 0 0.05 2 3 <0.5 4
Cumulative OCS Oil and Gas Program
Regionwide 15.482 2.01 2.79 0.02 4.82 87 94 2 99
25.806 3.35 4.65 0.04 8.04 97 99 4 >99.5
CPA/EPA 13.590 1.77 2.45 0.02 4.23 83 91 2 99
22.381 2.91 4.03 0.04 6.97 95 98 4 >99.5
WPA 1.892 0.25 0.34 0 0.59 22 29 <0.5 44
3.425 0.45 0.62 0 1.06 36 46 <0.5 65
Notes: Bbbl = billion barrels.
“Platforms” refers to facilities used in exploration, development, or production. 1Values represent the low and high resource estimates. 2Regionwide proposed lease sale. 3Regionwide proposed lease sale excluding blocks in the WPA. 4Regionwide proposed lease sale excluding blocks in the CPA/EPA.

21
Table A-3. Probabilities (expressed as percent chance) of one or more offshore spills ≥1,000 barrels occurring and contacting certain offshore resources within 10 and 30 days for low and
high oil production estimates for Alternative A.
Offshore Resource Locations
Figure Showing Resource Location
Low Estimates High Estimates
Probability Mean Probability Mean
10 days
30 days
10 days
30 days
10 days
30 days
10 days
30 days
Cayman Islands B-1a n n 0.00 0.00 n n 0.00 0.00
Northwest Bahamas B-1a n n 0.00 0.00 n n 0.00 0.00
Northeast Bahamas B-1a n n 0.00 0.00 n n 0.00 0.00
Midwest Bahamas B-1a n n 0.00 0.00 n n 0.00 0.00
Mideast Bahamas B-1a n n 0.00 0.00 n n 0.00 0.00
South Bahamas B-1a n n 0.00 0.00 n n 0.00 0.00
Jamaica B-1a n n 0.00 0.00 n n 0.00 0.00
TX State Waters B-2 2 5 0.02 0.05 10 26 0.11 0.30
West LA State Waters B-2 3 5 0.03 0.05 17 26 0.19 0.30
East LA State Waters B-2 1 1 0.01 0.01 6 8 0.06 0.08
MS State Waters B-2 n n 0.00 0.00 1 2 0.01 0.02
AL State Waters B-2 n n 0.00 0.00 1 2 0.01 0.02
FL Panhandle State
Waters
B-2 n n 0.00 0.00 1 2 0.01 0.02
West FL State Waters B-2 n n 0.00 0.00 n n 0.00 0.00
Tortugas State Waters B-2 n n 0.00 0.00 n n 0.00 0.00
Southeast FL State
Waters
B-2 n n 0.00 0.00 n n 0.00 0.00
Northeast State Waters B-2 n n 0.00 0.00 n n 0.00 0.00
Mexican State Waters B-2 n n 0.00 0.00 n 1 0.00 0.01
Shoreline - 20 m (1) B-11 n n 0.00 0.00 n 1 0.00 0.01
Shoreline - 20 m (2) B-11 n 2 0.00 0.02 3 10 0.03 0.11
Shoreline - 20 m (3) B-11 2 4 0.02 0.04 11 22 0.12 0.25
Shoreline - 20 m (4) B-11 2 4 0.02 0.04 14 21 0.15 0.23
Shoreline - 20 m (5) B-11 4 5 0.04 0.05 20 25 0.22 0.28
Shoreline - 20 m (6) B-11 1 2 0.01 0.02 6 8 0.07 0.08
Shoreline - 20 m (7) B-11 1 1 0.01 0.01 4 6 0.04 0.06
Shoreline - 20 m (8) B-11 n n 0.00 0.00 1 2 0.01 0.02
Shoreline - 20 m (9) B-11 n n 0.00 0.00 n 2 0.00 0.02
Shoreline - 20 m (10) B-11 n n 0.00 0.00 n n 0.00 0.00
Shoreline - 20 m (11) B-11 n n 0.00 0.00 n n 0.00 0.00
Shoreline - 20 m (12) B-11 n n 0.00 0.00 n 1 0.00 0.01
Shoreline - 20 m (13) B-11 n n 0.00 0.00 n n 0.00 0.00
Shoreline - 20 m (14) B-11 n n 0.00 0.00 n n 0.00 0.00
Shoreline - 20 m (15) B-11 n n 0.00 0.00 n n 0.00 0.00
20 m - 300 m (1) B-11 1 3 0.01 0.03 5 14 0.05 0.15
20 m - 300 m (2) B-11 3 6 0.04 0.07 19 31 0.22 0.37
20 m - 300 m (3) B-11 5 7 0.05 0.08 27 35 0.32 0.42

22
Offshore Resource Locations
Figure Showing Resource Location
Low Estimates High Estimates
Probability Mean Probability Mean
10 days
30 days
10 days
30 days
10 days
30 days
10 days
30 days
20 m - 300 m (4) B-11 6 7 0.06 0.08 28 33 0.33 0.40
20 m - 300 m (5) B-11 1 2 0.01 0.02 7 9 0.08 0.10
20 m - 300 m (6) B-11 2 2 0.02 0.02 9 11 0.10 0.12
20 m - 300 m (7) B-11 1 2 0.01 0.02 7 9 0.08 0.10
20 m - 300 m (8) B-11 n 1 0.00 0.01 2 5 0.02 0.05
20 m - 300 m (9) B-11 n n 0.00 0.00 n 2 0.00 0.02
20 m - 300 m (10) B-11 n n 0.00 0.00 n 1 0.00 0.01
20 m - 300 m (11) B-11 n n 0.00 0.00 n 1 0.00 0.01
20 m - 300 m (12) B-11 n n 0.00 0.00 n n 0.00 0.00
20 m - 300 m (13) B-11 n n 0.00 0.00 n n 0.00 0.00
20 m - 300 m (14) B-11 n n 0.00 0.00 n n 0.00 0.00
300 m - outer
jurisdiction (1)
B-11 1 3 0.01 0.03 6 14 0.06 0.15
300 m - outer
jurisdiction (2)
B-11 1 3 0.01 0.03 6 13 0.06 0.14
300 m - outer
jurisdiction (3)
B-11 2 4 0.02 0.04 9 18 0.10 0.20
300 m - outer
jurisdiction (4)
B-11 2 4 0.02 0.04 10 19 0.10 0.21
300 m - outer
jurisdiction (5)
B-11 1 2 0.01 0.03 5 12 0.05 0.12
300 m - outer
jurisdiction (6)
B-11 3 5 0.03 0.05 14 21 0.15 0.24
300 m - outer
jurisdiction (7)
B-11 3 5 0.03 0.05 13 20 0.14 0.23
300 m - outer
jurisdiction (8)
B-11 2 4 0.02 0.04 9 16 0.09 0.17
300 m - outer
jurisdiction (9)
B-11 3 5 0.03 0.05 15 21 0.17 0.24
300 m - outer
jurisdiction (10)
B-11 4 5 0.04 0.06 17 23 0.19 0.26
300 m - outer
jurisdiction (11)
B-11 3 4 0.03 0.04 11 18 0.12 0.20
300 m - outer
jurisdiction (12)
B-11 4 6 0.04 0.06 20 25 0.23 0.29
300 m - outer
jurisdiction (13)
B-11 4 5 0.04 0.05 18 23 0.20 0.26
300 m - outer
jurisdiction (14)
B-11 3 4 0.03 0.04 12 17 0.13 0.19
300 m - outer
jurisdiction (15)
B-11 3 3 0.03 0.04 13 16 0.14 0.18
300 m - outer B-11 4 5 0.05 0.05 19 23 0.22 0.26

23
Offshore Resource Locations
Figure Showing Resource Location
Low Estimates High Estimates
Probability Mean Probability Mean
10 days
30 days
10 days
30 days
10 days
30 days
10 days
30 days
jurisdiction (16)
300 m - outer
jurisdiction (17)
B-11 4 5 0.04 0.05 18 22 0.20 0.25
300 m - outer
jurisdiction (18)
B-11 2 3 0.03 0.03 11 14 0.12 0.16
300 m - outer
jurisdiction (19)
B-11 2 2 0.02 0.02 7 11 0.08 0.11
300 m - outer
jurisdiction (20)
B-11 1 2 0.01 0.02 7 10 0.07 0.11
300 m - outer
jurisdiction (21)
B-11 1 1 0.01 0.01 3 6 0.03 0.06
300 m - outer
jurisdiction (22)
B-11 1 2 0.01 0.02 5 9 0.06 0.09
300 m - outer
jurisdiction (23)
B-11 n 1 0.00 0.01 1 3 0.01 0.04
300 m - outer
jurisdiction (24)
B-11 1 2 0.01 0.02 5 10 0.05 0.10
300 m - outer
jurisdiction (25)
B-11 n n 0.00 0.00 n 2 0.00 0.02
300 m - outer
jurisdiction (26)
B-11 n 1 0.00 0.01 1 4 0.01 0.04
300 m - outer
jurisdiction (27)
B-11 n n 0.00 0.00 n 1 0.00 0.01
300 m - outer
jurisdiction (28)
B-11 n n 0.00 0.00 n n 0.00 0.00
300 m - outer
jurisdiction (28)
B-11 n n 0.00 0.00 n n 0.00 0.00
300 m - outer
jurisdiction (30)
B-11 n n 0.00 0.00 n n 0.00 0.00
Mysterious Bank B-14 n n 0.00 0.00 n n 0.00 0.00
Blackfish Ridge Bank B-14 n n 0.00 0.00 n n 0.00 0.00
Dream Bank B-14 n n 0.00 0.00 n n 0.00 0.00
Southern Bank B-14 n n 0.00 0.00 n n 0.00 0.00
Hospital Bank B-14 n n 0.00 0.00 n n 0.00 0.00
North Hospital Bank B-14 n n 0.00 0.00 n n 0.00 0.00
Aransas Bank B-14 n n 0.00 0.00 n n 0.00 0.00
South Baker Bank B-14 n n 0.00 0.00 n n 0.00 0.00
Baker Bank B-14 n n 0.00 0.00 n n 0.00 0.00
Big Dunn Bar Bank B-14 n n 0.00 0.00 n n 0.00 0.00
Small Dunn Bar Bank B-14 n n 0.00 0.00 n n 0.00 0.00
32 Fathom B-14 n n 0.00 0.00 n 1 0.00 0.01
Stetson Bank B-15 n n 0.00 0.00 n n 0.00 0.00

24
Offshore Resource Locations
Figure Showing Resource Location
Low Estimates High Estimates
Probability Mean Probability Mean
10 days
30 days
10 days
30 days
10 days
30 days
10 days
30 days
Claypile Bank B-14 n n 0.00 0.00 n 1 0.00 0.01
Applebaum Bank B-14 n n 0.00 0.00 n 1 0.00 0.01
Coffee Lump Bank B-14 n n 0.00 0.00 1 2 0.01 0.02
East Flower Garden
Bank
B-15 n 1 0.00 0.01 1 3 0.01 0.03
West Flower Garden
Bank
B-15 n n 0.00 0.00 1 3 0.01 0.03
MacNeil Bank B-14 n n 0.00 0.00 1 1 0.01 0.01
29 Fathom Bank B-14 n n 0.00 0.00 n 1 0.00 0.01
Rankin-1 Bank B-14 n n 0.00 0.00 n 1 0.00 0.01
Rankin-2 Bank B-14 n n 0.00 0.00 n 1 0.00 0.01
Bright Bank B-14 n n 0.00 0.00 1 2 0.01 0.02
Geyer Bank B-14 n n 0.00 0.00 1 2 0.01 0.02
Elvers Bank B-14 n n 0.00 0.00 n 1 0.00 0.01
McGrail Bank B-14 n n 0.00 0.00 1 1 0.01 0.01
Sonnier Bank B-15 n n 0.00 0.00 1 1 0.01 0.01
Bouma Bank B-14 n n 0.00 0.00 1 2 0.01 0.02
Rezak Bank B-14 n n 0.00 0.00 1 1 0.01 0.02
Sidner Bank B-14 n n 0.00 0.00 1 1 0.01 0.01
Parker Bank B-14 n n 0.00 0.00 1 2 0.01 0.02
Alderdice Bank B-14 n n 0.00 0.00 1 1 0.01 0.01
Fishnet Bank B-14 n n 0.00 0.00 n 1 0.00 0.01
Sweet Bank B-14 n n 0.00 0.00 n n 0.00 0.00
Jakkula Bank B-14 n n 0.00 0.00 n 1 0.00 0.01
Ewing-1 Bank B-14 n n 0.00 0.00 1 2 0.01 0.02
Ewing-2 Bank B-14 n n 0.00 0.00 1 1 0.01 0.01
Diaphus Bank B-14 n n 0.00 0.00 1 1 0.01 0.01
Sackett Bank B-14 n n 0.00 0.00 1 1 0.01 0.01
Pinnacle Trend B-15 1 2 0.01 0.02 6 8 0.07 0.09
Chandeleur Islands B-15 1 1 0.01 0.01 4 5 0.04 0.05
Florida Middle Ground B-15 n n 0.00 0.00 n n 0.00 0.00
Pulley Ridge B-15 n n 0.00 0.00 n 1 0.00 0.01
Madison Swanson B-15 n n 0.00 0.00 n n 0.00 0.00
Steamboat Lumps B-15 n n 0.00 0.00 n n 0.00 0.00
Dry Tortugas B-15 n n 0.00 0.00 n n 0.00 0.00
Tortugas Ecological
Reserve North
B-15 n n 0.00 0.00 n n 0.00 0.00
Tortugas Ecological
Reserve South
B-15 n n 0.00 0.00 n n 0.00 0.00
Florida Keys National
Marine Sanctuary
B-15 n n 0.00 0.00 n 1 0.00 0.01
Key Biscayne National B-15 n n 0.00 0.00 n n 0.00 0.00

25
Offshore Resource Locations
Figure Showing Resource Location
Low Estimates High Estimates
Probability Mean Probability Mean
10 days
30 days
10 days
30 days
10 days
30 days
10 days
30 days
Park
Texas Clipper and
South Texas Platform*
B-16 n n 0.00 0.00 n 1 0.00 0.01
Port Lavaca/Liberty
Ship Reef*
B-16 1 1 0.01 0.01 3 8 0.04 0.08
High Island* B-16 n 1 0.00 0.01 3 6 0.03 0.06
West Cameron* B-16 1 2 0.01 0.02 5 10 0.05 0.10
Galveston Area (GA
393)*
B-16 n n 0.00 0.00 n 1 0.00 0.01
Cognac Platform (MC
194)*
B-17 n n 0.00 0.00 1 1 0.01 0.01
Horseshoe Rigs (MP
306)*
B-17 n n 0.00 0.00 1 1 0.01 0.01
Vermilion Area* B-16 1 2 0.01 0.02 7 12 0.07 0.13
Vermilion Area, South
Addition*
B-16 1 2 0.01 0.02 6 10 0.07 0.10
Bay Marchand* B-16 n n 0.00 0.00 1 1 0.01 0.01
South Timbalier* B-16 2 2 0.02 0.02 9 12 0.10 0.12
South Timbalier Area,
South Addition*
B-16 1 2 0.01 0.02 7 9 0.07 0.09
Panhandle FL* B-17 n n 0.00 0.00 1 2 0.01 0.02
Tampa* B-17 n n 0.00 0.00 n n 0.00 0.00
SE FL* B-17 n n 0.00 0.00 n n 0.00 0.00
Daytona Beach* B-17 n n 0.00 0.00 n n 0.00 0.00
Jacksonville* B-17 n n 0.00 0.00 n n 0.00 0.00
Notes: * = seasonal (April-November); ** = Greater than 99.5%; n = less than 0.5%
26
Table A-4. Probabilities (expressed as percent chance) of one or more offshore spills ≥1,000 barrels occurring and contacting certain onshore resources within 10 and 30 days for low and
high oil production estimates for Alternative A.
Onshore Resource Locations
Figure Showing Resource Location
Low Estimates High Estimates
Probability Mean Probability Mean
10 days
30 days
10 days
30 days
10 days
30 days
10 days
30 days
Cameron, TX B-3 n n 0.00 0.00 n 1 0.00 0.01
Willacy, TX B-4 n n 0.00 0.00 n n 0.00 0.00
Kenedy, TX B-3 n n 0.00 0.00 n 2 0.00 0.02
Kleberg, TX B-4 n n 0.00 0.00 n 1 0.00 0.01
Nueces, TX B-3 n n 0.00 0.00 n 1 0.00 0.01
Aransas, TX B-4 n n 0.00 0.00 n 1 0.00 0.01
Calhoun, TX B-3 n n 0.00 0.00 1 3 0.01 0.03
Matagorda, TX B-4 n 1 0.00 0.01 2 6 0.02 0.06
Brazoria, TX B-3 n 1 0.00 0.01 1 4 0.01 0.04
Galveston, TX B-4 n 1 0.00 0.01 2 6 0.02 0.06
Chambers, TX B-3 n n 0.00 0.00 n n 0.00 0.00
Jefferson, TX B-4 n n 0.00 0.00 1 3 0.01 0.03
Cameron, LA B-3 n 1 0.00 0.01 2 5 0.02 0.05
Vermilion, LA B-4 n n 0.00 0.00 1 3 0.01 0.03
Iberia, LA B-3 n n 0.00 0.00 1 2 0.01 0.02
St. Mary, LA B-4 n n 0.00 0.00 n n 0.00 0.00
Terrebonne, LA B-3 1 1 0.01 0.01 4 6 0.04 0.06
Lafourche, LA B-4 n 1 0.00 0.01 2 3 0.02 0.03
Jefferson, LA B-3 n n 0.00 0.00 1 2 0.01 0.02
Plaquemines, LA B-4 1 2 0.01 0.02 6 8 0.06 0.09
St. Bernard, LA B-3 n n 0.00 0.00 1 2 0.01 0.02
Hancock, MS B-4 n n 0.00 0.00 n n 0.00 0.00
Harrison, MS B-3 n n 0.00 0.00 n n 0.00 0.00
Jackson, MS B-4 n n 0.00 0.00 1 1 0.01 0.01
Mobile, ALA B-3 n n 0.00 0.00 n 1 0.00 0.01
Baldwin, ALA B-4 n n 0.00 0.00 n 1 0.00 0.01
Escambia, FL B-3 n n 0.00 0.00 n 1 0.00 0.01
Santa Rosa, FL B-4 n n 0.00 0.00 n n 0.00 0.00
Okaloosa, FL B-3 n n 0.00 0.00 n n 0.00 0.00
Walton, FL B-4 n n 0.00 0.00 n n 0.00 0.00
Bay, FL B-3 n n 0.00 0.00 n n 0.00 0.00
Gulf, FL B-4 n n 0.00 0.00 n n 0.00 0.00
Franklin, FL B-3 n n 0.00 0.00 n n 0.00 0.00
Wakulla, FL B-4 n n 0.00 0.00 n n 0.00 0.00
Jefferson, FL B-3 n n 0.00 0.00 n n 0.00 0.00
Taylor, FL B-4 n n 0.00 0.00 n n 0.00 0.00
Dixie, FL B-3 n n 0.00 0.00 n n 0.00 0.00
Levy, FL B-4 n n 0.00 0.00 n n 0.00 0.00

27
Onshore Resource Locations
Figure Showing Resource Location
Low Estimates High Estimates
Probability Mean Probability Mean
10 days
30 days
10 days
30 days
10 days
30 days
10 days
30 days
Citrus, FL B-3 n n 0.00 0.00 n n 0.00 0.00
Hernando, FL B-4 n n 0.00 0.00 n n 0.00 0.00
Pasco, FL B-3 n n 0.00 0.00 n n 0.00 0.00
Pinellas, FL B-4 n n 0.00 0.00 n n 0.00 0.00
Hillsborough, FL B-3 n n 0.00 0.00 n n 0.00 0.00
Manatee, FL B-4 n n 0.00 0.00 n n 0.00 0.00
Sarasota, FL B-3 n n 0.00 0.00 n n 0.00 0.00
Charlotte, FL B-4 n n 0.00 0.00 n n 0.00 0.00
Lee, FL B-3 n n 0.00 0.00 n n 0.00 0.00
Collier, FL B-4 n n 0.00 0.00 n n 0.00 0.00
Monroe, FL B-3 n n 0.00 0.00 n n 0.00 0.00
Dade, FL B-4 n n 0.00 0.00 n n 0.00 0.00
Broward, FL B-3 n n 0.00 0.00 n n 0.00 0.00
Palm Beach, FL B-4 n n 0.00 0.00 n n 0.00 0.00
Martin, FL B-3 n n 0.00 0.00 n n 0.00 0.00
St. Lucie, FL B-4 n n 0.00 0.00 n n 0.00 0.00
Indian River, FL B-3 n n 0.00 0.00 n n 0.00 0.00
Brevard, FL B-4 n n 0.00 0.00 n n 0.00 0.00
Volusia, FL B-3 n n 0.00 0.00 n n 0.00 0.00
Flagler, FL B-4 n n 0.00 0.00 n n 0.00 0.00
St. Johns, FL B-3 n n 0.00 0.00 n n 0.00 0.00
Duval, FL B-4 n n 0.00 0.00 n n 0.00 0.00
Nassau, FL B-3 n n 0.00 0.00 n n 0.00 0.00
TX B-1a 1 5 0.01 0.05 8 24 0.09 0.27
LA B-1a 3 5 0.03 0.06 17 27 0.19 0.31
MS B-1a n n 0.00 0.00 1 2 0.01 0.02
AL B-1a n n 0.00 0.00 1 1 0.01 0.01
FL B-1a n n 0.00 0.00 n 2 0.00 0.02
Tamaulipas, Mexico B-1a n n 0.00 0.00 n 1 0.00 0.01
Veracruz-Llave, Mexico B-1a n n 0.00 0.00 n n 0.00 0.00
Tabasco, Mexico B-1a n n 0.00 0.00 n n 0.00 0.00
Campeche, Mexico B-1a n n 0.00 0.00 n n 0.00 0.00
Yucatan, Mexico B-1a n n 0.00 0.00 n n 0.00 0.00
Quintana Roo, Mexcio B-1a n n 0.00 0.00 n n 0.00 0.00
Belize (country) B-1a n n 0.00 0.00 n n 0.00 0.00
Cuba B-1a n n 0.00 0.00 n n 0.00 0.00
TX Coastal Bend Beach
Area
B-10 n 1 0.00 0.01 1 6 0.01 0.06
TX Matagorda Beach
Area
B-10 n 2 0.01 0.02 3 9 0.03 0.09
TX Galveston Beach Area B-10 1 2 0.01 0.02 4 9 0.04 0.10
TX Sea Rim State Park B-10 n n 0.00 0.00 1 3 0.01 0.03

28
Onshore Resource Locations
Figure Showing Resource Location
Low Estimates High Estimates
Probability Mean Probability Mean
10 days
30 days
10 days
30 days
10 days
30 days
10 days
30 days
LA Beach Areas B-10 1 2 0.01 0.02 5 9 0.05 0.10
AL/MS Gulf Islands B-10 n n 0.00 0.00 1 2 0.01 0.02
AL Gulf Shores B-10 n n 0.00 0.00 n 1 0.00 0.01
FL Panhandle Beach Area B-10 n n 0.00 0.00 n 1 0.00 0.01
FL Big Bend Beach Area B-10 n n 0.00 0.00 n n 0.00 0.00
FL Southwest Beach Area B-10 n n 0.00 0.00 n n 0.00 0.00
FL Ten Thousand Islands
Area
B-10 n n 0.00 0.00 n n 0.00 0.00
FL Southeast Beach Area B-10 n n 0.00 0.00 n n 0.00 0.00
FL Centraleast Beach
Area
B-10 n n 0.00 0.00 n n 0.00 0.00
FL Northeast Beach Area B-10 n n 0.00 0.00 n n 0.00 0.00
Notes: ** = Greater than 99.5%; n = less than 0.5%

29
Table A-5. Probabilities (expressed as percent chance) of one or more offshore spills ≥1,000 barrels occurring and contacting certain offshore resource locations within 10 and 30 days for low
and high oil production estimates for Alternative B.
Offshore Resource Locations
Figure Showing Resource Location
Low Estimates High Estimates
Probability Mean Probability Mean
10 days
30 days
10 days
30 days
10 days
30 days
10 days
30 days
Cayman Islands B-1a n n 0.00 0.00 n n 0.00 0.00
Northwest Bahamas B-1a n n 0.00 0.00 n n 0.00 0.00
Northeast Bahamas B-1a n n 0.00 0.00 n n 0.00 0.00
Midwest Bahamas B-1a n n 0.00 0.00 n n 0.00 0.00
Mideast Bahamas B-1a n n 0.00 0.00 n n 0.00 0.00
South Bahamas B-1a n n 0.00 0.00 n n 0.00 0.00
Jamaica B-1a n n 0.00 0.00 n n 0.00 0.00
TX State Waters B-2 1 3 0.01 0.03 4 17 0.05 0.19
West LA State Waters B-2 3 5 0.03 0.05 17 26 0.19 0.29
East LA State Waters B-2 1 1 0.01 0.01 6 8 0.06 0.08
MS State Waters B-2 n n 0.00 0.00 1 2 0.01 0.02
AL State Waters B-2 n n 0.00 0.00 1 2 0.01 0.02
FL Panhandle State
Waters
B-2 n n 0.00 0.00 1 2 0.01 0.02
West FL State Waters B-2 n n 0.00 0.00 n n 0.00 0.00
Tortugas State Waters B-2 n n 0.00 0.00 n n 0.00 0.00
Southeast FL State
Waters
B-2 n n 0.00 0.00 n n 0.00 0.00
Northeast State Waters B-2 n n 0.00 0.00 n n 0.00 0.00
Mexican State Waters B-2 n n 0.00 0.00 n n 0.00 0.00
Shoreline - 20 m (1) B-11 n n 0.00 0.00 n n 0.00 0.00
Shoreline - 20 m (2) B-11 n 1 0.00 0.01 n 5 0.00 0.05
Shoreline - 20 m (3) B-11 1 3 0.01 0.03 7 16 0.07 0.18
Shoreline - 20 m (4) B-11 2 4 0.02 0.04 14 20 0.15 0.22
Shoreline - 20 m (5) B-11 4 5 0.04 0.05 20 25 0.22 0.28
Shoreline - 20 m (6) B-11 1 2 0.01 0.02 6 8 0.07 0.08
Shoreline - 20 m (7) B-11 1 1 0.01 0.01 4 5 0.04 0.06
Shoreline - 20 m (8) B-11 n n 0.00 0.00 1 2 0.01 0.02
Shoreline - 20 m (9) B-11 n n 0.00 0.00 n 2 0.00 0.02
Shoreline - 20 m (10) B-11 n n 0.00 0.00 n n 0.00 0.00
Shoreline - 20 m (11) B-11 n n 0.00 0.00 n n 0.00 0.00
Shoreline - 20 m (12) B-11 n n 0.00 0.00 n 1 0.00 0.01
Shoreline - 20 m (13) B-11 n n 0.00 0.00 n n 0.00 0.00
Shoreline - 20 m (14) B-11 n n 0.00 0.00 n n 0.00 0.00
Shoreline - 20 m (15) B-11 n n 0.00 0.00 n n 0.00 0.00
20 m - 300 m (1) B-11 n 1 0.00 0.01 1 7 0.01 0.08
20 m - 300 m (2) B-11 2 4 0.02 0.05 11 23 0.12 0.26
20 m - 300 m (3) B-11 5 7 0.05 0.07 26 33 0.31 0.40

30
Offshore Resource Locations
Figure Showing Resource Location
Low Estimates High Estimates
Probability Mean Probability Mean
10 days
30 days
10 days
30 days
10 days
30 days
10 days
30 days
20 m - 300 m (4) B-11 6 7 0.06 0.07 28 33 0.33 0.40
20 m - 300 m (5) B-11 1 2 0.01 0.02 7 9 0.08 0.10
20 m - 300 m (6) B-11 2 2 0.02 0.02 9 11 0.10 0.12
20 m - 300 m (7) B-11 1 2 0.01 0.02 7 9 0.08 0.10
20 m - 300 m (8) B-11 n 1 0.00 0.01 2 5 0.02 0.05
20 m - 300 m (9) B-11 n n 0.00 0.00 n 2 0.00 0.02
20 m - 300 m (10) B-11 n n 0.00 0.00 n 1 0.00 0.01
20 m - 300 m (11) B-11 n n 0.00 0.00 n 1 0.00 0.01
20 m - 300 m (12) B-11 n n 0.00 0.00 n n 0.00 0.00
20 m - 300 m (13) B-11 n n 0.00 0.00 n n 0.00 0.00
20 m - 300 m (14) B-11 n n 0.00 0.00 n n 0.00 0.00
300 m - outer
jurisdiction (1)
B-11 n 1 0.00 0.02 1 8 0.01 0.08
300 m - outer
jurisdiction (2)
B-11 n 2 0.00 0.02 1 8 0.01 0.08
300 m - outer
jurisdiction (3)
B-11 1 3 0.01 0.03 4 13 0.04 0.14
300 m - outer
jurisdiction (4)
B-11 1 3 0.01 0.03 4 13 0.04 0.14
300 m - outer
jurisdiction (5)
B-11 n 2 0.00 0.02 2 8 0.02 0.09
300 m - outer
jurisdiction (6)
B-11 3 4 0.03 0.04 12 20 0.13 0.22
300 m - outer
jurisdiction (7)
B-11 3 4 0.03 0.04 12 19 0.12 0.21
300 m - outer
jurisdiction (8)
B-11 2 3 0.02 0.03 8 14 0.08 0.15
300 m - outer
jurisdiction (9)
B-11 3 4 0.03 0.05 15 21 0.17 0.23
300 m - outer
jurisdiction (10)
B-11 4 5 0.04 0.05 17 23 0.18 0.26
300 m - outer
jurisdiction (11)
B-11 3 4 0.03 0.04 11 17 0.12 0.19
300 m - outer
jurisdiction (12)
B-11 4 5 0.04 0.06 20 25 0.23 0.29
300 m - outer
jurisdiction (13)
B-11 4 5 0.04 0.05 18 23 0.20 0.26
300 m - outer
jurisdiction (14)
B-11 3 4 0.03 0.04 12 17 0.12 0.19
300 m - outer
jurisdiction (15)
B-11 3 3 0.03 0.04 13 16 0.14 0.18

31
Offshore Resource Locations
Figure Showing Resource Location
Low Estimates High Estimates
Probability Mean Probability Mean
10 days
30 days
10 days
30 days
10 days
30 days
10 days
30 days
300 m - outer
jurisdiction (16)
B-11 4 5 0.05 0.05 19 23 0.22 0.26
300 m - outer
jurisdiction (17)
B-11 4 5 0.04 0.05 18 22 0.20 0.25
300 m - outer
jurisdiction (18)
B-11 2 3 0.03 0.03 11 14 0.12 0.16
300 m - outer
jurisdiction (19)
B-11 2 2 0.02 0.02 7 11 0.08 0.11
300 m - outer
jurisdiction (20)
B-11 1 2 0.01 0.02 7 10 0.07 0.11
300 m - outer
jurisdiction (21)
B-11 1 1 0.01 0.01 3 6 0.03 0.06
300 m - outer
jurisdiction (22)
B-11 1 2 0.01 0.02 5 9 0.06 0.09
300 m - outer
jurisdiction (23)
B-11 n 1 0.00 0.01 1 3 0.01 0.04
300 m - outer
jurisdiction (24)
B-11 1 2 0.01 0.02 5 10 0.05 0.10
300 m - outer
jurisdiction (25)
B-11 n n 0.00 0.00 n 2 0.00 0.02
300 m - outer
jurisdiction (26)
B-11 n 1 0.00 0.01 1 4 0.01 0.04
300 m - outer
jurisdiction (27)
B-11 n n 0.00 0.00 n 1 0.00 0.01
300 m - outer
jurisdiction (28)
B-11 n n 0.00 0.00 n n 0.00 0.00
300 m - outer
jurisdiction (28)
B-11 n n 0.00 0.00 n n 0.00 0.00
300 m - outer
jurisdiction (30)
B-11 n n 0.00 0.00 n n 0.00 0.00
Mysterious Bank B-14 n n 0.00 0.00 n n 0.00 0.00
Blackfish Ridge Bank B-14 n n 0.00 0.00 n n 0.00 0.00
Dream Bank B-14 n n 0.00 0.00 n n 0.00 0.00
Southern Bank B-14 n n 0.00 0.00 n n 0.00 0.00
Hospital Bank B-14 n n 0.00 0.00 n n 0.00 0.00
North Hospital Bank B-14 n n 0.00 0.00 n n 0.00 0.00
Aransas Bank B-14 n n 0.00 0.00 n n 0.00 0.00
South Baker Bank B-14 n n 0.00 0.00 n n 0.00 0.00
Baker Bank B-14 n n 0.00 0.00 n n 0.00 0.00
Big Dunn Bar Bank B-14 n n 0.00 0.00 n n 0.00 0.00
Small Dunn Bar Bank B-14 n n 0.00 0.00 n n 0.00 0.00
32 Fathom B-14 n n 0.00 0.00 n 1 0.00 0.01

32
Offshore Resource Locations
Figure Showing Resource Location
Low Estimates High Estimates
Probability Mean Probability Mean
10 days
30 days
10 days
30 days
10 days
30 days
10 days
30 days
Stetson Bank B-15 n n 0.00 0.00 n n 0.00 0.00
Claypile Bank B-14 n n 0.00 0.00 n 1 0.00 0.01
Applebaum Bank B-14 n n 0.00 0.00 n n 0.00 0.00
Coffee Lump Bank B-14 n n 0.00 0.00 n 1 0.00 0.01
East Flower Garden
Bank
B-15 n n 0.00 0.00 1 2 0.01 0.02
West Flower Garden
Bank
B-15 n n 0.00 0.00 1 2 0.01 0.02
MacNeil Bank B-14 n n 0.00 0.00 n 1 0.00 0.01
29 Fathom Bank B-14 n n 0.00 0.00 n 1 0.00 0.01
Rankin-1 Bank B-14 n n 0.00 0.00 n 1 0.00 0.01
Rankin-2 Bank B-14 n n 0.00 0.00 n 1 0.00 0.01
Bright Bank B-14 n n 0.00 0.00 1 1 0.01 0.02
Geyer Bank B-14 n n 0.00 0.00 1 2 0.01 0.02
Elvers Bank B-14 n n 0.00 0.00 n n 0.00 0.00
McGrail Bank B-14 n n 0.00 0.00 1 1 0.01 0.01
Sonnier Bank B-15 n n 0.00 0.00 1 1 0.01 0.01
Bouma Bank B-14 n n 0.00 0.00 1 2 0.01 0.02
Rezak Bank B-14 n n 0.00 0.00 1 1 0.01 0.01
Sidner Bank B-14 n n 0.00 0.00 1 1 0.01 0.01
Parker Bank B-14 n n 0.00 0.00 1 2 0.01 0.02
Alderdice Bank B-14 n n 0.00 0.00 1 1 0.01 0.01
Fishnet Bank B-14 n n 0.00 0.00 n 1 0.00 0.01
Sweet Bank B-14 n n 0.00 0.00 n n 0.00 0.00
Jakkula Bank B-14 n n 0.00 0.00 n 1 0.00 0.01
Ewing-1 Bank B-14 n n 0.00 0.00 1 2 0.01 0.02
Ewing-2 Bank B-14 n n 0.00 0.00 1 1 0.01 0.01
Diaphus Bank B-14 n n 0.00 0.00 1 1 0.01 0.01
Sackett Bank B-14 n n 0.00 0.00 1 1 0.01 0.01
Pinnacle Trend B-15 1 2 0.01 0.02 6 8 0.07 0.09
Chandeleur Islands B-15 1 1 0.01 0.01 4 5 0.04 0.05
Florida Middle Ground B-15 n n 0.00 0.00 n n 0.00 0.00
Pulley Ridge B-15 n n 0.00 0.00 n 1 0.00 0.01
Madison Swanson B-15 n n 0.00 0.00 n n 0.00 0.00
Steamboat Lumps B-15 n n 0.00 0.00 n n 0.00 0.00
Dry Tortugas B-15 n n 0.00 0.00 n n 0.00 0.00
Tortugas Ecological
Reserve North
B-15 n n 0.00 0.00 n n 0.00 0.00
Tortugas Ecological
Reserve South
B-15 n n 0.00 0.00 n n 0.00 0.00
Florida Keys National
Marine Sanctuary
B-15 n n 0.00 0.00 n 1 0.00 0.01

33
Offshore Resource Locations
Figure Showing Resource Location
Low Estimates High Estimates
Probability Mean Probability Mean
10 days
30 days
10 days
30 days
10 days
30 days
10 days
30 days
Key Biscayne National
Park
B-15 n n 0.00 0.00 n n 0.00 0.00
Texas Clipper and
South Texas Platform*
B-16 n n 0.00 0.00 n 1 0.00 0.01
Port Lavaca/Liberty
Ship Reef*
B-16 n 1 0.00 0.01 2 6 0.02 0.06
High Island* B-16 n 1 0.00 0.01 2 5 0.02 0.05
West Cameron* B-16 1 2 0.01 0.02 5 9 0.05 0.09
Galveston Area (GA
393)*
B-16 n n 0.00 0.00 n 1 0.00 0.01
Cognac Platform (MC
194)*
B-17 n n 0.00 0.00 1 1 0.01 0.01
Horseshoe Rigs (MP
306)*
B-17 n n 0.00 0.00 1 1 0.01 0.01
Vermilion Area* B-16 1 2 0.01 0.02 7 12 0.07 0.12
Vermilion Area, South
Addition*
B-16 1 2 0.01 0.02 6 10 0.06 0.10
Bay Marchand* B-16 n n 0.00 0.00 1 1 0.01 0.01
South Timbalier* B-16 2 2 0.02 0.02 9 12 0.10 0.12
South Timbalier Area,
South Addition*
B-16 1 2 0.01 0.02 7 9 0.07 0.09
Panhandle FL* B-17 n n 0.00 0.00 1 2 0.01 0.02
Tampa* B-17 n n 0.00 0.00 n n 0.00 0.00
SE FL* B-17 n n 0.00 0.00 n n 0.00 0.00
Daytona Beach* B-17 n n 0.00 0.00 n n 0.00 0.00
Jacksonville* B-17 n n 0.00 0.00 n n 0.00 0.00
Notes: * = seasonal (April-November); ** = Greater than 99.5%; n = less than 0.5%

34
Table A-6. Probabilities (expressed as percent chance) of one or more offshore spills ≥1,000 barrels occurring and contacting certain onshore resource locations within 10 and 30 days for low
and high oil production estimates for Alternative B.
Onshore Resource Locations
Figure Showing Resource Location
Low Estimates High Estimates
Probability Mean Probability Mean
10 days
30 days
10 days
30 days
10 days
30 days
10 days
30 days
Cameron, TX B-3 n n 0.00 0.00 n n 0.00 0.00
Willacy, TX B-4 n n 0.00 0.00 n n 0.00 0.00
Kenedy, TX B-3 n n 0.00 0.00 n 1 0.00 0.01
Kleberg, TX B-4 n n 0.00 0.00 n n 0.00 0.00
Nueces, TX B-3 n n 0.00 0.00 n n 0.00 0.00
Aransas, TX B-4 n n 0.00 0.00 n 1 0.00 0.01
Calhoun, TX B-3 n n 0.00 0.00 n 1 0.00 0.01
Matagorda, TX B-4 n 1 0.00 0.01 n 3 0.00 0.03
Brazoria, TX B-3 n n 0.00 0.00 1 2 0.01 0.02
Galveston, TX B-4 n 1 0.00 0.01 1 5 0.02 0.05
Chambers, TX B-3 n n 0.00 0.00 n n 0.00 0.00
Jefferson, TX B-4 n n 0.00 0.00 1 2 0.01 0.02
Cameron, LA B-3 n 1 0.00 0.01 2 5 0.02 0.05
Vermilion, LA B-4 n n 0.00 0.00 1 3 0.01 0.03
Iberia, LA B-3 n n 0.00 0.00 1 2 0.01 0.02
St. Mary, LA B-4 n n 0.00 0.00 n n 0.00 0.00
Terrebonne, LA B-3 1 1 0.01 0.01 4 6 0.04 0.06
Lafourche, LA B-4 n 1 0.00 0.01 2 3 0.02 0.03
Jefferson, LA B-3 n n 0.00 0.00 1 2 0.01 0.02
Plaquemines, LA B-4 1 2 0.01 0.02 6 8 0.06 0.08
St. Bernard, LA B-3 n n 0.00 0.00 1 2 0.01 0.02
Hancock, MS B-4 n n 0.00 0.00 n n 0.00 0.00
Harrison, MS B-3 n n 0.00 0.00 n n 0.00 0.00
Jackson, MS B-4 n n 0.00 0.00 1 1 0.01 0.01
Mobile, ALA B-3 n n 0.00 0.00 n 1 0.00 0.01
Baldwin, ALA B-4 n n 0.00 0.00 n 1 0.00 0.01
Escambia, FL B-3 n n 0.00 0.00 n 1 0.00 0.01
Santa Rosa, FL B-4 n n 0.00 0.00 n n 0.00 0.00
Okaloosa, FL B-3 n n 0.00 0.00 n n 0.00 0.00
Walton, FL B-4 n n 0.00 0.00 n n 0.00 0.00
Bay, FL B-3 n n 0.00 0.00 n n 0.00 0.00
Gulf, FL B-4 n n 0.00 0.00 n n 0.00 0.00
Franklin, FL B-3 n n 0.00 0.00 n n 0.00 0.00
Wakulla, FL B-4 n n 0.00 0.00 n n 0.00 0.00
Jefferson, FL B-3 n n 0.00 0.00 n n 0.00 0.00
Taylor, FL B-4 n n 0.00 0.00 n n 0.00 0.00
Dixie, FL B-3 n n 0.00 0.00 n n 0.00 0.00
Levy, FL B-4 n n 0.00 0.00 n n 0.00 0.00

35
Onshore Resource Locations
Figure Showing Resource Location
Low Estimates High Estimates
Probability Mean Probability Mean
10 days
30 days
10 days
30 days
10 days
30 days
10 days
30 days
Citrus, FL B-3 n n 0.00 0.00 n n 0.00 0.00
Hernando, FL B-4 n n 0.00 0.00 n n 0.00 0.00
Pasco, FL B-3 n n 0.00 0.00 n n 0.00 0.00
Pinellas, FL B-4 n n 0.00 0.00 n n 0.00 0.00
Hillsborough, FL B-3 n n 0.00 0.00 n n 0.00 0.00
Manatee, FL B-4 n n 0.00 0.00 n n 0.00 0.00
Sarasota, FL B-3 n n 0.00 0.00 n n 0.00 0.00
Charlotte, FL B-4 n n 0.00 0.00 n n 0.00 0.00
Lee, FL B-3 n n 0.00 0.00 n n 0.00 0.00
Collier, FL B-4 n n 0.00 0.00 n n 0.00 0.00
Monroe, FL B-3 n n 0.00 0.00 n n 0.00 0.00
Dade, FL B-4 n n 0.00 0.00 n n 0.00 0.00
Broward, FL B-3 n n 0.00 0.00 n n 0.00 0.00
Palm Beach, FL B-4 n n 0.00 0.00 n n 0.00 0.00
Martin, FL B-3 n n 0.00 0.00 n n 0.00 0.00
St. Lucie, FL B-4 n n 0.00 0.00 n n 0.00 0.00
Indian River, FL B-3 n n 0.00 0.00 n n 0.00 0.00
Brevard, FL B-4 n n 0.00 0.00 n n 0.00 0.00
Volusia, FL B-3 n n 0.00 0.00 n n 0.00 0.00
Flagler, FL B-4 n n 0.00 0.00 n n 0.00 0.00
St. Johns, FL B-3 n n 0.00 0.00 n n 0.00 0.00
Duval, FL B-4 n n 0.00 0.00 n n 0.00 0.00
Nassau, FL B-3 n n 0.00 0.00 n n 0.00 0.00
TX B-1a 1 3 0.01 0.03 4 16 0.04 0.17
LA B-1a 3 5 0.03 0.05 17 26 0.19 0.30
MS B-1a n n 0.00 0.00 1 2 0.01 0.02
AL B-1a n n 0.00 0.00 1 1 0.01 0.01
FL B-1a n n 0.00 0.00 n 2 0.00 0.02
Tamaulipas, Mexico B-1a n n 0.00 0.00 n n 0.00 0.00
Veracruz-Llave,
Mexico
B-1a n n 0.00 0.00 n n 0.00 0.00
Tabasco, Mexico B-1a n n 0.00 0.00 n n 0.00 0.00
Campeche, Mexico B-1a n n 0.00 0.00 n n 0.00 0.00
Yucatan, Mexico B-1a n n 0.00 0.00 n n 0.00 0.00
Quintana Roo, Mexcio B-1a n n 0.00 0.00 n n 0.00 0.00
Belize (country) B-1a n n 0.00 0.00 n n 0.00 0.00
Cuba B-1a n n 0.00 0.00 n n 0.00 0.00
TX Coastal Bend
Beach Area
B-10 n n 0.00 0.00 n 3 0.00 0.03
TX Matagorda Beach
Area
B-10 n 1 0.00 0.01 1 5 0.01 0.05

36
Onshore Resource Locations
Figure Showing Resource Location
Low Estimates High Estimates
Probability Mean Probability Mean
10 days
30 days
10 days
30 days
10 days
30 days
10 days
30 days
TX Galveston Beach
Area
B-10 n 1 0.00 0.01 2 7 0.02 0.07
TX Sea Rim State Park B-10 n n 0.00 0.00 1 2 0.01 0.02
LA Beach Areas B-10 1 2 0.01 0.02 5 9 0.05 0.09
AL/MS Gulf Islands B-10 n n 0.00 0.00 1 2 0.01 0.02
AL Gulf Shores B-10 n n 0.00 0.00 n 1 0.00 0.01
FL Panhandle Beach
Area
B-10 n n 0.00 0.00 n 1 0.00 0.01
FL Big Bend Beach
Area
B-10 n n 0.00 0.00 n n 0.00 0.00
FL Southwest Beach
Area
B-10 n n 0.00 0.00 n n 0.00 0.00
FL Ten Thousand
Islands Area
B-10 n n 0.00 0.00 n n 0.00 0.00
FL Southeast Beach
Area
B-10 n n 0.00 0.00 n n 0.00 0.00
FL Centraleast Beach
Area
B-10 n n 0.00 0.00 n n 0.00 0.00
FL Northeast Beach
Area
B-10 n n 0.00 0.00 n n 0.00 0.00
Notes: ** = Greater than 99.5%; n = less than 0.5%

37
Table A-7. Probabilities (expressed as percent chance) of one or more offshore spills ≥1,000 barrels occurring and contacting certain offshore resource locations within 10 and 30 days for low
and high oil production estimates for Alternative C.
Offshore Resource Locations
Figure Showing Resource Location
Low Estimates High Estimates
Probability Mean Probability Mean
10 days
30 days
10 days
30 days
10 days
30 days
10 days
30 days
Cayman Islands B-1a n n 0.00 0.00 n n 0.00 0.00
Northwest Bahamas B-1a n n 0.00 0.00 n n 0.00 0.00
Northeast Bahamas B-1a n n 0.00 0.00 n n 0.00 0.00
Midwest Bahamas B-1a n n 0.00 0.00 n n 0.00 0.00
Mideast Bahamas B-1a n n 0.00 0.00 n n 0.00 0.00
South Bahamas B-1a n n 0.00 0.00 n n 0.00 0.00
Jamaica B-1a n n 0.00 0.00 n n 0.00 0.00
TX State Waters B-2 1 2 0.01 0.02 6 11 0.06 0.11
West LA State Waters B-2 n n 0.00 0.00 n 1 0.00 0.01
East LA State Waters B-2 n n 0.00 0.00 n n 0.00 0.00
MS State Waters B-2 n n 0.00 0.00 n n 0.00 0.00
AL State Waters B-2 n n 0.00 0.00 n n 0.00 0.00
FL Panhandle State
Waters
B-2 n n 0.00 0.00 n n 0.00 0.00
West FL State Waters B-2 n n 0.00 0.00 n n 0.00 0.00
Tortugas State Waters B-2 n n 0.00 0.00 n n 0.00 0.00
Southeast FL State
Waters
B-2 n n 0.00 0.00 n n 0.00 0.00
Northeast State Waters B-2 n n 0.00 0.00 n n 0.00 0.00
Mexican State Waters B-2 n n 0.00 0.00 n 1 0.00 0.01
Shoreline - 20 m (1) B-11 n n 0.00 0.00 n n 0.00 0.00
Shoreline - 20 m (2) B-11 n 1 0.00 0.01 2 5 0.03 0.05
Shoreline - 20 m (3) B-11 1 1 0.01 0.01 5 7 0.05 0.07
Shoreline - 20 m (4) B-11 n n 0.00 0.00 n 1 0.00 0.01
Shoreline - 20 m (5) B-11 n n 0.00 0.00 n n 0.00 0.00
Shoreline - 20 m (6) B-11 n n 0.00 0.00 n n 0.00 0.00
Shoreline - 20 m (7) B-11 n n 0.00 0.00 n n 0.00 0.00
Shoreline - 20 m (8) B-11 n n 0.00 0.00 n n 0.00 0.00
Shoreline - 20 m (9) B-11 n n 0.00 0.00 n n 0.00 0.00
Shoreline - 20 m (10) B-11 n n 0.00 0.00 n n 0.00 0.00
Shoreline - 20 m (11) B-11 n n 0.00 0.00 n n 0.00 0.00
Shoreline - 20 m (12) B-11 n n 0.00 0.00 n n 0.00 0.00
Shoreline - 20 m (13) B-11 n n 0.00 0.00 n n 0.00 0.00
Shoreline - 20 m (14) B-11 n n 0.00 0.00 n n 0.00 0.00
Shoreline - 20 m (15) B-11 n n 0.00 0.00 n n 0.00 0.00
20 m - 300 m (1) B-11 1 1 0.01 0.01 4 7 0.05 0.07
20 m - 300 m (2) B-11 2 2 0.02 0.02 10 11 0.10 0.11
20 m - 300 m (3) B-11 n n 0.00 0.00 1 2 0.01 0.02

38
Offshore Resource Locations
Figure Showing Resource Location
Low Estimates High Estimates
Probability Mean Probability Mean
10 days
30 days
10 days
30 days
10 days
30 days
10 days
30 days
20 m - 300 m (4) B-11 n n 0.00 0.00 n n 0.00 0.00
20 m - 300 m (5) B-11 n n 0.00 0.00 n n 0.00 0.00
20 m - 300 m (6) B-11 n n 0.00 0.00 n n 0.00 0.00
20 m - 300 m (7) B-11 n n 0.00 0.00 n n 0.00 0.00
20 m - 300 m (8) B-11 n n 0.00 0.00 n n 0.00 0.00
20 m - 300 m (9) B-11 n n 0.00 0.00 n n 0.00 0.00
20 m - 300 m (10) B-11 n n 0.00 0.00 n n 0.00 0.00
20 m - 300 m (11) B-11 n n 0.00 0.00 n n 0.00 0.00
20 m - 300 m (12) B-11 n n 0.00 0.00 n n 0.00 0.00
20 m - 300 m (13) B-11 n n 0.00 0.00 n n 0.00 0.00
20 m - 300 m (14) B-11 n n 0.00 0.00 n n 0.00 0.00
300 m - outer
jurisdiction (1)
B-11 1 1 0.01 0.01 5 7 0.05 0.07
300 m - outer
jurisdiction (2)
B-11 1 1 0.01 0.01 5 6 0.05 0.06
300 m - outer
jurisdiction (3)
B-11 1 1 0.01 0.01 5 6 0.05 0.06
300 m - outer
jurisdiction (4)
B-11 1 1 0.01 0.01 6 7 0.06 0.07
300 m - outer
jurisdiction (5)
B-11 1 1 0.01 0.01 3 4 0.03 0.04
300 m - outer
jurisdiction (6)
B-11 n n 0.00 0.00 2 2 0.02 0.02
300 m - outer
jurisdiction (7)
B-11 n n 0.00 0.00 1 2 0.01 0.02
300 m - outer
jurisdiction (8)
B-11 n n 0.00 0.00 1 1 0.01 0.02
300 m - outer
jurisdiction (9)
B-11 n n 0.00 0.00 n n 0.00 0.00
300 m - outer
jurisdiction (10)
B-11 n n 0.00 0.00 n 1 0.00 0.01
300 m - outer
jurisdiction (11)
B-11 n n 0.00 0.00 n n 0.00 0.00
300 m - outer
jurisdiction (12)
B-11 n n 0.00 0.00 n n 0.00 0.00
300 m - outer
jurisdiction (13)
B-11 n n 0.00 0.00 n n 0.00 0.00
300 m - outer
jurisdiction (14)
B-11 n n 0.00 0.00 n n 0.00 0.00
300 m - outer
jurisdiction (15)
B-11 n n 0.00 0.00 n n 0.00 0.00
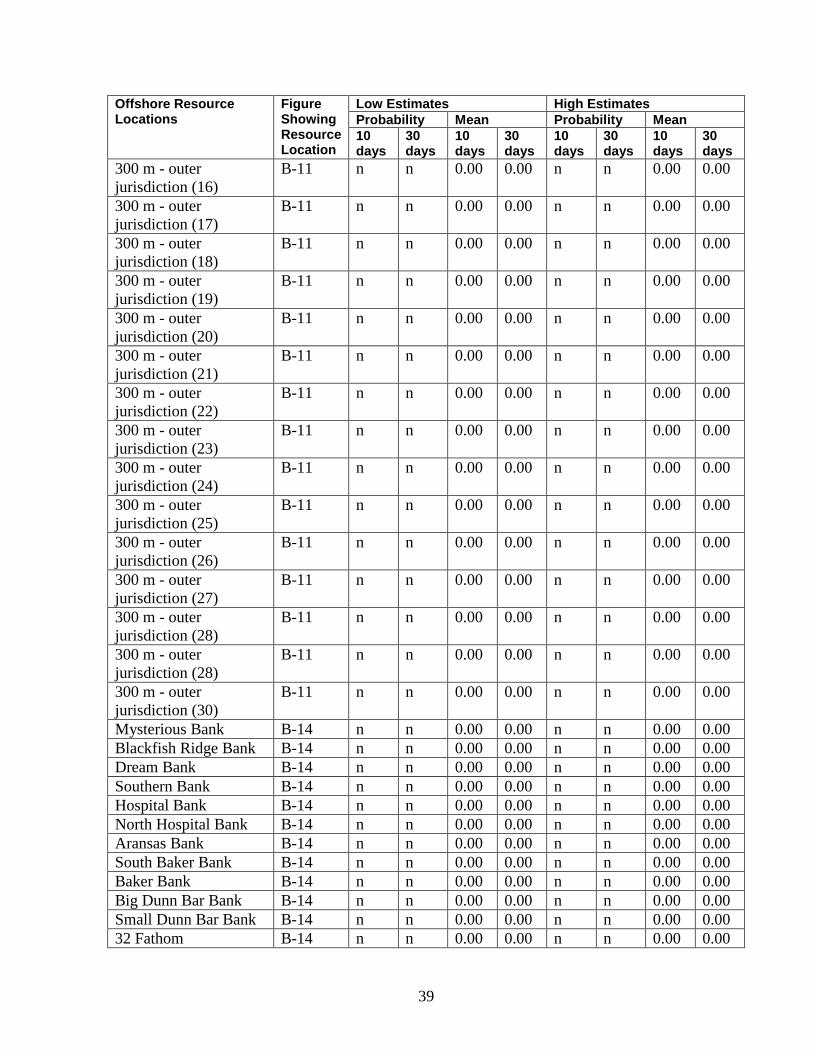
39
Offshore Resource Locations
Figure Showing Resource Location
Low Estimates High Estimates
Probability Mean Probability Mean
10 days
30 days
10 days
30 days
10 days
30 days
10 days
30 days
300 m - outer
jurisdiction (16)
B-11 n n 0.00 0.00 n n 0.00 0.00
300 m - outer
jurisdiction (17)
B-11 n n 0.00 0.00 n n 0.00 0.00
300 m - outer
jurisdiction (18)
B-11 n n 0.00 0.00 n n 0.00 0.00
300 m - outer
jurisdiction (19)
B-11 n n 0.00 0.00 n n 0.00 0.00
300 m - outer
jurisdiction (20)
B-11 n n 0.00 0.00 n n 0.00 0.00
300 m - outer
jurisdiction (21)
B-11 n n 0.00 0.00 n n 0.00 0.00
300 m - outer
jurisdiction (22)
B-11 n n 0.00 0.00 n n 0.00 0.00
300 m - outer
jurisdiction (23)
B-11 n n 0.00 0.00 n n 0.00 0.00
300 m - outer
jurisdiction (24)
B-11 n n 0.00 0.00 n n 0.00 0.00
300 m - outer
jurisdiction (25)
B-11 n n 0.00 0.00 n n 0.00 0.00
300 m - outer
jurisdiction (26)
B-11 n n 0.00 0.00 n n 0.00 0.00
300 m - outer
jurisdiction (27)
B-11 n n 0.00 0.00 n n 0.00 0.00
300 m - outer
jurisdiction (28)
B-11 n n 0.00 0.00 n n 0.00 0.00
300 m - outer
jurisdiction (28)
B-11 n n 0.00 0.00 n n 0.00 0.00
300 m - outer
jurisdiction (30)
B-11 n n 0.00 0.00 n n 0.00 0.00
Mysterious Bank B-14 n n 0.00 0.00 n n 0.00 0.00
Blackfish Ridge Bank B-14 n n 0.00 0.00 n n 0.00 0.00
Dream Bank B-14 n n 0.00 0.00 n n 0.00 0.00
Southern Bank B-14 n n 0.00 0.00 n n 0.00 0.00
Hospital Bank B-14 n n 0.00 0.00 n n 0.00 0.00
North Hospital Bank B-14 n n 0.00 0.00 n n 0.00 0.00
Aransas Bank B-14 n n 0.00 0.00 n n 0.00 0.00
South Baker Bank B-14 n n 0.00 0.00 n n 0.00 0.00
Baker Bank B-14 n n 0.00 0.00 n n 0.00 0.00
Big Dunn Bar Bank B-14 n n 0.00 0.00 n n 0.00 0.00
Small Dunn Bar Bank B-14 n n 0.00 0.00 n n 0.00 0.00
32 Fathom B-14 n n 0.00 0.00 n n 0.00 0.00
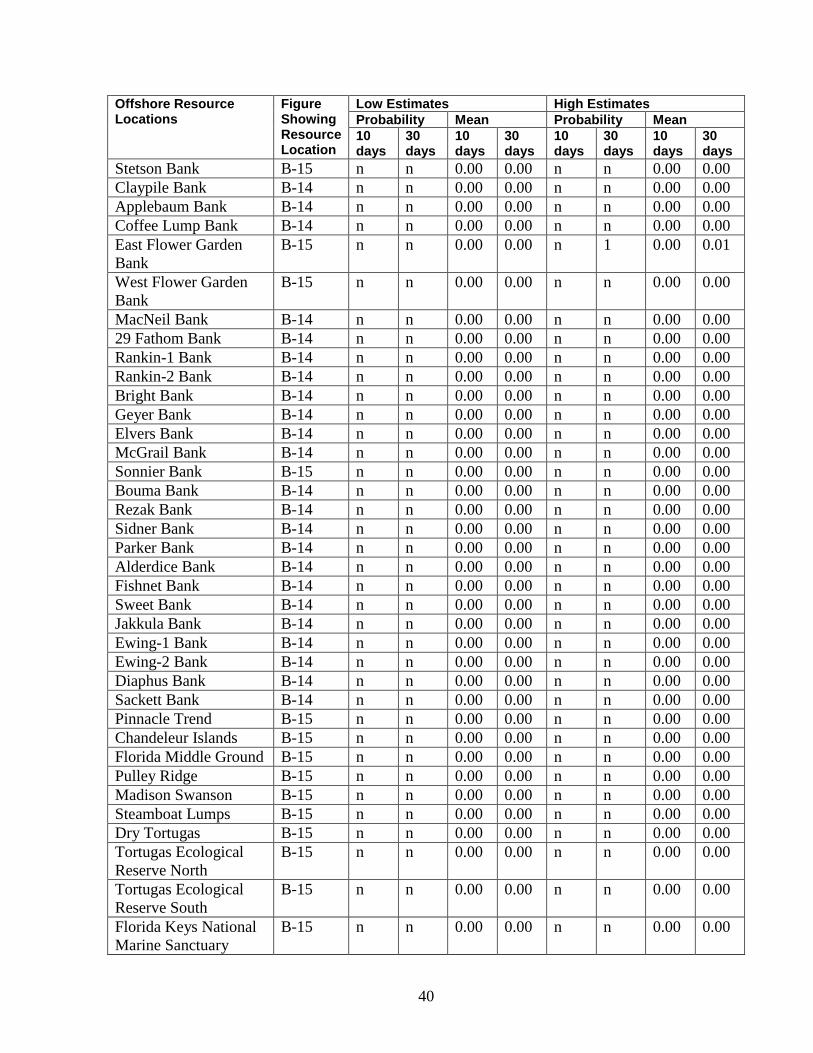
40
Offshore Resource Locations
Figure Showing Resource Location
Low Estimates High Estimates
Probability Mean Probability Mean
10 days
30 days
10 days
30 days
10 days
30 days
10 days
30 days
Stetson Bank B-15 n n 0.00 0.00 n n 0.00 0.00
Claypile Bank B-14 n n 0.00 0.00 n n 0.00 0.00
Applebaum Bank B-14 n n 0.00 0.00 n n 0.00 0.00
Coffee Lump Bank B-14 n n 0.00 0.00 n n 0.00 0.00
East Flower Garden
Bank
B-15 n n 0.00 0.00 n 1 0.00 0.01
West Flower Garden
Bank
B-15 n n 0.00 0.00 n n 0.00 0.00
MacNeil Bank B-14 n n 0.00 0.00 n n 0.00 0.00
29 Fathom Bank B-14 n n 0.00 0.00 n n 0.00 0.00
Rankin-1 Bank B-14 n n 0.00 0.00 n n 0.00 0.00
Rankin-2 Bank B-14 n n 0.00 0.00 n n 0.00 0.00
Bright Bank B-14 n n 0.00 0.00 n n 0.00 0.00
Geyer Bank B-14 n n 0.00 0.00 n n 0.00 0.00
Elvers Bank B-14 n n 0.00 0.00 n n 0.00 0.00
McGrail Bank B-14 n n 0.00 0.00 n n 0.00 0.00
Sonnier Bank B-15 n n 0.00 0.00 n n 0.00 0.00
Bouma Bank B-14 n n 0.00 0.00 n n 0.00 0.00
Rezak Bank B-14 n n 0.00 0.00 n n 0.00 0.00
Sidner Bank B-14 n n 0.00 0.00 n n 0.00 0.00
Parker Bank B-14 n n 0.00 0.00 n n 0.00 0.00
Alderdice Bank B-14 n n 0.00 0.00 n n 0.00 0.00
Fishnet Bank B-14 n n 0.00 0.00 n n 0.00 0.00
Sweet Bank B-14 n n 0.00 0.00 n n 0.00 0.00
Jakkula Bank B-14 n n 0.00 0.00 n n 0.00 0.00
Ewing-1 Bank B-14 n n 0.00 0.00 n n 0.00 0.00
Ewing-2 Bank B-14 n n 0.00 0.00 n n 0.00 0.00
Diaphus Bank B-14 n n 0.00 0.00 n n 0.00 0.00
Sackett Bank B-14 n n 0.00 0.00 n n 0.00 0.00
Pinnacle Trend B-15 n n 0.00 0.00 n n 0.00 0.00
Chandeleur Islands B-15 n n 0.00 0.00 n n 0.00 0.00
Florida Middle Ground B-15 n n 0.00 0.00 n n 0.00 0.00
Pulley Ridge B-15 n n 0.00 0.00 n n 0.00 0.00
Madison Swanson B-15 n n 0.00 0.00 n n 0.00 0.00
Steamboat Lumps B-15 n n 0.00 0.00 n n 0.00 0.00
Dry Tortugas B-15 n n 0.00 0.00 n n 0.00 0.00
Tortugas Ecological
Reserve North
B-15 n n 0.00 0.00 n n 0.00 0.00
Tortugas Ecological
Reserve South
B-15 n n 0.00 0.00 n n 0.00 0.00
Florida Keys National
Marine Sanctuary
B-15 n n 0.00 0.00 n n 0.00 0.00
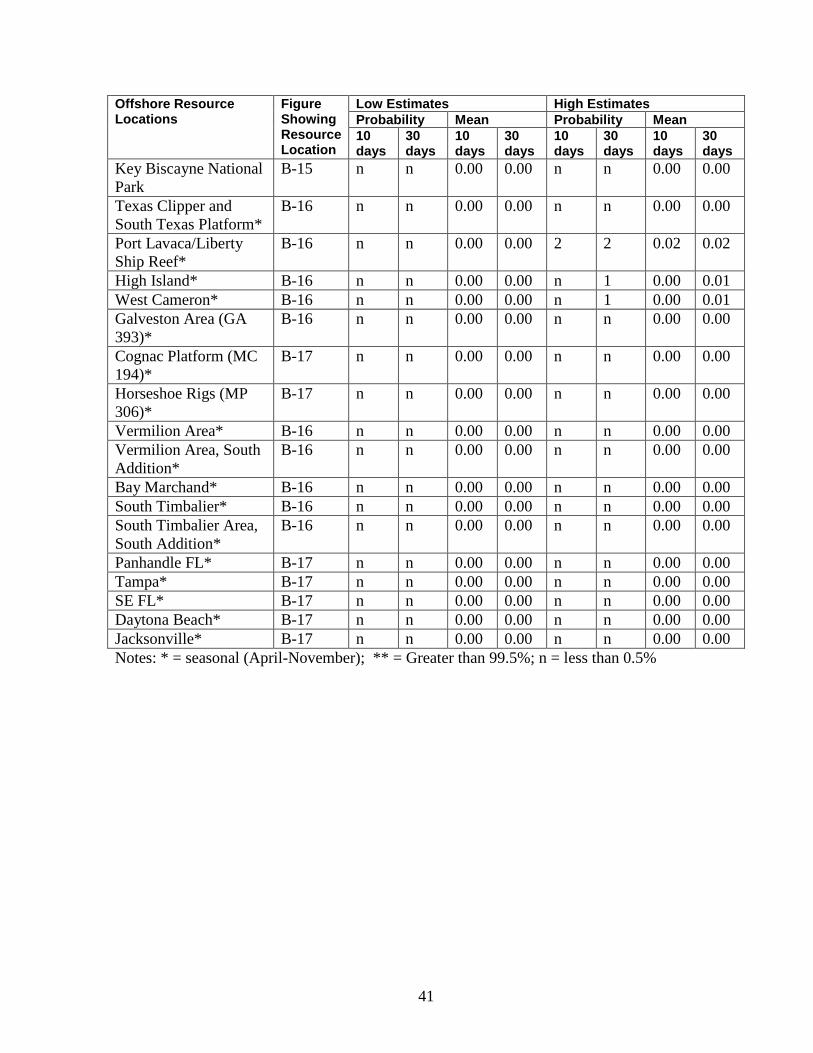
41
Offshore Resource Locations
Figure Showing Resource Location
Low Estimates High Estimates
Probability Mean Probability Mean
10 days
30 days
10 days
30 days
10 days
30 days
10 days
30 days
Key Biscayne National
Park
B-15 n n 0.00 0.00 n n 0.00 0.00
Texas Clipper and
South Texas Platform*
B-16 n n 0.00 0.00 n n 0.00 0.00
Port Lavaca/Liberty
Ship Reef*
B-16 n n 0.00 0.00 2 2 0.02 0.02
High Island* B-16 n n 0.00 0.00 n 1 0.00 0.01
West Cameron* B-16 n n 0.00 0.00 n 1 0.00 0.01
Galveston Area (GA
393)*
B-16 n n 0.00 0.00 n n 0.00 0.00
Cognac Platform (MC
194)*
B-17 n n 0.00 0.00 n n 0.00 0.00
Horseshoe Rigs (MP
306)*
B-17 n n 0.00 0.00 n n 0.00 0.00
Vermilion Area* B-16 n n 0.00 0.00 n n 0.00 0.00
Vermilion Area, South
Addition*
B-16 n n 0.00 0.00 n n 0.00 0.00
Bay Marchand* B-16 n n 0.00 0.00 n n 0.00 0.00
South Timbalier* B-16 n n 0.00 0.00 n n 0.00 0.00
South Timbalier Area,
South Addition*
B-16 n n 0.00 0.00 n n 0.00 0.00
Panhandle FL* B-17 n n 0.00 0.00 n n 0.00 0.00
Tampa* B-17 n n 0.00 0.00 n n 0.00 0.00
SE FL* B-17 n n 0.00 0.00 n n 0.00 0.00
Daytona Beach* B-17 n n 0.00 0.00 n n 0.00 0.00
Jacksonville* B-17 n n 0.00 0.00 n n 0.00 0.00
Notes: * = seasonal (April-November); ** = Greater than 99.5%; n = less than 0.5%

42
Table A-8. Probabilities (expressed as percent chance) of one or more offshore spills ≥1,000 barrels occurring and contacting certain onshore resources within 10 and 30 days for low and
high oil production estimates for Alternative C.
Onshore Resource Locations
Figure Showing Resource Location
Low Estimates High Estimates
Probability Mean Probability Mean
10 days
30 days
10 days
30 days
10 days
30 days
10 days
30 days
Cameron, TX B-3 n n 0.00 0.00 n n 0.00 0.00
Willacy, TX B-4 n n 0.00 0.00 n n 0.00 0.00
Kenedy, TX B-3 n n 0.00 0.00 n 1 0.00 0.01
Kleberg, TX B-4 n n 0.00 0.00 n n 0.00 0.00
Nueces, TX B-3 n n 0.00 0.00 n n 0.00 0.00
Aransas, TX B-4 n n 0.00 0.00 n 1 0.00 0.01
Calhoun, TX B-3 n n 0.00 0.00 n 1 0.00 0.01
Matagorda, TX B-4 n 1 0.00 0.01 n 3 0.00 0.03
Brazoria, TX B-3 n n 0.00 0.00 1 2 0.01 0.02
Galveston, TX B-4 n 1 0.00 0.01 1 5 0.02 0.05
Chambers, TX B-3 n n 0.00 0.00 n n 0.00 0.00
Jefferson, TX B-4 n n 0.00 0.00 1 2 0.01 0.02
Cameron, LA B-3 n 1 0.00 0.01 2 5 0.02 0.05
Vermilion, LA B-4 n n 0.00 0.00 1 3 0.01 0.03
Iberia, LA B-3 n n 0.00 0.00 1 2 0.01 0.02
St. Mary, LA B-4 n n 0.00 0.00 n n 0.00 0.00
Terrebonne, LA B-3 1 1 0.01 0.01 4 6 0.04 0.06
Lafourche, LA B-4 n 1 0.00 0.01 2 3 0.02 0.03
Jefferson, LA B-3 n n 0.00 0.00 1 2 0.01 0.02
Plaquemines, LA B-4 1 2 0.01 0.02 6 8 0.06 0.08
St. Bernard, LA B-3 n n 0.00 0.00 1 2 0.01 0.02
Hancock, MS B-4 n n 0.00 0.00 n n 0.00 0.00
Harrison, MS B-3 n n 0.00 0.00 n n 0.00 0.00
Jackson, MS B-4 n n 0.00 0.00 1 1 0.01 0.01
Mobile, ALA B-3 n n 0.00 0.00 n 1 0.00 0.01
Baldwin, ALA B-4 n n 0.00 0.00 n 1 0.00 0.01
Escambia, FL B-3 n n 0.00 0.00 n 1 0.00 0.01
Santa Rosa, FL B-4 n n 0.00 0.00 n n 0.00 0.00
Okaloosa, FL B-3 n n 0.00 0.00 n n 0.00 0.00
Walton, FL B-4 n n 0.00 0.00 n n 0.00 0.00
Bay, FL B-3 n n 0.00 0.00 n n 0.00 0.00
Gulf, FL B-4 n n 0.00 0.00 n n 0.00 0.00
Franklin, FL B-3 n n 0.00 0.00 n n 0.00 0.00
Wakulla, FL B-4 n n 0.00 0.00 n n 0.00 0.00
Jefferson, FL B-3 n n 0.00 0.00 n n 0.00 0.00
Taylor, FL B-4 n n 0.00 0.00 n n 0.00 0.00
Dixie, FL B-3 n n 0.00 0.00 n n 0.00 0.00
Levy, FL B-4 n n 0.00 0.00 n n 0.00 0.00

43
Onshore Resource Locations
Figure Showing Resource Location
Low Estimates High Estimates
Probability Mean Probability Mean
10 days
30 days
10 days
30 days
10 days
30 days
10 days
30 days
Citrus, FL B-3 n n 0.00 0.00 n n 0.00 0.00
Hernando, FL B-4 n n 0.00 0.00 n n 0.00 0.00
Pasco, FL B-3 n n 0.00 0.00 n n 0.00 0.00
Pinellas, FL B-4 n n 0.00 0.00 n n 0.00 0.00
Hillsborough, FL B-3 n n 0.00 0.00 n n 0.00 0.00
Manatee, FL B-4 n n 0.00 0.00 n n 0.00 0.00
Sarasota, FL B-3 n n 0.00 0.00 n n 0.00 0.00
Charlotte, FL B-4 n n 0.00 0.00 n n 0.00 0.00
Lee, FL B-3 n n 0.00 0.00 n n 0.00 0.00
Collier, FL B-4 n n 0.00 0.00 n n 0.00 0.00
Monroe, FL B-3 n n 0.00 0.00 n n 0.00 0.00
Dade, FL B-4 n n 0.00 0.00 n n 0.00 0.00
Broward, FL B-3 n n 0.00 0.00 n n 0.00 0.00
Palm Beach, FL B-4 n n 0.00 0.00 n n 0.00 0.00
Martin, FL B-3 n n 0.00 0.00 n n 0.00 0.00
St. Lucie, FL B-4 n n 0.00 0.00 n n 0.00 0.00
Indian River, FL B-3 n n 0.00 0.00 n n 0.00 0.00
Brevard, FL B-4 n n 0.00 0.00 n n 0.00 0.00
Volusia, FL B-3 n n 0.00 0.00 n n 0.00 0.00
Flagler, FL B-4 n n 0.00 0.00 n n 0.00 0.00
St. Johns, FL B-3 n n 0.00 0.00 n n 0.00 0.00
Duval, FL B-4 n n 0.00 0.00 n n 0.00 0.00
Nassau, FL B-3 n n 0.00 0.00 n n 0.00 0.00
TX B-1a 1 3 0.01 0.03 4 16 0.04 0.17
LA B-1a 3 5 0.03 0.05 17 26 0.19 0.30
MS B-1a n n 0.00 0.00 1 2 0.01 0.02
AL B-1a n n 0.00 0.00 1 1 0.01 0.01
FL B-1a n n 0.00 0.00 n 2 0.00 0.02
Tamaulipas, Mexico B-1a n n 0.00 0.00 n n 0.00 0.00
Veracruz-Llave,
Mexico
B-1a n n 0.00 0.00 n n 0.00 0.00
Tabasco, Mexico B-1a n n 0.00 0.00 n n 0.00 0.00
Campeche, Mexico B-1a n n 0.00 0.00 n n 0.00 0.00
Yucatan, Mexico B-1a n n 0.00 0.00 n n 0.00 0.00
Quintana Roo, Mexcio B-1a n n 0.00 0.00 n n 0.00 0.00
Belize (country) B-1a n n 0.00 0.00 n n 0.00 0.00
Cuba B-1a n n 0.00 0.00 n n 0.00 0.00
TX Coastal Bend
Beach Area
B-10 n n 0.00 0.00 n 3 0.00 0.03
TX Matagorda Beach
Area
B-10 n 1 0.00 0.01 1 5 0.01 0.05
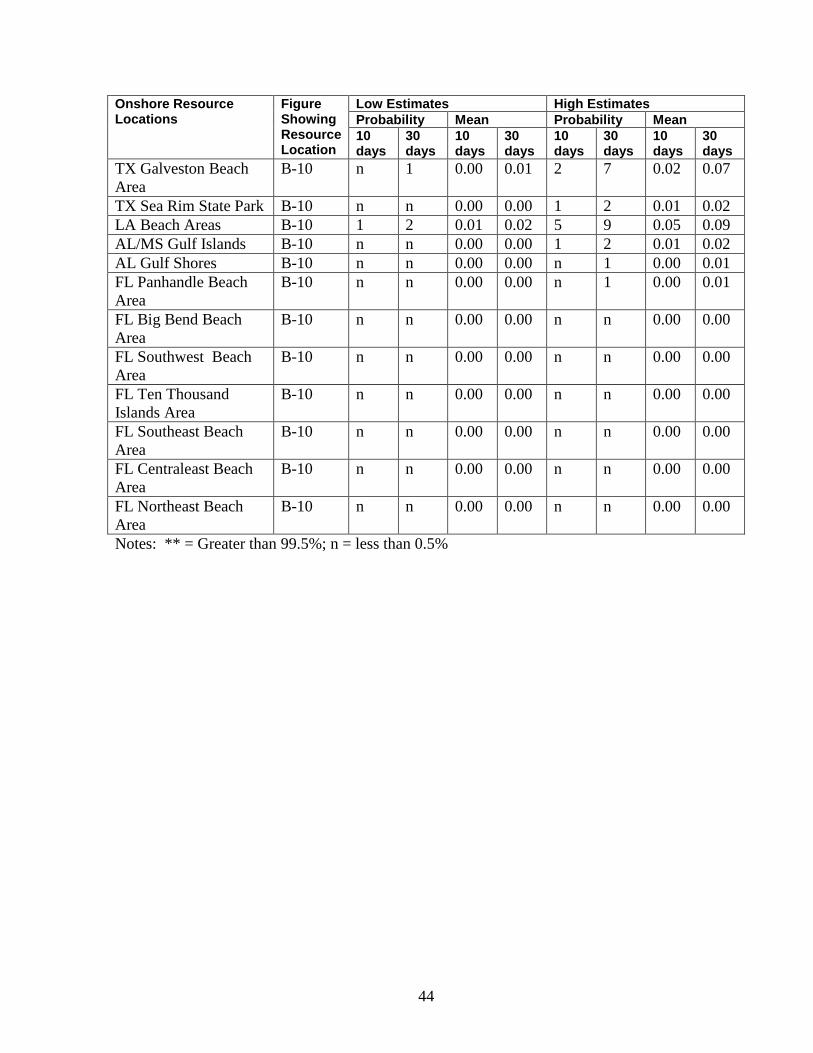
44
Onshore Resource Locations
Figure Showing Resource Location
Low Estimates High Estimates
Probability Mean Probability Mean
10 days
30 days
10 days
30 days
10 days
30 days
10 days
30 days
TX Galveston Beach
Area
B-10 n 1 0.00 0.01 2 7 0.02 0.07
TX Sea Rim State Park B-10 n n 0.00 0.00 1 2 0.01 0.02
LA Beach Areas B-10 1 2 0.01 0.02 5 9 0.05 0.09
AL/MS Gulf Islands B-10 n n 0.00 0.00 1 2 0.01 0.02
AL Gulf Shores B-10 n n 0.00 0.00 n 1 0.00 0.01
FL Panhandle Beach
Area
B-10 n n 0.00 0.00 n 1 0.00 0.01
FL Big Bend Beach
Area
B-10 n n 0.00 0.00 n n 0.00 0.00
FL Southwest Beach
Area
B-10 n n 0.00 0.00 n n 0.00 0.00
FL Ten Thousand
Islands Area
B-10 n n 0.00 0.00 n n 0.00 0.00
FL Southeast Beach
Area
B-10 n n 0.00 0.00 n n 0.00 0.00
FL Centraleast Beach
Area
B-10 n n 0.00 0.00 n n 0.00 0.00
FL Northeast Beach
Area
B-10 n n 0.00 0.00 n n 0.00 0.00
Notes: ** = Greater than 99.5%; n = less than 0.5%

Appendix B. Oil-Spill Risk Analysis Figures

46
Figure B-1a. Domain, planning areas, and locations of countries and U.S. and Mexican states.
Eastern PlanningArea
Central PlanningArea
Western PlanningArea
77°0'W78°0'W79°0'W80°0'W81°0'W82°0'W83°0'W84°0'W85°0'W86°0'W87°0'W88°0'W89°0'W90°0'W91°0'W92°0'W93°0'W94°0'W95°0'W96°0'W97°0'W98°0'W99°0'W
32°0'N
31°0'N
30°0'N
29°0'N
28°0'N
27°0'N
26°0'N
25°0'N
24°0'N
23°0'N
22°0'N
21°0'N
20°0'N
19°0'N
18°0'N
17°0'N
0 150 300Kilometers
0 150 300 Miles
Domain Boundary
Texas
Louisiana
Mississippi Alabama
Florida
Cuba
Jamaica
CaymanIslands
Bahamas
Belize
TabascoCampeche
Yucatan
QuintanaRoo
Veracruz-Llave
Tamaulipas

47
Figure B-1b. Locations of cluster subareas for launching hypothetical spills.

48
Figure B-2. Locations of state offshore waters for Mexico, Texas, Louisiana, Mississippi, Alabama, and Florida.
TEXAS GEORGIA
FLORIDA
LOUISIANA MISSISSIPPI ALABAMA
80°0'W81°0'W82°0'W83°0'W84°0'W85°0'W86°0'W87°0'W88°0'W89°0'W90°0'W91°0'W92°0'W93°0'W94°0'W95°0'W96°0'W97°0'W98°0'W
32°0'N
31°0'N
30°0'N
29°0'N
28°0'N
27°0'N
26°0'N
25°0'N
24°0'N
23°0'N
Tortugas0 100 200 Kilometers
0 100 200 Miles
NortheastFlorida
WestFlorida
FloridaPanhandle
Alabama
Mississippi
EastLouisiana
WestLouisiana
Texas
Mexican Waters
SoutheastFlorida

49
Figure B-3. Locations of Gulf of Mexico counties and parishes (set 1).

50
Figure B-4. Locations of Gulf of Mexico counties and parishes (set 2).

51
Figure B-10. Locations of recreational beaches.
TEXAS
GEORGIA
FLORIDA
LOUISIANA
MISSISSIPPI ALABAMA
80°0'W81°0'W82°0'W83°0'W84°0'W85°0'W86°0'W87°0'W88°0'W89°0'W90°0'W91°0'W92°0'W93°0'W94°0'W95°0'W96°0'W97°0'W98°0'W
32°0'N
31°0'N
30°0'N
29°0'N
28°0'N
27°0'N
26°0'N
25°0'N
24°0'N
23°0'N
0 100 200 Kilometers
0 100 200 Miles
TXCoastal Bend
BeachArea
TXMatagordaBeach Area
TXGalv eston
Beach Area
TX Sea RimState Park
LABeach Areas
AL / MSGulf Island
ALGulf
Shores
FLPanhandleBeach Area
FLBig Bend
Beach Area
FLSouthwestBeach Area
FLTen
ThousandIsland Area FL
SoutheastBeach Area
FLCentral
EastBeachArea
FLNortheast
Beach Area

52
Figure B-11. Locations of nearshore (“N”, 0–20 m), shelf (“S”, 20–300 m), and deepwater (“D”, 300 m to outer jurisdiction) seafloor polygons.
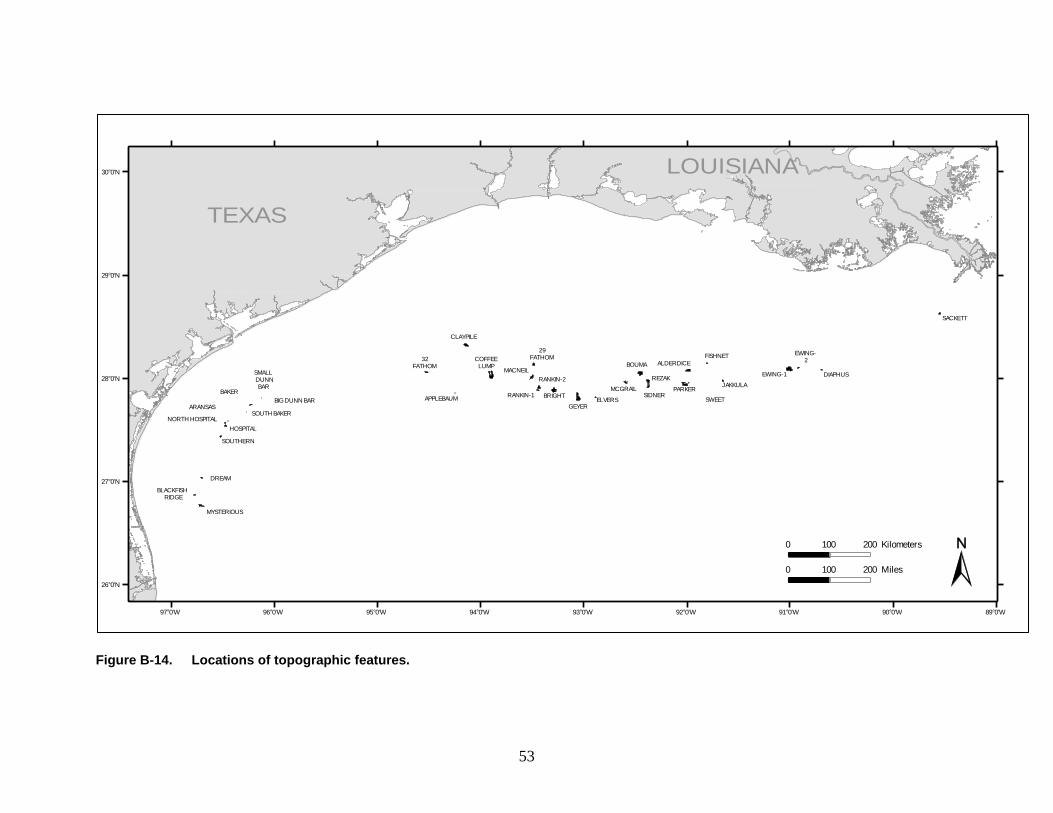
53
Figure B-14. Locations of topographic features.
TEXAS
LOUISIANA
SWEET
SOUTHERN
SOUTH BAKER
SMALLDUNNBAR
SIDNER
SACKETT
REZAKRANKIN-2
RANKIN-1PARKER
NORTH HOSPITAL
MYSTERIOUS
MCGRAIL
MACNEIL
JAKKULA
HOSPITAL
GEYER
FISHNET EWING-2
EWING-1
ELVERS
DREAM
DIAPHUS
COFFEELUMP
CLAYPILE
BRIGHT
BOUMA
BLACKFISHRIDGE
BIG DUNN BAR
BAKER
ARANSAS
APPLEBAUM
ALDERDICE32
FATHOM
29FATHOM
89°0'W90°0'W91°0'W92°0'W93°0'W94°0'W95°0'W96°0'W97°0'W
30°0'N
29°0'N
28°0'N
27°0'N
26°0'N
0 100 200 Kilometers
0 100 200 Miles
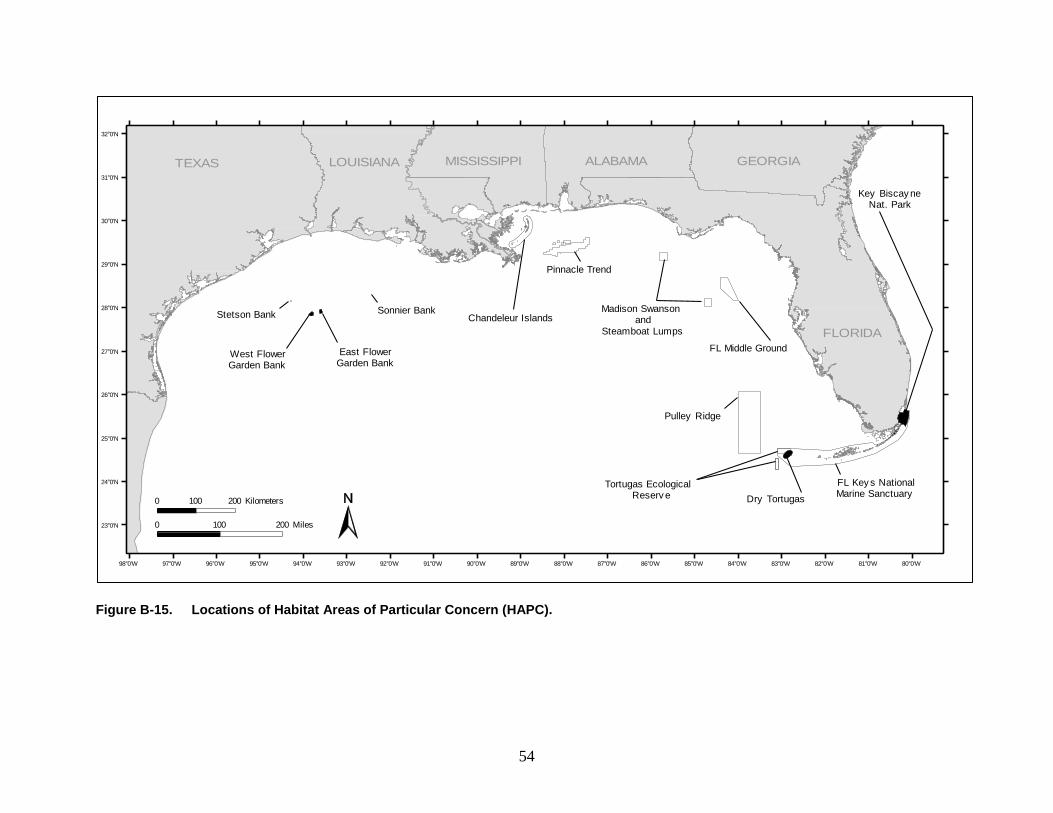
54
Figure B-15. Locations of Habitat Areas of Particular Concern (HAPC).
TEXAS GEORGIA
FLORIDA
LOUISIANA MISSISSIPPI ALABAMA
80°0'W81°0'W82°0'W83°0'W84°0'W85°0'W86°0'W87°0'W88°0'W89°0'W90°0'W91°0'W92°0'W93°0'W94°0'W95°0'W96°0'W97°0'W98°0'W
32°0'N
31°0'N
30°0'N
29°0'N
28°0'N
27°0'N
26°0'N
25°0'N
24°0'N
23°0'N
Pinnacle Trend
0 100 200 Kilometers
0 100 200 Miles
Chandeleur Islands
FL Key s NationalMarine Sanctuary
Dry Tortugas
Tortugas EcologicalReserv e
Pulley Ridge
FL Middle Ground
Madison Swansonand
Steamboat Lumps
Key Biscay neNat. Park
West FlowerGarden Bank
Stetson Bank Sonnier Bank
East FlowerGarden Bank

55
Figure B-16. Locations of recreational dive areas in the western Gulf of Mexico.
TEXAS
GEORGIA
FLORIDA
LOUISIANA
MISSISSIPPI ALABAMA
80°0'W81°0'W82°0'W83°0'W84°0'W85°0'W86°0'W87°0'W88°0'W89°0'W90°0'W91°0'W92°0'W93°0'W94°0'W95°0'W96°0'W97°0'W98°0'W
32°0'N
31°0'N
30°0'N
29°0'N
28°0'N
27°0'N
26°0'N
25°0'N
24°0'N
23°0'N
SouthTimbalier
SouthTimbalier
SouthAddition
BayMarchand
VermilionArea
VermilionArea
SouthAddition
(April-Nov ember)WPA <0.5%; <0.5-1%
CPA 3-5%; 4-8%
WestCameron
Galv estonArea
Port Lav acaLiberty Ship
Reef
Texas Clipper andSouth Texas Platf orm
High Island
East FlowerGarden Banks
Stetson Bank
0 100 200 Kilometers
0 100 200 Miles
West FlowerGarden Banks

56
Figure B-17. Locations of recreational dive areas in the eastern Gulf of Mexico.
TEXAS GEORGIA
FLORIDA
LOUISIANA MISSISSIPPI ALABAMA
80°0'W81°0'W82°0'W83°0'W84°0'W85°0'W86°0'W87°0'W88°0'W89°0'W90°0'W91°0'W92°0'W93°0'W94°0'W95°0'W96°0'W97°0'W98°0'W
32°0'N
31°0'N
30°0'N
29°0'N
28°0'N
27°0'N
26°0'N
25°0'N
24°0'N
23°0'N
Jacksonv ille
Day tonaBeach
SoutheastFlorida
Florida Key s
Tampa
PanhandleFlorida
CognacPlatf orm
HorseshoeRigs
0 100 200 Kilometers
0 100 200 Miles

57
www.boem.gov
The Department of the Interior Mission As the Nation’s principal conservation agency, the Department of the Interior has responsibility for most of our nationally owned public lands and natural resources. This includes fostering the sound use of our land and water resources, protecting our fish, wildlife and biological diversity; preserving the environmental and cultural values of our national parks and historical places; and providing for the enjoyment of life through outdoor recreation. The Department assesses our energy and mineral resources and works to ensure that their development is in the best interests of all our people by encouraging stewardship and citizen participation in their care. The Department also has a major responsibility for American Indian reservation communities and for people who live in island communities.
The Bureau of Ocean Energy Management The Bureau of Ocean Energy Management (BOEM) works to manage the exploration and development of the nation's offshore resources in a way that appropriately balances economic development, energy independence, and environmental protection through oil and gas leases, renewable energy development and environmental reviews and studies.