0master - Test & Measurement Instruments with Engineering ...
70
September 2013, Rev.1, 9/14 © 2013-2014 Fluke Corporation. All rights reserved. Specifications are subject to change without notice. All product names are trademarks of their respective companies. 1730 Energy Logger Users Manual
Transcript of 0master - Test & Measurement Instruments with Engineering ...

September 2013, Rev.1, 9/14 © 2013-2014 Fluke Corporation. All rights reserved. Specifications are subject to change without notice. All product names are trademarks of their respective companies.
1730 Energy Logger
Users Manual

LIMITED WARRANTY AND LIMITATION OF LIABILITY
Each Fluke product is warranted to be free from defects in material and workmanship under normal use and service. The warranty period is two years and begins on the date of shipment. Parts, product repairs, and services are warranted for 90 days. This warranty extends only to the original buyer or end-user customer of a Fluke authorized reseller, and does not apply to fuses, disposable batteries, or to any product which, in Fluke's opinion, has been misused, altered, neglected, contaminated, or damaged by accident or abnormal conditions of operation or handling. Fluke warrants that software will operate substantially in accordance with its functional specifications for 90 days and that it has been properly recorded on non-defective media. Fluke does not warrant that software will be error free or operate without interruption. Fluke authorized resellers shall extend this warranty on new and unused products to end-user customers only but have no authority to extend a greater or different warranty on behalf of Fluke. Warranty support is available only if product is purchased through a Fluke authorized sales outlet or Buyer has paid the applicable international price. Fluke reserves the right to invoice Buyer for importation costs of repair/replacement parts when product purchased in one country is submitted for repair in another country. Fluke's warranty obligation is limited, at Fluke's option, to refund of the purchase price, free of charge repair, or replacement of a defective product which is returned to a Fluke authorized service center within the warranty period. To obtain warranty service, contact your nearest Fluke authorized service center to obtain return authorization information, then send the product to that service center, with a description of the difficulty, postage and insurance prepaid (FOB Destination). Fluke assumes no risk for damage in transit. Following warranty repair, the product will be returned to Buyer, transportation prepaid (FOB Destination). If Fluke determines that failure was caused by neglect, misuse, contamination, alteration, accident, or abnormal condition of operation or handling, including overvoltage failures caused by use outside the product’s specified rating, or normal wear and tear of mechanical components, Fluke will provide an estimate of repair costs and obtain authorization before commencing the work. Following repair, the product will be returned to the Buyer transportation prepaid and the Buyer will be billed for the repair and return transportation charges (FOB Shipping Point). THIS WARRANTY IS BUYER'S SOLE AND EXCLUSIVE REMEDY AND IS IN LIEU OF ALL OTHER WARRANTIES, EXPRESS OR IMPLIED, INCLUDING BUT NOT LIMITED TO ANY IMPLIED WARRANTY OF MERCHANTABILITY OR FITNESS FOR A PARTICULAR PURPOSE. FLUKE SHALL NOT BE LIABLE FOR ANY SPECIAL, INDIRECT, INCIDENTAL OR CONSEQUENTIAL DAMAGES OR LOSSES, INCLUDING LOSS OF DATA, ARISING FROM ANY CAUSE OR THEORY. Since some countries or states do not allow limitation of the term of an implied warranty, or exclusion or limitation of incidental or consequential damages, the limitations and exclusions of this warranty may not apply to every buyer. If any provision of this Warranty is held invalid or unenforceable by a court or other decision-maker of competent jurisdiction, such holding will not affect the validity or enforceability of any other provision.
Fluke Corporation P.O. Box 9090 Everett, WA 98206-9090 U.S.A.
Fluke Europe B.V. P.O. Box 1186 5602 BD Eindhoven The Netherlands
11/99
To register your product online, visit register.fluke.com.

i
Table of Contents
Title Page
Introduction .................................................................................................................... 1 How to Contact Fluke .................................................................................................... 2 Safety Information .......................................................................................................... 2 Before You Start ............................................................................................................ 5
Tilt Stand ................................................................................................................... 6 Hanger Accessory ..................................................................................................... 6
Storage .......................................................................................................................... 7 Power Supply ................................................................................................................ 7 How to Charge Battery .................................................................................................. 8 Accessories ................................................................................................................... 9
Voltage Test Leads ................................................................................................... 10 Thin-Flexi Current Probe ........................................................................................... 10 Kensington Lock ....................................................................................................... 11
Navigation and User Interface ....................................................................................... 12 Applying the Connector Panel Decal ........................................................................ 14 Power ON/OFF ......................................................................................................... 15
Mains Power Source ............................................................................................ 15 Measurement Line Power Source ........................................................................ 15 Power from Battery .............................................................................................. 16
Touch Screen............................................................................................................ 17 Brightness Button ................................................................................................. 17 Calibration ............................................................................................................ 17
Basic Navigation ....................................................................................................... 17

1730 Users Manual
ii
Function Selection Buttons ............................................................................................ 18 Meter ......................................................................................................................... 18 Power ........................................................................................................................ 27 Logger ....................................................................................................................... 28 Memory/Settings Button ............................................................................................ 33
Logging Sessions ................................................................................................. 33 Screen Capture .................................................................................................... 33 Instrument Settings .............................................................................................. 34 Firmware Version ................................................................................................. 36 Touch Screen Calibration ..................................................................................... 36 Wi-Fi Configuration ............................................................................................... 36 Copy Service Data to USB ................................................................................... 36 Reset to Factory Defaults ..................................................................................... 37 Firmware Update .................................................................................................. 37
First-time Use/Setup Wizard .......................................................................................... 38 First Measurements ....................................................................................................... 39 Maintenance .................................................................................................................. 41
How to Clean ............................................................................................................ 41 Battery Replacement ................................................................................................. 41 Calibration ................................................................................................................. 41
Service and Parts .......................................................................................................... 42 Energy Analyze Software ............................................................................................... 44
System Requirements ............................................................................................... 44 PC Connections ........................................................................................................ 45 Wi-Fi Support ............................................................................................................ 45
Wi-Fi Setup .......................................................................................................... 46 Remote Control .................................................................................................... 47 Wireless Access to PC Software .......................................................................... 47
Wiring Configurations..................................................................................................... 48 Specifications ................................................................................................................. 51
General Specifications .............................................................................................. 51 Environmental Specifications .................................................................................... 51
Electrical Specifications ................................................................................................. 52

iii
List of Tables
Table Title Page
1. Symbols ................................................................................................................................ 4 2. Accessories .......................................................................................................................... 9 3. Front Panel ........................................................................................................................... 12 4. Connector Panel ................................................................................................................... 13 5. Power/Battery Status ............................................................................................................ 16 6. Replacement Parts ............................................................................................................... 42 7. VNC Clients .......................................................................................................................... 47

1730 Users Manual
iv

v
List of Figures
Figure Title Page
1. Country-Specific Mains Cords .............................................................................................. 5 2. Hanger Accessory ................................................................................................................ 6 3. Power Supply and Battery .................................................................................................... 7 4. R-Coil Operation Principle .................................................................................................... 10 5. Test Leads with Color Coding ............................................................................................... 11 6. Front Panel ........................................................................................................................... 12 7. Connector Panel ................................................................................................................... 13 8. Decal for Connector Panel .................................................................................................... 14 9. Replacement Parts ............................................................................................................... 43 10. Energy Logger to PC Connections ....................................................................................... 45 11. Wi-Fi Connection .................................................................................................................. 46 12. iFlex Probe Window .............................................................................................................. 59 13. i40s-EL Setup ....................................................................................................................... 61 14. Auiliary Input Cable Pin-Out .................................................................................................. 61

1730 Users Manual
vi

1
Introduction The 1730 Energy Logger (the Logger or Product) is a compact device for energy surveys. With a built-in touch screen and USB flash drive support, it is very easy to configure, verify, and download measurement sessions without the need of a computer at the measurement location.
The Logger makes these measurements:
• Basic Measurements: Voltage (V), Current (A), Frequency (Hz), Phase rotation indication, 2 dc channels (supports user-supplied external sensor for other measurements such as temperature, humidity, and air speed)
• Power: Active Power (W), Apparent Power (VA), Non-active Power, (var), Power Factor
• Fundamental Power: Fundamental Active Power (W), Fundamental Apparent Power (VA), Fundamental Reactive Power (var), DPF (CosΦ)
• Energy: Active Energy (Wh), Apparent Energy (VAh), Non-active Energy (varh)
• Demand: Demand (Wh), Maximum Demand (Wh), Energy costs
• Harmonic Distortion: Total Harmonic Distortion of Voltage and Current
Fluke Energy Analyze software is included with the Product for a thorough energy analysis and professional report of the measurement results.

1730 Users Manual
2
How to Contact Fluke To contact Fluke, use one of these telephone numbers:
• USA: 1-800-760-4523 • Canada: 1-800-36-FLUKE (1-800-363-5853) • Europe: +31 402-675-200 • Japan: +81-3-6714-3114 • Singapore: +65-6799-5566 • Anywhere in the world: +1-425-446-5500
Or, visit Fluke's website at www.fluke.com.
To register your Product, visit http://register.fluke.com.
To view, print, or download the latest manual supplement, visit http://us.fluke.com/usen/support/manuals.
Go to www.flukenation.com for more information about real-world applications and software downloads.
Safety Information A Warning identifies hazardous conditions and procedures that are dangerous to the user. A Caution identifies conditions and procedures that can cause damage to the Product or the equipment under test.
Warning To prevent possible electrical shock, fire, or personal injury:
• Read all safety information before you use the Product.
• Use the Product only as specified, or the protection supplied by the Product can be compromised.
• Comply with local and national safety codes. Use personal protective equipment (approved rubber gloves, face protection, and flame-resistant clothes) to prevent shock and arc blast injury where hazardous live conductors are exposed.
• Examine the case before you use the Product. Look for cracks or missing plastic. Carefully look at the insulation around the terminals.
• Replace the mains power cord if the insulation is damaged or if the insulation shows signs of wear.

Energy Logger Safety Information
3
• Use Product-approved measurement category (CAT), voltage, and amperage rated accessories (probes, test leads, and adapters) for all measurements.
• Do not use test leads if they are damaged. Examine the test leads for damaged insulation and measure a known voltage.
• Do not use the Product if it is damaged. • The battery door must be closed and
locked before you operate the Product.
• Do not work alone.
• Use this Product indoors only.
• Do not use the Product around explosive gas, vapor, or in damp or wet environments.
• Use only the external mains power supply included with the Product.
• Do not exceed the Measurement Category (CAT) rating of the lowest rated individual component of a Product, probe, or accessory.
• Keep fingers behind the finger guards on the probes.
• Do not use a current measurement as an indication that a circuit is safe to touch. A voltage measurement is necessary to know if a circuit is hazardous.
• Do not touch voltages >30 V ac rms, 42 V ac peak, or 60 V dc.
• Do not apply more than the rated voltage, between the terminals or between each terminal and earth ground.
• Measure a known voltage first to make sure that the Product operates correctly.
• De-energize the circuit or wear personal protective equipment in compliance with local requirements before you apply or remove the flexible current probe.
• Remove all probes, test leads, and accessories before the battery door is opened.

1730 Users Manual
4
Table 1 is a list of symbols used on the Product or in this manual.
Table 1. Symbols
Symbol Description Symbol Description
Risk of Danger. Important information. See manual. Conforms to relevant Australian EMC standards
Hazardous voltage Conforms to relevant North American Safety Standards
Conforms to relevant South Korean EMC standards
Conforms to European Union directives
Battery Double Insulation
CAT II Measurement Category II is applicable to test and measuring circuits connected directly to utilization points (socket outlets and similar points) of the low-voltage MAINS installation.
CAT III Measurement Category III is applicable to test and measuring circuits connected to the distribution part of the building’s low-voltage MAINS installation.
CAT IV Measurement Category IV is applicable to test and measuring circuits connected at the source of the building’s low-voltage MAINS installation.
This product contains a Lithium-ion battery. Do not mix with the solid waste stream. Spent batteries should be disposed of by a qualified recycler or hazardous materials handler per local regulations. Contact your authorized Fluke Service Center for recycling information.
This product complies with the WEEE Directive (2002/96/EC) marking requirements. The affixed label indicates that you must not discard this electrical/electronic product in domestic household waste. Product Category: With reference to the equipment types in the WEEE Directive Annex I, this product is classed as category 9 “Monitoring and Control Instrumentation” product. Do not dispose of this product as unsorted municipal waste. Go to Fluke's website for recycling information.

Energy Logger Before You Start
5
Before You Start Below is a list of the items included with your purchase. Carefully unpack and inspect each of the items:
• 1730 Energy Logger
• Power Supply
• Voltage Test Lead, 3-phase + N
• Dolphin Clip, Black • i1730-flex1500 Thin-Flexi Current Probe, 30.5 cm (12 in)
quantity 3 • Color-coded Wire Clips
• Power Cord (see Figure 1)
• Set of 2 test leads with stackable plugs, 10 cm (3.9 in)
• Set of 2 test leads with stackable plugs, 2 m (6.6 ft)
• DC Power Cable
• USB Cable A, Mini-USB
• Soft Storage Bag/Case
• Input Connector Decal The power cord and input connector decal are country-specific and vary according to the order destination. See Figure 1.
• Documentation Info Pack (Quick Reference Card, Safety Information, Battery Pack Safety Information, iFlex Probe Safety Information)
• 4 GB USB Flash Drive (includes Users Manual and PC application software, Fluke Energy Analyze)
hcf059.eps
Figure 1. Country-Specific Mains Cords
Universal EuroNorth American/Japan United Kingdom
Australia/China Brazil
PN 1552374
PN 1552339 PN 4322049
PN 1552388PN 1552342

1730 Users Manual
6
Tilt Stand The power supply includes a tilt stand. When used, the tilt stand positions the display at a good angle for use on a tabletop surface. To use, attach the power supply to the Logger and open the tilt stand.
Hanger Accessory The optional hanger accessory shown in Figure 2 is used to:
• Hang the Logger with power supply attached (use two magnets)
• Hang the Logger separately (use two magnets)
• Hang the power supply separately (use one magnet)
hcf058.eps
Figure 2. Hanger Accessory

Energy Logger Storage
7
Storage When not in use, keep the Logger in the protective storage bag/case. The bag/case has sufficient space for the Logger and all the accessories. If the Logger is stored for an extended period of time or is not in use for a long time, you should charge the battery at least once every six months.
Power Supply The Logger includes a removable power supply, see Figure 3. The power supply is either attached to the Logger or used externally with a DC power cord. The configuration with the externally connected power supply is preferred in locations where the Logger with the power supply attached is too big to fit in a cabinet between the door and panel.
When the power supply is connected with the Logger and connected to line power, it:
• converts line power to dc power and is used directly by the Logger
• automatically turns on the Logger and continuously powers the Logger from the external source (after initial power on, the power button turns on and turns off the Logger)
• recharges the battery
The power cord/measurement line cover slides to select the input source.
Warning To prevent possible electrical shock, fire, or personal injury, do not use the power supply if the power cord/measurement line slide-cover is missing.
hcf031.eps
Figure 3. Power Supply and Battery

1730 Users Manual
8
How to Charge Battery The Logger also operates on an internal rechargeable Lithium-ion battery. After you unpack and inspect the Logger, fully charge the battery before first use. Afterwards, charge the battery when the battery icon on the screen indicates that power is low. The battery automatically charges when the Logger is connected to the mains power. The Logger continues to charge when turned off and connected to mains power.
Note The battery charge is faster when the Logger is turned off.
To charge the battery:
1. Connect the mains cord to the ac input socket on the power supply.
2. Fit the power supply to the Logger or use the dc power cord to connect the power supply to the Logger.
3. Connect to mains power.
Caution To prevent damage to the Product:
• Do not leave batteries unused for extended periods of time, either in the product or in storage.
• When a battery has not been used for six months, check the charge status and charge the battery as appropriate.
• Clean battery packs and contacts with a clean, dry cloth.
• Battery packs must be charged before use.
• After extended storage, it can be necessary to charge and discharge a battery pack to obtain maximum performance.
• Dispose properly. Note
• Li-ion batteries keep a charge longer if stored at room temperature.
• The clock resets when the battery is completely discharged.
• When the Logger shuts off because of low battery, enough battery capacity is available to back up the real-time clock for up to 2 months.

Energy Logger Accessories
9
Accessories Table 2 is a list of the accessories that are available and sold separately for the Logger. The warranty on included accessories is 1 year.
Table 2. Accessories Description Part Number Description Part Number
i1730-flex 1500 Thin-Flexi Current Probe (single) 4345324 3PHVL-1730, Voltage Test Lead 3-phase + N 4344712
i1730-flex1500/3PK Set of three Thin-Flexi Current Probes 1500 A 30.5 cm (12 in)
4357406 i40s-EL Current Clamp, 40 A 4345270
i1730-flex 3000 Thin-Flexi Current Probe (single) 4345616 i40s-EL/3PK, Set of three Current Clamps, 40 A 4357438
i1730-flex3000/3PK Set of three Thin-Flexi Current Probes 3000 A 61 cm (24 in)
4357414 Fluke-1730-Hanger Kit 4358028
i1730-flex 6000 Thin-Flexi Current Probe (single) 4345625 Lithium-ion Battery 4389436
i1730-flex6000/3PK Set of three Thin-Flexi Current Probes 6000 A 90.5 cm (36 in)
4357423 Auxiliary Input Cable 4395217
Fluke-1730 Test Lead, 0.10 m 4344653 C1730, Soft Case 4345187
Fluke-1730 Test Lead, 2 m 4344675

1730 Users Manual
10
Voltage Test Leads Voltage test leads are four-core, flat, test leads that do not tangle and can be installed in tight spaces. On installations where the access to Neutral is out of reach with the three-phase test lead, use the black test lead to extend the Neutral lead.
For single phase measurements use the red and black test leads.
Thin-Flexi Current Probe The Thin-Flexi Current Probe works on the Rogowski coil (R-coil) principle that is a toroid of wire used to measure an alternating current through a wire encircled by the toroid. See Figure 4.
i(t)
v(t)
Ar 10 k R3
330 k R1
10 nF C1
LF347
UI:A1
GND
2
114
3
Vin
Vout
hcf028.eps
Figure 4. R-Coil Operation Principle
The R-coil has many advantages over other types of current transformers:
• It is not a closed loop. The second terminal is passed back through the center of the toroid core (commonly a plastic or rubber tube) and connected along the first terminal. This allows the coil to be open-ended, flexible, and able to be wrapped around a live conductor without disturbing it.
• It has an air core rather than an iron core. It has a low inductance and can respond to fast-changing currents.
• Because it has no iron core to saturate, it is highly linear even when subjected to large currents, such as those used in electric power transmission or pulsed-power applications.
A correctly formed R-coil, with equally spaced windings, is largely immune to electromagnetic interference.
Energy Logger Accessories
11
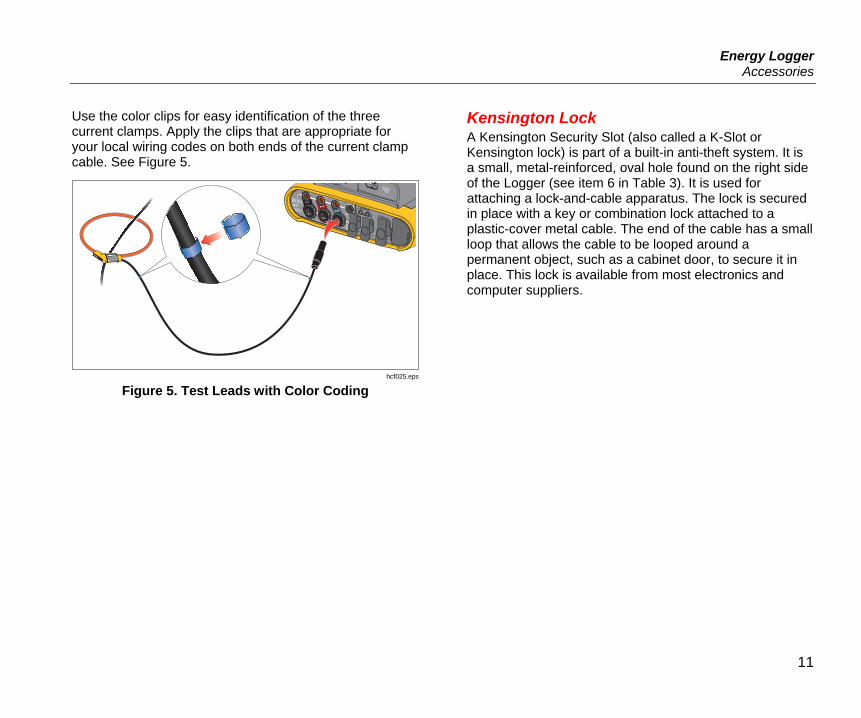
Use the color clips for easy identification of the three current clamps. Apply the clips that are appropriate for your local wiring codes on both ends of the current clamp cable. See Figure 5.
hcf025.eps
Figure 5. Test Leads with Color Coding
Kensington Lock A Kensington Security Slot (also called a K-Slot or Kensington lock) is part of a built-in anti-theft system. It is a small, metal-reinforced, oval hole found on the right side of the Logger (see item 6 in Table 3). It is used for attaching a lock-and-cable apparatus. The lock is secured in place with a key or combination lock attached to a plastic-cover metal cable. The end of the cable has a small loop that allows the cable to be looped around a permanent object, such as a cabinet door, to secure it in place. This lock is available from most electronics and computer suppliers.

1730 Users Manual
12
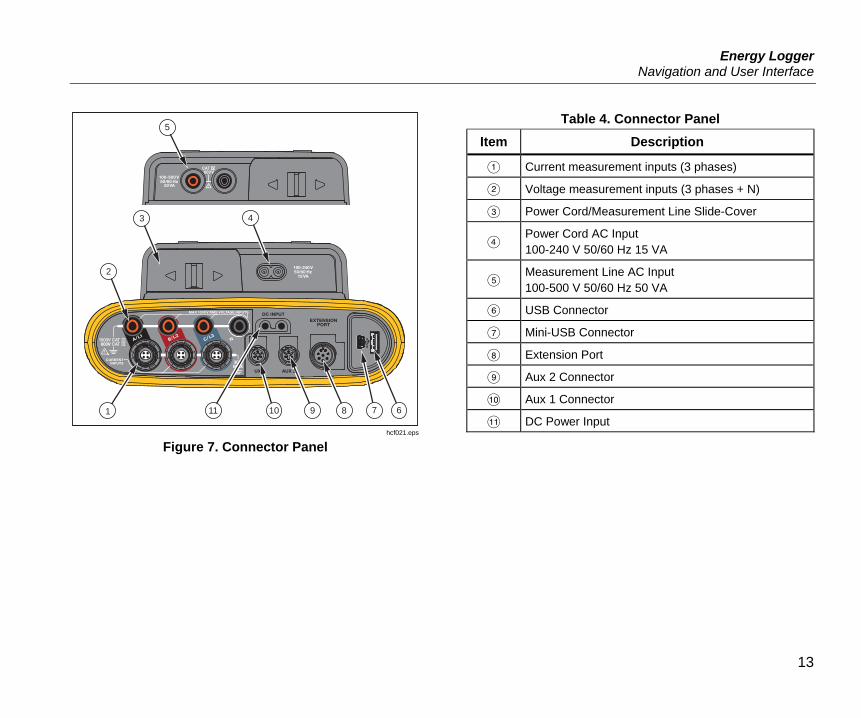
Navigation and User Interface See Figure 6 and Table 3 for a list of the front panel controls and their functions. See Figure 7 and Table 4 for a list of the connectors and their functions.
hcf023.eps
Figure 6. Front Panel
Table 3. Front Panel
Item Control Description
Power on/off and status
Meter, Power, or Logger function selection
Memory/Setup selection
Cursor control
Selection control
Kensington lock
Backlight on/off
Softkey selection
Touch screen display
2
1 8 7
5
4
3
69
Energy Logger Navigation and User Interface
13
hcf021.eps
Figure 7. Connector Panel
Table 4. Connector Panel Item Description
Current measurement inputs (3 phases)
Voltage measurement inputs (3 phases + N)
Power Cord/Measurement Line Slide-Cover
Power Cord AC Input 100-240 V 50/60 Hz 15 VA
Measurement Line AC Input 100-500 V 50/60 Hz 50 VA
USB Connector
Mini-USB Connector
Extension Port
Aux 2 Connector
Aux 1 Connector
DC Power Input 1 9 8 7 6
5
2
3 4
1011

1730 Users Manual
14
Applying the Connector Panel Decal Self-adhesive decals are supplied with the Logger. The decals correspond to the wiring color codes used in the USA, Europe and UK, UK (old), Canada, and China. Apply the decal appropriate for your local wiring codes around the current and voltage inputs on the connector panel as shown in Figure 8.
hcf022.eps
Figure 8. Decal for Connector Panel
USA (4275029) Canada (4280546)
Europe/UK (New STD 4280531) UK (4280554)
China (4280568)

Energy Logger Navigation and User Interface
15
Power ON/OFF The Logger has several options for power: mains, measurement line, and battery. The front panel LED shows the status. See Table 5 for more information.
Mains Power Source 1. Attach the power supply to the Logger or use the dc
power cord to connect the power supply to the Logger.
2. Move the slide-cover on the power supply to access the mains socket and connect the power cord into the Logger.
The Logger automatically turns on and is ready to use in <30 seconds.
3. Push to turn on and turn off the Logger.
Measurement Line Power Source 1. Attach the Power Supply to the Logger or use the dc
power cord to connect the Power Supply with the Logger.
2. Move the slide-cover on the power supply to access the safety sockets and connect these sockets with the voltage input sockets A/L1 and N.
For 3-phase delta systems connect the safety sockets of the power supply with the input sockets A/L1 and B/L2.
Use the short test leads for all applications where the measured voltage does not exceed the rated input voltage of the power supply.
3. Connect the voltage inputs to the test points.
The Logger automatically turns on and is ready to use in <30 seconds.
Caution To prevent damage to the product, make sure the measured voltage does not exceed the input rating of the power supply.
Warning To prevent injury, do not touch the metal parts of one test lead when the other is still connected to hazardous voltage.

1730 Users Manual
16
Power from Battery The Logger can operate on battery power without a connection to the power supply or dc power cord. Push . The Logger turns on and is ready to use in <30 seconds.
The battery symbol in the status bar and the power LED indicate the battery status.
Table 5. Power/Battery Status Logger On Logger OFF
Power Source
Battery Symbol Power LED
Estimated Runtime for LCD Hours:Minutes Power Source Battery Status Power LED Color
Off Brightness
low Brightness
high Mains Charging Blue
Mains
green NA Mains off OFF
Battery
yellow 5:30 4:50 3:45
Battery
yellow
Battery
yellow
Battery
yellow
Battery red 0:18 0:16 0:12
Logger Status
not logging steady
logging flashing

Energy Logger Navigation and User Interface
17
Touch Screen The touch screen enables you to interact directly with what is on the display. To change parameters, touch a target on the display with a finger. Touch targets are easy to recognize, such as large buttons, items in menus, or keys of the virtual keyboard. The Product can be operated with insulating gloves on (resistive touch).
Brightness Button The touch screen has a backlight for work in dimly lit spaces. See Table 3 for the location of the Brightness () button. Push to adjust the brightness in two levels and to turn on and turn off the display.
The brightness is set to 100 % when the Logger is powered from mains. When powered from battery, the default brightness is set to the power-save level of 30 %. Push to toggle between the two brightness levels.
Push and hold for 3 seconds to turn off the display. Push to turn on the display.
Calibration The touch screen is pre-calibrated in the factory. If you notice that the targets do not align with your touch on the display, you can calibrate the display. Calibration of the touch screen is available in the menu. See page 36 for more information about the touch screen calibration.
Basic Navigation When an option menu shows on the display, you can use to move within the menu.
The button has a dual use. In the Configuration and Setup screens, push to confirm the selection. In all screens, push for 2 seconds to take a screen shot. A beep and the camera symbol on the display confirm the action. See Screen Capture for more information about how to review, manage, and copy the screen shots.
Along the bottom of the display, a row of labels shows the available functions. Push or below the display label to start that function. These labels also work as touch targets.

1730 Users Manual
18
Function Selection Buttons The Logger has three buttons that toggle between the Meter, Power, and Logger function modes. The current mode shows in the upper left corner of the display:
Meter – The Meter mode is for measurement values of each phase (A/L1, B/L2, C/L3) as: • Voltage (V) • Current (A) • Frequency (Hz) • THD of Voltage and Current (%) • AUX Input
You can determine the values or display a trend chart of the last 7 minutes. In the chart: 1. Use or the cursor keys to show the list of
available parameters. 2. Push (Reset) to clear the graph and restart. It is also possible to log the values with the logger function.
THD of Voltage and Current show the harmonics and interharmonics as a percentage of the fundamental.
THD Voltage includes a traffic light indicator: • green: <2 % • yellow: 2 % to 8 % • red: >8 %
Note A Voltage THD of >8 % exceeds the limits of Power Quality standards. A detailed analysis of the harmonics with a power quality analyzer is recommended when the THD shows a yellow or red indicator.
Measurement Configuration Use the Change Configuration touch button to access the measurement configuration screen. The configuration screen allows you to change the parameters for: • Study type • Topology • Nominal voltage (for load studies only) • Current range • Scale factors for external PTs or CTs • Auxiliary input configuration

Energy Logger Function Selection Buttons
19
Study Type Depending on the application, select either Load Study or Energy Study.
• Energy Study: Select this study type when power and energy values including active power (W) and PF are required.
• Load Study: For convenience, some applications require you to measure only the current that makes the connection to the point to measure.
Typical applications are:
- Verify the circuit capacity before adding additional load.
- Identify situations where the allowable load can be exceeded.
Optionally, a nominal voltage can be configured to get pseudo-apparent power readings.
Topology (Distribution System) Select the appropriate system. A connection diagram for the voltage test leads and current sensors is shown on the Logger.
A diagram is also available with (Connection diagram) from the Change Configuration menu. Examples of these diagrams are shown on the following pages.
Single Phase Example: Branch circuit at an outlet.
A/L1
N
hcf040.eps
Energy Study
A/L1
N
hcf041.eps
Load Study (no voltage measurement)

1730 Users Manual
20
Single Phase IT The logger has a galvanic isolation between the voltage inputs and ground based signals like USB and mains input.
Example: Used in Norway and in some hospitals. This would be the connection at a branch circuit.
A/L1
A’/L1’
hcf042.eps
Energy Study
A/L1
A’/L1’
hcf042-2.eps
Load Study (no voltage measurement)
Split Phase Example: A North American residential installation at the service entrance.
A/L1
N
B/L2
hcf043.eps
Energy Study
A/L1
N
B/L2
hcf044.eps
Load Study (no voltage measurement)

Energy Logger Function Selection Buttons
21
3-Ф Wye Example: Also called “Star” or four-wire connection. Typical commercial building power.
A/L1
C/L3
B/L2
N
hcf045.eps
Energy Study
A/L1
C/L3
B/L2
N
hcf046.eps
Load Study (no voltage measurement)
3-Ф Wye IT The logger has a galvanic isolation between the voltage inputs and ground based signals like USB and mains input.
Example: Industrial power in countries that use the IT (Isolated Terra) system, such as Norway.
A/L1
C/L3
B/L2
N
hcf047.eps
Energy Study
A/L1
C/L3
B/L2
N
hcf048.eps
Load Study (no voltage measurement)

1730 Users Manual
22
3-Ф Wye Balanced Example: For symmetrical loads like motors the connection can be simplified by measuring only one phase and assuming the same voltages/currents on the other phases.
A/L1
C/L3
B/L2
N
hcf049.eps
Energy Study
A/L1
C/L3
B/L2
N
hcf050.eps
Load Study (no voltage measurement)
3-Ф Delta Example: Often found in industrial settings where electric motors are used.
A/L1
C/L3
B/L2
A/L1
C/L3
B/L2
hcf051.eps
Energy Study
A/L1
C/L3
B/L2
A/L1
C/L3
B/L2
hcf052.eps
Load Study (no voltage measurement)

Energy Logger Function Selection Buttons
23
2 Element Delta (Aron/Blondel) Example: Blondel or Aron connection, simplifies the connection by the use of only two current sensors.
A/L1
C/L3
B/L2
hcf055.eps
Energy Study
A/L1
C/L3
B/L2
hcf056.eps
Load Study (no voltage measurement) Note
Make sure that the current arrow on the sensor is directed towards the load to provide positive power values. The current sensor direction can be corrected digitally in the Connection Verification screen.
3-Ф Delta Open Leg Example: A variant of power transformer winding type.
A/L1
C/L3
B/L2
hcf053.eps
Energy Study
A/L1
C/L3
B/L2
hcf054.eps
Load Study (no voltage measurement)

1730 Users Manual
24
3-Ф High Leg Delta Example: For 120 V single phase feed by tapping across part of a leg in a delta power system.
A/L1
C/L3
N
B/L2
hcf061.eps
Energy Study
A/L1
C/L3
N
B/L2
hcf062.eps
Load Study (no voltage measurement)
Note The Logger provides the data of the 3-φ Delta system. For details of the tapped leg, configure the topology Split Phase instead.
3-Ф Delta Balanced Example: For symmetrical loads like motors, the connection is simplified with only one phase measurement and assuming the same voltages/currents on the other phases.
A/L1
C/L3
B/L2
hcf063.eps
Energy Study
A/L1
C/L3
B/L2
hcf064.eps
Load Study (no voltage measurement)
Energy Logger Function Selection Buttons
25
Nominal Voltage: Load Studies Only Select a nominal voltage from the list. If a voltage is not shown in the list, a custom voltage can be entered. Set the nominal voltage to off if the apparent power readings are not required.
Current Range Configure the current range of the attached sensor. Three ranges are available:
• Auto
• Low Range
• High Range
When set to Auto, the current range is set automatically and depends on the measured current.
Low Range is 1/10 of the nominal range of the attached current sensor. For example, the low range of an iFlex1500-12 is 150 A.
High Range is the nominal range of the attached current sensor. For example, 1500 A is the nominal range on an iFlex 1500-12.
Note Set the current range to Auto when you are not sure about the maximum current during the logging session. A specific application can require you to set the current range to a fixed range rather than Auto. This can occur because the Auto range is not gap-less and may lose too much information in the case of a highly fluctuating current.
Voltage Ratio (only in energy studies) Configure a ratio factor for the voltage inputs when a potential transformer (PT) is in series with the voltage connections such as when you want to monitor a medium-voltage network. The default value is 1:1.
Current Ratio Configure a ratio factor for the current sensors when a current transducer (CT) is used to measure the much higher level on the primary side at a substation or step-down transformer that has a built-in metering current transformer.
The current ratio also can be used to increase the sensitivity of flexible current sensor: Wrap the iFlex sensor around the primary conductor e.g. 2-times and enter a ratio factor of 1:2 to get correct readings.
The default value is 1:1.
Auxiliary Input 1/2 Configure the Auxiliary input to show the readings for the attached sensor. In addition to the default setting of ±10 V, up to five custom sensors can be configured and selected for the Auxiliary input channels.
To configure custom sensors:
1. Select one of the five custom sensors.
2. When the sensor has not been configured, push (Edit) to access the configuration screen.
3. Configure name, sensor type, unit, gain and offset. Confirm the settings with (Back).

1730 Users Manual
26
4. Select the sensor for the Auxiliary input with .
The configuration includes name, sensor type, unit, gain and offset:
• Change the Name from Custom1...5 to any clear identification of the sensor with up to 16 characters.
• Select the Sensor Type from a list that includes 0-1 V, 0-10 V, 4-20 mA, and other.
Use the 0-1 V and 0-10 V settings for sensors with a voltage output directly connected to the Aux input. The commonly used sensors that provide an output current of 4-20 mA can be used. In this case, an external resistor parallel to the Aux input (+) and Aux input (-) is required. A resistor value of 50 Ω is recommended. Resistor values >500 Ω are not supported. The resistor value is entered in the sensor configuration dialog and is a convenient method for configuration of the sensor measurement range.
• Use up to eight characters to configure the measurement Unit of the parameter.
• Configure the gain and offset in two ways. For sensor types 0-1 V, 0-10 V, and 4-20 mA, the Gain and Offset are automatically calculated with the measurement range of the sensor. In the Minimum field, enter the measurement value that the sensor supplies on the output, 0 V for 0-1 V and 0-10 V sensors or 4 mA for 4-20 mA sensors. In the Maximum field, enter the measurement value when the sensor supplies 1 V for 1 V sensors, 10 V for 10 V sensors, or 20 mA for 20 mA sensors.
For all other sensors types, use Other. For this sensor type use a gain and offset.
Example 1: Temperature sensor ABC123 Measurement range: -30°C to 70°C Output: 0-10 V The configuration for this sensor looks like this: - Name: Change the name from Custom1 to
ABC123 (°C) - Sensor Type: Select 0-10 V - Unit: Change Unit1 to °C - Minimum: Enter -30 - Maximum: Enter 70
Example 2: Fluke 80TK Thermocouple Module Output: 0.1 V/°C, 0.1 V/°FSettings in sensor configuration: - Sensor type: Other - Unit: °C (or °F) - Gain: 1000 °C/V - Offset: 0°C
Connection Verification and Correction Once the measurement is configured and the voltage and current inputs are connected to the system under test, use the Verify Connection touch button to confirm the connection.

Energy Logger Function Selection Buttons
27
The verification detects: • Too low signal • Phase rotation for voltage and current • Inverted current probes • Wrong phase map
In the connection verification screen: 1. Push to toggle between generator and motor
mode. Usually the current flow direction is toward the load. Use Motor Mode for these applications. Use the Generator Mode when the current sensors are connected intentionally to the generator (for example, during the time energy goes into the grid from regenerative braking system of an elevator or on-site wind turbines). The current flow arrow indicates the correct flow: a normal condition is shown in Motor Mode with a black arrow pointing upwards, in Generator Mode the black arrow points downwards. If the arrow is shown in red, the current flow direction is inverted.
2. Push (Correct Digitally) to access the connection correction screen. This screen allows you to virtually swap phases and invert the current inputs instead of a manual correction.
3. If the Logger is able to determine a better phase map or polarity, push (Auto Correct) to apply the new settings.
Auto Correct is not available if the algorithm is not able to detect a better phase map or when no errors are detected.
Note It is impossible to detect all incorrect hook-ups automatically. You must verify the suggested modifications carefully before you apply the digital correction. Applications with single-phase energy generation can deliver the wrong results when you apply the Auto Correct feature.
The algorithm works in a way that creates in three phase systems a sequence with a clockwise phase rotation.
Power – In the Power mode you can get the values and a live trend chart for each phase (A, B, C or L1, L2, L3) and total as: • Active Power (P) in W • Apparent Power (S) in VA • Non-active Power (D) in var • Power Factor (PF) Use (Fundamental/RMS) to toggle between full bandwidth power values and power of the fundamental.
In the fundamental power screen you see these values: • Fundamental Active Power (Pfund+) in W • Fundamental Apparent Power (Sfund) in VA • Fundamental Reactive Power (Qfund) in var • Displacement Power Factor (DPF) / cosϕ
1730 Users Manual
28
Push (Show Menu) to open a list of simplified Power screens that show all phases and total of one parameter, all parameters of one phase, or total.
The menu also provides the access to live values of Energy as:
• Active Energy (Ep) Wh
• Reactive Energy (EQr) in varh
• Apparent Energy (Es) in VAh
To display a trend chart of the last 7 minutes of Power values:
1. Push (Live-Trend).
2. Use or the cursor keys to show the list of available parameters.
3. Push (Reset) to clear the graph and restart.
Note In the user interface, the term Fundamental is sometimes shortened to “Fund.” or “h01.”
Logger – In Logger mode, you can:
• Configure a new logging session • Review the data of an ongoing logging session in
memory • Review the data of a completed logging session (as
long as no new session has been started) Push and then (Logging Sessions) to review a logging session.
Logging Session Setup
When no logging session is active, push to display the Setup Summary screen for logging. This screen lists all logging parameters such as:
• Session name • Duration and optional recording date and time for
start/stop • Interval of the average calculation • Demand interval (not available for load studies) • Energy costs (not available for load studies) • Description Go to Meter > Change Configuration to select between Load Study and Energy Study. This Configuration screen also contains the measurement configuration parameters such as Topology, current range, voltage, and current ratios. See page 18 for more information about measurement configuration. After you review these

Energy Logger Function Selection Buttons
29
parameters, push the Start Logging touch target to start recording.
If you want to modify the parameters, push the Edit Setup touch target. The settings are kept also during a power cycle. This allows configuring the logging session in the office and it is more convenient to avoid the time consuming task in the field.
Name The Logger auto-generates a file name with the format ES.xxx or LS.xxx.
ES ... Energy Study
LS ... Load Study
xxx ... incremental file number
The counter resets when the Logger is set to factory defaults. See page 36 for details. You can also choose a custom file name with up to 31 characters.
Duration and Recording Start/Stop Date and Time You can set the duration of the measurement from a list. No end configures the maximum possible duration based on the available memory.
For a duration not shown in the list, select Custom to enter the duration in number of hours or days.
The logging session stops automatically when the time duration has elapsed. Also, you can manually stop the logging session at any time.
A logging session starts to record immediately when you push the Start Logging touch target. You can configure a scheduled recording. It is either configured by the duration and the start date and time or by the start date and time and stop date and time.
This is a convenient method for how to set up the Logger to measure a full week profile starting on Monday 0:00 and ending on Sunday 24:00.
Note Even when a start date and time has been configured, you must push the Start Logging button.
Options to configure the logging session: • Duration and manual start • Duration and set start date/time • Set start date/time and set end date/time
A memory gauge shows the memory used by recorded sessions and stored screenshots in black. The memory

1730 Users Manual
30
required for the new session is shown in green. When the new logging session will not fit in the available memory, the gauge turns from green to red. If you confirm the selection, the Logger will adjust the averaging interval accordingly.
Interval of the average calculation Select the time interval when a new average value is added to the logging session. The available intervals are: 1 s, 5 s, 10 s, 30 s, 1 min, 5 min, 10 min, 15 min, 30 min.
A shorter interval provides more details at the cost of higher memory consumption.
Examples of when a short interval is useful:
• Identify duty cycle of frequently switching loads
• Energy cost calculation of production steps
The Logger recommends an interval based on the duration to get the best balance between resolution and data size.
A memory gauge shows the memory used by recorded sessions and stored screenshots in black. The memory required for the new session is shown in green. In the case where the new logging session will not fit in the available memory, the gauge turns from green to red. It is still possible to confirm the selection but the Logger will adjust the duration accordingly.
Demand Interval Electrical suppliers use this interval to measure the customer demand. Select an interval to get energy costs and the maximum demand value (average power measured over a demand interval).
A value of 15 minutes is normal. If you don't know the average interval, select 5 minutes. You can recalculate other interval lengths offline using the Energy Analyze software.
Note This value is not available for load studies.
Energy costs Enter the costs/kWh for demand energy. The energy costs are applied to forward energy (positive energy) using the demand interval and can be reviewed in the Logger detail screen Energy - Demand.
Energy costs can be entered using a resolution of 0.001. The currency unit is changed in Instrument Settings. See page 35 for more information.
Note This value is not available for load studies.

Energy Logger Function Selection Buttons
31
Description Enter more details about the measurement, such as customer, location, and load-rating plate data with the virtual keyboard. This description field is limited to 127 characters.
After you download a logging session with Energy Analyze software, use more advanced inputs to support line breaks and an unlimited number of characters.
Logging Session Review When a logging session is started, or when you review a completed session, the Logging home screen is shown. During active recording, this screen can be accessed when you push .
The Logger home screen shows the progress of an active recording. The screen shows the overview chart with active power and PF for energy studies and currents for load studies. Total energy is available also in energy studies.
The screen updates with each new average calculation interval at a maximum of every 5 seconds.
From the Logger home screen you have access to:
• V, A, Hz, + (A, Hz, + for load studies)
• Power
• Energy
• Details
In the "V, A, Hz, +", "Power" and "Energy" screens, use (Show Menu) or the cursor keys to see a list of available parameters. Use to select a parameter and confirm the selection with .
Tables update with each new average calculation interval at a maximum of every 5 seconds. Push (Refresh) to update charts on request.
V, A, Hz, + (Load studies: A, Hz, +) You can determine the average value measured over the logging duration as well as minimum/maximum values with high resolution.
Parameter Min Max Resolution V + + Full cycle (typ. 20 ms @ 50 Hz,
16.7 ms @ 60 Hz) A 0 + Half cycle (typ. 10 ms @ 50 Hz,
8.3 ms @ 60 Hz) Hz + + 200 ms AUX + + 200 ms THD-V/THD-A 0 + 200 ms
Note + available with the Logger and the PC software 0 available with the PC software
The algorithm to calculate Voltage min/max values is in accordance to established power quality standards to detect dips, swells, and interruptions.
Watch for values exceeding ±15 % of the nominal voltage. This is an indicator of power quality problems.

1730 Users Manual
32
High maximum values on Currents can be an indicator for tripping circuit breakers.
Push (Graph) to display the measured values in a chart. The table on the right side of the screen shows the highest and lowest value of the graph measured with the average calculation interval. Triangular indicators point to the measurement value.
Power Note
Not available on load studies without a nominal voltage.
Review the power values in tabular format and as a time chart. Depending on the power parameter or the average value measured over the logging duration, additional values are available:
Parameter Min/Max Top 3
Top 3 Forward/Reverse
Active Power (W) - - +/+ Apparent Power (VA) - + - Non-active Power (var) - + - Power Factor + - - Active Power fund. (W) - - +/+ Apparent Power fund. (VA) - + - Reactive Power (var) - - +/+ Displacement Power Factor/cosϕ + - -
For all power values, except PF and DPF, the three highest values during the logging session are available.
Use (Reverse Power/Forward Power) to toggle between Top-3 forward and Top-3 reverse values.
Push (Graph) to display the measured values in a chart. The table on the right side of the screen shows the highest and lowest value of the graph measured with the average calculation interval. Triangular indicators point to the measurement value.
Energy Note
Not available on load studies without a nominal voltage.
Determine the energy consumed/delivered since the logging session has been started.
Parameter Forward/Reverse Energy
Total Energy
Active Energy (Wh) +/+ + Apparent Energy (VAh) -/- + Reactive Energy (varh) -/- +
The Demand screen shows the values for:
• Consumed energy (= forward energy) in Wh
• Maximum Demand in W. Maximum demand is the highest active power measured over the demand interval and is often part of the contract with the electricity supplier.
• Energy cost. The currency can be configured in instrument settings. See page 35 for more information.

Energy Logger Function Selection Buttons
33
Details The details screen provides an overview of the logging setup. During an active session or when reviewing an already completed session, the description and the cost/kWh can be modified with the Edit Setup touch target.
Push View Configuration to review the measurement configuration for the logging session.
Memory/Settings Button In this menu you can:
• Review and erase the data from completed logging sessions
• Review and erase screen captures • Copy measurement data and screen captures to the
USB flash drive • Make adjustments to the instrument settings
Logging Sessions The list of stored logging sessions is available with (Logging Sessions). Push to move the screen highlight to the logging session of interest. Additional information such as start and end time, duration, logging description, and file size are shown.
1. Push to review the logging session. See View Logging Sessions for more details.
Note It is not possible to review a completed logging session when another session is active.
2. Push (Delete) to remove the selected logging session. Push to remove all logging sessions.
Note An active logging session cannot be deleted. Stop the logging session before you delete.
3. Push (Save to USB) to copy the selected logging session to an attached USB flash drive. The session is stored on the USB flash drive in the folder:
\Fluke1730\<serial number>\sessions
Screen Capture In this screen you can review, erase, and copy saved screens to a USB flash drive.
1. Push .
2. Push (Screen Capture) to show the list of all screens. See Basic Navigation for information about how to capture screens.
3. Push to move the screen highlight to a screen of interest. A thumbnail image of the screen is shown for easy identification.
4. Use (Delete) to delete the selected screen. Push to delete all screens.
5. Push or (Save All to USB) to copy all screens to an attached USB flash drive.

1730 Users Manual
34
Instrument Settings The Logger has settings for language, date and time, phase information, currency, firmware version and update, Wi-Fi configuration, and touch screen calibration.
To change the settings:
1. Push .
2. Push (Instrument Settings).
Language The user interface of the Logger is available in Czech, Chinese, English, French, German, Italian, Japanese, Korean, Polish, Portuguese, Russian, Spanish, and Turkish.
To change the display language:
1. Push .
2. Push (Instrument Settings).
3. Push to move the screen highlight to language field and push or touch the Language target.
4. Push to move through the language list.
5. Push to activate the new language.
The language immediately updates on the screen.
Phase Color/Phase Labels The phase colors are configurable to match with the connector panel decal. Five schemes are available:
A/L1 B/L2 C/L3 N
US black red blue white
Canada red black blue white
EU brown black grey blue
UK (old) red yellow blue black
China yellow green red blue
To change the phase color/phase labels:
1. Push .
2. Push (Instrument Settings).
3. Push to highlight Phases and push or touch Phases target.
4. Select one of the available schemes.
5. Push to toggle the phase label between A-B-C and L1-L2-L3.
6. Push to confirm the selection.

Energy Logger Function Selection Buttons
35
Date/Time Zone The logger stores the measurement data in universal time coordinate (UTC) to ensure continuity in time and accounts for time changes due to daylight saving time (DST).
To display the time stamps of the measurement data correctly, it is required to set the time zone. The Logger adjusts automatically to DST. For example, a 1-week measurement started on 2-Nov-2013 8:00 am ends on 9-Nov-2013 08:00 am even though the clock was set back on 3-Nov-2013 from 02:00 to 01:00.
To set the time zone: 1. Push .
2. Push (Instrument Settings).
3. Push to highlight Time Zone and push or touch Time Zone target.
4. Select the regions/continents.
5. Push .
6. Continue to select the country/city/time zone until the time zone configuration is done and the Instrument Settings menu shows.
To set the date format:
1. Push .
2. Push (Instrument Settings).
3. Push to highlight the Date Format target and push or touch the Date Format target.
4. Select one of the available date formats.
5. Push to toggle between a 12 hour or 24 hour format. A preview of the configured date format shows on the display.
6. Push to confirm the selection.
To change the time:
1. Push .
2. Push (Instrument Settings).
3. Push to highlight the Time target and push or touch the Time target.
4. Use the + and – touch targets for each field.
5. Push to confirm the change and exit the screen.
Currency The currency symbol used for energy cost values is configurable.
To set the currency:
1. Push .
2. Push (Instrument Settings).
3. Push to highlight the Currency target and push or touch the Currency target.
4. Select one of the currency symbols and push .
5. If a currency is not in the list, select Custom and push or touch Edit Custom target.
1730 Users Manual
36
6. Enter a three-letter currency code with the keyboard and accept with .
7. Push to confirm the selection.
Firmware Version To find the firmware version installed on your Logger:
1. Push .
2. Push (Instrument Settings).
3. Push (Tools).
4. Push to select Firmware version and push or touch the Firmware version target.
5. Push to exit the screen.
Touch Screen Calibration The touch screen has been calibrated at the factory before shipment. In case you do experience misalignment with the touch targets, use the touch screen calibration feature.
To calibrate:
1. Push .
2. Push (Instrument Settings).
3. Push (Tools).
4. Push to highlight Touch Screen Calibration and push or touch the Touch Screen Calibration target.
5. Touch the five cross hair targets as exactly as possible.
Wi-Fi Configuration To configure the first-time Wi-Fi connection of a PC/smartphone/tablet to the Logger, setup the Wi-Fi details in the Tools screen.
To view the Wi-Fi setup parameters:
1. Push .
2. Push (Instrument Settings).
3. Push (Tools).
4. Push to highlight the Wi-Fi configuration target and push or touch the Wi-Fi configuration target to view the Wi-Fi connection details.
Note This feature is only available when a supported USB Wi-Fi dongle is attached to the Logger.
Copy Service Data to USB If requested for customer support, use this function to copy all measurement files in raw format and system information to a USB flash drive.
To copy the service data:
1. Attach a USB flash drive with sufficient available memory (depending on the file size of stored logging sessions max. 180 MByte)
2. Push .
3. Push (Instrument Settings).
4. Push (Tools).

Energy Logger Function Selection Buttons
37
5. Push to highlight the Copy service data to USB target and push or touch Copy service data to USB target to start the copy process.
Reset to Factory Defaults The reset function deletes all user data, such as logging sessions and screen captures, and sets the instrument settings to default values. It also enables the first-time use wizard the next time the instrument boots.
To reset:
1. Push .
2. Push (Instrument Settings).
3. Push (Tools).
4. Push to highlight Reset to Factory Defaults and push or touch Reset to Factory Defaults target.
A display message will prompt you to continue or cancel the reset.
The Logger is reset to factory defaults also when you simultaneously push and hold the buttons , , and while the Logger starts.
Firmware Update To update:
1. Take a USB flash drive with at least 40 MB of free space available and create a folder called "Fluke1730" (no spaces in file name).
Note Make sure the USB is formatted with FAT or FAT32 file system. In Windows USB flash drives ≥32GB can be formatted with FAT/FAT32 only by using 3rd party tools.
2. Copy the firmware file (*.bin) into this folder.
3. Make sure the Logger is powered from mains and operating.
4. Plug the flash drive into the Logger. The USB Transfer screen pops up and offers the firmware update.
5. Push to select the firmware update and push .
6. Follow the instructions. When the firmware update is complete the Logger reboots automatically.
Note A firmware update deletes all user data such as measurement data and screen captures.
This firmware update works only when the firmware version on the USB flash drive is newer than the installed version.

1730 Users Manual
38
To install the same version or an older version:
1. Push .
2. Push (Instrument Settings).
3. Push (Tools).
4. Push to select Firmware Update and push or touch the Firmware Update target.
Note If more than one firmware file (*.bin) is located in the \Fluke1730 folder, the newest version is used for the update.
First-time Use/Setup Wizard To start the Logger:
1. Attach the power supply to the Logger or use the DC power cord to connect the Power Supply with the Logger.
2. Connect the power cord into the power supply.
The Logger starts up in <30 seconds and the Setup Wizard starts.
3. Pick the language (see page 34).
4. Push (Next) or to navigate to the next page.
5. Push (Cancel) to close the setup wizard. If you cancel, the setup wizard starts again on next startup of the logger.
6. Pick the work standards for your region. This action selects the color codes and the phase descriptor (A, B, C or L1, L2, L3).
This is the best time to apply the correlating decal on the connector panel. The decal helps you to quickly identify the appropriate voltage test lead and current probe for the different phases and neutral.
7. Attach the color clips to the current probe cables.
8. Pick your time zone and date format. Confirm that the correct date and time are shown on-screen.
9. Pick the currency sign or currency code.

Energy Logger First Measurements
39
The Logger is now ready for the first measurements or energy study.
Note Be aware that for power measurements in 3-phase systems: • Total Active Power (W) is the sum of the
individual phases • Total Apparent Power (VA) also includes the
neutral current that can result in a very different result than the sum of the three phases. This is especially noticeable when a signal is connected to all three phases (for example, a calibrator) the total value is approximately 41% higher than the sum of each phase.
• Total Fundamental Power (W) only delivers the sum of each phase when the phase rotation is clockwise. It is zero when the phase rotation is counter-clockwise.
For more information, see the white paper, Measurement Theory Formulas, at www.fluke.com for a list of formulas.
First Measurements At the energy study site, look at the information in the panel and the rating plates on the machines. Based on knowledge of the electrical supply in the facility, determine the configuration.
To start measurements:
1. Connect the Logger to mains power.
Note See page 15 if you want to power the Logger from the measurement line. The Logger starts and shows the Meter screen with Volts, Amps and Hz readings.
2. Push Change Configuration. Confirm the study type and the wiring configuration is correct. For most applications the current range is set to Auto and the voltage and current ranges are 1:1. Configure the gain, offset, and engineering unit of measurement for the sensors attached to the Auxiliary inputs.
3. Push Configuration Diagram for guidance on the voltage test lead and current probe connections.
4. Plug the voltage test leads into the Logger.
5. Use the Thin-Flexi current probes and plug the phase A current probe into the phase A/L1 input jack on the logger, the phase B/L2 current probe into the phase B/L2 input jack on the logger, and the phase C/L3 current probe into the phase C/L3 input jack on the logger.
6. Apply the iFlex Probes to the wires in the electrical panel. Make sure the arrow on the probe points to the load.
7. Connect the voltage test leads to neutral, phase A/L1, phase B/L2, and phase C/L3.

1730 Users Manual
40
8. With all of the connections done, check that the voltages for phases A/L1, B/L2, and C/L3 are as expected.
9. Read the current measurements for phases A/L1, B/L2, and C/L3.
10. Push Verify Connection to check and correct the phase rotation, phase mapping, and polarity of current probes.
Most installations use a clockwise rotation.
11. Push Live-Trend to display a chart of the last 7 minutes.
12. Push to determine the power values, especially active power and power factor.
13. Push Live-Trend to display a chart of the last 7 minutes.
14. Push for 3 seconds to take a snapshot of the measurements.
15. Push and change the default configuration with Edit Setup.
Typical setup: - 1 week duration - 1 minute for average calculation interval - 15 minutes for demand interval
16. Push Start Logging.
You can review the live data with or . Return to the active logging session with . Once the
logging session is completed it is accessible in Memory/Settings - Logging Sessions.
17. Review the logged data using the softkeys V, A, Hz, +, Power, and Energy. See page 31 for more information.
18. To transfer and analyze the data using the PC software, attach the USB flash drive to the Logger and copy the logging session and screenshot.
Note You can also use the USB cable or the USB Wi-Fi dongle to transfer the measurement data.
To analyze the data using the PC software:
1. Attach the USB flash drive to a PC with Energy Analyze installed.
2. In the software, click Download and copy the logging session and screenshot from the USB flash drive.
3. Open the downloaded session and view the measured data.
4. Go to the Project Manager tab and click Add Image to add the screenshot.
For more information about how to use the Energy Analyze, see the online help for the software.

Energy Logger Maintenance
41
Maintenance If the Logger is used appropriately it does not require special maintenance or repair. Maintenance work may be executed only by trained and qualified personnel. This work may only be done at a company related service center within the guarantee period. See www.fluke.com for locations and contact information of Fluke Service Centers worldwide.
Warning To prevent possible electrical shock, fire, or personal injury:
• Do not operate the Product with covers removed or the case open. Hazardous voltage exposure is possible.
• Remove the input signals before you clean the Product.
• Use only specified replacement parts.
• Have an approved technician repair the Product.
How to Clean Caution
To avoid damage, do not use abrasives or solvents on this instrument.
If the Logger is dirty, wipe it off carefully with a damp cloth (without cleaning agents). Mild soap may be used.
Battery Replacement The Logger has an internal rechargeable Lithium-ion battery.
To replace the battery:
1. Remove the Power Supply.
2. Unscrew the four screws and remove the battery door.
3. Replace the battery.
4. Fasten the battery door.
Caution To prevent damage to the Product, use only original Fluke batteries.
Calibration As an additional service we offer the regular examination and calibration of your Logger. The recommended calibration cycle is 2 years.
More information about how to contact Fluke is on page 2.

1730 Users Manual
42
Service and Parts Replacement parts and accessories are listed in Table 6 and shown in Figure 9. To order parts and accessories, see How to Contact Fluke.
Table 6. Replacement Parts
Ref. Description Qty. Fluke Part or Model Number
Power Supply 1 4212737
Battery Door 1 4388072
Battery Pack, Li ion 3.7 V 2500 mAh 1 4146702
USB Cable 1 1671807
Input Decal, country specific (US, Canada, Europe/UK, UK/old, China)
1 see Figure 8
Line Cord, country specific (N. American, Europe, UK, Australia, Japan, India/S. Africa, Brazil)
1 see Figure 1
Test Lead 0.10 m Red, 1000 V CAT III 1 4344653
Test Lead 2 m Red, 1000 V CAT III 1 4344675
Color-coded Wire Clips 1 set 4394925
USB Flash Drive 1 4298561
Users Manual on USB Flash Drive 1 NA

Energy Logger Service and Parts
43
hcf060.eps
Figure 9. Replacement Parts
45
9
6
1
2
3
8
7
1110

1730 Users Manual
44
Energy Analyze Software The 1730 Energy Logger includes the Fluke Energy Analyze software that lets you do tasks from a computer.
You can:
• Download campaign results for further processing and archiving.
• Analyze energy or load profiles, including zoom-in and zoom-out on details.
• Add comments, annotations, pictures, and other supplementary information to campaign data.
• Overlay data from different campaigns to identify and document changes.
• Create a report from the analysis you performed.
• Export measurement results for further processing using a third party tool.
System Requirements The computer hardware requirements for the Energy Analyze software are:
• Free Hard Disk space 50 MB, >10 GB (for measurement data) recommended
• Installed Memory:
- 1 GB minimum for 32-bit systems
- ≥2 GB recommended for 32-bit systems, ≥4 GB recommended for 64-bit systems
• Monitor, 1280 x 1024 (@4:3) or 1440 x 900 (@16:10), wide-screen (16:10) at higher resolution recommended
• USB 2.0 ports
• WinXP 32-bit, Windows 7 32/64-bit, Windows 8 32/64-bit.
Note Windows 7 Starter edition and Windows 8 RT are not supported.
Energy Logger Energy Analyze Software
45
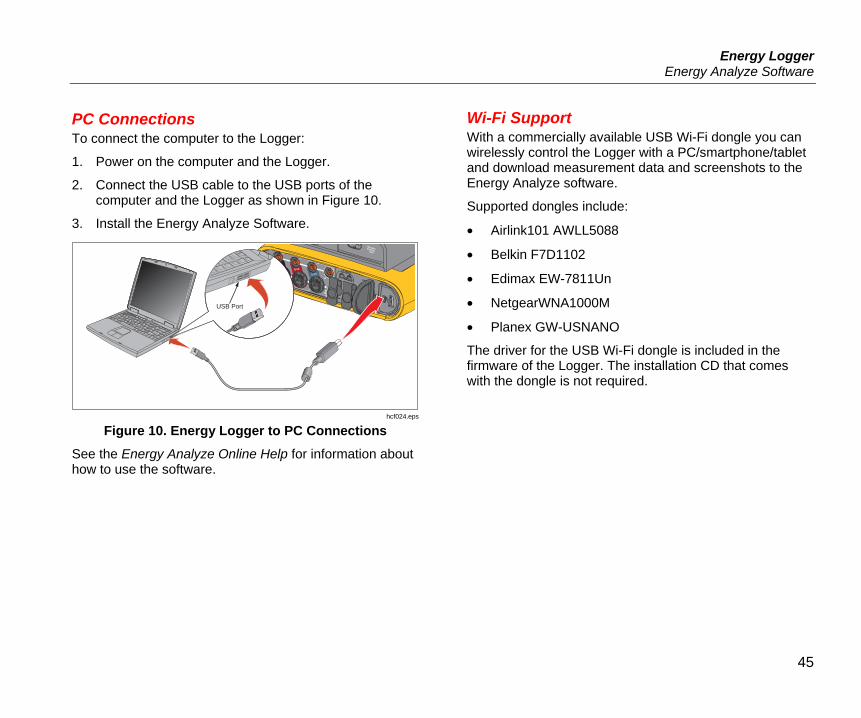
PC Connections To connect the computer to the Logger:
1. Power on the computer and the Logger.
2. Connect the USB cable to the USB ports of the computer and the Logger as shown in Figure 10.
3. Install the Energy Analyze Software.
hcf024.eps
Figure 10. Energy Logger to PC Connections See the Energy Analyze Online Help for information about how to use the software.
Wi-Fi Support With a commercially available USB Wi-Fi dongle you can wirelessly control the Logger with a PC/smartphone/tablet and download measurement data and screenshots to the Energy Analyze software.
Supported dongles include:
• Airlink101 AWLL5088
• Belkin F7D1102
• Edimax EW-7811Un
• NetgearWNA1000M
• Planex GW-USNANO
The driver for the USB Wi-Fi dongle is included in the firmware of the Logger. The installation CD that comes with the dongle is not required.
USB Port

1730 Users Manual
46
Wi-Fi Setup Together with the Wi-Fi dongle, the Logger is a Wi-Fi access point and establishes a Wi-Fi network. The client (PC/smartphone/tablet) needs to connect to this Wi-Fi network.
To setup a connection:
1. Connect the Wi-Fi dongle as shown in Figure 11.
Note The power consumption of the Wi-Fi dongle can exceed the power provided by the Logger. For a reliable connection Fluke strongly recommends that you use a powered USB hub.
USB Hub
PowerAdapter
USB Cable
Wi-Fi Dongle
hcf067.eps
Figure 11. Wi-Fi Connection 2. Make sure the Logger is turned on and in the range of
5 to 10 meters to the client.
3. To see the Wi-Fi connection details from the Logger:
a. Push .
b. Push (Instrument Settings)
c. Push (Tools)
d. Push to highlight Wi-Fi Configuration and push to confirm. Or, touch Wi-Fi Configuration touch target.
The Wi-Fi connection uses WPA2 encryption. The passphrase shown on the screen is required to establish a connection from a client to the device.
4. On the client, go to the list of available Wi-Fi networks and look for a network with the name: “Fluke1730<serial-no>” e.g. “Fluke1730<123456789>”.
5. Enter the passphrase provided on the Wi-Fi Configuration screen when you are asked. Depending on the operating system of the client, the passphrase is also called Security Key, Password, or similar.
After a few seconds the connection is established.
Note On Windows, the Wi-Fi icon in the notification area of the task bar is shown with an exclamation mark
. The exclamation mark indicates that this Wi-Fi interface does not provide an Internet access. This is normal since the Logger is not a gateway to the Internet.
Energy Logger Energy Analyze Software
47
Remote Control You can remotely control the instrument with a free third-party VNC client available for Windows, Android, Apple iOS, and Windows Phone after the Wi-Fi connection is setup. VNC stands for Virtual Network Computing and allows you to see the screen content, push the buttons, and touch the targets.
Tested VNC clients that work with the Logger are listed in Table 7.
Table 7. VNC Clients
Operating System Program Available from:
Windows 7/8 TightVNC www.tightvnc.org
Android bVNC[1] Google Play Store
iOS (iPhone, iPad) Mocha VNC[1] Apple App Store
Windows Phone Mocha VNC[1] Windows Phone Market
[1] The free version provides all features required for communication.
Configuration IP Address .............................................................. 10.10.10.1 Port ......................................................................... 5900 (default)
The VPN user name and password fields are not configured and can be left blank.
Wireless Access to PC Software No further setup is required to use Wi-Fi communication with the Fluke Energy Analyze software once the Wi-Fi connection to the device is setup. The Wi-Fi connection supports downloading the measurement files and screenshots and synchronizing the time. The selected communication media is shown in brackets. Refer to the online help for details about how to use the PC software.
hcf61.jpg

1730 Users Manual
48
Wiring Configurations V, A, Hz, +
Sing
le P
hase
Si
ngle
Pha
se IT
Split
Pha
se
(2P-
3W)
3-Ф
Wye
3-Ф
Wye
IT
(3P-
4W)
3-Ф
Wye
B
alan
ced
3-Ф
Del
ta
(3P-
3W)
3-Ф
2 E
lem
ent
Del
ta
Aro
n/B
lond
el
3-Ф
Del
ta O
pen
Leg
(3
P-3W
)
3-Ф
Hig
h Le
g D
elta
3-Ф
Del
ta
Bal
ance
d
VAN[1] V ● ● ● ●
VBN[1] V ● ● ◦
VCN[1] V ● ◦
VAB[1] V ●[2] ●[2] ● ● ● ● ●
VBC[1] V ●[2] ● ● ● ● ◦
VCA[1] V ●[2] ● ● ● ● ◦
IA A ● ● ● ● ● ● ● ● ● IB A ● ● ◦ ● X ● ● ◦IC A ● ◦ ● ● ● ● ◦f Hz ● ● ● ● ● ● ● ● ● Aux 1, 2 mV ● ● ● ● ● ● ● ● ●

Energy Logger Wiring Configurations
49
THD VA
[3] % ● ● ● ●
THD VB[3] % ● ● ◦
THD VC[3] % ● ◦
THD VAB[3] % ● ● ● ●
THD VBC[3] % ● ● ● ●
THD VCA[3] % ● ● ● ●
THD IA % ● ● ● ● ● ● ● ● THD IB % ● ● ◦ ● ● ● ● THD IC % ● ◦ ● ● ● ● ● Measured values [1] Simulated in load studies if Unom is specified [2] Secondary displayed values [3] Not available in load studies X Calculated values
○ Simulated values (derived from phase 1)

1730 Users Manual
50
Power
Sing
le P
hase
Sing
le P
hase
IT
Split
Pha
se (2
P-3W
)
3-Ф
Wye
3-Ф
Wye
IT
(3P-
4W)
3-Ф
Wye
B
alan
ced
3-Ф
Del
ta
(3P-
3W)
3-Ф
2 E
lem
ent
Del
ta
Aro
n/B
lond
el
3-Ф
Del
ta O
pen
Le
g (3
P-3W
)
3-Ф
Hig
h Le
g D
elta
3-Ф
Del
ta
Bal
ance
d
PA, PA fund[3] W ● ● ● ●
PB, PB fund[3] W ● ● ◦
PC, PC fund[3] W ● ◦
PTotal, PTotal fund[3] W ● ● ◦ ● ● ● ● ●
QA, QA fund[3] var ● ● ● ●
QB, QB fund[3] var ● ● ◦
QC, QC fund[3] var ● ◦
QTotal, QTotal fund[3] var ● ● ◦ ● ● ● ● ●
SA fund[1] VA ● ● ● ●
SB fund[1] VA ● ● ◦
SC fund[1] VA ● ◦
STotal fund[1] VA ● ● ◦ ● ● ● ● ●
PFA, DPFA[3] ● ● ● ●
PFB, DPFB[3] ● ● ◦
PFC, DPFC[3] ● ◦
PFTotal, DPFTotal[3] ● ● ◦ ● ● ● ● ●
● Measured values [1] Simulated in load studies if Unom is specified [2] Secondary displayed values [3] Not available in load studies X Calculated values
○ Simulated values (derived from phase 1)

Energy Logger Specifications
51
Specifications General Specifications Color LCD Display ................................................ 4.3-inch active matrix color TFT, 480 pixels x 272 pixels, resistive touch panel. Power/Charging/LED Indicator Warranty
1730 and Power Supply ..................................... 2 years (battery not included) Accessories ........................................................ 1 year
Calibration Cycle .................................................. 2 years Dimensions
1730 .................................................................... 19.8 cm x 16.7 cm x 5.5 cm (7.8 in x 6.6 in x 2.2 in) Power Supply ..................................................... 13.0 cm x 13.0 cm x 4.5 cm (5.1 in x 5.1 in x 1.8 in) 1730 with power supply attached ....................... 19.8 cm x 16.7 cm x 9 cm (7.8 in x 6.6 in x 3.5 in)
Weight 1730 .................................................................... 1.1 kg (2.5 lb) Power Supply ..................................................... 400 g (0.9 lb)
External Protection ............................................... Holster, Kensington lock
Environmental Specifications Operating Temperature ........................................ −10 °C to 50 °C (14 °F to 122 °F) Storage Temperature............................................ −20 °C to 60 °C (−4 °F to 140 °F), with battery: −20 °C to 50 °C (−4 °F to 122 °F) Operating Humidity .............................................. <10 °C (<50 °F) non condensing 10 °C to 30 °C (50 °F to 86 °F) ≤95 % 30 °C to 40 °C (86 °F to 104 °F) ≤75 % 40 °C to 50 °C (104 °F to 122 °F) ≤45 % Operating Altitude ................................................ 2,000 m (up to 4,000 m derate to 1000 V CAT II/600 V CAT III/300 V CAT IV) Storage Altitude .................................................... 12,000 m IP Rating ................................................................ IEC 60529:IP50, in connected condition with protection caps in place. Vibration ................................................................ MIL-T-28800E, Type 3, Class III, Style B Safety ..................................................................... IEC 61010-1: Overvoltage CAT IV, Measurement 1000 V CAT III / 600 V CAT IV, Pollution Degree 2 Electromagnetic Environment ............................. IEC 61326-1: Industrial

1730 Users Manual
52
Electromagnetic Compatibility ............................ Applies to use in Korea only. Class A Equipment (Industrial Broadcasting & Communication Equipment) [1] [1] This product meets requirements for industrial (Class A) electromagnetic wave equipment and the seller or user
should take notice of it. This equipment is intended for use in business environments and not to be used in homes.
Radio Frequency Emissions ................................ IEC CISPR 11: Group 1, Class A. Group 1 have intentionally generated and/or use conductively coupled radio-frequency energy which is necessary for the internal functioning of the equipment itself. Class A equipment is suitable for use in non-domestic locations and/or directly connected to a low-voltage power supply network.
Electrical Specifications Power Supply
Voltage Range .................................................... nominal 100 V to 500 V (85 V min to 550 V max) using safety plug input Mains Power ....................................................... nominal 100 V to 240 V (85 V min to 265 V max) using IEC 60320 C7 input (figure 8 power cord) Power consumption ............................................ Maximum 50 VA (max. 15 VA when powered using IEC 60320 input) Standby Power ................................................... <0.3 W only when powered using IEC 60320 input Efficiency ............................................................ ≥68.2 % (in accordance with energy efficiency regulations) Mains Frequency ................................................ 50/60 Hz ±15 % Battery Power ..................................................... Li-ion 3.7 V, 9.25 Wh, customer-replaceable On-Battery Runtime ............................................ up to 4 hr (up to 5.5 hr in energy saving mode) Charging Time .................................................... <6 hr
Data Acquisition Resolution ........................................................... 16-bit synchronous sampling Sampling Frequency ........................................... 5120 Hz Input Signal Frequency ....................................... 50/60 Hz (42.5 to 69 Hz) Wiring Configurations ......................................... 1-Φ, 1-Φ IT, Split phase, 3-Φ wye, 3-Φ wye IT, 3-Φ wye balanced, 3-Φ delta, 3-Φ Aron/Blondel (2-element
delta), 3-Φ delta open leg, 3-Φ high leg delta, 3-Φ delta balanced. Currents only (load studies) Interfaces
USB-A ............................................................. File transfer via USB Flash Drive and Wi-Fi, Firmware updates, max. supply current: 120 mA USB-mini ......................................................... Data download device to PC Extension port ................................................. Accessories

Energy Logger Electrical Specifications
53
Total Harmonic Distortion (THD) ........................ THD for voltage and current is calculated on 25 harmonics Averaging Time .................................................. User selectable: 1 sec, 5 sec, 10 sec, 30 sec, 1 min, 5 min, 10 min, 15 min, 30 min Averaging time min/max values Voltage ........................................................... Full cycle RMS (20 ms at 50 Hz, 16.7 ms at 60 Hz) according to IEC61000-4-30 Class A Current ............................................................ Half cycle RMS (10 ms at 50 Hz, 8.3 ms at 60 Hz) Aux, Power ..................................................... 200 ms Demand Interval ................................................. User selectable: 5 min, 10 min, 15 min, 20 min, 30 min, off Data Storage ...................................................... Internal flash memory (not user replaceable) Memory Size ....................................................... Typical 20 logging sessions of 10 weeks with 10-minute intervals [1]
Logging Period
Averaging Period Recommended for 20 sessions
Logging Period for 1 session
1 sec 3 hr 2.5 days
5 sec 15 hr 12 days
10 sec 28 hr 24 days
30 sec 3.5 days 10 weeks
1 min 7 days 20 weeks
5 min 5 weeks 2 years
10 min 10 weeks >2 years
15 min 3.5 months >2 years
30 min 7 months >2 years [1] The number of possible logging sessions and logging period depends on user requirements.

1730 Users Manual
54
Voltage Inputs Number of Inputs ................................................ 4 (3 phases and neutral) Maximum Input Voltage ...................................... 1000 Vrms (1700 Vpk) phase to neutral Input Impedance ................................................. 10 MΩ each phase to neutral Bandwidth ........................................................... 42.5 Hz - 2.3 kHz Scaling ................................................................ 1:1, variable
Current Inputs Number of Inputs ................................................ 3, mode selected automatically for attached sensor Current Sensor Output Voltage
Clamp ............................................................. 500 mVrms / 50 mVrms; CF 2.8 Rogowski Coil ................................................. 150 mVrms / 15 mVrms at 50 Hz, 180 mVrms / 18 mVrms at 60 Hz; CF 4;
all at nominal probe range Range ................................................................. 1 A to 150 A / 10 A to 1500 A with iFlex1500-12
3 A to 300 A / 30 A to 3000 A with iFlex3000-24 6 A to 600 A / 60 A to 6000 A with iFlex6000-36 40 mA to 4 A / 0.4 A to 40 A with 40 A clamp i40s-EL
Bandwidth ........................................................... 42.5 Hz – 2.3 kHz Scaling ................................................................ 1:1, variable
Auxiliary Inputs Number of Inputs ................................................ 2 Input Range ........................................................ 0 to ±10 V dc, 1 reading/s Scale factor ......................................................... Format: mx + b (Gain and offset) user configurable Displayed units ................................................... User configurable (up to 8 characters, for example °C, psi, or m/s)

Energy Logger Electrical Specifications
55
Accuracy at Reference Conditions
Parameter Range Max. Resolution Intrinsic Accuracy at Reference
Conditions (% of Reading + % of Range)
Voltage 1000 V 0.1 V ±(0.2 % + 0.01%)
Cur
rent
Direct Input Rogowski Mode
15 mV 0.01 mV ±(0.3 % + 0.02 %) 150 mV 0.1 mV ±(0.3 % + 0.02 %)
Clamp Mode 50 mV 0.01 mV ±(0.2 % + 0.02 %) 500 mV 0.1 mV ±(0.2 % + 0.02 %)
1500A Flex 150 A 0.01 A ±(1 % + 0.02 %) 1500 A 0.1 A ±(1 % + 0.02 %)
3000 A Flexi 300 A 1 A ±(1 % + 0.02 %) 3000 A 10 A ±(1 % + 0.02 %)
6000 A Flexi 600 A 1 A ±(1.5 % + 0.03 %) 6000 A 10 A ±(1.5 % + 0.03 %)
40 A 4 A 1 mA ±(0.7 % + 0.02 %) 40 A 10 mA ±(0.7 % + 0.02 %)
Frequency 42.5 Hz to 69 Hz 0.01 Hz ±0.1 %
Aux Input ±10 Vdc 0.1 mV ±(0.2 % + 0.02 %)
Voltage Min/Max 1000 V 0.1 V ±(1 % + 0.1 %)
Current Min/Max defined by accessory defined by accessory ±(5 % + 0.2 %)
THD on Voltage 1000 % 0.1 % ±(2.5 % + 0.05 %)
THD on Current 1000 % 0.1 % ±(2.5 % + 0.05 %)

1730 Users Manual
56
Power/Energy
Parameter Direct Input[1] iFlex1500-12 iFlex3000-24 iFlex6000-36 i40S-EL
Clamp: 50 mV/500 mV Rogowski: 15 mV/150 mV 150 A/1500 A 300 A/3000 A 600/6000 A 4 A/40 A
Power Range W, VA, var Clamp: 50 W/500 W
Rogowski: 15 W/150 W 150 kW/1.5 MW 300 kW/3 MW 600 kW/6 MW 4 kW/40 kW
Max. Resolution W, VA, var 0.1 W 0.01 kW/0.1 kW 1 kW/10 kW 1 kW/10 kW 1 W/10 W
Max. Resolution PF, DPF 0.01
Phase (Voltage to Current) [1] ±0.2 ° ±0.28 ° ±1 °
[1] Only for calibration laboratories

Energy Logger Electrical Specifications
57
Intrinsic Uncertainty ±(% of measurement value + % of power range)
Parameter Influence Quantity
Direct Input [1] iFlex1500-12 iFlex3000-24 iFlex6000-36 i40S-EL
Clamp: 50 mV/500 mV Rogowski: 15 mV/150 mV 150 A/1500 A 300 A/3000 A 600 A/6000 A 4 A/40 A
Active Power P Active Energy Ea
PF ≥ 0.99 0.5 % + 0.005 % 1.2 % + 0.005 % 1.2 % + 0.0075 % 1.7 % + 0.0075 % 1.2 % + 0.005 %
0.1≤ PF < 0.99
0.5 + √1 −3 × %+ 0.005 %
1.2 + √1 −2 × %+ 0.00 5 %
1.2 + √1 −2 × %+ 0.0075%
1.7 + √1 −2 × %+ 0.0075 %
1.2 + 1.7 × √1 − %+ 0.005 %
Apparent Power S Apparent Energy Eap 0≤ PF ≤ 1 0.5 % + 0.005 % 1.2 % + 0.005 % 1.2 % + 0.0075 % 1.7 % + 0.0075 % 1.2 % + 0.005 %
Reactive Power Q Reactive Energy Er 0≤ PF ≤ 1 2.5 % of measured apparent power/energy
Power Factor PF Displacement Power Factor DPF/cosφ
- Reading ± 0.025
Additional uncertainty (% of power high-range)
VP-N > 250 V 0.015 % 0.015 % 0.0225 % 0.0225 % 0.015 %
[1] Only for calibration laboratories
Reference Conditions: Environmental: 23 °C ±5 °C, instrument operating for at least 30 minutes, no external electrical/magnetic field, RH <65 %
Input conditions: CosΦ/PF=1, Sinusoidal signal f=50/60 Hz, power supply 120 V/230 V ±10 %.
Current and power specifications: Input voltage 1ph: 120 V/230 V or 3ph wye/delta: 230 V/400 V
Input current > 10 % of current range
Primary conductor of clamps or Rogowski coil in center position
Temperature Coefficient: Add 0.1 x specified accuracy for each degree C above 28 °C or below 18 °C

1730 Users Manual
58
Example: Measurement at 120 V/16 A using an iFlex1500-12 in low range. Power Factor is 0.8 Active power uncertainty : = ± 1.2% +√ .× . + 0.005% × = ±(1.575% + 0.005% × 1000 × 150 ) = ±(1.575% + 7.5 ) The uncertainty in W is ±(1.575% × 120 × 16 × 0.8 + 7.5 ) = ±31.7W Apparent power uncertainty : = ± 1.2% + 0.005% × = ±(1.2% + 0.005% × 1000 × 150 ) = ±(1.2% + 7.5 ) The uncertainty in VA is ±(1.2% × 120 × 16 + 7.5 ) = ±30.54VA Reactive/non-active power uncertainty : = ±(2.5% × ) = ±(2.5% × 120 × 16 ) = ±48
In case of a measured voltage that is >250 V, the additional error is calculated with: = 0.015% × = 0.015% × 1000 × 1500 = 225W / VA / var

Energy Logger Electrical Specifications
59
iFlex Probe Specifications Measuring range
iFlex 1500-12 ........................................ 1 to 150 A ac / 10 to 1500 A ac iFlex 3000-24 ........................................ 3 to 300 A ac / 30 to 3000 A ac iFlex 6000-36 ........................................ 6 to 600 A ac / 60 to 6000 A ac Nondestructive current ......................... 100 kA (50/60 Hz) Intrinsic Error at reference condition[1] ............................................. ±0.7% of reading Accuracy 1730 + iFlex iFlex 1500-12 & iFlex 3000-24 .............. ±(1 % of reading + 0.02 % of
range) iFlex 6000-36 ........................................ ±(1.5 % of reading + 0.03 % of
range) Temperature Coefficient over operating temperature range iFlex 1500-12 & iFlex 3000-24 .................. 0.05 % of reading / °C (0.09 %
of reading / °F) iFlex 6000-36 ............................................ 0.1 % of reading / °C (0.18 %
of reading / °F)
Positioning error with position of conductor in the probe window (see Figure 12)
iFlex1500-12, iFlex3000-24 iFlex6000-36Probe Window
A ±(1 % of reading + 0.02 % of range)
±(1.5 % of reading + 0.03 % of range)
Probe Window B
±(1.5 % of reading + 0.02 % of range)
±(2.0 % of reading + 0.03 % of range)
Probe Window C
±(2.5 % of reading + 0.02 % of range)
±(4 % of reading + 0.03 % of range)
External magnetic field rejection in reference to external current (with cable >100 mm from the head-coupling and r-coil) .................................................. 40 dB Phase shift ................................................ < ±0.5°
iFlex1500-12: 88mmiFlex3000-24: 185mmiFlex6000-36: 282mm
C
B
A
1/3
1/3
1/3
hcf057.eps
Figure 12. iFlex Probe Window Bandwidth ................................................... 10 Hz to 2.5 kHz Frequency derating ..................................... I x f ≤385 kA Hz Working Voltage .......................................... 1000 V CAT III, 600 V CAT IV
[1] Reference Condition: • Environmental: 23 °C ±5 °C, no external electrical/magnetic field, RH 65 % • Primary conductor in center position

1730 Users Manual
60
Transducer length iFlex 1500-12 .......................................... 305 mm (12 in) iFlex 3000-24 .......................................... 610 mm (24 in) iFlex 6000-36 .......................................... 915 mm (36 in)
Transducer cable diameter ......................... 7.5 mm (0.3 in) Minimum bending radius ............................. 38 mm (1.5 in) Output cable length iFlex 1500-12 .............................................. 2 m (6.6 ft) iFlex 3000-24 & iFlex 6000-36 .................... 3 m (9.8 ft) Weight
iFlex 1500-12 .......................................... 115 g iFlex 3000-24 .......................................... 170 g iFlex 6000-36 .......................................... 190 g
Material Transducer cable .................................... TPR Coupling .................................................. POM + ABS/PC Output cable ........................................... TPR/PVC
Operating Temperature ............................. -20 °C to +70 °C (-4 °F to 158°F) temperature of conductor under test shall not exceed 80°C (176°F)
Storage temperature ................................... -40 °C to +80 °C (-40 °F to 176 °F)
Operating relative humidity ......................... 15 % to 85 % noncondensing IP Rating ..................................................... IEC 60529:IP50 Operating Altitude ....................................... 2000 m (6,500 ft) up to 4000
m (13,000 ft) derate to 1000 V CAT II/600 V CAT III/300 V CAT IV
Storage Altitude .......................................... 12 km (40,000 ft) Warranty ..................................................... 1 year
i40s-EL Current Clamp Specifications Measuring range ..................................... 40 mA to 4 Aac / 0.4 Aac to 40 Aac Crest factor ............................................. ≤ 3 Nondestructive current ............................ 200 A (50/60Hz) Intrinsic Error at reference condition[1]..... ±0.5% of reading Accuracy 1730 + clamp........................... ±(0.7 % of reading + 0.02% of
range) Phase shift
<40 mA................................................ unspecified 40 mA to 400 mA ................................ < ± 1.5° 400 mA to 40 A ................................... < ± 1°
Temperature Coefficient over operating temperature range .................. 0.015 % of reading / °C
0.027 % of reading / °F Influence of adjacent conductor .............. ≤15 mA/A (@ 50/60 Hz) Influence of conductor position in jaw opening ......................................... ±0.5 % of reading (@ 50/60 Hz) Bandwidth ............................................... 10 Hz to 2.5 kHz Working Voltage ...................................... 600 V CAT III, 300 V CAT IV
[1] Reference Condition: • Environmental: 23 °C ±5 °C, no external electrical/magnetic field, RH 65 % • Primary conductor in center position
Size (H x W x L) ...................................... 110 mm x 50 mm x 26 mm (4.33 in x 1.97 in x 1.02 in)
Maximum conductor size ........................ 15 mm (0.59 in) Output cable length ................................. 2 m (6.6 ft) Weight ..................................................... 190 g (6.70 oz) Material ................................................... Case ABS and PC
Output cable: TPR/PVC Temperature operating ........................... -10 °C to +55 °C
(-14 °F to 131 °F) Temperature, non-operating ................... -20 °C to +70 °C
(-4 °F to 158 °F)

Energy Logger Electrical Specifications
61
hcf027.eps
Single Insulated current carrying conductor
Release button
Load direction arrow
Tactile barrier
Figure 13. i40s-EL Setup Relative Humidity, operating ................... 15 % to 85 % non condensing Max Operating Altitude .......................... 2000 m (6,500 ft)
up to 4000 m (13,000 ft) derate to 600 V CAT II/300 V CAT IV
Max Storage Altitude ............................. 12 km (40,000 ft) Warranty ................................................. 1 year
Auxiliary Input Cable Length ..................................................................... 2 m (6.6 ft) The auxiliary input cable is an optional accessory. The cable has a 3-pin plug to connect to the 1730 and a BNC connector. The cable is a non-shielded 3-wire cord. See Figure 14.
hcf068.eps
Color Signal
Brown +
Black -
Blue Not used
Figure 14. Auxiliary Input Cable Pin-Out
600V CAT III
AC CURRENT CLAMP
SERIAL NUMBER
14
11
12
13

1730 Users Manual
62