09 11 10 Web 2.0 Weekly
21
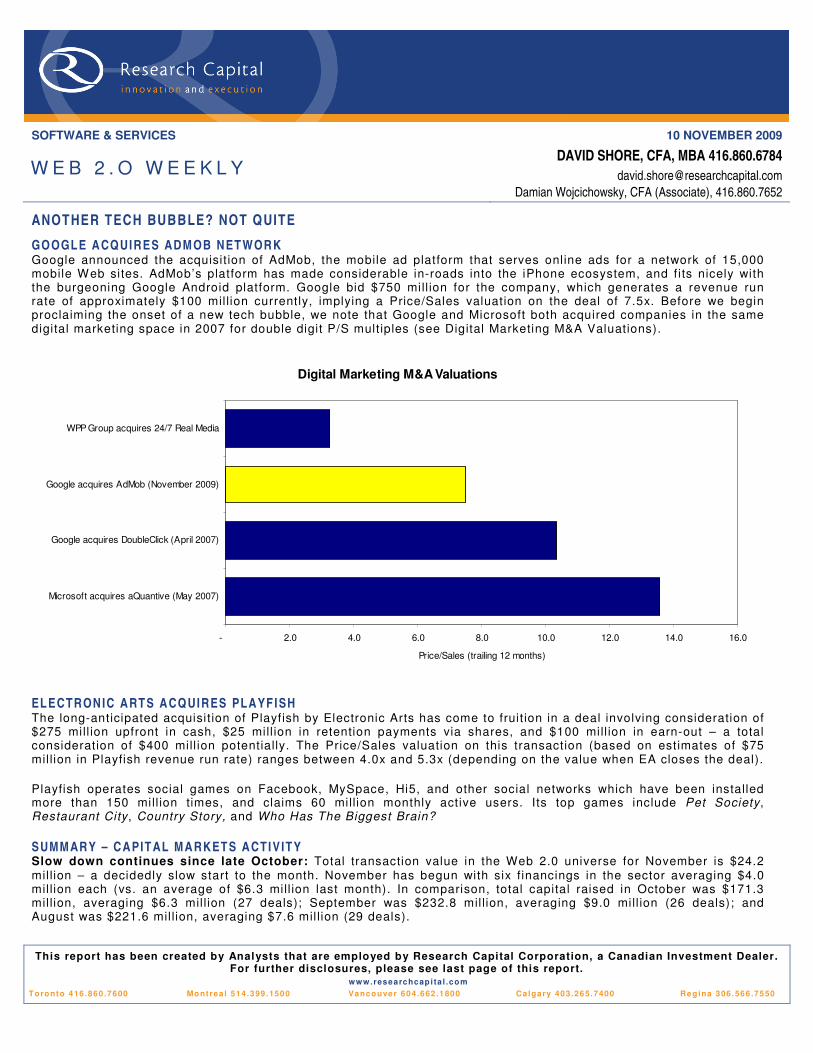
SOFTWARE & SERVICES 10 NOVEMBER 2009 WEB 2.O WEEKLY DAVID SHORE, CFA, MBA 416.860.6784 [email protected] Damian Wojcichowsky, CFA (Associate), 416.860.7652 ANOTHER TECH BUBBLE? NOT QUITE GOOGLE ACQUIRES ADMOB NETWORK Google announced the acquisition of AdMob, the mobile ad platform that serves online ads for a network of 15,000 mobile Web sites. AdMob’s platform has made considerable in-roads into the iPhone ecosystem, and fits nicely with the burgeoning Google Android platform. Google bid $750 million for the company, which generates a revenue run rate of approximately $100 million currently, implying a Price/Sales valuation on the deal of 7.5x. Before we begin proclaiming the onset of a new tech bubble, we note that Google and Microsoft both acquired companies in the same digital marketing space in 2007 for double digit P/S multiples (see Digital Marketing M&A Valuations). Digital Marketing M&A Valuations - 2.0 4.0 6.0 8.0 10.0 12.0 14.0 16.0 Microsoft acquires aQuantive (May 2007) Google acquires DoubleClick (April 2007) Google acquires AdMob (November 2009) WPP Group acquires 24/7 Real Media Price/Sales (trailing 12 months) ELECTRONIC ARTS ACQUIRES PLAYFISH The long-anticipated acquisition of Playfish by Electronic Arts has come to fruition in a deal involving consideration of $275 million upfront in cash, $25 million in retention payments via shares, and $100 million in earn-out – a total consideration of $400 million potentially. The Price/Sales valuation on this transaction (based on estimates of $75 million in Playfish revenue run rate) ranges between 4.0x and 5.3x (depending on the value when EA closes the deal). Playfish operates social games on Facebook, MySpace, Hi5, and other social networks which have been installed more than 150 million times, and claims 60 million monthly active users. Its top games include Pet Society , Restaurant City , Country Story, and Who Has The Biggest Brain? SUMMARY – CAPITAL MARKETS ACTIVITY Slow down continues since late October: Total transaction value in the Web 2.0 universe for November is $24.2 million – a decidedly slow start to the month. November has begun with six financings in the sector averaging $4.0 million each (vs. an average of $6.3 million last month). In comparison, total capital raised in October was $171.3 million, averaging $6.3 million (27 deals); September was $232.8 million, averaging $9.0 million (26 deals); and August was $221.6 million, averaging $7.6 million (29 deals). This report has been created by Analysts that are employed by Research Capital Corporation, a Canadian Investment Dealer. For further disclosures, please see last page of this report. www.researchcapital.com Toronto 416.860.7600 Montreal 514.399.1500 Vancouver 604.662.1800 Calgary 403.265.7400 Regina 306.566.7550
-
Upload
david-shore -
Category
Technology
-
view
942 -
download
3
description
Transcript of 09 11 10 Web 2.0 Weekly
SOFTWARE & SERVICES 10 NOVEMBER 2009
W E B 2 . O W E E K L Y
DAVID SHORE, CFA, MBA 416.860.6784
Damian Wojcichowsky, CFA (Associate), 416.860.7652
ANOTHER TECH BUBBLE? NOT QUITE
GOOGLE ACQUIRES ADMOB NETWORK Google announced the acquisit ion of AdMob, the mobile ad platform that serves online ads for a network of 15,000 mobile Web sites. AdMob’s platform has made considerable in-roads into the iPhone ecosystem, and fi ts nicely with the burgeoning Google Android platform. Google bid $750 mill ion for the company, which generates a revenue run rate of approximately $100 mil lion currently, implying a Price/Sales valuation on the deal of 7.5x. Before we begin proclaiming the onset of a new tech bubble, we note that Google and Microsoft both acquired companies in the same digital marketing space in 2007 for double digit P/S multiples (see Digital Marketing M&A Valuations).
Digital Marketing M&A Valuations
- 2.0 4.0 6.0 8.0 10.0 12.0 14.0 16.0
Microsoft acquires aQuantive (May 2007)
Google acquires DoubleClick (April 2007)
Google acquires AdMob (November 2009)
WPP Group acquires 24/7 Real Media
Price/Sales (trailing 12 months)
ELECTRONIC ARTS ACQUIRES PLAYF ISH The long-anticipated acquisit ion of Playfish by Electronic Arts has come to fruit ion in a deal involving consideration of $275 mill ion upfront in cash, $25 mill ion in retention payments via shares, and $100 mill ion in earn-out – a total consideration of $400 mill ion potentially. The Price/Sales valuation on this transaction (based on estimates of $75 mil lion in Playfish revenue run rate) ranges between 4.0x and 5.3x (depending on the value when EA closes the deal).
Playfish operates social games on Facebook, MySpace, Hi5, and other social networks which have been installed more than 150 mill ion times, and claims 60 million monthly active users. Its top games include Pet Society, Restaurant City , Country Story, and Who Has The Biggest Brain?
SUMMARY – CAPITAL MARKETS ACTIVITY Slow down continues since late October: Total transaction value in the Web 2.0 universe for November is $24.2 mil lion – a decidedly slow start to the month. November has begun with six f inancings in the sector averaging $4.0 mil lion each (vs. an average of $6.3 mill ion last month). In comparison, total capital raised in October was $171.3 mil lion, averaging $6.3 mil lion (27 deals); September was $232.8 mil lion, averaging $9.0 mill ion (26 deals); and August was $221.6 mil lion, averaging $7.6 mil lion (29 deals).
This report has been created by Analysts that are employed by Research Capital Corporation, a Canadian Investment Dealer. For further disclosures, please see last page of this report.
www.researchcapi ta l .com
Toronto 416 .860 .7600 Montrea l 514.399 .1500 Vancouver 604 .662 .1800 Calgary 403 .265.7400 Regina 306 .566 .7550

Page 2
THE WE B 2 . 0 UNI VE RSE
Eighty-nine public Web 2.0 companies: Our Web 2.0 universe contains 89 companies, with a combined market cap of approximately $71 bil lion (Figure 1). The median market cap for the group is $41.8 mil lion, with average trail ing revenue of $163 mill ion (median $56 mill ion). The companies are also generally profitable with a median EBITDA margin of 11.6%. On a valuation basis, the overall average is 5.3x trai ling revenue (median 1.8x) and 11.1x trail ing EBITDA (median 8.3x). Twenty of the companies have more than 500 employees.
Comparable Company Analys is > Web 2.0
Company Name LTM as of Ticker E xchange
Trading
Currency HQ
Current
Price
USD Market
Cap ($m)
USD LTM Total
Rev ($m)
USD LTM Total
E B ITDA ($m)
EB ITDA
%
TEV/LTM
Revenue
TEV/LTM
E B ITDA EmployeesAccelerize New Media , Inc. 6/30/2009 AC LZ OTCB B US D United S ta tes 0.75 21.0 4.4 (3.7) -83.3% 5.8x - 11
Actoz S oft C o. , Ltd. 6/30/2009 A052790 K OS E KR W S outh K orea 15,450 112.1 108.7 25.9 23.8% 0.7x 3.1x NA
AQ Interactive, Inc. 6/30/2009 3838 T S E J P Y J apan 47,400 28.8 66.1 (2.0) -2.9% 0.1x - NA
Associated Media Holdings Inc. 6/30/2007 AS MH OTCP K US D United S ta tes 0.01 0.4 0.1 (2.3) NM 13.2x - 3
B igs tring C orp. 6/30/2009 B S GC OTCB B US D United S ta tes 0.03 2.0 0.1 (1.5) NM 48.2x - 4
B etawave C orporation 6/30/2009 BW AV OTCB B US D United S ta tes 0.03 0.9 9.4 (12.6) NM - - 51
B eyond C ommerce, Inc. 6/30/2009 B YOC OTCB B US D United S ta tes 0.07 3.5 11.7 (12.8) NM 0.8x - 101
B right Things plc 3/31/2009 AIM:B G T AIM GB P United K ingdom 0.01 5.4 0.0 (2.7) NM - - NA
B roadWebAs ia Inc. 9/30/2008 BW BA OTCP K US D United S ta tes 0.03 2.5 0.0 (4.6) NM - - 46
CDC C orp. 6/30/2009 CHIN.A NasdaqGS US D Hong K ong 2.52 267.1 361.6 25.1 6.9% 0.7x 10.5x 2,227
C hangyou.com L imited 9/30/2009 C YOU NasdaqGS US D China 33.14 1,822.7 255.3 157.4 61.7% 5.9x 9.6x 628
C hina Ga teway C orporation 9/30/2008 CGW Y OTCP K US D United S ta tes 0.00 0.0 6.7 (6.6) -98.9% 0.0x - 37
C hinese G amer Interna tiona l 9/30/2009 G T S M:3083 G T S M TWD T aiwan 444 1,151.5 68.3 39.6 58.0% 15.7x 27.0x NA
C LIC K E R Inc. 5/31/2009 C LK Z OTCB B US D United S ta tes 0.01 0.5 2.5 (1.2) -45.8% 0.2x - 22
C ornerWorld C orpora tion 7/31/2009 CW R L OTCB B US D United S ta tes 0.06 5.7 6.8 NM NM 2.4x - 16
C yberplex Inc. 6/30/2009 T S X:C X T S X CAD Canada 1 84.2 89.8 9.7 10.8% 0.7x 6.6x NA
DADA S pA 6/30/2009 CM:DA CM E UR Italy 7.35 174.5 241.9 31.8 13.1% 0.9x 7.0x NA
DXN Holdings B hd 8/31/2009 DXN K LS E MYR Ma lays ia 0.63 41.1 77.3 (84.0) NM 0.7x - NA
Dibz International, Inc. NA DIB Z OTCP K US D United S ta tes 0.00 0.0 NA NM NM - - NA
Digita lP os t Interactive, Inc. 6/30/2009 DGLP OTCB B US D United S ta tes 0.05 3.5 1.0 (1.4) NM 5.5x - 7
Digita lT own, Inc. 8/31/2009 DGTW OTCB B US D United S ta tes 0.50 13.7 0.0 (1.8) NM - - 3
Dolphin Digita l Media , Inc. 6/30/2009 DPDM OTCB B US D United S ta tes 0.40 21.5 0.6 (3.4) NM 38.6x - NA
E olith Co. Ltd. 12/31/2008 A041060 K OS E KR W S outh K orea 570 34.6 15.4 (3.6) -23.6% 2.4x - NA
E xtens ions , Inc. 6/30/2009 E XT I OTC P K US D United S ta tes 0.25 11.1 NM NM NM - - 2
F luid Mus ic Canada , Inc. 6/30/2009 T S X:FMN T S X CAD United S ta tes 1.80 86.8 5.3 (5.1) -95.2% 15.4x - NA
F rogs ter Interactive P ictures AG 6/30/2009 F R G XT R A E UR Germany 18.66 70.0 9.6 (4.5) -47.0% 7.1x - NA
G amania Digita l E ntertainment C o. , Ltd. 9/30/2009 6180 G T S M TWD T aiwan 45.05 211.0 151.2 24.9 16.5% 1.2x 7.5x NA
G ameOn C o Ltd. 6/30/2009 3812 T S E J P Y J apan 72,200 78.1 81.9 20.1 24.5% 0.0x 0.2x NA
G eoS entric Oyj 6/30/2009 G E O1V HLS E E UR F inland 0.06 78.9 5.4 (17.4) NM 14.5x - 115
G iant Interactive G roup, Inc. 6/30/2009 GA NY S E US D China 7 1,648.5 198.5 124.1 62.5% - - 1,570
G igaMedia Ltd. 3/31/2009 G IGM NasdaqGS US D T aiwan 3.82 208.3 183.6 NM NM 0.7x - 751
G ravity Co. , Ltd 6/30/2009 GR V Y NasdaqGM US D S outh K orea 1.57 43.6 49.1 16.6 33.9% - - 469
G ree, Inc. 9/30/2009 T S E :3632 T S E J P Y J apan 5 ,410 2,708.5 210.3 122.2 58.1% 12.4x 21.3x NA
GungHo Online E ntertainment, Inc. 6/30/2009 3765 OS E J P Y J apan 205,400 263.2 119.5 26.6 22.2% 1.9x 8.6x NA
HanbitS oft, Inc. 6/30/2009 A047080 K OS E KR W S outh K orea 3 ,580 65.7 60.7 1.4 2.3% 0.9x 36.9x NA
IAC /InterActiveC orp. 9/30/2009 IAC I NasdaqGS US D United S ta tes 19.61 2,587.9 1,359.6 82.4 6.1% 0.7x 11.5x 3,200
IAS E nergy, Inc. 4/30/2009 IAS A.E OTCB B US D C anada 0.12 8.5 0.0 (0.6) NM - - NA
is eemedia Inc. 6/30/2009 IE E T S XV CAD Canada 0.19 9.2 1.7 (4.5) NM 5.2x - NA
J umbuck E nterta inment L imited 6/30/2009 AS X:J MB AS X AUD Aus tralia 0.34 14.5 16.7 7.2 42.8% 0.5x 1.1x 79
K AB Dis tribution Inc. 6/30/2009 T S X:K AB T S X CAD Canada 0 0.6 67.9 4.0 5.8% - - NA
K ingsoft C o. Ltd. 6/30/2009 3888 S E HK HKD China 8 1,074.8 139.1 61.4 44.2% 7.7x 17.5x 2,463
L ingo Media C orporation 6/30/2009 T S XV :LM T S XV CAD Canada 0.98 11.2 1.2 (1.9) NM 8.6x - NA
L iveW orld Inc. 6/30/2009 LVWD OTCP K US D United S ta tes 0.04 1.1 10.6 (0.1) -1.2% - - NA
LookS mart, Ltd. 9/30/2009 LOOK NasdaqGM US D United S ta tes 1.17 20.0 54.0 (4.9) -9.0% - - 90
Magnitude Information S ys tems Inc. 6/30/2009 MAGY OTCB B US D United S ta tes 0.01 4.1 0.1 (2.5) NM - - 14
Mixi, Inc. 6/30/2009 2121 T S E J P Y J apan 740000.00 1,275.1 136.8 46.2 33.8% 8.4x 25.0x NA
Modern T imes G roup Mtg AB 9/30/2009 MTG B OM S E K S weden 323.00 3,056.7 2,002.6 282.9 14.1% 1.8x 12.7x 2,969
MOKO.mobi L imited 6/30/2009 MK B AS X AUD Aus tralia 0.09 7.9 0.7 (2.4) NM 10.0x - NA
Myriad G roup AG 6/30/2009 MY R N S W X CHF S witzerland 4.79 205.4 63.0 3.4 5.4% 3.2x - 405
NE OW IZ G ames Corpora tion 12/31/2008 A095660 K OS E KR W S outh K orea 39250.00 693.4 207.3 55.7 26.8% 3.3x 12.3x NA
NetDragon W ebS oft, Inc. 6/30/2009 777 S E HK HKD China 5 351.2 89.3 25.7 28.7% 2.3x 8.0x 3,109
Netease.com Inc. 6/30/2009 NT E S NasdaqGS US D China 42.00 5,435.9 472.4 297.4 63.0% - - 3,109
NeuLion Incorporated 6/30/2009 T S X:NLN T S X CAD Canada 0.68 72.8 21.5 (13.0) -60.3% 2.9x - 237
NeXplore C orporation 6/30/2009 NXP C OTCP K US D United S ta tes 1 41.8 1.7 (13.3) NM 27.0x - NA
Ngi G roup Inc. 6/30/2009 2497 T S E J P Y J apan 26600.00 36.8 93.0 6.9 7.4% - - NA
Northgate T echnologies L imited 6/30/2009 590057 B S E INR India 30.85 22.4 82.9 (41.5) -50.0% 0.3x - NA
Open T ext C orp. 9/30/2009 OT E X NasdaqGS US D C anada 39.04 2,201.1 814.5 211.1 25.9% 2.8x 10.8x 3,900
Openwave S ys tems Inc. 9/30/2009 OPW V NasdaqGS US D United S ta tes 2.15 179.6 190.5 5.6 3.0% 0.4x 13.3x 590
P erfect W orld C o. , Ltd. 6/30/2009 PW R D NasdaqGS US D China 49.08 2,473.2 255.6 142.2 55.6% 0.9x 1.5x 2,096
P NI Digita l Media Inc. 6/30/2009 T S XV :P N T S XV CAD Canada 1.76 55.4 21.0 2.3 11.0% 2.5x 23.1x NA
Quepasa C orp. 6/30/2009 QP S A OTCB B US D United S ta tes 1 17.8 0.2 (10.6) NM - - 74
OAO R B C Information S ys tems 12/31/2007 R B C I R T S US D R us s ia 1.60 222.0 157.4 20.6 13.1% 0.0x 0.4x NA
S handa Interactive E nterta inment Ltd. 6/30/2009 S NDA NasdaqGS US D China 50.41 3,390.3 629.0 296.7 47.2% - - 3,124
S hutterfly, Inc. 9/30/2009 S FLY NasdaqGS US D United S ta tes 15.55 399.2 223.1 27.0 12.1% 1.3x 10.6x 514
S K C ommunications C o. , Ltd. 12/31/2008 A066270 K OS E KR W S outh K orea 7150.00 250.9 192.7 12.5 6.5% 1.3x 20.0x NA
S NAP Interactive, Inc. 6/30/2009 S T V I OTC B B US D United S ta tes 0 4.3 3.5 0 .9 27.0% 0.8x 2.9x 11
S NM G loba l Holdings 9/30/2008 S NMN OTCP K US D United S ta tes 0.00 0.0 2.0 (0.7) -34.8% 1.1x - 33
S ocial Media V entures Inc. 12/31/2008 S MV I OTC P K US D United S ta tes 0 0.0 0.1 (0.1) -60.6% 4.5x - NA
S ocialwis e, Inc. 6/30/2009 S C LW OTCB B US D United S ta tes 0.55 24.3 0.0 (5.6) NM - - NA
S ohu.com Inc. 9/30/2009 S OHU NasdaqGS US D China 57.86 2,225.1 501.0 218.5 43.6% 3.4x 7.7x 3,197
S park Networks , Inc. 6/30/2009 LOV AME X US D United S ta tes 3 55.0 50.5 10.8 21.3% 1.0x 4.9x 183
S pectrumDNA, Inc. 6/30/2009 S P XA OTCB B US D United S ta tes 0 7.3 0.1 (2.5) NM - - 7
T encent Holdings Ltd. 6/30/2009 700 S E HK HKD China 139 32,555.5 1,391.6 680.3 48.9% 25.8x - 6,421
T he P arent C ompany 8/2/2008 K IDS .Q OTCP K US D United S ta tes 0.01 0.2 112.0 (13.5) -12.0% 0.2x - 347
T he9 L imited 12/31/2008 NC T Y NasdaqGS US D China 7.88 197.7 250.6 85.5 34.1% - - 1,626
T heS treet. com, Inc. 3/31/2009 T S CM NasdaqGM US D United S ta tes 2.45 75.0 67.0 1.9 2.9% 0.2x 5.4x 310
T ree.C om, Inc. 9/30/2009 T R E E NasdaqGM US D United S ta tes 7.78 84.8 217.1 10.5 4.8% 0.3x 6.2x 700
Unis erve C ommunica tions C orp. 8/31/2009 T S XV :US S T S XV CAD Canada 0.04 0.8 16.1 0.1 0.9% 0.3x 36.4x NA
United Online Inc. 9/30/2009 UNTD NasdaqGS US D United S ta tes 8.33 704.6 996.8 214.9 21.6% 1.0x 4.5x 1,469
UOMO Media , Inc 7/31/2009 UOMO OTCB B US D C anada 0 6.9 0.8 (0.4) -54.2% 9.3x - NA
V alueC lick Inc. 9/30/2009 V C LK NasdaqGS US D United S ta tes 10 906.4 545.7 130.8 24.0% 1.4x 5.7x 1,189
V OIS , Inc. 6/30/2009 VOIS OTCB B US D United S ta tes 0 6.2 0.0 (1.0) NM - - 4
W ebzen Inc. 6/30/2009 W ZE N NasdaqGM US D S outh K orea 3.09 36.6 23.2 2.3 9.9% - - 328
W izzard S oftware C orporation 6/30/2009 W ZE AME X US D United S ta tes 0.47 23.7 5.3 (4.5) -84.9% 4.7x - 110
Worlds . com Inc. 6/30/2009 WDDD OTCB B US D United S ta tes 0.10 5.2 0.1 (0.7) NM - - 1
W ynds torm Corpora tion NA W YND OTCP K US D United S ta tes 0.10 1.8 NA NM NM - - NA
XING AG 6/30/2009 O1B C XT R A E UR Germany 32.30 249.4 58.9 17.0 28.8% 3.3x 11.6x 246
YD Online C orp. 12/31/2007 A052770 K OS E KR W S outh K orea 7120.00 89.5 57.4 12.4 21.6% 1.7x 8.0x NA
Ynk K orea Inc. 12/31/2008 A023770 K OS E KR W S outh K orea 4020.00 18.0 11.9 1.3 10.5% - - NA
High 32,555.5 2,002.6 680.3 63.0% 48.2x 36.9x 6,421
Low 0.0 0.0 -84.0 -98.9% - - 1
Average 794.1 163.0 39.4 6.2% 5.3x 11.1x 945Median 41.8 55.7 1.7 11.6% 1.8x 8.3x 246
Figure 1. Web 2.0 Universe Summary Source. Capital IQ
Page 3
CAPIT AL M ARKET S ACT IV I TY (M &A AND F I NANCI NG )
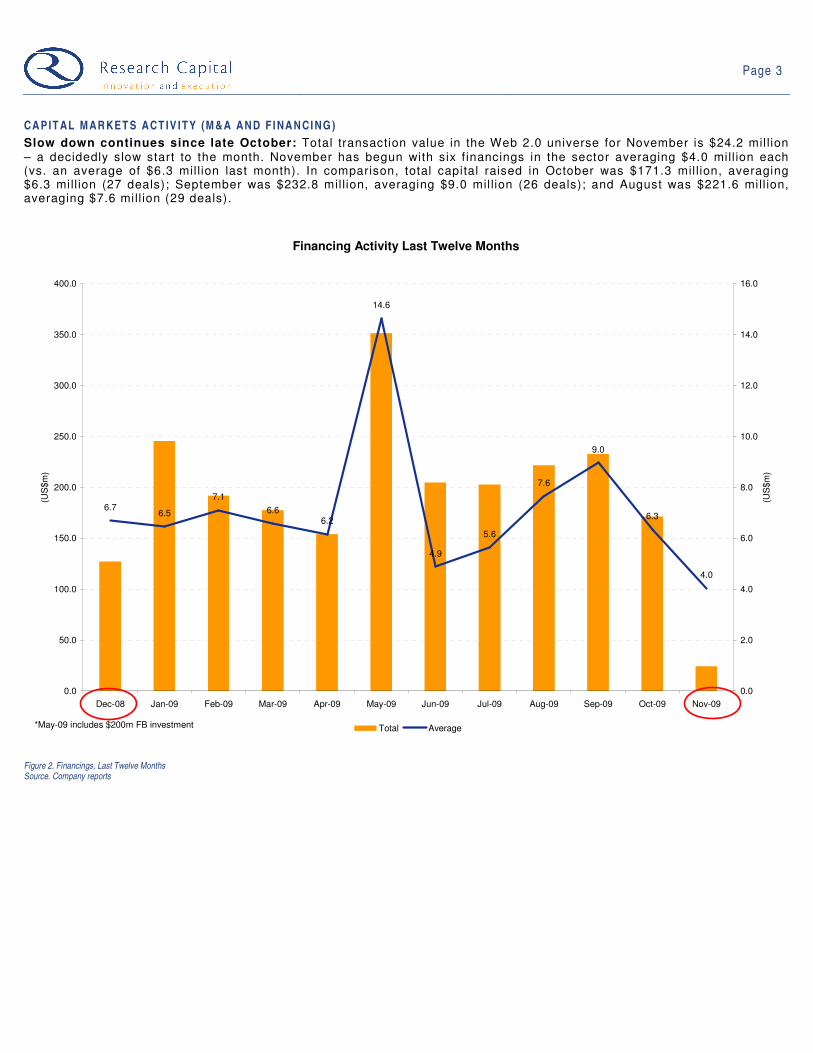
Slow down continues since late October: Total transaction value in the Web 2.0 universe for November is $24.2 mil lion – a decidedly slow start to the month. November has begun with six f inancings in the sector averaging $4.0 mill ion each (vs. an average of $6.3 mil lion last month). In comparison, total capital raised in October was $171.3 mil lion, averaging $6.3 mill ion (27 deals); September was $232.8 mil lion, averaging $9.0 mil lion (26 deals); and August was $221.6 mill ion, averaging $7.6 mill ion (29 deals).
Financing Activity Last Twelve Months
6.5
7.1
6.66.2
14.6
4.9
5.6
7.6
9.0
6.3
4.0
6.7
0.0
50.0
100.0
150.0
200.0
250.0
300.0
350.0
400.0
Dec-08 Jan-09 Feb-09 Mar-09 Apr-09 May-09 Jun-09 Jul-09 Aug-09 Sep-09 Oct-09 Nov-09
(US
$m
)
0.0
2.0
4.0
6.0
8.0
10.0
12.0
14.0
16.0
(US
$m
)
Total Average*May-09 includes $200m FB investment
Figure 2. Financings, Last Twelve Months Source. Company reports

Page 4
Deal round-up for November start: The large deal highlights for the month include:
• Playfish – the UK-based social gaming company – was acquired by Electronic Arts in a deal potential ly valued up to $400 mil lion.
• Motley Fool – the financial information site – raised $25 mill ion in an unattributed financing.
• Phoenix New Media – the subsidiary of Phoenix Television, a popular Chinese news portal and media site – raised $25 mill ion from Intel Capital and Bertelsmann Asia Investment Fund.
All other deals in the month were in the amount of $10 mill ion or less. For additional details on financings, see Figures 23 and 24 (at end of note).
Financing & M/A Summary - Last Three Months
0.0
20.0
40.0
60.0
80.0
100.0
120.0
140.0
160.0
180.0
200.0
Skype
Pla
yF
ish
Min
tT
witte
rD
aily
Motion
Ph
oenix
New
Motley F
ool
Yext
Now
Public
PopC
ap G
am
es
En
sequence
Engin
e Y
ard
Ecast
Ne
twork
HubS
pot
Liv
ebookin
gs
Dopplr
Jiv
e S
oft
ware
Spig
itO
oyala
FeedR
oom
Mzin
ga
InX
po
Sca
nS
cout
Jobvite
CubeT
ree
Rio
t G
am
es
NextB
ioB
ox.n
et
Avia
ryR
ealit
y M
obile
Hiv
eL
ive
Vuclip
Eventb
rite
Imeem
Wate
rcoole
rB
ooyah
YuM
eA
ltru
ikV
dopia
NeoE
dge
Som
etr
ics
Scout
Lab
sA
mie
Str
eet
Alli
ance H
ealth
Unis
fair
Cre
dit K
arm
aM
ocapay
ViV
uC
onduit L
ab
sF
wix
Vantr
ixF
izzb
ack
Ble
kko
Mash
Logic
Overt
one
Godengo
Gre
ystr
ipe
Technora
tiLoo
mia
FourS
qua
reT
iny P
ictu
res
Onehub
EduF
ire
Data
Sync
Daily
Booth
Hot
Pota
toLin
kedex
Sta
tusN
et
IngB
oo
Chango
Flu
ther
Scoople
rT
ransG
am
ing I
nc.
Lis
tia
OnLiv
eV
EV
OG
am
ela
b.c
om
Auro
ra F
ein
t
(US
$m
) Nov-09
Oct-09
Sep-09
Figure 3. Capital Market Activity, Last Three Months Source. Company reports

Page 5
Social Networks the most active sector: Social Networks experienced the most f inancing activity among our Web 2.0 sector categories in the past three months by number of transactions (8). Collaboration-related companies have been hot recently, garnering the second highest number of deals (7). Advertising continues to be among the highest activity sectors in the past quarter (6 deals) (Figure 4). The $2.0 bill ion acquisit ion of Skype skews the dollars transacted to the SMS/Voice segment, while the $400 mill ion acquisition of Playfish brings the Virtual Worlds segment to the second highest total. Finally, the $170 mill ion acquisition of Mint brings the Vertical Communities segment into third place.
Capital Market Activity by Sector - Last Three Months
2,025.0 417.1 178.3 100.9 68.3 57.0 49.3 45.5 39.9 37.5 36.5 30.0 25.6 17.2 16.2 13.0 6.4 6.0 3.9 3.6 3.0 2.2 2.0 1.50.0
20.0
40.0
60.0
80.0
100.0
120.0
140.0
160.0
180.0
200.0
SM
S/V
oic
e
Virtu
al W
orld
Ve
rtic
al
Com
muniti
es
Mic
roblo
g
Vid
eo
Media
Soc
ial N
etw
ork
s
Colla
bora
tion
Adve
rtis
ing
Infr
astr
uctu
re
Gam
ing
Searc
h
Cro
wds
ourc
ed
Con
ten
t
Ente
rpris
e
Analy
tics
Mo
bile
Cla
ssifi
ed
Music
So
cia
l Com
merc
e
Agg
regatio
n
Fin
anc
ial S
erv
ice
s
Pu
blis
hin
g
Mobile
Ad
Com
me
nt/R
eputa
tion
1 4 2 2 5 3 8 7 6 3 4 4 2 2 5 4 2 1 1 2 2 1 1 1
(US
$m
)
# companies
Figure 4. Capital Market Activity, by Sector, Last Three Months Source. Company reports

Page 6
CAPIT AL M ARKET S ACT IV I TY (P RI CE PE RFO RM ANCE )
Web 2.0 index continues to outpace NASDAQ recovery: Our Web 2.0 index (market-cap weighted) essentially mirrored the performance of the NASDAQ composite index from mid-2008 until Q1/09. Since then, the index has diverged in a much stronger recovery relative to the NASDAQ index (Figure 5).
Web 2.0 Index Price Performance
0
50
100
150
200
250
11/1
0/2
008
11/2
4/2
008
12/8
/2008
12/2
2/2
008
1/5
/2009
1/1
9/2
009
2/2
/2009
2/1
6/2
009
3/2
/2009
3/1
6/2
009
3/3
0/2
009
4/1
3/2
009
4/2
7/2
009
5/1
1/2
009
5/2
5/2
009
6/8
/2009
6/2
2/2
009
7/6
/2009
7/2
0/2
009
8/3
/2009
8/1
7/2
009
8/3
1/2
009
9/1
4/2
009
9/2
8/2
009
10/1
2/2
009
10/2
6/2
009
11/9
/2009
Index: Web 2.0 (Market Cap) ^COMP - Share Pricing
Figure 5. Web 2.0 Price Performance Source. Capital IQ

Page 7
Broad-based price improvement: Thirty-five companies in our universe had positive stock price performances over the past week (for stocks with prices greater than $1) (Figure 6), while 12 companies showed negative 1-week returns.
1 Week Price Performance
-15.3%-9.3%
-7.4%-7.3%
-5.2%-4.0%-3.4%-3.4%-2.9%-2.2%-2.0%-2.0%
0.0%0.3%0.6%0.6%0.7%0.8%1.3%1.4%1.5%1.7%1.7%2.0%
3.1%3.1%
4.0%4.2%4.4%4.6%4.7%5.2%5.3%5.7%6.0%6.3%6.6%7.0%7.2%7.5%7.5%
9.2%9.2%
11.4%11.5%
12.9%13.5%
16.7%
-0.2 -0.15 -0.1 -0.05 0 0.05 0.1 0.15 0.2
GameOn Co Ltd.LookSmart, Ltd.
X ING AGS park Netw orks , Inc .
Mix i, Inc .G igaMedia Ltd.Ngi Group Inc .Tree.Com, Inc .
Tencent Holdings Ltd.PNI Digita l Media Inc .
Frogs ter Interactive Pictures AGMyriad Group AGGravity Co. , Ltd
Giant Interactive Group, Inc .Gamania Digita l Entertainment Co. , Ltd.
F luid Mus ic Canada, Inc .Cyberplex Inc .The9 L imited
AQ Interactive, Inc .S K Communications Co. , Ltd.
K ings oft Co. Ltd.TheS treet.com, Inc .
NEOWIZ Games CorporationWebzen Inc .
Y nk K orea Inc .IAC/InterActiveCorp.
DADA S pAChines e Gamer International
Openw ave S ys tems Inc .Y D Online Corp.HanbitS oft, Inc .
Modern Times Group Mtg A BNorthgate Technologies L imited
Open Tex t Corp.United Online Inc .
Gree, Inc .Actoz S oft Co. , Ltd.
S ohu.com Inc .CDC Corp.
NetDragon WebS oft, Inc .Eolith Co. Ltd.
Changyou.com LimitedS hutterf ly , Inc .
Neteas e.com Inc .S handa Interactive Entertainment Ltd.
V alueClick Inc .Perfect World Co. , Ltd.
Quepas a Corp.
Figure 6. 1-Week Price Performance Source. Capital IQ
Page 8
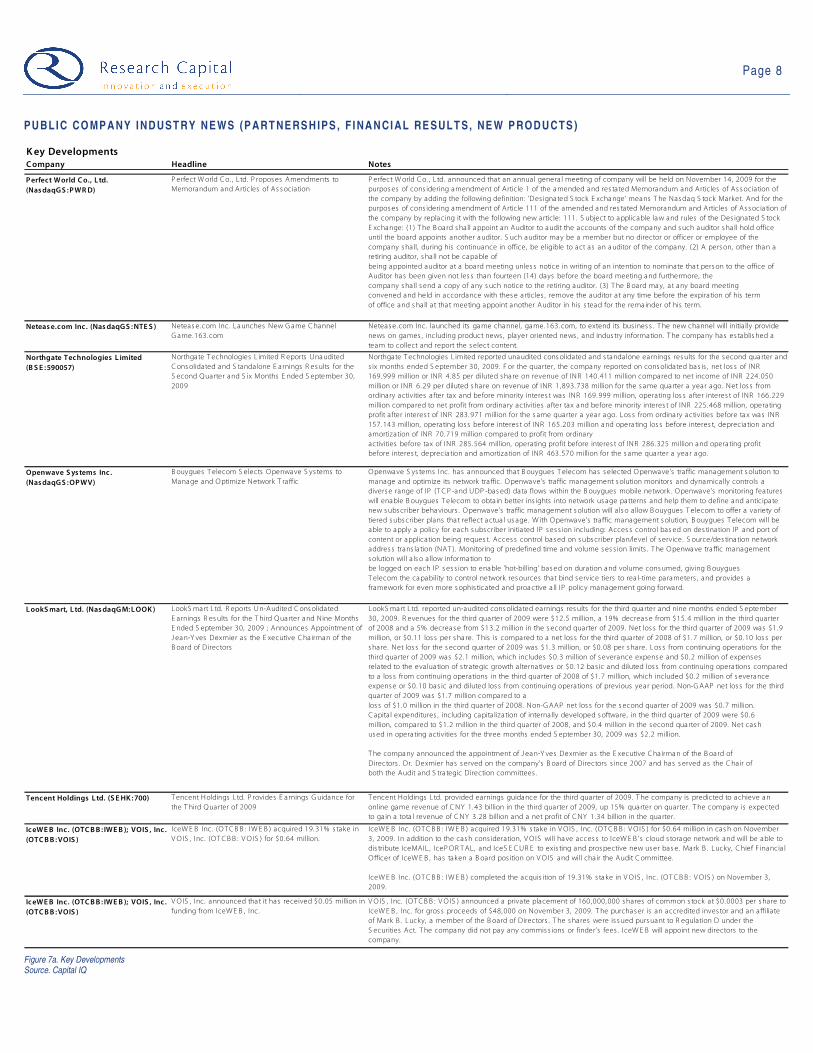
PUBLI C CO MP ANY I NDUST RY NEWS (P ART NE RS HIPS , F I NANCI AL RE SULT S, NE W P RODUCTS )
Key DevelopmentsCompany Headline Notes
Perfect World Co., L td.
(NasdaqGS :PWRD)
P erfect W orld Co. , Ltd. P roposes Amendments to
Memorandum and Articles of As sociation
P erfect W orld Co. , Ltd. announced that an annual genera l meeting of company will be held on November 14, 2009 for the
purposes of cons idering amendment of Article 1 of the amended and res ta ted Memorandum and Articles of As sociation of
the company by adding the following definition: 'Des ignated S tock E xchange' means T he Nasdaq S tock Market. And for the
purposes of cons idering amendment of Article 111 of the amended and res tated Memorandum and Articles of As socia tion of
the company by replacing it with the following new article: 111. S ubject to applicable law and rules of the Des ignated S tock
E xchange: (1) T he B oard shall appoint an Auditor to audit the accounts of the company and such auditor sha ll hold office
until the board appoints another auditor. S uch auditor may be a member but no director or officer or employee of the
company shall, during his continuance in office, be eligible to act as an auditor of the company. (2) A person, other than a
retiring auditor, s hall not be capable of
being appointed auditor at a board meeting unles s notice in writing of an intention to nominate that person to the office of
Auditor has been given not les s than fourteen (14) days before the board meeting and furthermore, the
company shall s end a copy of any s uch notice to the retiring auditor. (3) T he B oard may, a t any board meeting
convened and held in accordance with these articles , remove the auditor at any time before the expira tion of his term
of office and s hall at tha t meeting appoint another Auditor in his s tead for the rema inder of his term.
Netease.com Inc. (NasdaqGS :NTES ) Neteas e.com Inc. Launches New G ame Channel
G ame.163. com
Netease.com Inc. launched its game channel, game.163. com, to extend its bus ines s . T he new channel will initia lly provide
news on games , including product news , player oriented news , and indus try information. T he company has es tablis hed a
team to collect and report the s elect content.
Northgate Technologies L imited
(B S E :590057)
Northgate T echnologies L imited R eports Unaudited
Consolidated and S tandalone E arnings R esults for the
S econd Quarter and S ix Months E nded S eptember 30,
2009
Northgate T echnologies L imited reported unaudited cons olidated and s tandalone ea rnings results for the s econd quarter and
s ix months ended S eptember 30, 2009. F or the quarter, the company reported on consolidated bas is , net los s of INR
169.999 million or INR 4.85 per diluted sha re on revenue of INR 140.411 million compared to net income of INR 224.050
million or INR 6. 29 per diluted share on revenue of INR 1,893.738 million for the s ame quarter a year ago. Net los s from
ordinary activities after tax and before minority interes t was INR 169.999 million, operating los s a fter interes t of INR 166.229
million compared to net profit from ordinary activities after tax and before minority interes t of INR 225.468 million, opera ting
profit after interes t of INR 283.971 million for the s ame quarter a yea r ago. Los s from ordinary activities before tax was INR
157.143 million, operating los s before interes t of INR 165.203 million and opera ting los s before interes t, depreciation and
amortization of INR 70.719 million compared to profit from ordina ry
activities before tax of INR 285.564 million, operating profit before interes t of INR 286.325 million and opera ting profit
before interes t, depreciation and amortiza tion of INR 463.570 million for the s ame quarter a yea r ago.
Openwave S ys tems Inc .
(NasdaqGS :OPWV)
B ouygues T elecom S elects Openwave S ys tems to
Manage and Optimize Network T ra ffic
Openwave S ys tems Inc. has announced that B ouygues T elecom has s elected Openwave's traffic management solution to
manage and optimize its network tra ffic. Openwave's traffic management solution monitors and dynamically controls a
divers e range of IP (T CP -and UDP -bas ed) data flows within the B ouygues mobile network. Openwave's monitoring features
will enable B ouygues T elecom to obtain better ins ights into network us age patterns and help them to define and anticipate
new subscriber behaviours . Openwave's traffic management solution will a ls o a llow B ouygues T elecom to offer a variety of
tiered subscriber plans that reflect actual us age. W ith Openwave's traffic management solution, B ouygues T elecom will be
able to apply a policy for each subscriber initia ted IP s es s ion including: Acces s control bas ed on des tination IP and port of
content or application being reques t. Acces s control based on subscriber plan/level of s ervice. S ource/des tina tion network
addres s trans lation (NAT ). Monitoring of predefined time and volume s es s ion limits . T he Openwave tra ffic management
solution will a ls o a llow information to
be logged on each IP s es s ion to enable 'hot-billing' based on duration and volume consumed, giving B ouygues
T elecom the capability to control network resources that bind s ervice tiers to rea l-time parameters , and provides a
framework for even more sophis ticated and proactive a ll IP policy management going forward.
LookSmart, L td. (NasdaqGM:LOOK) LookS mart L td. R eports Un-Audited Consolida ted
E arnings R es ults for the T hird Quarter and Nine Months
E nded S eptember 30, 2009 ; Announces Appointment of
J ean-Y ves Dexmier as the E xecutive Chairman of the
B oard of Directors
LookS mart L td. reported un-audited consolidated earnings results for the third quarter and nine months ended S eptember
30, 2009. R evenues for the third quarter of 2009 were $12.5 million, a 19% decrease from $15.4 million in the third quarter
of 2008 and a 5% decrease from $13.2 million in the s econd quarter of 2009. Net los s for the third quarter of 2009 was $1.9
million, or $0.11 los s per sha re. T his is compared to a net los s for the third quarter of 2008 of $1. 7 million, or $0. 10 los s per
share. Net los s for the s econd quarter of 2009 was $1.3 million, or $0.08 per sha re. Los s from continuing operations for the
third quarter of 2009 was $2.1 million, which includes $0.3 million of s everance expense and $0.2 million of expenses
rela ted to the evaluation of s trategic growth a lternatives or $0. 12 bas ic and diluted los s from continuing opera tions compared
to a los s from continuing operations in the third quarter of 2008 of $1.7 million, which included $0.2 million of s everance
expense or $0.10 bas ic and diluted los s from continuing operations of previous year period. Non-GAAP net los s for the third
quarter of 2009 was $1.7 million compared to a
los s of $1. 0 million in the third quarter of 2008. Non-GAAP net los s for the s econd quarter of 2009 was $0.7 million.
C apita l expenditures , including capita liza tion of internally developed software, in the third quarter of 2009 were $0.6
million, compared to $1.2 million in the third quarter of 2008, and $0.4 million in the s econd quarter of 2009. Net cash
used in opera ting activities for the three months ended S eptember 30, 2009 was $2.2 million.
T he company announced the appointment of J ean-Y ves Dexmier as the E xecutive Cha irman of the B oard of
Directors . Dr. Dexmier has s erved on the company's B oard of Directors s ince 2007 and has s erved as the Cha ir of
both the Audit and S tra tegic Direction committees .
Tencent Holdings Ltd. (S EHK :700) T encent Holdings Ltd. P rovides E a rnings G uidance for
the T hird Quarter of 2009
Tencent Holdings Ltd. provided earnings guidance for the third quarter of 2009. T he company is predicted to achieve an
online game revenue of CNY 1. 43 billion in the third quarter of 2009, up 15% quarter on quarter. T he company is expected
to ga in a tota l revenue of CNY 3. 28 billion and a net profit of CNY 1.34 billion in the quarter.
IceWEB Inc. (OTCBB : IWEB ); VOIS , Inc .
(OTCBB :VOIS )
IceW E B Inc. (OTCB B : IW E B ) acquired 19.31% s take in
VOIS , Inc. (OTCB B : V OIS ) for $0.64 million.
IceW E B Inc. (OTCB B : IW E B ) acquired 19.31% s take in VOIS , Inc. (OTCB B : V OIS ) for $0. 64 million in cas h on November
3, 2009. In addition to the cash cons ideration, V OIS will have acces s to IceW E B ’s cloud s torage network and will be able to
dis tribute IceMAIL , IcePOR TAL, and IceS E CUR E to exis ting and prospective new user bas e. Mark B . Lucky, Chief F inancia l
Officer of IceW E B , has taken a B oard pos ition on VOIS and will cha ir the Audit Committee.
IceW E B Inc. (OTCB B : IW E B ) completed the acquis ition of 19. 31% s take in VOIS , Inc. (OTCB B : V OIS ) on November 3,
2009.
IceWEB Inc. (OTCBB : IWEB ); VOIS , Inc .
(OTCBB :VOIS )
VOIS , Inc. announced that it has received $0.05 million in
funding from IceWE B , Inc.
V OIS , Inc. (OTCB B : V OIS ) announced a private placement of 160,000,000 shares of common s tock at $0.0003 per share to
IceW E B , Inc. for gros s proceeds of $48,000 on November 3, 2009. T he purchaser is an accredited inves tor and an affiliate
of Mark B . Lucky, a member of the B oard of Directors . T he shares were is sued pursuant to R egulation D under the
S ecurities Act. T he company did not pay any commis s ions or finder’s fees . IceW E B will appoint new directors to the
company.
Figure 7a. Key Developments Source. Capital IQ
Page 9
Key Developments - continuedCompany Headline Notes
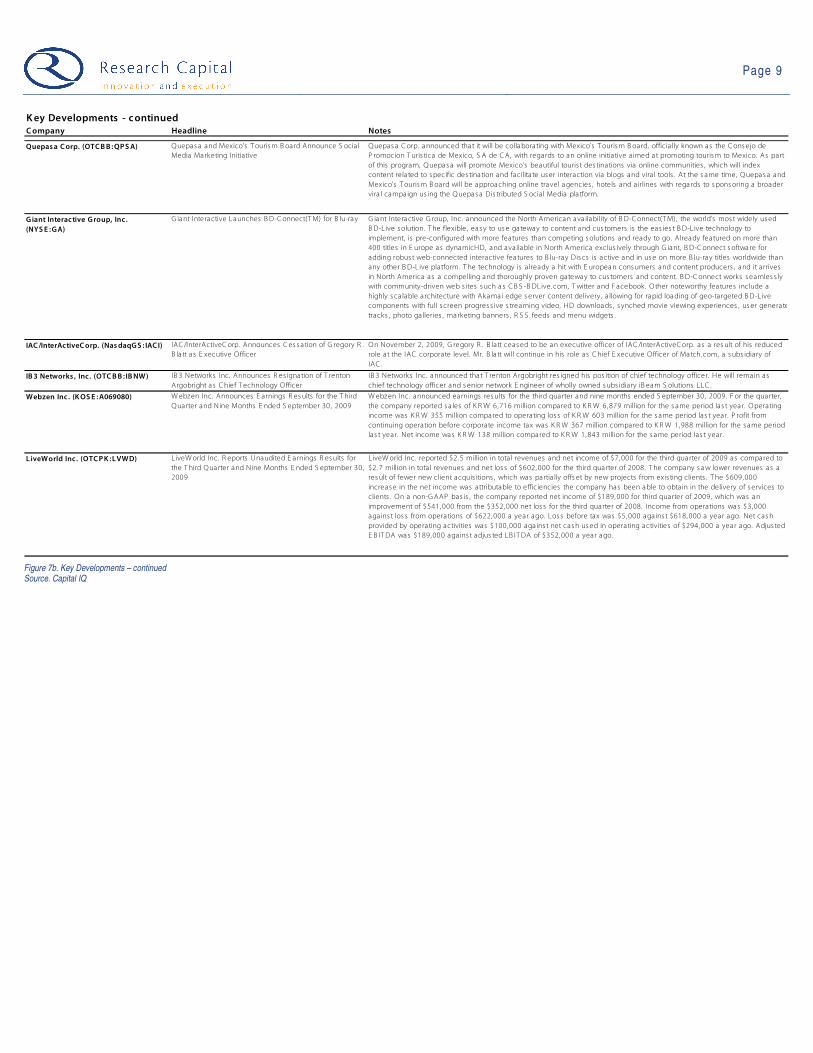
Quepasa Corp. (OTCBB :QPSA) Quepasa and Mexico's T ourism B oard Announce S ocia l
Media Marketing Initiative
Quepasa Corp. announced that it will be collaborating with Mexico's T ourism B oard, officia lly known as the Consejo de
P romocion T uris tica de Mexico, S A de CA, with regards to an online initiative a imed a t promoting tourism to Mexico. As part
of this program, Quepasa will promote Mexico's beautiful touris t des tinations via online communities , which will index
content rela ted to specific des tina tion and facilitate user interaction via blogs and vira l tools . At the s ame time, Quepasa and
Mexico's T ourism B oard will be approaching online travel agencies , hotels and a irlines with regards to sponsoring a broader
vira l campa ign us ing the Quepasa Dis tributed S ocia l Media pla tform.
Giant Interactive Group, Inc.
(NYSE :GA)
G iant Interactive Launches B D-Connect(TM) for B lu-ray G iant Interactive G roup, Inc. announced the North American ava ilability of B D-Connect(TM), the world's mos t widely used
B D-L ive solution. T he flexible, eas y to use gateway to content and cus tomers is the eas ies t B D-L ive technology to
implement, is pre-configured with more features than competing solutions and ready to go. Already featured on more than
400 titles in E urope as dynamicHD, and available in North America exclus ively through G iant, B D-Connect s oftware for
adding robus t web-connected interactive fea tures to B lu-ray Dis cs is active and in us e on more B lu-ray titles worldwide than
any other B D-L ive platform. T he technology is a lready a hit with E uropean consumers and content producers , and it arrives
in North America as a compelling and thoroughly proven gateway to cus tomers and content. B D-Connect works s eamles s ly
with community-driven web s ites such as C B S -B DLive.com, Twitter and F acebook. Other noteworthy fea tures include a
highly s ca lable a rchitecture with Akamai edge s erver content delivery, a llowing for rapid loading of geo-targeted B D-L ive
components with full s creen progres s ive s treaming video, HD downloads , s ynched movie viewing experiences , user genera ted quizzes , trivia
tracks , photo ga lleries , marketing banners , R S S feeds and menu widgets .
IAC/InterActiveCorp. (NasdaqGS : IAC I) IAC /InterActiveC orp. Announces C es s a tion of G regory R .
B la tt a s E xecutive Officer
On November 2, 2009, G regory R . B latt ceased to be an executive officer of IAC /InterActiveCorp. as a res ult of his reduced
role at the IAC corporate level. Mr. B la tt will continue in his role as Chief E xecutive Officer of Match.com, a subs idiary of
IAC .
IB3 Networks , Inc. (OTCBB :IBNW) IB 3 Networks Inc. Announces R es ignation of T renton
Argobright as Chief T echnology Officer
IB 3 Networks Inc. announced that T renton Argobright res igned his pos ition of chief technology officer. He will remain as
chief technology officer and s enior network E ngineer of wholly owned subs idiary iB eam S olutions LLC .
Webzen Inc . (KOSE :A069080) Webzen Inc. Announces E arnings R es ults for the T hird
Quarter and Nine Months E nded S eptember 30, 2009
Webzen Inc. announced ea rnings results for the third quarter and nine months ended S eptember 30, 2009. F or the quarter,
the company reported s a les of K R W 6,716 million compared to K R W 6,879 million for the s ame period las t yea r. Operating
income was K R W 355 million compared to operating los s of K R W 603 million for the s ame period las t yea r. P rofit from
continuing operation before corporate income tax was K R W 367 million compared to K R W 1,988 million for the s ame period
la s t year. Net income was K R W 138 million compared to K R W 1,843 million for the s ame period las t year.
L iveWorld Inc. (OTCPK :LVWD) LiveWorld Inc. R eports Unaudited E arnings R esults for
the T hird Quarter and Nine Months E nded S eptember 30,
2009
LiveWorld Inc. reported $2.5 million in total revenues and net income of $7,000 for the third quarter of 2009 as compared to
$2.7 million in total revenues and net los s of $602,000 for the third quarter of 2008. T he company s aw lower revenues as a
result of fewer new client acquis itions , which was pa rtia lly offs et by new projects from exis ting clients . T he $609,000
increase in the net income was attributable to efficiencies the company has been able to obtain in the delivery of s ervices to
clients . On a non-GAAP bas is , the company reported net income of $189,000 for third quarter of 2009, which was an
improvement of $541,000 from the $352,000 net los s for the third quarter of 2008. Income from operations was $3,000
aga ins t los s from operations of $622,000 a year ago. Los s before tax was $5,000 aga ins t $618,000 a year ago. Net cash
provided by opera ting activities was $100,000 aga ins t net cash used in operating activities of $294,000 a yea r ago. Adjus ted
E B ITDA was $189,000 aga ins t adjus ted LB ITDA of $352,000 a year ago.
Figure 7b. Key Developments – continued Source. Capital IQ

Page 10
Key Developments - continuedCompany Headline Notes
United Online Inc. (NasdaqGS :UNTD) United Online Inc. R eports Consolidated Unaudited
E arnings R es ults for the T hird Quarter and Nine Months
E nded S eptember 30, 2009; P rovides E arnings G uidance
for the F ourth Quarter and F ull Y ea r of 2009; Declares
Quarterly C ash Dividend P ayable on November 30, 2009;
Net Debt as at S eptember 30, 2009
United Online Inc. reported consolidated unaudited earnings res ults for the third quarter and nine months ended S eptember
30, 2009. F or the quarter, the company reported revenues were $216.2 million, an increase of 28% versus the year-ago
quarter. T he increas e was attributable to the company's acquis ition of F TD on Augus t 26, 2008. Net income applicable to
common s tockholders was $14.9 million or $0. 18 diluted net income per common share aga ins t net income applicable to
common s tockholders of $15.2 million or $0. 20 diluted net income per common share for the s ame quarter a year ago
period. Income before income taxes was $26.2 million agains t $26.6 million for the s ame quarter a year ago period.
Operating income was $32.6 million agains t $28.8 million for the s ame quarter a year ago period. C ash flows from
opera tions and free cash flow were $28.2 million and $23.5 million, a decrease of 20% and 25% , respectively versus the
yea r-ago quarter. T he decrease in cash flows was primarily a ttributable to changes in working capita l. P urchases of property
and equipment were $4.8 million aga ins t $4. 2 million for the s ame quarter a year ago period. Adjus ted net income applicable to common s tockholders was $28.3 million or $0. 33 diluted net
income per common share agains t $25.4 million or $0. 34 diluted net income per common share for the s ame quarter
a yea r ago period.
T he company provided earnings guidance for the fourth quarter and full year of 2009. F or the quarter, the company
expects adjus ted OIB DA to be in the range of $56.0--$61.0, revenues in the range of $235.0--$243.0 and GAAP
opera ting income in the range of $29.1--$34.1.
F or the year, the company expects adjus ted OIB DA to be in the range of $243.5--$248.5, revenues in the range of
$975.6--$983.6 and GAAP operating income in the range of $142.3--$147.3.
T he company's B oard of Directors recently decla red a quarterly cas h dividend of $0. 10 per share that is payable on
November 30, 2009 to s tockholders of record on November 13, 2009.
Net debt at S eptember 30, 2009 was $252.6 million, a decreas e of $12.5 million versus $265.1 million at J une 30, 2009.
The9 L imited (NasdaqGS :NCTY) G lancy B inkow & Goldberg LLP F iles a C las s Action
Lawsuit on B ehalf of a C las s Cons is ting of All P ersons or
E ntities W ho P urchased American Depos itary S hares , of
T he9 L imited
G lancy B inkow & Goldberg LLP has filed a clas s action lawsuit in the United S ta tes Dis trict Court for the S outhern Dis trict of
New Y ork on behalf of a clas s cons is ting of a ll persons or entities who purchas ed American Depos itary S hares , a s
evidenced by American Depos itary R eceipts , of T he9 L imited between November 15, 2006 and J uly 15, 2009, inclus ive (the
'C las s P eriod'). T he Compla int charges T he9 and certa in of the Company's current and former executive officers with
violations of federal s ecurities laws . T he9 operates as an online game opera tor and developer in ma inland China and directly
or through a ffiliates operates licensed multiplayer online role-playing games and advanced casual games , including S oul of
T he Ultimate Nation, G ranado E spada and Atlantica , among others . T he Complaint a lleges that throughout the C las s P eriod
defendants knew or reckles s ly dis regarded that their public s tatements concerning T he9's bus ines s , opera tions and
prospects were materia lly fa ls e and mis leading. S pecifically, the defendants made fa ls e and/or mis leading s tatements
and/or fa iled to dis close that: ( i) it was becoming increas ingly les s likely that the Company would be renewing the World of W arcra ft contract with B lizza rd
E nterta inment Inc. ( 'B lizzard') ; (ii) T he9 had not even begun formal negotiations with B lizzard regarding the World of
W arcra ft contract renewal; (iii) T he9 and B lizzard had been at odds regarding T he9's operation of W orld of W arcraft in
China; and (iv) the equity inves tment in T he9 by E lectronic Arts Inc. --a developer and publis her of interactive
enterta inment--had made it les s likely that B lizza rd would renew the World of W arcra ft contract because B lizza rd
would es sentia lly be doing bus ines s with one of its greates t competitors .
Chinese Gamer International
(GTSM:3083)
Chinese G amer International S igns G ame L icens ing
Agreement with Changyou. com
Chines e G amer Internationa l announced an over R MB 100 million (approx. $14.7 million) licens ing agreement with
Changyou. com Limited, whereby Changyou. com will receive the exclus ive right from the company to operate Zhong Hua
Y ing X iong, a new 3D martia l-a rts game, in mainland C hina. Chinese G amer a lso plans to grab more shares in the vas t
Chines e online game market in the future through work ing clos ely with Changyou.com on the res earch and development of
new games .
Wizzard S oftware Corporation
(AMEX:WZE )
W izza rd Media Launches 24 New iP hone Apps W izza rd Media announced the launch of 24 new iP hone(R ) Apps available for s a le in the App s tore including Inves tors
B us ines s Da ily E ditoria ls and Alas ka HDTV . T he newly launched Apps a re iP hone companion Apps for popular podcas ts on
the W izzard Media Network, offering audiences one-click acces s to the podcas t directly on their iP hone or iP od T ouch(R ),
bonus content and new socia l communica tion features creating an unprecedented level of audience engagement. W izzard
recently announced 2009 third quarter network numbers of 12, 281 podcas ts downloaded 332 million times in the quarter by
over 18 million unique monthly audience members . Approximately 70% of the audience for podcas ts s ubscribe through
iT unes (R ) from which users download podcas ts for their iP hone and iP od(R ). Until recently, W izza rd's only means to derive
R evenue was through podcas t publis hing s ervices as well a s advertis ing s ales . W ith the launch of the iP hone App s tore in
iT unes , W izzard created a unique iP hone App that can be quickly cus tomized for each podcas t and allows podcas t
publis hers to genera te a new revenue s tream by marketing their own iP hone App directly to their audience.
Spark Networks , Inc . (AMEX:LOV) S park Networks Inc. R eports F inancial R es ults for the
T hird Quarter E nded S eptember 30, 2009
S park Networks Inc. reported financial results for the third quarter ended S eptember 30, 2009. F or the quarter, the company
reported revenue of $11.1 million, a decrease of 21% compared to $14.0 million in the third quarter of 2008. Contribution for
the third quarter of 2009 was $8.0 million, a decrease of 25% compared to $10.6 million for the third quarter of 2008. Net
income was $1 million, or $0. 05 per s hare, compared to $1.7 million, or $0.08 per share, for the third quarter of 2008.
Adjus ted E B ITDA was $2.6 million, a decrease of 36% compared to $4.1 million for the third quarter of 2008.
DigitalPos t Interactive, Inc .
(OTCBB :DGLP)
Digita lP os t Interactive Launches Digita l Media-S haring
P la tform for F amilyDrive.com
Digita lP os t Interactive Inc. announced its rebranded and cus tomized interactive platform was launched for F amilyDrive.com,
a new partner providing pers ona l, priva te and ad-free sha ring and preservation of family pictures , videos , and other digita l
memories . Digita lP os t's interactive platform and software development provided F amilyDrive. com with new technology
capabilities to not only s erve their exis ting cus tomers but a ls o reach out to new family cus tomers . T he F amilyDrive. com web
s ite was cus tom-des igned to provide a place where families can depend on personal s ervice and cutting-edge technology for
s haring and s toring their precious family memories .
SpectrumDNA, Inc. (OTCBB :SPXA) S pectrumDNA Inc. Appoints J eff Nolan to its B oard of
Directors
S pectrumDNA Inc. announced that J eff Nolan has been appointed to its board of directors . Nolan is an entrepreneur,
venture capita lis t and s ocia l media s trategis t. He was venture partner for S AP V entures , founded the E nterpris e Irregulars
B logging Community, s erved as director of the Apollo S trategy G roup for S AP G lobal Marketing, and mos t recently was vice
pres ident of corpora te development at NewsG ator T echnologies .
Quepasa Corp. (OTCBB :QPSA) Quepasa Corp. Appoints T ony P atti as Director of
Deliverabilty
Quepasa Corp. announced the formation of a cros s -functiona l team dedicated to e-ma il management and deliverability. As
part of this initia tive, the company hired T ony P atti a s Director of Deliverabilty. T ony is a recognized leader in the field of e-
ma il deliverability. W ith a record of s ucces s s panning over a decade, T ony has developed focused, cus tomized deliverability
s olutions for s uch brands as T ravelocity. com and T rue. com, helping them achieve unprecedented delivery-to-inbox rates . As
an expert in e-mail marketing, IS P relations , and the lates t in indus try trends and s tandards , T ony's deliverability s tewardship
ensures that Quepasa's vita l marketing inves tment pays - ins tead of being los t in spam filters .
Figure 7c. Key Developments – continued Source. Capital IQ

Page 11
VAL UAT IO N
Online Gaming companies lead market-cap charts: Fourteen companies in our Web 2.0 universe top US$1 bill ion in market capitalization (Figure 8). Fifty-eight of the 89 companies have market caps under US$100 mil lion, with 39 under US$25 mill ion. Online gaming companies dominate the top of the l ist, led by Tencent Holdings (SEHK:700) with a market cap of approximately US$32.6 bill ion.
Market Cap (USD m)
0.00.00.00.00.20.40.50.60.80.91.11.82.02.53.53.54.14.35.25.45.76.26.97.37.98.59.211.111.213.714.517.818.020.021.021.522.423.724.328.834.636.636.841.141.843.655.055.465.770.072.875.078.178.984.284.886.889.5112.1174.5179.6197.7205.4208.3211.0222.0249.4250.9263.2267.1351.2399.2693.4704.6906.41074.81151.51275.11648.5
2201.12225.12473.22587.92708.53056.73390.35435.932555.5
1822.7
0 500 1,000 1,500 2,000 2,500 3,000 3,500 4,000
S ocial Media V entures Inc .Dibz International, Inc .S NM Global Holdings
China Gatew ay CorporationThe Parent Company
A s s oc iated Media Holdings Inc .CL ICK ER Inc .
KAB Dis tribution Inc .Unis erve Communications Corp.
Betaw ave CorporationLiveWorld Inc .
Wynds torm CorporationB igs tring Corp.
B roadWebA s ia Inc .DigitalPos t Interactive, Inc .B eyond Commerce, Inc .
Magnitude Information S ys tems Inc .S NAP Interactive, Inc .
Worlds .com Inc .B right Things plc
CornerWorld CorporationV OIS , Inc .
UOMO Media , IncS pectrumDNA , Inc .MOKO.mobi Limited
IA S Energy, Inc .is eemedia Inc .
Ex tens ions , Inc .L ingo Media Corporation
Digita lTow n, Inc .Jumbuck Enterta inment Limited
Quepas a Corp.Y nk Korea Inc .LookSmart, L td.
A cceleriz e New Media , Inc .Dolphin Digita l Media , Inc .
Northgate Technologies LimitedWiz z ard S of tw are Corporation
S ocia lw is e, Inc .AQ Interactive, Inc .
Eolith Co. Ltd.Webz en Inc .
Ngi Group Inc .DXN Holdings B hd
NeXplore CorporationGravity Co. , L td
S park Netw orks , Inc .PNI Digita l Media Inc .
HanbitS of t, Inc .Frogs ter Interactive Pictures AG
NeuLion IncorporatedTheS treet.com, Inc .GameOn Co Ltd.GeoS entric Oy jCyberplex Inc .Tree.Com, Inc .
Fluid Mus ic Canada, Inc .Y D Online Corp.
A ctoz S oft Co. , L td.DADA S pA
Openw ave S ys tems Inc .The9 Limited
Myriad Group AGGigaMedia Ltd.
Gamania Digita l Enterta inment Co. , L td.OAO RBC Information S ys tems
XING AGS K Communications Co. , L td.
GungHo Online Enterta inment, Inc .CDC Corp.
NetDragon WebS oft, Inc .S hutterf ly , Inc .
NEOWIZ Games CorporationUnited Online Inc .V alueClick Inc .
K ings of t Co. Ltd.Chines e Gamer International
Mix i, Inc .G iant Interactive Group, Inc .
Changyou.com LimitedOpen Tex t Corp.S ohu.com Inc .
Perfect World Co. , L td.IAC/InterA ctiveCorp.
Gree, Inc .Modern Times Group Mtg AB
S handa Interactive Enterta inment Ltd.Neteas e.com Inc .
Tencent Holdings Ltd.
Figure 8. Market Cap Ranking Source. Capital IQ

Page 12
TEV/Revenue (LTM) averages 5.4x: The overall average TEV/Revenue (LTM) multiple for our group is 5.4x (vs. 5.3x last week) (Figure 9). We continue to see four companies trading above 25x revenue – Bigstring Corp. (OTCBB:BSGC) at 48.2x, Dolphin Digital Media, Inc. (OTCBB:DPDM) at 38.6x, NexPlore Corporation (OTCPK:NXPC) at 27.0x, and Tencent Holdings Ltd. (SEHK:700) at 25.8x. The median of 1.8x compares with 1.7x last week. Note that we exclude multiples greater than 50x. Thirty-one companies have multiples under 1.5x.
TEV/LTM R evenue (x)
0.0 0.0 0.0 0.10.2 0.2 0.2 0.3 0.3 0.3 0.4 0.5 0.7 0.7 0.7 0.7 0.7 0.7 0.8 0.8 0.9 0.9 0.9 1.0 1.0 1.1 1.2 1.3 1.3 1.4 1.4 1.7 1.8 1.9 2.3 2.4 2.4 2.5 2.8 2.9 3.2 3.3 3.3 3.44.5 4.7 5.2 5.5 5.8 5.9
7.1 7.7 8.4 8.6 9.3 10.012.4
13.214.5
15.415.7
25.827.0
38.6
48.2
Average, 5.4
0.0
10.0
20.0
30.0
40.0
50.0
60.0
China Gateway Corporation
GameOn Co Ltd.
OAO RBC Information Systems
AQ Interactive, Inc.
TheStreet.com, Inc.
The Parent Company
CLICKER Inc.
Northgate Technologies Limited
Tree.Com, Inc.
Uniserve Communications Corp.
Openwave Systems Inc.
Jumbuck Entertainment Limited
DXN Holdings Bhd
IAC/InterActiveCorp.
Cyberplex Inc.
CDC Corp.
GigaMedia Ltd.
Actoz Soft Co., Ltd.
SNAP Interactive, Inc.
Beyond Commerce, Inc.
HanbitSoft, Inc.
Perfect World Co., Ltd.
DADA SpA
United Online Inc.
Spark Networks, Inc.
SNM Global Holdings
Gamania Digital Entertainment Co., Ltd.
Shutterfly, Inc.
SK Communications Co., Ltd.
ValueClick Inc.
Ynk Korea Inc.
YD Online Corp.
Modern Times Group Mtg AB
GungHo Online Entertainment, Inc.
NetDragon WebSoft, Inc.
CornerWorld Corporation
Eolith Co. Ltd.
PNI Digital Media Inc.
Open Text Corp.
NeuLion Incorporated
Myriad Group AG
NEOWIZ Games Corporation
XING AG
Sohu.com Inc.
Social Media Ventures Inc.
Wizzard Software Corporation
iseemedia Inc.
DigitalPost Interactive, Inc.
Accelerize New Media, Inc.
Changyou.com Limited
Frogster Interactive Pictures AG
Kingsoft Co. Ltd.
Mixi, Inc.
Lingo Media Corporation
UOMO Media, Inc
MOKO.mobi Limited
Gree, Inc.
Associated Media Holdings Inc.
GeoSentric Oyj
Fluid Music Canada, Inc.
Chinese Gamer International
Tencent Holdings Ltd.
NeXplore Corporation
Dolphin Digital Media, Inc.
Bigstring Corp.
Figure 9. TEV/Revenue Ranking Source. Capital IQ
TEV/Revenue (LTM) by country/exchange: We have also calculated multiples based on where the companies are listed or domiciled. Figure 10 shows the average TEV/Revenue multiples by stock exchange. The OTCBB has the largest number of companies (18), trading at an average multiple of 12.4x (vs. 12.6x last week). On a geographic basis, the United States has the most companies (38), trading at an average of 7.3x revenue (vs. 6.9x last week) (Figure 11). Ten of the companies are Canadian (average 4.0x revenue).
Average TEV/LTM Revenue - By Exchange
0.00.20.3
0.70.91.71.71.81.92.83.24.25.25.25.3
6.37.78.5
11.912.4
14.5
0.0
2.0
4.0
6.0
8.0
10.0
12.0
14.0
16.0
HLS
E
OT
CB
B
SE
HK
GT
SM
OT
CP
K
TS
X
AS
X
TS
E
XT
RA
TS
XV
SW
X
AM
EX
OS
E
OM
NasdaqG
S
KO
SE
CM
KLS
E
BS
E
NasdaqG
M
RT
S
1 18 3 2 11 4 2 5 2 4 1 2 1 1 14 6 1 1 1 5 1
(x)
# Companies
Average TEV/LTM Revenue - By Country
0.00.7 0.3
0.70.91.71.83.2
4.04.65.25.35.97.3
7.7
14.5
0.0
2.0
4.0
6.0
8.0
10.0
12.0
14.0
16.0
Fin
land
Chin
a
Unite
d
Sta
tes
Taiw
an
Austr
alia
Germ
any
Japan
Canada
Sw
itzerland
Sw
eden
South
Kore
a
Italy
Hong K
ong
Mala
ysia
India
Russia
1 10 38 3 2 2 6 10 1 1 8 1 1 1 1 1
(x)
# Companies
Figures 10 & 11. TEV/Revenue Ranking (Exchange, Country) Source. Capital IQ
Page 13
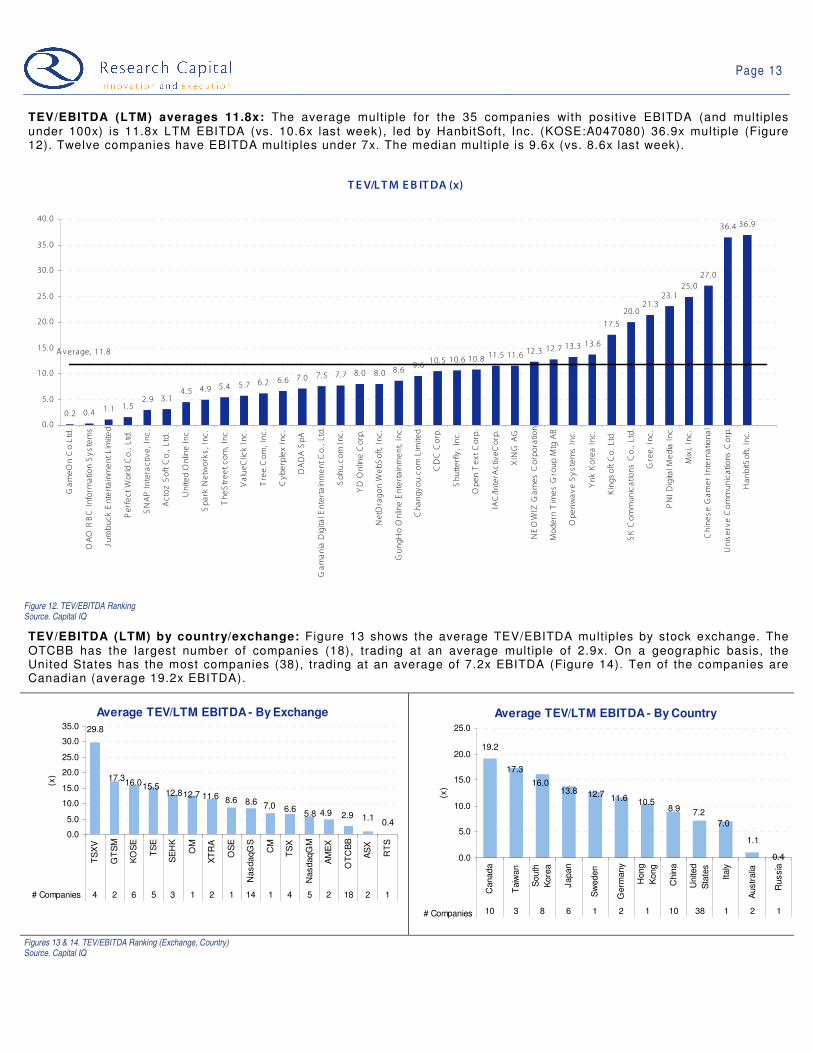
TEV/EBITDA (LTM) averages 11.8x: The average multiple for the 35 companies with positive EBITDA (and multiples under 100x) is 11.8x LTM EBITDA (vs. 10.6x last week), led by HanbitSoft, Inc. (KOSE:A047080) 36.9x multiple (Figure 12). Twelve companies have EBITDA multiples under 7x. The median multiple is 9.6x (vs. 8.6x last week).
TEV/LTM EB ITDA (x)
0.2 0.4 1.1 1.52.9 3.1
4.5 4.9 5.4 5.7 6.2 6.6 7.0 7.5 7.7 8.0 8.0 8.69.6
10.5 10.6 10.811.5 11.6 12.3
12.7 13.313.6
17.5
20.021.3
23.125.0
27.0
36.4 36.9
A verage, 11.8
0.0
5.0
10.0
15.0
20.0
25.0
30.0
35.0
40.0
GameOn Co Ltd.
OAO RBC Information Systems
Jumbuck Entertainment Limited
Perfect World Co., Ltd.
SNAP Interactive, Inc.
Actoz Soft Co., Ltd.
United Online Inc.
Spark Networks, Inc.
TheStreet.com, Inc.
ValueClick Inc.
Tree.Com, Inc.
Cyberplex Inc.
DADA SpA
Gamania Digital Entertainment Co., Ltd.
Sohu.com Inc.
YD Online Corp.
NetDragon WebSoft, Inc.
GungHo Online Entertainment, Inc.
Changyou.com Limited
CDC Corp.
Shutterfly, Inc.
Open Text Corp.
IAC/InterActiveCorp.
XING AG
NEOWIZ Games Corporation
Modern Times Group Mtg AB
Openwave Systems Inc.
Ynk Korea Inc.
Kingsoft Co. Ltd.
SK Communications Co., Ltd.
Gree, Inc.
PNI Digital Media Inc.
Mixi, Inc.
Chinese Gamer International
Uniserve Communications Corp.
HanbitSoft, Inc.
Figure 12. TEV/EBITDA Ranking Source. Capital IQ
TEV/EBITDA (LTM) by country/exchange: Figure 13 shows the average TEV/EBITDA multiples by stock exchange. The OTCBB has the largest number of companies (18), trading at an average multiple of 2.9x. On a geographic basis, the United States has the most companies (38), trading at an average of 7.2x EBITDA (Figure 14). Ten of the companies are Canadian (average 19.2x EBITDA).
Average TEV/LTM EBITDA - By Exchange
0.41.12.94.95.8
6.67.08.68.611.612.712.815.516.0
17.3
29.8
0.0
5.0
10.0
15.0
20.0
25.0
30.0
35.0
TS
XV
GT
SM
KO
SE
TS
E
SE
HK
OM
XT
RA
OS
E
NasdaqG
S
CM
TS
X
NasdaqG
M
AM
EX
OT
CB
B
AS
X
RT
S
4 2 6 5 3 1 2 1 14 1 4 5 2 18 2 1
(x)
# Companies
Average TEV/LTM EBITDA - By Country
0.4
1.1
7.0
7.28.910.511.612.713.8
16.0
17.3
19.2
0.0
5.0
10.0
15.0
20.0
25.0
Canada
Taiw
an
South
Kore
a
Japan
Sw
eden
Germ
any
Hong
Kong
Chin
a
Unite
d
Sta
tes
Italy
Austr
alia
Russia
10 3 8 6 1 2 1 10 38 1 2 1
(x)
# Companies
Figures 13 & 14. TEV/EBITDA Ranking (Exchange, Country) Source. Capital IQ
Page 14
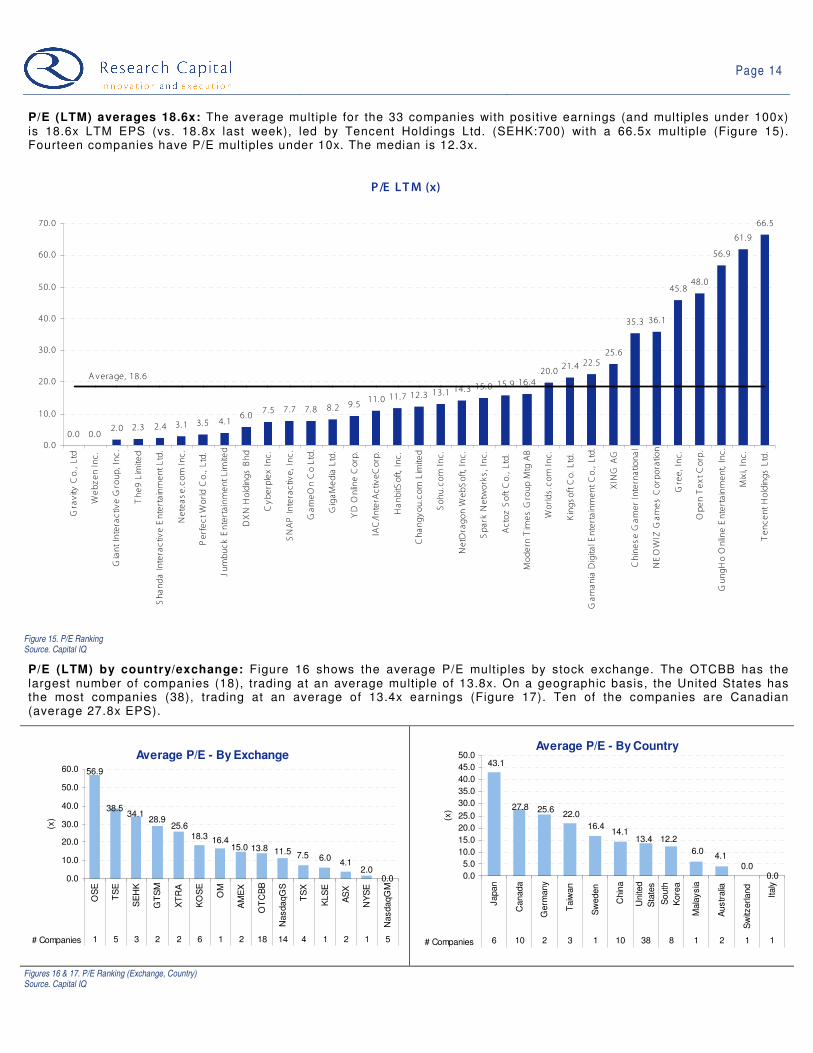
P/E (LTM) averages 18.6x: The average multiple for the 33 companies with positive earnings (and multiples under 100x) is 18.6x LTM EPS (vs. 18.8x last week), led by Tencent Holdings Ltd. (SEHK:700) with a 66.5x multiple (Figure 15). Fourteen companies have P/E multiples under 10x. The median is 12.3x.
P/E LTM (x)
0.0 0.02.0 2.3 2.4 3.1 3.5 4.1
6.07.5 7.7 7.8 8.2 9.5
11.0 11.7 12.313.1 14.3
15.0 15.9 16.420.0
21.4 22.525.6
35.3 36.1
45.848.0
56.9
61.9
66.5
A verage, 18.6
0.0
10.0
20.0
30.0
40.0
50.0
60.0
70.0
Gravity Co., Ltd
Webzen Inc.
Giant Interactive Group, Inc.
The9 Limited
Shanda Interactive Entertainment Ltd.
Netease.com Inc.
Perfect World Co., Ltd.
Jumbuck Entertainment Limited
DXN Holdings Bhd
Cyberplex Inc.
SNAP Interactive, Inc.
GameOn Co Ltd.
GigaMedia Ltd.
YD Online Corp.
IAC/InterActiveCorp.
HanbitSoft, Inc.
Changyou.com Limited
Sohu.com Inc.
NetDragon WebSoft, Inc.
Spark Networks, Inc.
Actoz Soft Co., Ltd.
Modern Times Group Mtg AB
Worlds.com Inc.
Kingsoft Co. Ltd.
Gamania Digital Entertainment Co., Ltd.
XING AG
Chinese Gamer International
NEOWIZ Games Corporation
Gree, Inc.
Open Text Corp.
GungHo Online Entertainment, Inc.
Mixi, Inc.
Tencent Holdings Ltd.
Figure 15. P/E Ranking Source. Capital IQ
P/E (LTM) by country/exchange: Figure 16 shows the average P/E multiples by stock exchange. The OTCBB has the largest number of companies (18), trading at an average multiple of 13.8x. On a geographic basis, the United States has the most companies (38), trading at an average of 13.4x earnings (Figure 17). Ten of the companies are Canadian (average 27.8x EPS).
Average P/E - By Exchange
0.02.0
4.16.07.511.513.815.0
16.418.325.6
28.934.1
38.5
56.9
0.0
10.0
20.0
30.0
40.0
50.0
60.0
OS
E
TS
E
SE
HK
GT
SM
XT
RA
KO
SE
OM
AM
EX
OT
CB
B
Nasda
qG
S
TS
X
KLS
E
AS
X
NY
SE
Nasda
qG
M
1 5 3 2 2 6 1 2 18 14 4 1 2 1 5
(x)
# Companies
Average P/E - By Country
0.00.0
4.16.0
12.213.414.1
16.4
22.025.627.8
43.1
0.0
5.0
10.0
15.0
20.0
25.0
30.0
35.0
40.0
45.0
50.0
Japan
Canada
Germ
any
Taiw
an
Sw
eden
Chin
a
Unite
d
Sta
tes
South
Kore
a
Mala
ysia
Austr
alia
Sw
itzerland
Italy
6 10 2 3 1 10 38 8 1 2 1 1
(x)
# Companies
Figures 16 & 17. P/E Ranking (Exchange, Country) Source. Capital IQ

Page 15
UP CO MI NG EVE NTS
Earnings CalendarCompany Date Time Quarter Conf Call Details
Cyberplex Inc. (TSX:CX) 10-Nov-09 4:30 p.m. EST Q3/09 888-892-3255
Perfect World Co., Ltd. (NasdaqGS:PWRD) 16-Nov-09 7:00 a.m. EST Q3/09 800-819-0121
Netease.com Inc. (NasdaqGS:NTES) 18-Nov-09 8:00 p.m. EST Q3/09 877-941-1427
The9 Limited (NasdaqGS:NCTY) 23-Nov-09 8:00 p.m. EST Q3/09 800-884-5695
Figure 18. Earnings Calendar Source. Company reports

Page 16
Comparable Company Analys is > Web 2.0
Price Performance
Company Name Currency Ticker E xchange USD Market C ap ($m) Current P rice 1 Wk 1 Mth 3 Mth 6 Mth 1 Yr 52 Week
Accelerize New Media, Inc. US D ACLZ OTC B B 21.0 0.75 36.4% 25.0% 31.6% 50.0% 87.5% -6.3%
Actoz S oft C o. , L td. K R W A052790 K OS E 112.1 15,450 6.6% -6.9% -33.3% 1.3% 67.0% -57.1%
AQ Interactive, Inc. J P Y 3838 T S E 28.8 47,400 1.3% -5.0% -8.7% -15.1% 24.7% -42.9%
Associated Media Holdings Inc. US D AS MH OTC P K 0.4 0.01 11.1% -28.6% -28.6% 566.7% 233.3% -50.0%
B igs tring Corp. US D B S GC OTC B B 2.0 0.03 -2.9% -21.4% 31.5% 43.5% 32.0% -42.1%
B etawave C orporation US D BWAV OTC B B 0.9 0.03 -1.6% -55.0% -58.0% -71.4% -86.9% -89.1%
B eyond Commerce, Inc. US D B YOC OTC B B 3.5 0.07 -14.6% -56.3% -75.9% -92.4% -93.9% -96.3%
B right T hings plc GB P AIM:BG T AIM 5.4 0.01 -9.1% -9.1% -16.7% -28.6% 38.9% -49.4%
B roadWebAs ia Inc. US D BW BA OTC P K 2.5 0.03 0.0% -87.0% -87.0% -91.4% -97.8% -99.0%
CDC C orp. US D CHIN.A NasdaqG S 267.1 2.52 7.2% -1.9% -4.5% 110.0% 157.1% -35.7%
Changyou.com Limited US D CYOU NasdaqG S 1,822.7 33.14 9.2% 6.0% -13.0% 21.6% NM -31.5%
China Gateway C orporation US D CGWY OTC P K 0.0 0.00 -86.7% -86.7% -86.7% 0.0% -80.0% -93.3%
Chines e Gamer International TWD GTS M:3083 G T S M 1,151.5 444.00 4.2% -2.8% -2.2% 72.8% 458.5% -14.5%
C LICK E R Inc. US D CLK Z OTC B B 0.5 0.01 -23.5% -35.0% -18.8% 8.3% -96.8% -98.1%
CornerW orld Corporation US D CW R L OTC B B 5.7 0.06 0.0% 0.0% 20.0% -57.1% -70.0% -87.2%
C yberplex Inc. CAD TS X:CX T S X 84.2 1.40 0.7% 12.0% -17.2% -17.6% 250.0% -29.6%
DADA S pA E UR CM:DA CM 174.5 7.35 4.0% 7.9% 21.5% 22.9% 9.9% -10.3%
DXN Holdings B hd MYR DXN K LS E 41.1 0.63 -0.8% 2.4% 18.9% 46.5% 75.0% -8.7%
Dibz International, Inc. US D DIB Z OTC P K 0.0 0.00 20.0% NM 20.0% -88.0% -97.6% -97.6%
DigitalP os t Interactive, Inc. US D DG LP OTC B B 3.5 0.05 -10.0% -25.0% -35.7% 200.0% 12.5% -54.5%
DigitalT own, Inc. US D DGTW OTC BB 13.7 0.50 -50.5% -75.0% -61.5% -75.0% -75.0% -85.7%
Dolphin Digital Media, Inc. US D DPDM OTC BB 21.5 0.40 0.0% 14.3% -11.1% -43.7% -55.6% -57.9%
E olith C o. L td. K R W A041060 K OS E 34.6 570.00 7.5% -18.6% -29.2% -44.1% 5.6% -50.9%
E xtens ions , Inc. US D E XT I OTC P K 11.1 0.25 -37.5% -44.4% 25.0% 66.7% 150.0% -75.2%
F luid Mus ic C anada, Inc. CAD TS X:FMN TS X 86.8 1.80 0.6% 33.3% 44.0% 200.0% 373.7% -16.3%
F rogs ter Interactive P ictures AG E UR FR G XTR A 70.0 18.66 -2.0% 3.7% 33.4% 120.8% 334.0% -13.2%
G amania Digita l E ntertainment Co. , L td. TWD 6180 G T S M 211.0 45.05 0.6% -8.1% -23.1% 12.6% 241.3% -34.5%
G ameOn Co L td. J P Y 3812 T S E 78.1 72,200 -15.3% -18.4% -30.8% -22.7% -39.3% -52.5%
GeoS entric Oyj E UR GE O1V HLS E 78.9 0.06 20.0% 20.0% 20.0% 20.0% 50.0% 0.0%
G iant Interactive G roup, Inc. US D GA NYS E 1,648.5 7.28 0.3% 4.6% -8.4% -11.0% 20.5% -23.9%
G igaMedia L td. US D G IGM NasdaqG S 208.3 3.82 -4.0% -21.1% -19.9% -35.7% -28.5% -50.6%
G ravity Co. , Ltd US D GR VY NasdaqGM 43.6 1.57 0.0% -19.1% -26.3% 61.9% 135.4% -40.3%
G ree, Inc. J P Y T S E :3632 T S E 2,708.5 5, 410 6.3% 10.4% 37.5% 103.4% NM -5.3%
GungHo Online E ntertainment, Inc. J P Y 3765 OS E 263.2 205,400 -2.9% -7.3% 1.7% 44.0% 67.0% -26.6%
HanbitS oft, Inc. K R W A047080 K OS E 65.7 3,580 4.7% -17.4% -17.5% -37.0% 32.3% -46.1%
IAC /InterActiveC orp. US D IAC I NasdaqG S 2,587.9 19.61 3.1% 2.8% 7.1% 29.4% 23.2% -7.8%
IAS E nergy, Inc. US D IAS A.E OTC B B 8.5 0.12 9.1% 100.0% 3.4% -57.1% 50.0% -57.1%
is eemedia Inc. CAD IE E T S XV 9.2 0.19 31.0% 58.3% 171.4% 100.0% 171.4% 0.0%
J umbuck E ntertainment L imited AUD AS X: JMB AS X 14.5 0.34 0.0% -15.0% -8.1% -17.1% -15.0% -32.0%
K AB Dis tribution Inc. CAD TS X:K AB T S X 0.6 0.01 -50.0% -99.2% -99.2% -98.6% -99.4% -99.4%
K ingsoft C o. L td. HK D 3888 S E HK 1,074.8 7.62 1.5% 1.5% -10.2% 79.3% 264.6% -19.5%
L ingo Media Corporation CAD TS XV :LM TS XV 11.2 0.98 3.2% 0.0% -12.5% -2.0% -11.7% -32.9%
L iveW orld Inc. US D LVWD OTC P K 1.1 0.04 -12.5% -30.0% -36.4% -53.3% -56.3% -86.0%
LookS mart, L td. US D LOOK NasdaqGM 20.0 1.17 -9.3% 0.9% -14.0% -6.4% -28.2% -36.1%
Magnitude Information S ys tems Inc. US D MAGY OTC B B 4.1 0.01 -18.2% 0.0% 28.6% -10.0% -52.6% -70.0%
Mixi, Inc. J P Y 2121 T S E 1,275.1 740,000.00 -5.2% 13.7% 14.9% 76.2% 18.4% -6.4%
Modern T imes G roup Mtg AB S E K MTG B OM 3,056.7 323.00 5.2% 4.5% 12.9% 43.9% 113.2% -5.0%
MOKO.mobi L imited AUD MKB AS X 7.9 0.09 -4.4% 13.2% 32.3% 14.7% 115.0% -14.0%
Myriad G roup AG CHF MYR N S WX 205.4 4.79 -2.0% 7.6% 14.6% -5.9% -31.6% -34.4%
NE OW IZ G ames Corporation K R W A095660 K OS E 693.4 39,250.00 1.7% -3.8% 21.3% 18.0% 479.3% -12.6%
NetDragon WebS oft, Inc. HK D 777 S E HK 351.2 5.15 7.5% 0.2% -20.8% -2.8% 99.6% -28.0%
Netease. com Inc. US D NTE S NasdaqG S 5,435.9 42.00 11.4% 3.7% -6.7% 36.1% 113.7% -13.4%
NeuLion Incorporated CAD TS X:NLN T S X 72.8 0.68 -2.9% -29.2% -25.3% -2.9% 13.3% -47.7%
NeXplore Corporation US D NXP C OTC P K 41.8 0.75 0.0% 36.4% 7.1% 36.4% -34.8% -48.3%
Ngi G roup Inc. J P Y 2497 T S E 36.8 26,600.00 -3.4% -3.1% -19.9% -16.1% -63.1% -68.1%
Northgate T echnologies L imited INR 590057 B S E 22.4 30.85 5.3% -18.0% -12.2% -28.1% -49.9% -58.6%
Open T ext Corp. US D OTE X NasdaqG S 2,201.1 39.04 5.7% 1.3% 2.8% 29.1% 35.8% -5.8%
Openwave S ys tems Inc. US D OPWV NasdaqG S 179.6 2.15 4.4% -19.5% -19.8% 77.7% 230.8% -31.3%
P erfect W orld Co. , Ltd. US D PW R D NasdaqG S 2,473.2 49.08 13.5% 12.0% 22.9% 175.3% 190.2% -2.8%
P NI Digital Media Inc. CAD TS XV :P N T S XV 55.4 1.76 -2.2% -5.4% 23.9% 6.7% 25.7% -18.1%
Quepasa C orp. US D QP S A OTC B B 17.8 1.40 16.7% 2.9% 0.0% 37.3% -36.1% -40.4%
OAO R BC Information S ys tems US D R BC I R T S 222.0 1.60 0.0% 6.7% 52.4% 62.4% 6.7% -5.9%
S handa Interactive E nterta inment L td. US D S NDA NasdaqG S 3,390.3 50.41 11.5% 5.3% 2.1% 4.1% 108.1% -22.4%
S hutterfly, Inc. US D S F LY NasdaqG S 399.2 15.55 9.2% -7.1% -0.5% 28.3% 127.7% -14.2%
S K C ommunications C o. , L td. K R W A066270 K OS E 250.9 7,150.00 1.4% -16.3% -29.6% -20.1% 56.1% -44.4%
S NAP Interactive, Inc. US D S TV I OTC B B 4.3 0.40 90.5% 14.3% 0.0% -50.0% -46.7% -63.0%
S NM G loba l Holdings US D S NMN OTC P K 0.0 0.00 0.0% 0.0% -70.0% -50.0% -99.2% -99.3%
S ocial Media V entures Inc. US D S MV I OTC P K 0.0 0.01 6.8% -86.1% -93.4% 25.0% -99.1% -99.8%
S ocialwis e, Inc. US D S CLW OTC B B 24.3 0.55 10.0% -5.2% -15.4% -16.7% -70.3% -72.5%
S ohu.com Inc. US D S OHU NasdaqG S 2,225.1 57.86 7.0% -10.3% -8.0% 10.2% 33.6% -20.0%
S park Networks , Inc. US D LOV AME X 55.0 2.67 -7.3% 14.6% -4.0% 4.7% -12.5% -15.2%
S pectrumDNA, Inc. US D S P XA OTC B B 7.3 0.15 0.0% -25.0% -34.8% -61.5% -37.5% -66.7%
T encent Holdings Ltd. HK D 700 S E HK 32,555.5 139 -2.9% 7.9% 18.2% 90.8% 177.0% -8.6%
T he P arent Company US D K IDS .Q OTC P K 0.2 0.01 0.0% 0.0% -53.3% -53.3% -99.3% -99.3%
T he9 L imited US D NC TY NasdaqG S 197.7 7.88 0.8% 2.5% -15.4% -13.2% -34.6% -52.6%
T heS treet.com, Inc. US D T S CM NasdaqGM 75.0 2.45 1.7% -18.1% 7.5% 29.6% -22.7% -34.5%
T ree.C om, Inc. US D TR E E NasdaqGM 84.8 7.78 -3.4% -1.5% -19.5% -32.9% 255.3% -40.5%
Unis erve Communications Corp. CAD TS XV :US S T S XV 0.8 0.04 -30.0% -12.5% -22.2% -12.5% -80.6% -65.0%
United Online Inc. US D UNTD NasdaqG S 704.6 8.33 6.0% 2.2% 11.8% 23.4% 25.8% -11.9%
UOMO Media, Inc US D UOMO OTC BB 6.9 0.08 5.3% -30.4% -42.9% -75.8% -48.4% -92.5%
V alueC lick Inc. US D VCLK NasdaqG S 906.4 10.40 12.9% -22.7% -3.2% 7.4% 82.1% -25.4%
VOIS , Inc. US D VOIS OTC B B 6.2 0.01 87.5% 50.0% 36.4% 134.4% 0.0% -67.4%
W ebzen Inc. US D WZE N NasdaqGM 36.6 3.09 2.0% 10.0% -4.0% -3.4% 235.9% -34.0%
W izzard S oftware C orporation US D WZE AME X 23.7 0.47 9.3% 0.0% -2.1% -24.2% -43.4% -72.8%
Worlds .com Inc. US D WDDD OTC B B 5.2 0.10 0.0% 0.0% 11.1% -41.2% -37.5% -56.5%
W ynds torm C orporation US D WYND OTC P K 1.8 0.10 0.0% 0.0% 0.0% 11.1% -50.0% -80.4%
XING AG E UR O1BC XT R A 249.4 32.30 -7.4% -11.3% 15.4% 7.7% 12.2% -15.0%
YD Online C orp. K R W A052770 K OS E 89.5 7,120.00 4.6% -15.7% -22.6% -25.7% 24.3% -42.6%
Ynk K orea Inc. K R W A023770 K OS E 18.0 4,020.00 3.1% 2.3% -25.0% -48.6% -32.4% -53.8%
High 90.5% 100.0% 171.4% 566.7% 479.3% 0.0%
Low -86.7% -99.2% -99.2% -98.6% -99.4% -99.8%
Average 794.1 1.2% -7.1% -7.2% 15.9% 44.0% -44.1%Median 0.7% -0.8% -8.0% 4.1% 13.3% -40.5%
Figure 19. Price Performance Source. Capital IQ
Page 17
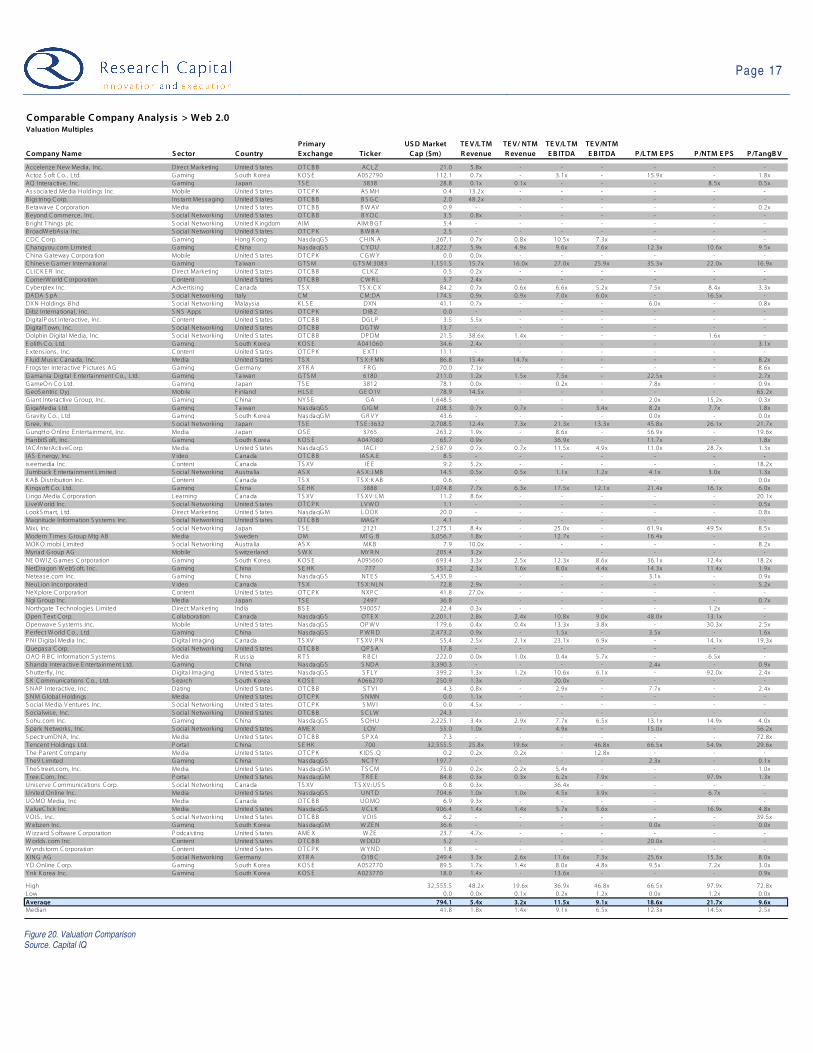
Comparable Company Analys is > Web 2.0Valuation Multiples
Company Name Sector Country
Primary
E xchange Ticker
USD Market
Cap ($m)
TEV/LTM
R evenue
TEV/ NTM
R evenue
TE V/LTM
EB ITDA
TEV/NTM
E B ITDA P/LTM E PS P/NTM E PS P/TangBV
Accelerize New Media , Inc. Direct Marketing United S ta tes OTCB B AC LZ 21.0 5.8x - - - - - -
Actoz S oft C o. , Ltd. G aming S outh K orea KOS E A052790 112.1 0.7x - 3. 1x - 15.9x - 1.8x
AQ Interactive, Inc. G aming J apan T S E 3838 28.8 0.1x 0.1x - - - 8.5x 0.5x
As socia ted Media Holdings Inc. Mobile United S ta tes OTCP K AS MH 0.4 13.2x - - - - - -
B igs tring Corp. Ins tant Messaging United S ta tes OTCB B B S GC 2.0 48.2x - - - - - -
B etawave Corpora tion Media United S ta tes OTCB B BWAV 0.9 - - - - - - 0.2x
B eyond Commerce, Inc. S ocial Networking United S ta tes OTCB B B YOC 3.5 0.8x - - - - - -
B right T hings plc S ocial Networking United K ingdom AIM AIM:B GT 5.4 - - - - - - -
B roadWebAs ia Inc. S ocial Networking United S ta tes OTCP K BWBA 2.5 - - - - - - -
CDC Corp. G aming Hong K ong NasdaqGS CHIN.A 267.1 0.7x 0.8x 10.5x 7.3x - - -
Changyou.com Limited G aming C hina NasdaqGS C YOU 1,822.7 5.9x 4.9x 9. 6x 7.6x 12.3x 10.6x 9.5x
China G ateway Corpora tion Mobile United S ta tes OTCP K CGW Y 0.0 0.0x - - - - - -
C hines e G amer Interna tional G aming T a iwan G T S M GT S M:3083 1,151.5 15.7x 16.0x 27.0x 25.9x 35.3x 22.0x 16.9x
C L IC K E R Inc. Direct Marketing United S ta tes OTCB B C LK Z 0.5 0.2x - - - - - -
C ornerWorld C orporation C ontent United S ta tes OTCB B CW R L 5.7 2.4x - - - - - -
C yberplex Inc. Advertis ing C anada T S X T S X:CX 84.2 0.7x 0.6x 6. 6x 5.2x 7.5x 8.4x 3.3x
DADA S pA S ocial Networking Italy CM CM:DA 174.5 0.9x 0.9x 7. 0x 6.0x - 16.5x -
DXN Holdings B hd S ocial Networking Malays ia K LS E DXN 41.1 0.7x - - - 6.0x - 0.8x
Dibz Interna tiona l, Inc. S NS Apps United S ta tes OTCP K DIB Z 0.0 - - - - - - -
DigitalP os t Interactive, Inc. C ontent United S ta tes OTCB B DGLP 3.5 5.5x - - - - - -
DigitalT own, Inc. S ocial Networking United S ta tes OTCB B DGTW 13.7 - - - - - - -
Dolphin Digital Media , Inc. S ocial Networking United S ta tes OTCB B DPDM 21.5 38.6x 1.4x - - - 1.6x -
E olith C o. L td. G aming S outh K orea KOS E A041060 34.6 2.4x - - - - - 3.1x
E xtens ions , Inc. C ontent United S ta tes OTCP K E XT I 11.1 - - - - - - -
F luid Mus ic C anada, Inc. Media United S ta tes T S X T S X:FMN 86.8 15.4x 14.7x - - - - 8.2x
F rogs ter Interactive P ictures AG G aming G ermany XT R A F R G 70.0 7.1x - - - - - 8.6x
G amania Digital E ntertainment Co. , Ltd. G aming T a iwan G T S M 6180 211.0 1.2x 1.5x 7. 5x - 22.5x - 2.7x
G ameOn Co Ltd. G aming J apan T S E 3812 78.1 0.0x - 0. 2x - 7.8x - 0.9x
G eoS entric Oyj Mobile F inland HLS E GE O1V 78.9 14.5x - - - - - 65.2x
G iant Interactive G roup, Inc. G aming C hina NYS E GA 1,648.5 - - - - 2.0x 15.2x 0.3x
G igaMedia Ltd. G aming T a iwan NasdaqGS G IGM 208.3 0.7x 0.7x - 3.4x 8.2x 7.7x 1.8x
G ravity C o. , Ltd G aming S outh K orea NasdaqGM GR V Y 43.6 - - - - 0.0x - 0.0x
G ree, Inc. S ocial Networking J apan T S E T S E : 3632 2,708.5 12.4x 7.3x 21.3x 13.3x 45.8x 26.1x 21.7x
G ungHo Online E nterta inment, Inc. Media J apan OS E 3765 263.2 1.9x - 8. 6x - 56.9x - 19.6x
HanbitS oft, Inc. G aming S outh K orea KOS E A047080 65.7 0.9x - 36.9x - 11.7x - 1.8x
IAC /InterActiveCorp. Media United S ta tes NasdaqGS IAC I 2,587.9 0.7x 0.7x 11.5x 4.9x 11.0x 28.7x 1.3x
IAS E nergy, Inc. V ideo C anada OTCB B IAS A.E 8.5 - - - - - - -
is eemedia Inc. C ontent C anada T S XV IE E 9.2 5.2x - - - - - 18.2x
J umbuck E ntertainment L imited S ocial Networking Aus tra lia AS X AS X:J MB 14.5 0.5x 0.5x 1. 1x 1.2x 4.1x 3.0x 1.3x
K AB Dis tribution Inc. C ontent C anada T S X T S X:K AB 0.6 - - - - - - 0.0x
K ingsoft C o. Ltd. G aming C hina S E HK 3888 1,074.8 7.7x 6.3x 17.5x 12.1x 21.4x 16.1x 6.0x
Lingo Media C orpora tion Learning C anada T S XV T S XV : LM 11.2 8.6x - - - - - 20.1x
LiveW orld Inc. S ocial Networking United S ta tes OTCP K LVWD 1.1 - - - - - - 0.5x
LookS mart, L td. Direct Marketing United S ta tes NasdaqGM LOOK 20.0 - - - - - - 0.8x
Magnitude Information S ys tems Inc. S ocial Networking United S ta tes OTCB B MAGY 4.1 - - - - - - -
Mixi, Inc. S ocial Networking J apan T S E 2121 1,275.1 8.4x - 25.0x - 61.9x 49.5x 8.5x
Modern T imes G roup Mtg AB Media S weden OM MTG B 3,056.7 1.8x - 12.7x - 16.4x - -
MOKO .mobi L imited S ocial Networking Aus tra lia AS X MK B 7.9 10.0x - - - - - 8.2x
Myriad G roup AG Mobile S witzerland S W X MYR N 205.4 3.2x - - - - - -
NE OW IZ G ames Corporation G aming S outh K orea KOS E A095660 693.4 3.3x 2.5x 12.3x 8.6x 36.1x 12.4x 18.2x
NetDragon W ebS oft, Inc. G aming C hina S E HK 777 351.2 2.3x 1.6x 8. 0x 4.4x 14.3x 11.4x 1.9x
Netease.com Inc. G aming C hina NasdaqGS NT E S 5,435.9 - - - - 3.1x - 0.9x
NeuLion Incorporated V ideo C anada T S X T S X:NLN 72.8 2.9x - - - - - 5.2x
NeXplore Corporation C ontent United S ta tes OTCP K NXPC 41.8 27.0x - - - - - -
Ngi G roup Inc. Media J apan T S E 2497 36.8 - - - - - - 0.7x
Northgate T echnologies L imited Direct Marketing India B S E 590057 22.4 0.3x - - - - 1.2x -
Open T ext C orp. C ollabora tion C anada NasdaqGS OT E X 2,201.1 2.8x 2.4x 10.8x 9.0x 48.0x 13.1x -
Openwave S ys tems Inc. Mobile United S ta tes NasdaqGS OPWV 179.6 0.4x 0.4x 13.3x 3.8x - 30.3x 2.5x
P erfect W orld C o. , Ltd. G aming C hina NasdaqGS PWR D 2,473.2 0.9x - 1. 5x - 3.5x - 1.6x
P NI Digital Media Inc. Digita l Imaging C anada T S XV T S XV :P N 55.4 2.5x 2.1x 23.1x 6.9x - 14.1x 19.3x
Quepasa C orp. S ocial Networking United S ta tes OTCB B QP S A 17.8 - - - - - - -
OAO R B C Information S ys tems Media R uss ia R T S R B C I 222.0 0.0x 1.0x 0. 4x 5.7x - 6.5x -
S handa Interactive E nterta inment Ltd. G aming C hina NasdaqGS S NDA 3,390.3 - - - - 2.4x - 0.9x
S hutterfly, Inc. Digita l Imaging United S ta tes NasdaqGS S FLY 399.2 1.3x 1.2x 10.6x 6.1x - 92.0x 2.4x
S K Communications Co. , Ltd. S earch S outh K orea KOS E A066270 250.9 1.3x - 20.0x - - - -
S NAP Interactive, Inc. Dating United S ta tes OTCB B S T V I 4.3 0.8x - 2. 9x - 7.7x - 2.4x
S NM G lobal Holdings Media United S ta tes OTCP K S NMN 0.0 1.1x - - - - - -
S ocial Media V entures Inc. S ocial Networking United S ta tes OTCP K S MV I 0.0 4.5x - - - - - -
S ocialwise, Inc. S ocial Networking United S ta tes OTCB B S CLW 24.3 - - - - - - -
S ohu.com Inc. G aming C hina NasdaqGS S OHU 2,225.1 3.4x 2.9x 7. 7x 6.5x 13.1x 14.9x 4.0x
S park Networks , Inc. S ocial Networking United S ta tes AME X LOV 55.0 1.0x - 4. 9x - 15.0x - 56.2x
S pectrumDNA, Inc. Media United S ta tes OTCB B S P XA 7.3 - - - - - - 72.8x
T encent Holdings Ltd. P orta l C hina S E HK 700 32,555.5 25.8x 19.6x - 46.8x 66.5x 54.9x 29.6x
T he P a rent C ompany Media United S ta tes OTCP K K IDS .Q 0.2 0.2x 0.2x - 12.8x - - -
T he9 L imited G aming C hina NasdaqGS NCTY 197.7 - - - - 2.3x - 0.1x
T heS treet.com, Inc. Media United S ta tes NasdaqGM TS CM 75.0 0.2x 0.2x 5. 4x - - - 1.0x
T ree.C om, Inc. P orta l United S ta tes NasdaqGM T R E E 84.8 0.3x 0.3x 6. 2x 7.9x - 97.9x 1.3x
Uniserve C ommunications Corp. S ocial Networking C anada T S XV T S XV :US S 0.8 0.3x - 36.4x - - - -
United Online Inc. Media United S ta tes NasdaqGS UNTD 704.6 1.0x 1.0x 4. 5x 3.9x - 6.7x -
UOMO Media , Inc Media C anada OTCB B UOMO 6.9 9.3x - - - - - -
V a lueC lick Inc. Media United S ta tes NasdaqGS VCLK 906.4 1.4x 1.4x 5. 7x 5.6x - 16.9x 4.8x
VO IS , Inc. S ocial Networking United S ta tes OTCB B VOIS 6.2 - - - - - - 39.5x
W ebzen Inc. G aming S outh K orea NasdaqGM WZE N 36.6 - - - - 0.0x - 0.0x
W izzard S oftware Corporation P odcas ting United S ta tes AME X WZE 23.7 4.7x - - - - - -
W orlds .com Inc. C ontent United S ta tes OTCB B WDDD 5.2 - - - - 20.0x - -
W ynds torm C orporation C ontent United S ta tes OTCP K W YND 1.8 - - - - - - -
X ING AG S ocial Networking G ermany XT R A O1B C 249.4 3.3x 2.6x 11.6x 7.3x 25.6x 15.3x 8.0x
YD Online Corp. G aming S outh K orea KOS E A052770 89.5 1.7x 1.4x 8. 0x 4.8x 9.5x 7.2x 3.0x
Y nk K orea Inc. G aming S outh K orea KOS E A023770 18.0 1.4x - 13.6x - - - 0.9x
High 32,555.5 48.2x 19.6x 36.9x 46.8x 66.5x 97.9x 72.8x
Low 0.0 0.0x 0.1x 0. 2x 1.2x 0.0x 1.2x 0.0x
Average 794.1 5.4x 3.2x 11.5x 9.1x 18.6x 21.7x 9.6xMedian 41.8 1.8x 1.4x 9. 1x 6.5x 12.3x 14.5x 2.5x
Figure 20. Valuation Comparison Source. Capital IQ
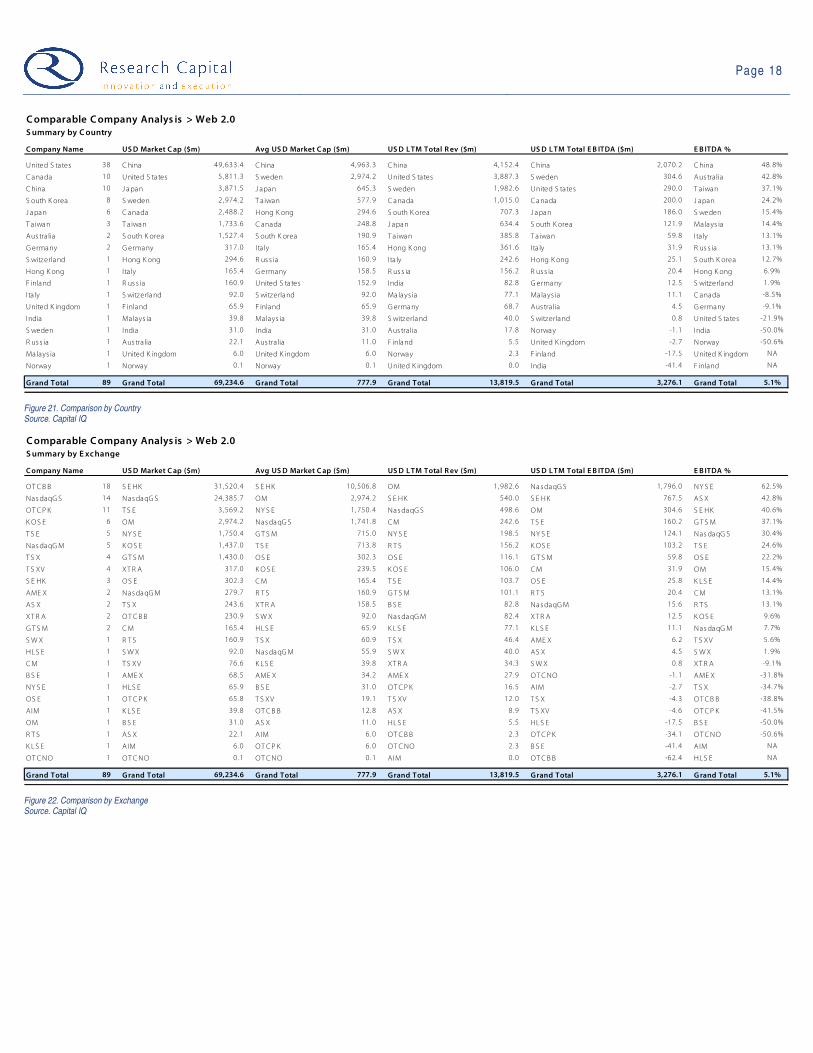
Page 18
Comparable Company Analys is > Web 2.0Summary by Country
Company Name USD Market Cap ($m) Avg USD Market Cap ($m) USD LTM Total Rev ($m) USD LTM Total E B ITDA ($m) E B ITDA %
United S tates 38 China 49,633.4 C hina 4,963.3 China 4,152.4 China 2,070.2 C hina 48.8%
Canada 10 United S ta tes 5,811.3 S weden 2,974.2 United S tates 3,887.3 S weden 304.6 Aus tralia 42.8%
China 10 J apan 3,871.5 J apan 645.3 S weden 1,982.6 United S tates 290.0 T aiwan 37.1%
S outh K orea 8 S weden 2,974.2 T aiwan 577.9 Canada 1,015.0 Canada 200.0 J apan 24.2%
J apan 6 C anada 2,488.2 Hong K ong 294.6 S outh K orea 707.3 J apan 186.0 S weden 15.4%
Ta iwan 3 Ta iwan 1,733.6 C anada 248.8 J apan 634.4 S outh K orea 121.9 Malays ia 14.4%
Aus tralia 2 S outh K orea 1,527.4 S outh K orea 190.9 T a iwan 385.8 T a iwan 59.8 Italy 13.1%
Germany 2 Germany 317.0 Ita ly 165.4 Hong K ong 361.6 Ita ly 31.9 R us s ia 13.1%
S witzerland 1 Hong K ong 294.6 R us s ia 160.9 Ita ly 242.6 Hong K ong 25.1 S outh K orea 12.7%
Hong K ong 1 Ita ly 165.4 Germany 158.5 R us s ia 156.2 R us s ia 20.4 Hong K ong 6.9%
F inland 1 R us s ia 160.9 United S ta tes 152.9 India 82.8 Germany 12.5 S witzerland 1.9%
Ita ly 1 S witzerland 92.0 S witzerland 92.0 Malays ia 77.1 Malays ia 11.1 C anada -8.5%
United K ingdom 1 F inland 65.9 F inland 65.9 Germany 68.7 Aus tralia 4.5 G ermany -9.1%
India 1 Malays ia 39.8 Malays ia 39.8 S witzerland 40.0 S witzerland 0.8 United S ta tes -21.9%
S weden 1 India 31.0 India 31.0 Aus tralia 17.8 Norway -1.1 India -50.0%
R us s ia 1 Aus tralia 22.1 Aus tralia 11.0 F inland 5.5 United K ingdom -2.7 Norway -50.6%
Malays ia 1 United K ingdom 6.0 United K ingdom 6.0 Norway 2.3 F inland -17.5 United K ingdom NA
Norway 1 Norway 0.1 Norway 0.1 United K ingdom 0.0 India -41.4 F inland NA
Grand Total 89 Grand Total 69,234.6 Grand Total 777.9 Grand Total 13,819.5 Grand Total 3,276.1 Grand Total 5.1%
Figure 21. Comparison by Country Source. Capital IQ
Comparable Company Analys is > Web 2.0Summary by E xchange
Company Name USD Market Cap ($m) Avg USD Market Cap ($m) USD LTM Total Rev ($m) USD LTM Total E B ITDA ($m) E B ITDA %
OTCB B 18 S E HK 31,520.4 S E HK 10,506.8 OM 1,982.6 NasdaqGS 1,796.0 NY S E 62.5%
NasdaqGS 14 NasdaqGS 24,385.7 OM 2,974.2 S E HK 540.0 S E HK 767.5 AS X 42.8%
OTCP K 11 TS E 3,569.2 NY S E 1,750.4 NasdaqGS 498.6 OM 304.6 S E HK 40.6%
KOS E 6 OM 2,974.2 NasdaqGS 1,741.8 CM 242.6 T S E 160.2 G TS M 37.1%
TS E 5 NY S E 1,750.4 GT S M 715.0 NY S E 198.5 NY S E 124.1 Nas daqG S 30.4%
NasdaqGM 5 KOS E 1,437.0 T S E 713.8 R T S 156.2 KOS E 103.2 T S E 24.6%
TS X 4 GT S M 1,430.0 OS E 302.3 OS E 116.1 GT S M 59.8 OS E 22.2%
TS XV 4 XTR A 317.0 KOS E 239.5 KOS E 106.0 CM 31.9 OM 15.4%
S E HK 3 OS E 302.3 CM 165.4 T S E 103.7 OS E 25.8 K LS E 14.4%
AME X 2 NasdaqGM 279.7 R TS 160.9 GT S M 101.1 R T S 20.4 CM 13.1%
AS X 2 TS X 243.6 XTR A 158.5 B S E 82.8 NasdaqGM 15.6 R TS 13.1%
XTR A 2 OTCB B 230.9 S W X 92.0 NasdaqGM 82.4 XTR A 12.5 K OS E 9.6%
GT S M 2 CM 165.4 HLS E 65.9 K LS E 77.1 K LS E 11.1 Nas daqGM 7.7%
SWX 1 R TS 160.9 T S X 60.9 T S X 46.4 AME X 6.2 T S XV 5.6%
HLS E 1 S WX 92.0 NasdaqGM 55.9 S W X 40.0 AS X 4.5 S WX 1.9%
CM 1 TS XV 76.6 K LS E 39.8 XTR A 34.3 S W X 0.8 XT R A -9.1%
B S E 1 AME X 68.5 AME X 34.2 AME X 27.9 OTCNO -1.1 AME X -31.8%
NY S E 1 HLS E 65.9 B S E 31.0 OTCP K 16.5 AIM -2.7 T S X -34.7%
OS E 1 OTCP K 65.8 T S XV 19.1 T S XV 12.0 T S X -4.3 OTCB B -38.8%
AIM 1 K LS E 39.8 OTCB B 12.8 AS X 8.9 T S XV -4.6 OTCP K -41.5%
OM 1 B S E 31.0 AS X 11.0 HLS E 5.5 HLS E -17.5 B S E -50.0%
R T S 1 AS X 22.1 AIM 6.0 OTCB B 2.3 OTCP K -34.1 OTCNO -50.6%
K LS E 1 AIM 6.0 OTCP K 6.0 OTCNO 2.3 B S E -41.4 AIM NA
OTCNO 1 OTCNO 0.1 OTCNO 0.1 AIM 0.0 OTCB B -62.4 HLS E NA
Grand Total 89 Grand Total 69,234.6 Grand Total 777.9 Grand Total 13,819.5 Grand Total 3,276.1 Grand Total 5.1%
Figure 22. Comparison by Exchange Source. Capital IQ

Page 19
Financing - Las t Three Months (US$ m)Fin. Amount (Million) Type of financing
Month Company Name Country Angel/S eed Debt financing S eries A S eries B S eries C S eries D S eries E Grand Total
S ep-09 Twitter US A 100.0 100.0
Ensequence US A 20.0 20.0
L ivebookings UK 16.0 16.0
Mzinga US A 10.0 10.0
InXpo US A 9.0 9. 0
J obvite US A 8.3 8. 3
R iot Games US A 8.0 8. 0
NextB io US A 8.0 8. 0
Imeem US A 6.0 6. 0
Vuclip US A 6.0 6. 0
YuMe US A 5.0 5. 0
Booyah US A 5.0 5. 0
NeoEdge US A 4.0 4. 0
Alliance Health Networks US A 3.3 3. 3
Unis fair US A 3.1 3. 1
Conduit Labs US A 3.0 3. 0
Mocapay US A 3.0 3. 0
Fwix US A 2.8 2. 8
Vantrix C anada 2. 6 2. 6
MashLogic US A 2.5 2. 5
Greys tripe US A 2.0 2. 0
Loomia US A 1.5 1. 5
FourSquare US A 1.4 1. 4
EduFire US A 1.3 1. 3
Fluther US A 0.6 0. 6
TransGaming Inc. C anada 0. 5 0. 5
OnLive US A
S ep-09 Total 0.6 2.0 16.9 52.3 27.9 23.1 110.0 232.8
Oct-09 DailyMotion F rance 25. 3 25.3
PopCap Games US A 22.5 22.5
Engine Yard US A 19.0 19.0
HubSpot US A 16.0 16.0
J ive Software US A 12.0 12.0
Spigit US A 10.0 10.0
Ooyala US A 10.0 10.0
S canS cout US A 8.5 8. 5
Box.net US A 7.1 7. 1
Reality Mobile US A 6.5 6. 5
Watercooler US A 5.5 5. 5
Vdopia US A 4.7 4. 7
Sometrics US A 4.0 4. 0
Amie S treet US A 3.9 3. 9
ViVu US A 3.0 3. 0
Fizzback UK 2.6 2. 6
Technorati US A 2.0 2. 0
Onehub US A 1.3 1. 3
DataS ync US A 1.2 1. 2
DailyBooth US A 1.0 1. 0
Hot Potato US A 1.0 1. 0
L inkedex UK 1.0 1. 0
S tatusNet Canada 0.9 0. 9
IngBoo US A 0.8 0. 8
Chango Canada 0.7 0. 7
C redit K arma US A 0.5 0. 5
L is tia US A 0.4 0. 4
Oct-09 Total 4.5 40.9 56.5 67.4 2.0 171.3
Nov-09 CubeTree US A 8.0 8. 0
E ventbrite US A 6.0 6. 0
Altruik US A 4.7 4. 7
C redit K arma US A 2.5 2. 5
B lekko US A 2.5 2. 5
S coopler US A 0.5 0. 5
Nov-09 Total 0.5 7.2 8.0 6.0 2.5 24.2
Figure 23. Financing, Last Three Months Source. Company reports

Page 20
Company Descriptions - Current Month Capital Market ActivityCompany HQ Webs ite Des cription
Altruik United S ta tes www.altuik. com Altruik , Inc. provides s earch engine optimization solutions for optimiz ing the W ebs ite content to ensure vis ibility and page rank ing. T he
company was founded in 2006 and is based in New Y ork, New Y ork.
B lekko United S ta tes www.blekko.com B lekko, Inc. provides internet s earch solutions . B lekko, Inc. was founded in 2007 and is bas ed in United S tates .
Credit Karma United S ta tes www.creditkarma.com C redit K arma is the consumer’s advoca te for demys tifying credit and has a range of tools and information resources to help them monitor
and manage the credit aspect of their financia l hea lth. C redit K a rma’s goal is to help consumers eas ily diges t the contents of their credit
report and unders tand what makes up their credit s core. C redit K arma works with a range of partners , including mortgage lenders , credit
card providers , banks , and wireles s providers .
CubeTree United S ta tes www.cubetree.com CubeT ree, Inc. provides socia l networking software. It offers C ubeT ree AP I, a R E S T W eb s ervices AP I, which a llows applications to query
and manipulate the resources provided by the C ubeT ree W eb application. CubeT ree provides its s oftware as s ervice. T he company was
founded in 2008 and is based in R edwood C ity, C alifornia .
E ventbrite United S ta tes www.eventbrite. com Mollyguard C orpora tion, doing bus ines s as E ventbrite, provides online regis tra tion solutions to event organizers . It offers online event
management and ticketing s ervices . T he company a ls o engages in publis hing branded event pages ; promoting events online; and s elling
event tickets through the personalized event regis tration W eb page. In addition, it offers an online events marketplace that enables
individuals , bus ines ses , and organiza tions of various s izes manage, promote, and s ell their events . T he company s erves event organizers ,
a s well as various non-profits , univers ities , libra ries , and organizations . Mollyguard C orporation was founded in 2006 and is based in S an
F rancis co, C alifornia .Phoenix New Media China P hoenix New Media is a s ubs idiary company of P hoenix T elevis ion G roup, an integra ted multi-media platform that offers web, online V OD,
and mobile internet/ wireles s s ervices . Its web porta l, www. ifeng.com, is one of the top news s ites in China , especia lly popular among
C hina's growing middle clas s .
PlayFish UK www.playfis h.com P layfis h L imited, a s ocia l games company, develops and publis hes video games for s ocia l networks . It creates games for people to play
together us ing socia l networks , s uch as F acebook, MyS pace, B ebo, Y ahoo! , iP hone, and iP od touch. T he company a ls o offers advertis ing
opportunities , including in-game video ads and sponsors hips packages . P layfis h L imited was founded in 2007 and is headquartered in
London, the United K ingdom with additional offices in B eijing, China ; S an F rancis co, C alifornia ; and T romso, Norway. As of November 9,
2009, P layfis h L imited operates as a s ubs idia ry of E A Interactive.
S coopler United S ta tes www.s coopler. com S coopler, Inc. , a real-time s earch engine, aggregates and organizes content being sha red on the internet as it happens . It offers s earch
options on enterta inment, technology, s ports , world and bus ines s , s cience, gaming, politics , and lifes tyle topics . T he company was
incorporated in 2008 and is based in S an F rancis co, C a lifornia .
Motley Fool United S ta tes www. fool. com The Motley F ool, Inc. operates as a multimedia financia l-s ervices company. T he company provides financia l s olutions for various inves tors . It
reaches people each month through its Webs ite, books , newspaper column, televis ion appea rances , and subscription news letter s ervices .
T he company’s s ervices include subscription inves tment news letter that provides information on blue-chips , mutual funds , undis covered
small caps , and growth s tocks , as well as delivers s tock and fund recommendations ; and F ool.com that publis hes articles to offer news ,
analys is , and commentary through a range of dis tribution partnerships primarily with Y ahoo! , MS N, and AOL. Its s ervices a ls o compris e
CAP S , a Motley F ool community members ’ s tock-rating s ervice; a weekly newspaper column; books in print on inves ting and pers onal-
finance; independent analys is and engaging commentary for bus ines s reporters , as well as radio and T V producers ; F ool UK , a financia l
W ebs ite in the United S tates ; and consumer finance advices that range from buying a home to dealing with taxes , and from managing credit-
card debt to s aving for retirement. Its products and s ervices further include credit cards ; online news letter as an inves tment guide; and reports on small-cap inves ting, income s tock
research, va lue s tock res earch, million dollar portfolio s ervice, different portfolios , and s tock advisory. T he company a ls o provides information on
bonds , broker comparis on, E T F s , index funds , mutua l funds , and s tock ideas ; and s aving and spending, credit and debt, home and real es tate,
death and T axes , and IR As . T he Motley F ool was founded in 1994 and is bas ed in Alexandria , V irginia .
Figure 24a. Company Descriptions Source. Company reports, Capital IQ, Crunchbase
Page 21
RELEVANT DISCLOSURES APPLICABLE TO: NONE
L IST OF D IS CLOS URE TE RMS :
1. None applicable.
ANALYST CERTIFICATION
Each analyst of Research Capital Corporation whose name appears in this report hereby certifies that (i) the
recommendations and opinions expressed in this research report accurately reflect the analyst’s personal views and (i i)
no part of the research analyst’s compensation was or will be directly or indirectly related to the specific conclusions or
recommendations expressed in this research report.
In format i on about Research Capi ta l Corpora t i on ’s Rat i ng Sys tem, the dis t r i bu t i on o f our research to c l ien ts and the percen tage o f recommendat i ons whi ch are in each o f our rat i ng ca tegor i es i s avai labl e on our web si te a t www. researchcapi ta l . com.
The in format i on con tai ned i n th i s report has been drawn f rom sources bel i eved to be re l i able but i t s accuracy o r comple teness is no t guaranteed , nor i n p rovi d i ng i t does Research Capi ta l Corpora t ion assume any responsib i l i ty o r l iabi l i ty . Research Capi ta l Corpora t ion , i t s d i recto rs , o f f i cers and o ther employees may, f rom t ime to t ime, have posi t ions i n the secur i t ies ment i oned herein . Conten ts o f th i s report cannot be reproduced i n who le or i n par t wi thou t the expressed permissi on o f Research Capi ta l Corporat i on. (U.S. Ins t i tu t ional Cl ien ts — Research Capi ta l U.S.A. Inc. (a whol l y owned subsid i ary o f Research Capi ta l Corpora t ion) accep ts responsib i l i t y fo r the contents o f th i s repor t sub jec t to the terms & l imi tat i ons se t out above . F i rms o r i ns t i tu t i ons recei v i ng th i s repor t should e f fect t ransact i ons in secur i t i es d i scussed i n the repor t through Research Capi ta l U.S.A. Inc. , a Broker-Dealer Regis te red wi th the Uni ted Sta tes Secur i t ies and Exchange Commissi on) .
Toronto 416.860.7600 Montreal 514.399.1500 Vancouver 604.662.1800 Calgary 403.265.7400 Regina 306.566.7550
www.researchcapital.com