09 02 24 Web 2.0 Weekly
21
SOFTWARE & SERVICES 24 FEBRUARY 2009 WEB 2.O WEEKLY DAVID SHORE, CFA, MBA 416.860.6784 [email protected] Arun Thomas (Associate) 416.860.7666 DEAL SIZES INCREASE TWITTER RETAINS TOP SPOT FOR RAISING MONEY IN THE LAST THREE MONTHS The largest Web 2.0 financing of the last three months remains the $35 million raised by Twitter (Figure 2). Overall, there have been 20 financings announced in February, totalling $160 million, or $8 million on average. The average value for February is above the $6.8 million average for January, with four financings over $15 million in February (Twitter, Synthasite, Tremor Media and Offerpal Media) vs. no deals over $15 million in January. Financing - Last Three Months 0.0 5.0 10.0 15.0 20.0 25.0 30.0 35.0 40.0 Twitter GoFish Synthasite Tremor Media Offerpal Media Yodle Emergent Game Technologies AdMob Outbrain Aster Data Systems VirtuOz NetShelter Blue Kai IMVU NewsGator Go Internet Media RatePoint DECA Nurien FooMojo Taptu Tvtrip One True Media Scribd SundaySky Play Hard Sports Social Median JibJab Xobni InsideView Kewego Fliqz Motionbox SocialMedia Oodle Superfish Snapmylife Sportsblogs Jackbe Geni Tagged ChakPak AboutUs Gbox Tumblr TextDigger Playdo OneSpot Virtual Fairground FetchDog Mixpo Overlay.TV E-Global Sports Network 7 Billion People mEgo Tripwolf WhistleBox DotBlu Outright Tvinci Filtrbox Cake Financial Hubdub Snooth Angie's List CoveritLive StockTwits fav.or.it Identi.ca Clickpass Pulse Entertainment Meez (US$m) Feb-09 Jan-09 Dec-08 This report has been created by Analysts that are employed by Research Capital Corporation, a Canadian Investment Dealer. For further disclosures, please see last page of this report. www.researchcapital.com Toronto 416.860.7600 Montreal 514.399.1500 Vancouver 604.662.1800 Calgary 403.265.7400 Regina 306.566.7550
-
Upload
david-shore -
Category
Technology
-
view
542 -
download
5
description
Twitter largest financing in last three months.
Transcript of 09 02 24 Web 2.0 Weekly

SOFTWARE & SERVICES 24 FEBRUARY 2009
W E B 2 . O W E E K L Y
DAVID SHORE, CFA, MBA 416.860.6784
Arun Thomas (Associate) 416.860.7666
DEAL SIZES INCREASE
TWITTER RETAINS TOP SPOT FOR RAISING MONEY IN THE LAST THREE MONTHS The largest Web 2.0 financing of the last three months remains the $35 mill ion raised by Twitter (Figure 2). Overall, there have been 20 financings announced in February, total ling $160 mil lion, or $8 mill ion on average. The average value for February is above the $6.8 mil lion average for January, with four f inancings over $15 mill ion in February (Twitter, Synthasite, Tremor Media and Offerpal Media) vs. no deals over $15 mill ion in January.
Financing - Last Three Months
0.0
5.0
10.0
15.0
20.0
25.0
30.0
35.0
40.0
Tw
itter
GoFis
hSynt
hasi
teTre
mor M
edia
Offer
pal
Medi
aY
odle
Em
ergen
t G
am
e Te
chno
logie
sA
dMob
Outb
rain
Aste
r D
ata
Syst
em
sVirtu
Oz
Net
Shel
ter
Blu
e K
aiIM
VU
New
sGato
rG
o In
tern
et M
edi
aR
ate
Poin
tD
EC
AN
urie
nFooM
ojo
Tap
tuTvtrip
One
Tru
e M
edia
Scrib
dSunda
ySky
Pla
y H
ard
Spor
tsSocia
l Medi
an
Jib
Jab
Xob
niIn
sid
eVie
wK
ewego
Fliq
zM
otio
nbox
Soci
alM
edia
Ood
leSupe
rfis
hSnap
myl
ifeSportsbl
ogs
Jac
kbe
Gen
iT
agge
dC
hakP
akAbo
utU
sG
box
Tum
blr
Text
Dig
ger
Pla
ydo
One
Spot
Virtu
al F
airgr
oun
dFetc
hDog
Mix
po
Over
lay.T
VE
-Glo
bal S
ports N
etw
ork
7 B
illion
Peopl
em
Ego
Tripw
olf
Whis
tleB
oxD
otBlu
Out
right
Tvin
ciFilt
rbox
Cake
Fin
anci
alH
ubd
ub
Sno
oth
Ang
ie's
Lis
tC
over
itLiv
eS
tock
Tw
itsfa
v.o
r.it
Iden
ti.ca
Clic
kpas
sPuls
e Ente
rtai
nment
Mee
z
(US$m
)
Feb-09
Jan-09
Dec-08
This report has been created by Analysts that are employed by Research Capital Corporation, a Canadian Investment Dealer. For further disclosures, please see last page of this report.
www.researchcapi tal .com
Toronto 416 .860 .7600 Montrea l 514.399 .1500 Vancouver 604 .662 .1800 Calgary 403 .265.7400 Regina 306 .566 .7550

Page 2
THE WE B 2 . 0 UNI VE RSE
85 public Web 2.0 companies identified: We have identif ied 85 public companies for our Web 2.0 universe, with a combined market cap of $30 bill ion. These include a wide variety of companies, including MMOG (Massive Multi-Player Online Gaming) companies, social networking software companies, media sharing companies, and social lending companies. See below for a summary of the ful l universe (Figure 1). The average market cap for the group is ~$330 mil lion (but a median of only $28.6 mil lion), with average trai ling revenue of $134 mill ion (median $36 mill ion). The companies are also highly profitable, with an average EBITDA margin of 17.8%. On a valuation basis, the overall average is 3.6x trai ling revenue (median 1.1x) and 8.2x trai ling EBITDA (median 5.4x). Fifteen of the companies have more than 500 employees.
Comparable Company Analys is > Web 2.0
Company Name LTM as of Ticker Exc hange
Trading
Currency HQ
Current
Price
US D Market
Cap ($m)
US D L TM Total
R ev ($m )
USD L TM Total
EB ITDA ($m )
E B ITDA
%
TEV/LTM
Revenue
TEV/L TM
EB ITDA Employees
Acce lerize N ew Media, Inc. 9 /30/2008 ACLZ OTCB B US D United S tates 0. 31 8. 3 3.2 ( 4. 7) NM 4. 0x - 20
Actoz S oft Co. , Ltd. 9 /30/2008 A052790 K OS E KR W S outh Korea 11 ,050 65. 2 48. 9 8. 9 18 .3% 0. 9x 4.7x NA AQ Inte ractive, Inc. 12/31/2008 3838 TS E JP Y J a pan 31 ,800 18. 3 63. 7 5. 1 8. 0% - - NA Associated Media Holdings Inc. 6 /30/2007 ASMH OTCP K US D United S tates 0. 01 0. 2 0.1 ( 2. 3) NM 10. 2x - 3
B igs tring C orp. 9 /30/2008 B SG C OTCB B US D United S tates 0. 01 0. 7 0.1 ( 2. 1) NM 28. 9x - 8 Br ight T hings plc 9 /30/2008 AIM:B GT AIM G BP United K ingdom 0.02 3. 3 0.2 ( 1. 6) NM 13. 4x - 9
BroadW ebAs ia Inc. 9 /30/2008 BW BA OTCP K US D United S tates 1. 01 85. 7 0.0 ( 4. 6) NM - - 46 CDC Corp. 9 /30/2008 CHIN.A Na sdaqG S US D Hong K ong 0. 79 85. 2 428. 1 18 .8 4. 4% 0. 3x 7.5x 3 ,125 China G ateway Corpora tion 9/30/2008 CGW Y OTCB B US D United S tates 0. 00 0. 0 6.7 ( 6. 6) -98. 9% 0. 0x - 37
Chinese G amer International 9 /30/2008 G TS M:3083 G TS M TWD Ta iwan 111. 00 271 . 8 37. 1 17 .5 47 .1% 5. 9x 12. 4x NA CornerWorld Corporation 10/31/2008 CW R L OTCB B US D United S tates 0. 15 7. 0 0.6 3. 1 506. 8% 13. 8x 2.7x NA
DADA SpA 9/30/2008 CM:DA CM E UR Italy 5. 70 117 . 7 216. 0 34 .5 16 .0% 0. 7x 4.6x 574
DXN Holdings Bhd 11/30/2008 DXN K LS E MYR Ma lays ia 0. 32 20. 0 76. 0 10 .1 13 .3% 0. 5x 3.9x NA Digita lP os t Interactive, Inc. 9 /30/2008 DG LP OTCB B US D United S tates 0. 01 0. 5 0.4 ( 3. 3) NM 3. 6x - 11
Digita lT own, Inc. 11/30/2008 DG TW OTCB B US D United S tates 2. 40 65. 2 NM ( 2. 5) NM - - 3 Dolphin Digita l Media , Inc. NA DP DM OTCB B US D United S tates 0. 50 24. 2 NA NM NM - - 6
E olith Co. Ltd. 12/31/2007 A041060 K OS E KR W S outh Korea 585 18. 3 16. 7 ( 0. 0) -0 .3% 1. 1x - NA
E xtensions, Inc. 9 /30/2008 E XT I OTCP K US D United S tates 0. 15 14. 2 NM NM NM - - 2 F ina ncia l Media Group, Inc. 11/30/2008 FNG P OTCB B US D United S tates 0. 03 2. 1 6.8 1. 2 18 .3% 0. 2x 1.0x 22
F luid Mus ic C anada , Inc. 9 /30/2008 TS X: FMN TS X CAD United S tates 0. 50 21. 0 4.2 ( 8. 6) NM 1. 9x - 29 F rogs te r Inte ractive P ictures AG 6/30/2008 FR G XT R A E UR Germany 4. 03 12. 1 5.1 ( 3. 1) -60. 6% 2. 3x - NA Gamania Digital E nterta inment Co. , L td. 9 /30/2008 6180 G TS M TWD Ta iwan 21. 55 94. 3 107. 2 18 .1 16 .9% 0. 6x 3.8x NA
GameOn Co L td. 12/31/2008 3812 TS E JP Y J a pan 91 ,000 92. 9 78. 8 20 .8 26 .4% 0. 4x 1.6x NA GeoS entric Oyj 9 /30/2008 G EO1V HL SE E UR F inland 0. 04 45. 6 5.2 (12 .0) NM 7. 7x - 92 Giant Interactive G roup, Inc. 9 /30/2008 GA NY SE US D China 6. 05 1, 438. 1 245. 2 155. 7 63 .5% - - 1 ,016
GigaMedia L td. 9 /30/2008 G IGM Na sdaqG S US D Ta iwan 6. 03 325 . 8 200. 5 48 .0 23 .9% 1. 3x 5.4x 975 GoF ish Corporation 9/30/2008 GOFH OTCB B US D United S tates 0. 11 3. 2 6.3 (11 .0) NM 2. 2x - 41
Gravity Co., Ltd 9/30/2008 G R V Y Na sdaqGM US D S outh Korea 0. 70 19. 5 32. 7 6. 3 19 .2% - - 636 Gree, Inc. 6 /30/2008 TS E : 3632 TS E JP Y J a pan 4 ,740 1, 116. 5 31. 0 11 .2 36 .0% 33. 9x - NA GungHo Online E ntertainment, Inc. 9 /30/2008 3765 OSE JP Y J a pan 112 ,400 135 . 7 107. 9 15 .8 14 .7% 1. 0x 6.9x NA
HanbitS oft, Inc. 9 /30/2008 A047080 K OS E KR W S outh Korea 3 ,370 49. 4 46. 4 (11 .9) -25. 6% 0. 7x - NA IAC/Inte rActiveCorp. 12/31/2008 IAC I Na sdaqG S US D United S tates 14. 92 2, 102. 2 1 , 445 . 1 64 .6 4. 5% 0. 2x 5.4x NA
IAS E ne rgy, Inc. 10/31/2008 IAS C .A OTCB B US D Canada 0. 02 1. 5 0.0 ( 0. 9) NM - - NA
IdeaE dge, Inc. 12/31/2008 OTCB B: ID AE OTCB B US D United S tates 0. 40 16. 9 0.0 ( 4. 6) NM - - NA is eemedia Inc. 9 /30/2008 IEE TS XV CAD Canada 0. 08 3. 3 1.1 ( 4. 4) NM 0. 6x - NA
J umbuck Entertainment P ty Ltd. 6 /30/2008 ASX :JMB ASX AUD Aus tra lia 0. 40 12. 8 10. 1 4. 7 46 .0% 0. 8x 1.8x 72 J umpTV Inc. 6 /30/2008 TS X: J TV TS X CAD Canada 0. 40 36. 4 11. 5 ( 1. 8) -15. 3% 3. 9x - NA
Kaboose Inc. 9 /30/2008 TS X: KAB TS X CAD Canada 0. 38 42. 6 59. 4 4. 5 7. 6% 0. 8x 11. 0x NA
K ingsoft Co. Ltd. 9 /30/2008 3888 S EH K HK D China 2. 77 383 . 5 106. 8 36 .1 33 .8% 2. 8x 8.2x 1 ,660 Lingo Media Corpora tion 9/30/2008 TS XV :LM TS XV CAD Canada 0. 90 9. 3 3.3 ( 1. 4) -42. 5% 3. 1x - NA
LiveWorld Inc. 9 /30/2008 LVWD OTCP K US D United S tates 0. 04 1. 2 11. 7 ( 1. 2) -10. 1% 0. 0x - 73 LookS mart, Ltd. 9 /30/2008 LOOK Na sdaqGM US D United S tates 1. 27 21. 6 69. 5 ( 2. 6) -3 .7% - - 93
Magnitude Informa tion S ys tems Inc. 9 /30/2008 MAGY OTCB B US D United S tates 0. 02 7. 9 0.1 ( 3. 2) NM - - 13
Mixi, Inc. 12/31/2008 2121 TS E JP Y J a pan 368 ,000 594 . 8 123. 9 47 .1 38 .0% 3. 9x 10. 3x NA Modern T imes Group Mtg AB 12/31/2008 MTG B OM SE K S weden 112. 00 840 . 3 1 , 499 . 2 239. 7 16 .0% 0. 9x 5.4x NA
Moggle , Inc 12/31/2008 MMOG OTCB B US D United S tates 2. 00 72. 6 NM ( 1. 1) NM - - 3 MOK O.mobi L imited 6/30/2008 MK B ASX AUD Aus tra lia 0. 04 2. 1 1.3 ( 2. 0) NM 0. 7x - NA
NEOW IZ G ames Corpora tion 12/31/2007 A095660 K OS E KR W S outh Korea 33 ,750 217 . 0 120. 6 32 .4 26 .9% 1. 7x 6.4x NA
NetDra gon WebS oft, Inc. 9 /30/2008 777 S EH K HK D China 2. 80 190 . 9 95. 3 46 .3 48 .6% 0. 1x 0.3x 1 ,482 Netea se.com Inc. 9 /30/2008 NTE S Na sdaqG S US D China 18. 63 2, 292. 5 422. 7 274. 4 64 .9% - - 2 ,413 NeXplore Corporation 9/30/2007 NX PC OTCP K US D United S tates 0. 50 27. 9 NM ( 4. 9) NM - - 19
Ngi G roup Inc. 12/31/2008 2497 TS E JP Y J a pan 17 ,180 22. 4 103. 8 32 .0 30 .8% - - NA
Northgate T echnologies L imited 12/31/2008 590057 B S E INR India 38. 45 27. 0 135. 5 23 .8 17 .6% 0. 2x 1.1x 286
Open T ext Corp. 12/31/2008 OTE X Na sdaqG S US D Canada 31. 94 1, 657. 7 769. 3 195. 0 25 .3% 2. 3x 9.2x 3 ,400 Openwa ve S ys tems Inc. 12/31/2008 OPW V Na sdaqG S US D United S tates 0. 82 68. 3 199. 6 (10 .2) -5 .1% - - 627 Perfect W orld Co., Ltd. 9 /30/2008 PW R D Na sdaqG S US D China 12. 20 696 . 0 186. 9 99 .9 53 .5% - - 1 ,401
PhotoChannel Ne tworks Inc. 9 /30/2008 TS XV :P N TS XV CAD Canada 1. 96 52. 5 13. 6 ( 2. 4) -17. 7% 3. 8x - NA
Quepasa Corp. 9 /30/2008 QPS A Na sdaqCM US D United S tates 1. 40 17. 7 0.1 (11 .8) NM - - 63 OAO R B C Informa tion S ys tems 12/31/2007 R B C I R T S US D R us s ia 0. 30 41. 6 131. 7 17 .2 13 .1% 0. 0x 0.1x NA
Shanda Intera ctive Ente rtainment L td. 9 /30/2008 S NDA Na sdaqG S US D China 31. 98 2, 218. 9 478. 0 228. 3 47 .8% - - 2 ,564 S hutterfly, Inc. 12/31/2008 S F LY Na sdaqG S US D United S tates 7. 48 188 . 0 213. 5 29 .8 13 .9% 0. 5x 3.4x NA
S K Communications Co. , Ltd. 12/31/2007 A066270 K OS E KR W S outh Korea 6 ,730 185 . 1 138. 7 13 .1 9. 4% 1. 3x 14. 2x NA SNAP Interactive, Inc. 9 /30/2008 S TVI OTCB B US D United S tates 1. 00 10. 7 2.3 0. 2 10 .1% 4. 2x 41. 2x 5
SNM G lobal Holdings 9/30/2008 S NMN OTCP K US D United S tates 0. 00 0. 0 2.0 ( 0. 7) -34. 8% 1. 1x - 33
S ocial Media V enures , Inc. 12/31/2008 S MVI OTCP K US D United S tates 1. 25 0. 0 0.1 ( 0. 1) -60. 5% 0. 1x - NA Spark Networks , Inc. 9 /30/2008 LOV AMEX US D United S tates 2. 50 53. 6 60. 1 11 .7 19 .5% 0. 8x 4.2x 176
SpectrumDNA, Inc. 9 /30/2008 S PXA OTCB B US D United S tates 0. 10 4. 9 0.1 ( 2. 7) NM - - 7 T encent Holdings Ltd. 9 /30/2008 700 S EH K HK D China 46. 65 10 ,814.3 903. 8 447. 8 49 .5% 12. 9x 26. 1x 6 ,039
T he P arent Company 8/2/2008 K IDS .Q OTCP K US D United S tates 0. 02 0. 6 112. 0 (13 .5) -12. 0% 0. 2x - 347
T he9 Limited 9/30/2008 NCT Y Na sdaqG S US D China 13. 22 365 . 0 252. 5 95 .1 37 .7% - - 1 ,361 T heS treet.com, Inc. 12/31/2008 TS CM Na sdaqGM US D United S tates 2. 23 67. 7 71. 9 7. 7 10 .8% - - NA T ree .Com, Inc. 12/31/2008 TR E E Na sdaqGM US D United S tates 3. 98 37. 3 228. 6 (27 .0) -11. 8% 0. 2x - NA
Unis e rve Communications Corp. 11/30/2008 TS XV :U S S TS XV CAD Canada 0. 05 1. 0 23. 9 0. 1 0. 4% 0. 1x 31. 3x NA
United Online Inc. 12/31/2008 UNT D Na sdaqG S US D United S tates 4. 76 390 . 8 669. 4 153. 9 23 .0% 1. 0x 4.5x NA
UOMO Media, Inc 10/31/2008 UOMO OTCB B US D Canada 0. 08 6. 8 0.5 ( 0. 4) -91. 6% 15. 1x - NA VOIS , Inc. 9 /30/2008 VOIS OTCB B US D United S tates 0. 75 5. 4 0.0 ( 4. 0) NM - - 4 W ebzen Inc. 12/31/2008 WZE N Na sdaqGM US D S outh Korea 1. 13 13. 4 19. 1 ( 1. 9) -10. 1% - - 330
W izza rd S oftwa re Corporation 9/30/2008 WZE AMEX US D United S tates 0. 65 29. 3 6.2 ( 6. 5) NM 4. 7x - 110
W oozyF ly, Inc. 9 /30/2008 WZYF OTCB B US D United S tates 0. 15 2. 6 0.0 NM NM - - 14
W orlds .com Inc. 9 /30/2008 WDDD OTCB B US D United S tates 0. 18 9. 4 0.1 NM NM - - 1 W ynds torm Corporation NA WYND OTCB B US D United S tates 0. 12 2. 2 NA NM NM - - NA XING AG 9/30/2008 O1B C XT R A E UR G ermany 31. 00 205 . 5 39. 9 15 .5 38 .8% 3. 8x 9.8x 161
YedangOnline Corp. 12/31/2007 A052770 K OS E KR W S outh Korea 6 ,630 69. 4 45. 9 10 .3 22 .4% 1. 5x 6.7x NA
Ynk K orea Inc. 12/31/2007 A023770 K OS E KR W S outh Korea 4 ,100 6. 7 13. 0 ( 1. 0) -7 .6% 0. 5x - NA ZipL ocal Inc. 9 /30/2008 TS XV :ZIP TS XV CAD Canada 0. 01 0. 3 2.8 ( 3. 8) NM 0. 3x - NA
High 10 ,814.3 1 ,499 .2 447. 8 506. 8% 33. 9x 41. 2x 6, 039Low 0. 0 0.0 -27. 0 -98. 9% 0. 0x 0.1x 1Average 333.1 133.9 29.0 17.8% 3.6x 8.2x 626
Median 28. 6 36.3 0 .1 15 .3% 1. 0x 5.4x 92
Figure 1. Web 2.0 Universe Summary Source. Capital IQ

Page 3
CAPIT AL M ARKET S ACT IV I TY (M &A AND F I NANCI NG )
Twitter raises $35 million: The largest Web 2.0 financing of the last three months remains the $35 mill ion raised by Twitter (Figure 2). Overall, there have been 20 financings announced in February, totall ing $160 mil lion, or $8 mil lion on average. The average value for February is above the $6.8 mill ion average for January, with four f inancings over $15 mil lion in February (Twitter, Synthasite, Tremor Media and Offerpal Media) vs. no deals over $15 mill ion in January. For additional details, see Figure 30 (at end of note).
Financing - Last Three Months
0.0
5.0
10.0
15.0
20.0
25.0
30.0
35.0
40.0
Tw
itte
rG
oF
ish
Sy
nth
as
iteT
rem
or
Me
dia
Off
erp
al M
ed
iaY
od
leE
me
rge
nt
Ga
me
Te
ch
no
log
ies
Ad
Mo
bO
utb
rain
As
ter
Da
ta S
ys
tem
sV
irtu
Oz
Ne
tSh
elte
rB
lue
Ka
iIM
VU
Ne
ws
Ga
tor
Go
In
tern
et
Me
dia
Ra
teP
oin
tD
EC
AN
uri
en
Fo
oM
ojo
Ta
ptu
Tv
trip
On
e T
rue
Me
dia
Sc
rib
dS
un
da
yS
ky
Pla
y H
ard
Sp
ort
sS
oc
ial M
ed
ian
Jib
Ja
bX
ob
ni
Ins
ide
Vie
wK
ew
eg
oF
liqz
Mo
tion
bo
xS
oc
ialM
ed
iaO
od
leS
up
erf
ish
Sn
ap
my
life
Sp
ort
sb
log
sJ
ac
kb
eG
en
iT
ag
ge
dC
ha
kP
ak
Ab
ou
tUs
Gb
ox
Tu
mb
lrT
ex
tDig
ge
rP
lay
do
On
eS
po
tV
irtu
al F
air
gro
un
dF
etc
hD
og
Mix
po
Ov
erl
ay
.TV
E-G
lob
al S
po
rts
Ne
two
rk7
Bill
ion
Pe
op
lem
Eg
oT
rip
wo
lfW
his
tleB
ox
Do
tBlu
Ou
trig
ht
Tv
inc
iF
iltrb
ox
Ca
ke
Fin
an
cia
lH
ub
du
bS
no
oth
An
gie
's L
ist
Co
ve
ritL
ive
Sto
ck
Tw
itsfa
v.o
r.it
Ide
nti.
ca
Clic
kp
as
sP
uls
e E
nte
rta
inm
en
tM
ee
z
(US
$m
)
Feb-09
Jan-09
Dec-08
Figure 2. Financings, Last Three Months Source. Company reports

Page 4
Four video companies raise $25.9 million (total): Activity in February has been busiest among video companies (Figure 3), with Tremor Media, WhistleBox, Tvinci, and Mixpo raising a total of $25.9 mill ion There have also been four f inancings of aggregation companies - Outbrain, Oodle, OneSpot and fav.or.i t - raising a total of $22.5 mil lion.
Financing by Sector - February 2009
35.0
25.9
22.520.0
15.012.5
9.0
5.3 4.3 4.0 3.0 2.0 1.40.0
5.0
10.0
15.0
20.0
25.0
30.0
35.0
40.0
Mic
roblo
g
Vid
eo
Ag
gre
gatio
n
Wik
i
Vir
tual G
oo
ds
Gam
ing
Tra
vel
Soc
ial N
etw
ork
s
Searc
h
Virtu
al W
orld
Ana
lytic
s
Fin
ancia
l Serv
ice
s
Com
me
nt/R
eputa
tion
1 4 4 1 1 1 1 2 1 1 1 1 1
(US
$m
)
Figure 3. Financings, by Sector, February 2009 Source. Company reports
Average round size increases slightly: On a trail ing 12-month basis, total f inancing dollars inched up as of February 2009, with average round sizes increasing sl ightly as well (Figure 4).

Page 5
LTM Financing
0.0
500.0
1,000.0
1,500.0
2,000.0
2,500.0
3,000.0
3,500.0
4,000.0
Jul-05
Sep-0
5
Nov-0
5
Jan-0
6
Mar-
06
Ma
y-0
6
Jul-06
Sep-0
6
Nov-0
6
Jan-0
7
Mar-
07
Ma
y-0
7
Jul-07
Sep-0
7
Nov-0
7
Jan-0
8
Mar-
08
Ma
y-0
8
Jul-08
Sep-0
8
Nov-0
8
Jan-0
9
(US
$m
)
0.0
2.0
4.0
6.0
8.0
10.0
12.0
14.0
16.0
18.0
20.0
(US
$m
)
Total Average
Figure 4. Financings, Last 12 Months Source. Company reports
Cumulative total nears $5.6 billion: Overall, on a cumulative basis, Web 2.0 financings have totalled nearly $5.6 bil lion, with the majority of the financing coming in late 2007 and the first three quarters of 2008 (Figure 5).Financing for the first quarter of 2009 has now passed that raised in the fourth quarter of 2008 – reversing the downtrend since the second quarter last year.

Page 6
Web 2.0 Financing (cumulative)
35.5 38.8 20.1
87.237.5 33.5 18.2
41.9 57.8 77.4
135.6
82.8
145.7151.5101.6
313.8
944.7
712.7
1,313.3
524.9
338.5370.9
0.0
200.0
400.0
600.0
800.0
1,000.0
1,200.0
1,400.0
Qtr4 Qtr1 Qtr2 Qtr3 Qtr4 Qtr1 Qtr2 Qtr3 Qtr4 Qtr1 Qtr2 Qtr3 Qtr4 Qtr1 Qtr2 Qtr3 Qtr4 Qtr1 Qtr2 Qtr3 Qtr4 Qtr1
2003 2004 2005 2006 2007 2008 2009
(US
$m
)
0.0
1,000.0
2,000.0
3,000.0
4,000.0
5,000.0
6,000.0
(US
$m
)
Figure 5. Financing, Cumulative Source. Company reports
U.S. remains dominant: U.S. companies continue to dominate capital market activity – with almost 73% of f inancings/M&A involving U.S. companies (based on dollars) (Figure 6). Canadian companies generated under 1% of capital market activity based on dollar volume (Figure 6). Based on number of transactions, the U.S. leads with 73.5% of deals, while Canada is third in number of f inancings at 5.1% (Figure 7).
Financing/M&A by Country - LTM ($)
China
7.9%
Russia
1.7%
USA
72.8%
ROW
2.3%
France
0.7%
Canada
0.7%
UK
12.9%
Israel
1.0%
Financing/M&A by Country - LTM (#)
Israel
4.0%
Canada5.1%
France
2.8%
UK5.1%
ROW9.5%
USA73.5%
Page 7
Figures 6 & 7. Financing/M&A, by Country (LTM, $, #) Source. Company reports
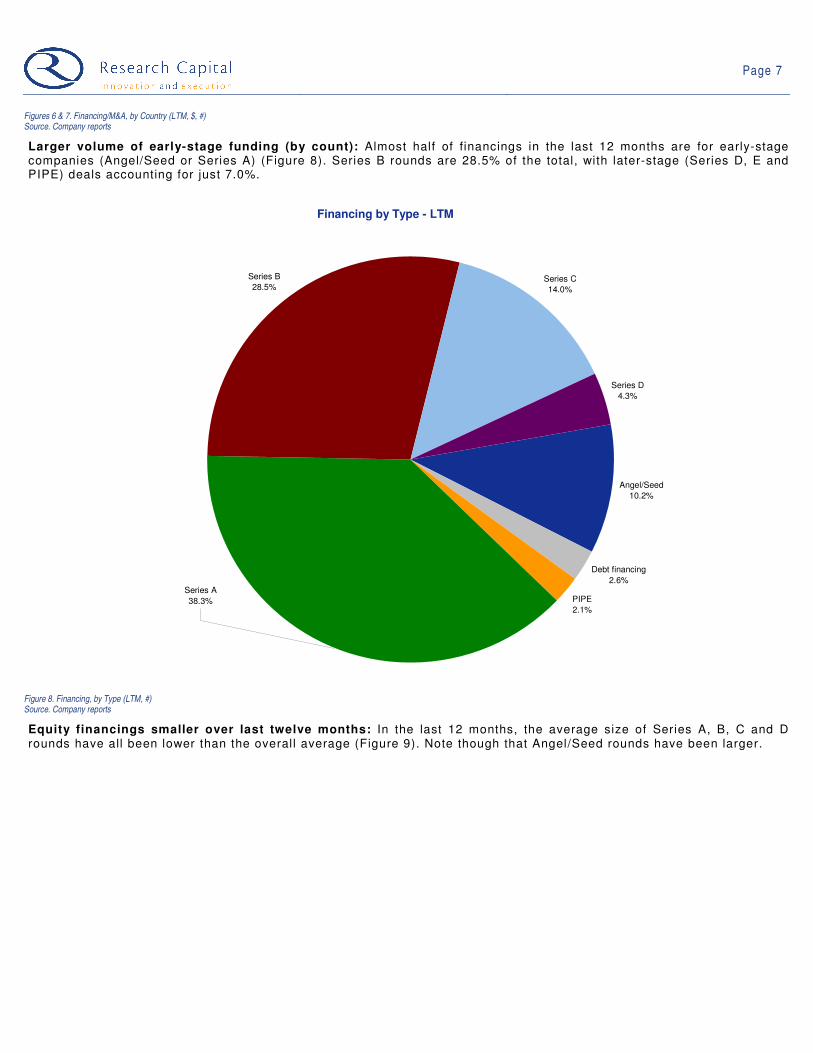
Larger volume of early-stage funding (by count): Almost half of financings in the last 12 months are for early-stage companies (Angel/Seed or Series A) (Figure 8). Series B rounds are 28.5% of the total, with later-stage (Series D, E and PIPE) deals accounting for just 7.0%.
Financing by Type - LTM
PIPE
2.1%
Series A
38.3%
Series B
28.5%
Debt financing
2.6%
Series C
14.0%
Series D
4.3%
Angel/Seed
10.2%
Figure 8. Financing, by Type (LTM, #) Source. Company reports
Equity financings smaller over last twelve months: In the last 12 months, the average size of Series A, B, C and D rounds have all been lower than the overall average (Figure 9). Note though that Angel/Seed rounds have been larger.

Page 8
Average financing round size
3.5
41.9
8.8
5.8
11.4
18.4
23.8
11.3
2.6
38.1
6.87.5
12.0
29.3
34.9
11.3
0.0
5.0
10.0
15.0
20.0
25.0
30.0
35.0
40.0
45.0
Angel/Seed Debt financing PIPE Series A Series B Series C Series D Series E
(US
$m
)
LTM Average Size Overall Average
Figure 9. Average Size per Round Source. Company reports
CAPIT AL M ARKET S ACT IV I TY (P RI CE PE RFO RM ANCE )
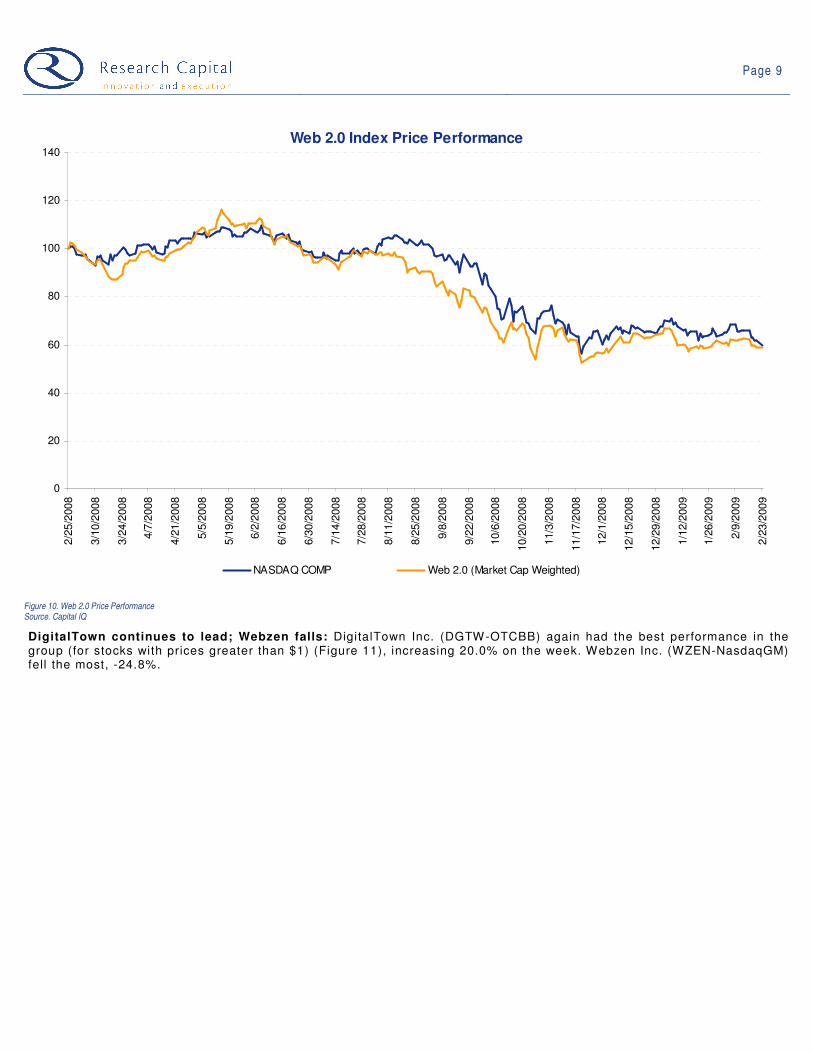
Price Performance: Our Web 2.0 index (market-cap weighted) has closely tracked the performance of the NASDAQ composite index, although it has outperformed the index from mid 2008 until recently (Figure 10).
Page 9
Web 2.0 Index Price Performance
0
20
40
60
80
100
120
140
2/2
5/2
008
3/1
0/2
008
3/2
4/2
008
4/7
/2008
4/2
1/2
008
5/5
/2008
5/1
9/2
008
6/2
/2008
6/1
6/2
008
6/3
0/2
008
7/1
4/2
008
7/2
8/2
008
8/1
1/2
008
8/2
5/2
008
9/8
/2008
9/2
2/2
008
10/6
/2008
10/2
0/2
008
11/3
/2008
11/1
7/2
008
12/1
/2008
12/1
5/2
008
12/2
9/2
008
1/1
2/2
009
1/2
6/2
009
2/9
/2009
2/2
3/2
009
NASDAQ COMP Web 2.0 (Market Cap Weighted)
Figure 10. Web 2.0 Price Performance Source. Capital IQ
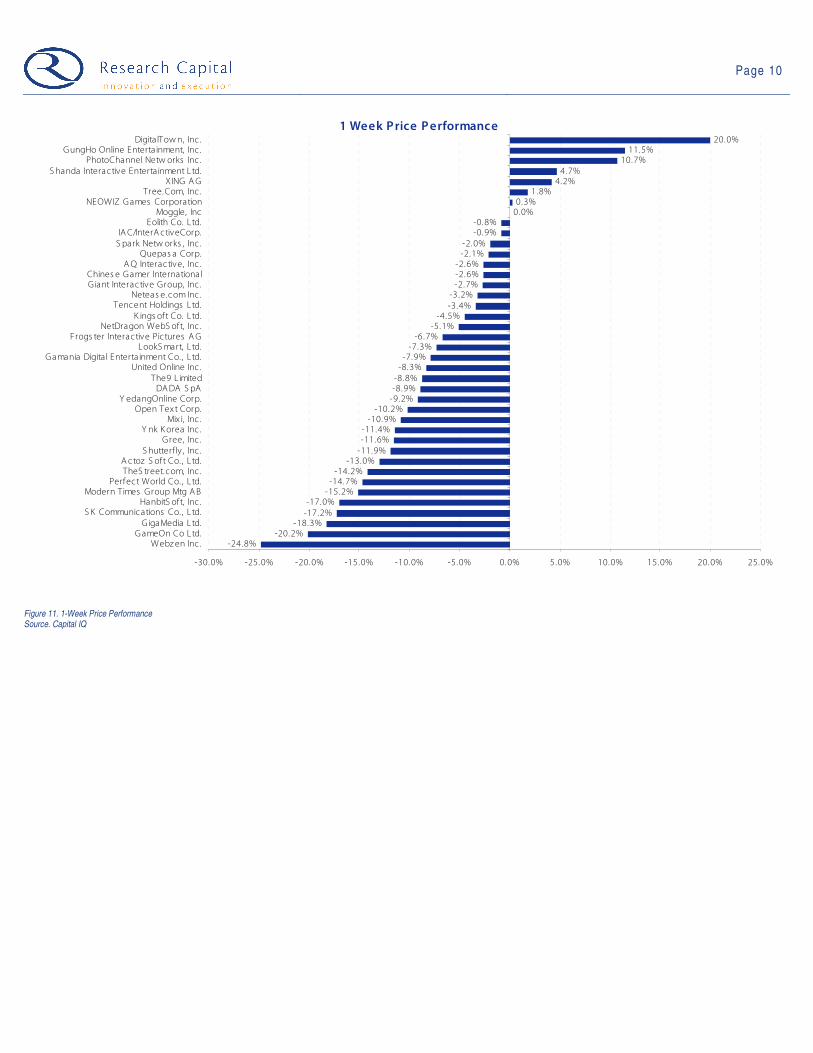
DigitalTown continues to lead; Webzen falls: DigitalTown Inc. (DGTW-OTCBB) again had the best performance in the group (for stocks with prices greater than $1) (Figure 11), increasing 20.0% on the week. Webzen Inc. (WZEN-NasdaqGM) fell the most, -24.8%.
Page 10
1 Week Price Performance
-24.8%-20.2%
-18.3%-17.2%-17.0%
-15.2%-14.7%-14.2%-13.0%-11.9%-11.6%-11.4%-10.9%-10.2%
-9.2%-8.9%-8.8%-8.3%-7.9%-7.3%-6.7%
-5.1%-4.5%-3.4%-3.2%-2.7%-2.6%-2.6%-2.1%-2.0%-0.9%-0.8%
0.0%0.3%
1.8%4.2%4.7%
10.7%11.5%
20.0%
-30.0% -25.0% -20.0% -15.0% -10.0% -5.0% 0.0% 5.0% 10.0% 15.0% 20.0% 25.0%
Webzen Inc .GameOn Co Ltd.GigaMedia Ltd.
S K Communications Co. , Ltd.HanbitS oft, Inc .
Modern Times Group Mtg ABPerfect World Co. , Ltd.
TheS treet.com, Inc .A ctoz S oft Co. , Ltd.
S hutterf ly , Inc .Gree, Inc .
Y nk Korea Inc .Mix i, Inc .
Open Tex t Corp.Y edangOnline Corp.
DADA S pAThe9 L imited
United Online Inc .Gamania Digita l Entertainment Co. , Ltd.
LookSmart, Ltd.Frogs ter Interactive Pictures AG
NetDragon WebS oft, Inc .K ings oft Co. Ltd.
Tencent Holdings Ltd.Neteas e.com Inc .
G iant Interactive Group, Inc .Chines e Gamer International
AQ Interactive, Inc .Quepas a Corp.
S park Netw orks , Inc .IAC/InterA ctiveCorp.
Eolith Co. Ltd.Moggle, Inc
NEOWIZ Games CorporationTree.Com, Inc .
X ING AGS handa Interactive Entertainment Ltd.
PhotoChannel Netw orks Inc .GungHo Online Entertainment, Inc .
Digita lTow n, Inc .
Figure 11. 1-Week Price Performance Source. Capital IQ

Page 11
INDUST RY NE WS (P ART NE RS HI PS, F I NANCI AL RES UL TS, NE W P RO DUCT S )
Key DevelopmentsCompany Headline Notes
Openwave S ys tems Inc .
(NasdaqGS :OPWV)
Openwave S ys tems Announces About Openwa ve
E mail Mx 8. 0
Openwave S ys tems Inc. announced Openwave(R ) E ma il Mx 8.0 . O penwa ve Email Mx is an extens ible ,
carrier-s ca le ema il s olution that wa s ra nked the market leader and top playe r in R adicati's annual 200 8
Me ss aging P latforms for Hos ted Email P roviders Market Qua drant. T he late st ve rs ion, Email Mx 8 .0, now
s upports mobile ema il us ing the IMAP IDL E standa rd, and high capac ity mailboxes . T he IMAP ID LE feature
enables s ervice providers to of fer mobile email d irectly to their s ubscribers with any compatible ha nds et,
and high ca pac ity mailboxe s offe r nearly limitle ss s torage to handle the increa sing amount of rich conte nt.
O penwave E mail Mx 8.0 addres s es the s ervice provider's requirement to of fer high ca pacity mailboxe s as
well as network -bas ed mobile email that e liminates the requirement for us ers to download a ha nds et clie nt.
O penwave E mail Mx 8.0 sca les to s upport any number of s ubscribers with fas t, re liable performa nce. T he
dis tributed, multi-threaded a rchitecture a llows independent scaling of a ll components to fit a n operator's
s pec ific growth patterns , while reducing the ope ra tor's T CO .
Openwave S ys tems Inc .
(NasdaqGS :OPWV)
T e ls tra S elects O penwa ve's Openwave I ntegra Nex t
G en S e rvice Management S olution
Openwave S ys tems Inc. has announced that T els tra ha s se lecte d Openwave Integra , nex t ge neration
mobile internet se rv ice ma nagement s olution des igned to provide open, s ecure multimedia and multi-
protocol se rv ice ma nagement s upport. Openwave Integra offe rs T els tra a ra nge of be nefits , inc luding the
ability to rapidly s ca le to me et cha nging cus tome r needs , as well a s support new protocols, content types
and applications . Openwave Integra provide s T e ls tra a n evolutiona ry roadmap with innovative s ervices and
be nefits inc luding: C ost effic ient evolutiona ry roadma p from WAP gateway to next-ge neration data
architecture, ena bling T els tra to leverage its inves tment in Openwave's Mobile Acces s Ga teway for W AP
s upport R apid deployment of new s ervice s and ability to cos t effic iently add capa city and new core prox ies
fo r new tra f fic , including open internet acce ss a nd R T S P s upport C ommon s ervices framework for a ll
protocols -W AP , HT T P , R T S P etc. with enhanced ope ra tions , adminis tration and monitoring (OAM)
capa bilitie s a cros s a ll tra ffics and se rvices that enables e as e of prov is ioning, mainte nance, billing, analytics
and operations . I ntegra a ls o gives operators the ability to expand the capabilities o f the ir ex is ting mobile gate
GeoS entric Oyj (HLS E:G E O1V) G eoS entric O yj Announces the La unch of G yPS ii
O penexperie nce Api
G eoS entric O yj's G yP S ii bus ines s unit a nnounced the launch of the GyP S ii OpenE xpe rience AP I, the
premier all-inclus ive pla tform for incorporating loca tion-bas ed social network ing functiona lity into embedded
mobile c lients a nd a pplications . T he company will be demonstra ting s elect s ervices of OE x on the s oon to
be rele as ed G yPS ii native application s upport for the iPhone. G yP S ii will be in Ha ll 7 B 59 at Mobile W orld
C ongres s, B arce lona . O E x s upports a whole new us er experie nce on mobile devices , a s se en on the
iPhone a nd other new us er e xperience bas ed mobile platforms . OE x a llows G yP S ii partners to e nhance
their own products and se rv ice s with the rich location-s pec if ic fe atures , content and community o f the
G yP S ii mobile social ne twork. In us ing the AP I, partne rs can le verage G yPS ii's vas t interna tional
infras tructure a nd immedia tely o ffer new s ervices to their customer bas e.
GeoS entric Oyj (HLS E:G E O1V) G eoS entric O yj's TW IG Bus ines s Unit L aunche s
TW IG P rote ctor
G eoS entric O yj's TW IG bus ine ss unit, announced the launch of its ne xt generation , G P S /G S M personal
protection de vice --T he TW IG P rotector . C re ated to protect lone workers, the vu lne ra ble and those nee ding
acces s to eme rgency ca re , the TW IG P rotector is s hock and water re s is tant, light and extremely e as y to
us e. In a ddition it can communicate with a ll TW IG (TM ) devices and s upport s ys tems us ing both SMS a nd
G P R S Mobile Phone T elema tics P rotocol. W hen operated in conjunction with the TW IG W ebF inder, the
TW IG P rotector provide s a fully inte grated, mobile communications a nd protection s olution, that can be
us ed anywhere in the world.
GeoS entric Oyj (HLS E:G E O1V); LG
E lectronics Inc . (KOSE :A066570)
L G E lectronics I nc. and G eoS entric Oyj Announces
P artne rs hip to E mbed G yPS ii's Loca tion-E nabled
Mobile Digita l L ife style Application on a R ange of
New Mobile De vice s
LG E lectronics Inc. and G eoS entric Oyj announced a partners hip to embed G yP S ii' s location-enabled
mobile digita l lifes ty le applica tion on a range of new mobile devices . Under the terms of the deal, LG
E le ctronics mobile customers will have acces s to G yPS ii's broa d range of loca tion-aware functions and
mobile lifes ty le s ervices including us er generated conte nt s haring, friend finding and socia l ne tworking
application, as well a s the ability to view it a ll on a ma p within a s ingle, e as y to navigate us er inte rface. T he
s ervice will be prov ide d in pa rtnersh ip with Intrins yc, LG 's nav igation so lution prov ide r. W ithin the
pa rtners hip agreement, L G E lectronics and GyPS ii will s hare advertis ing a nd s pons orsh ip re ve nues
ge nerated by us ers of G yP S ii on the new LG devices . T he range will firs t launch across the W indows
Mobile operating sys tem, c los ely fo llowed by Android and ja va -e nabled devices .GoF ish Corporation (OTCBB :GOFH) B eta wave C orpora tion Announces Ad-S upported
V ideo P latform
B etawa ve C orporation (GoF is h C orporation) announced the premie re of B etawave T V , an ad-s upported
v ide o platform. Be tawave T V ha s launched on s evera l publis hers with in the Be tawave portfolio , and will
a ls o be ava ilable to s elect pa rtners not in the Be tawave publis he r network . T he product fea tures advertis er-
s afe , family -friendly programming including quality animation, youth-or ie nted news , a ction s ports , movie
and v ide o game in forma tion, s pe cial events , ce le brity interv iews , fas hion, and health and beauty se gments .
B etawa ve T V o ffers marke ters a s calable video a dve rtis ing and dis tribution s olution a nd enables them to
ex tend the ir relations hip beyond dis play media and immersive integra tions . T he unive rs a l player is
cus tomized for ea ch publis her's look and fee l a nd is incorporated into the naviga tion of each s ite e ns uring a
high level of cons umer adoption. S pons orship opportunitie s include the ability to feature mes sa ges be fore
and af ter profe ss iona lly produced video programming, as well as through overlays at appropriate points in PhotoChanne l Networks Inc .
(TSXV:PN)
P hotoCha nnel Networks I nc . Announces the
L aunch of the P NI O pen Acce ss P roje ct
P hotoC hannel Networks Inc. announced the la unch of its new P NI Open Acce ss P roject. T he PN I Open
A cces s P roje ct has been created for non-P NI custome rs to be able to take advanta ge o f and utiliz e the
power of the P NI P latform's 'R outing Tier' that currently de livers millions o f ima ges and orde rs from P NI
hosted webs ite s to its cus tomer's s tores and production fa cilities . T he PN I O pen Acces s P roject will be
ins trumental in prov iding an output so lution for the billions of digital image s currently s tored on the web or in
de sk top s oftwa re products which currently ha ve no direct profes s ional printing option . T he PN I O pen
A cces s P roje ct also include s an option for la rger entities to share revenue with P NI. T h is s ymbiotic
relations hip will be a k ey driver fo r thos e organiza tions tha t would like to work directly with PN I to provide OAO R BC Information Sys tems
(R TS :RBC I)
A lfa B ank F ile s S uit Agains t OAO R B C Informa tion
S ystems for $41 .8 M illion D ebt
A lfa B ank ha s filed a s uit against OAO R B C In formation S ys tems dema nding the repayment of a $41.781
million debt, plus the interes t worth $25,06 9. T he bank seek s the re covery of a de bt which formed as a
cons equence of the partie s ' fixed-te rm de als with se curities and foreign currency, ' unde r a n agre ement
s igned on March 24, 200 8. T he Moscow A rbitration C ourt ha s re gis te re d a s uit, filed by the R oyal B a nk of
S cotla nd a gains t AO R B C Information S ys tems , OOO R B C -C enter a nd ZAO R B C -TV protes ting their
fa ilure to honor a c redit agreement. T he s uit is es tima ted at R UB 5 .17 million.P erfec t World C o., L td.
(NasdaqGS :PWR D)
P erfect W orld C o. L td. R eports Overs eas S ales
R e su lts for the Nine Months E nded S eptember
2 008
P erfect W orld C o. L td. reported sa les res ults fo r the n ine months ended S eptember 200 8. F or the period,
the company 's overs eas s a les revenue s amounted to US D 19 million, s welling more tha n two times f rom
US D 6 million in the s ame period ended S eptember 200 7. T he growth was attributed to the company's
de votion to technology res ea rch and development.BoomJ Inc (OTCBB :BOMJ ) B oomJ Inc. R eports R eve nue R es ults for the Month
o f J anuary 2 009; P rov ides E arnings G uidance for
the Month of F e bruary 2009
B oomJ Inc . reported re venue res ults fo r the month o f J anuary 2 009. T he compa ny re ported $2. 3 million in
revenue s for the month of Ja nuary and $1. 07 million for the month of December. T he company a nnounced
that it is on tra ck for continued s trong growth in the month o f F ebruary.
Figure 12. Key Developments Source. Capital IQ

Page 12
VAL UAT IO N
MMOG companies lead market cap charts: Seven companies in our Web 2.0 universe top US$1 bill ion in market capitalization (Figure 13). Sixty-three of the 85 (down from 64 last week) companies have market caps under US$100 mil lion, with 27 (vs. 27 last week) under $10 mill ion. Online gaming companies dominate the top of the l ist with four of the top seven by market cap.
Market Cap (USD m)
0.00.00.00.20.30.50.60.71.01.21.52.12.12.22.63.23.33.34.95.46.76.87.07.98.39.39.410.712.112.813.414.216.917.718.318.319.520.021.021.622.424.227.027.929.336.437.341.642.645.649.452.553.665.265.267.768.369.472.685.285.792.994.3117.7135.7185.1188.0190.9205.5217.0271.8325.8365.0383.5390.8
594.8696.0
840.31116.5
1657.72102.2
2218.92292.5
1438.1
0 500 1,000 1,500 2,000 2,500 3,000 3,500 4,000
S NM Global HoldingsS ocial Media V enures , Inc .China Gatew ay Corporation
A s s ociated Media Holdings Inc .Z ipLocal Inc .
DigitalPos t Interactive, Inc .The Parent Company
B igs tring Corp.Unis erve Communications Corp.
L iveWorld Inc .IA S Energy , Inc .
MOKO.mobi L imitedFinancial Media Group, Inc .
Wynds torm CorporationWoozyFly , Inc .
GoFis h Corporationis eemedia Inc .
B right Things plcS pectrumDNA , Inc .
V OIS , Inc .Y nk Korea Inc .
UOMO Media , IncCornerWorld Corporation
Magnitude Information S ys tems Inc .A cceleriz e New Media , Inc .
L ingo Media CorporationWorlds .com Inc .
S NAP Interactive, Inc .Frogs ter Interactive Pic tures AGJumbuck Entertainment Pty L td.
Webzen Inc .Ex tens ions , Inc .IdeaEdge, Inc .Quepas a Corp.Eolith Co. L td.
AQ Interactive, Inc .Gravity Co. , Ltd
DXN Holdings BhdFluid Mus ic Canada , Inc .
LookSmart, L td.Ngi Group Inc .
Dolphin Digital Media , Inc .Northgate Technologies L imited
NeXplore CorporationWiz z ard S oftw are Corporation
JumpTV Inc .Tree.Com, Inc .
OAO RBC Information S ys temsKaboos e Inc .
GeoS entric OyjHanbitS oft, Inc .
PhotoChannel Netw orks Inc .S park Netw orks , Inc .A ctoz S of t Co. , L td.
DigitalTow n, Inc .TheS treet.com, Inc .
Openw ave S ys tems Inc .Y edangOnline Corp.
Moggle, IncCDC Corp.
B roadWebA s ia Inc .GameOn Co L td.
Gamania Digital Enterta inment Co. , L td.DADA S pA
GungHo Online Entertainment, Inc .S K Communications Co. , L td.
S hutterf ly , Inc .NetDragon WebS oft, Inc .
X ING AGNEOWIZ Games CorporationChines e Gamer International
G igaMedia L td.The9 L imited
K ings oft Co. L td.United Online Inc .
Mix i, Inc .Perfect World Co. , L td.
Modern Times Group Mtg ABGree, Inc .
G iant Interactive Group, Inc .Open Text Corp.
IAC/InterA ctiveCorp.S handa Interac tive Entertainment L td.
Neteas e.com Inc .Tencent Holdings L td.
Figure 13. Market Cap Ranking Source. Capital IQ
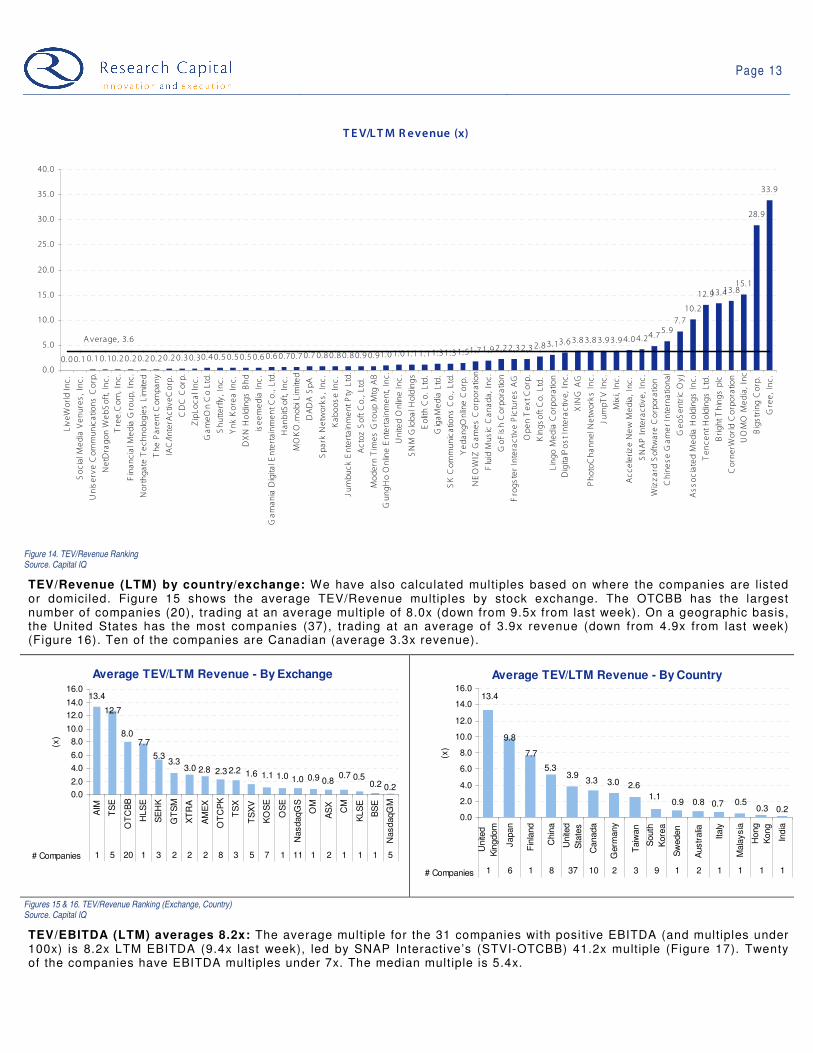
TEV/Revenue (LTM) averages 3.6x: The overall average TEV/Revenue (LTM) multiple for our group is 3.6x – down from 4.4x last week (Figure 14). However, this is skewed by Gree (3633-TSE) at 33.9x and Bigstring (BSGC-OTCBB) at 28.9x. The median is only 1.1x. Note that we exclude multiples greater than 50x. Thirty-four of the companies have multiples under 1.5x.
Page 13
TEV/LTM R evenue (x)
0.0 0.1 0.1 0.10.2 0.2 0.2 0.2 0.2 0.3 0.30.4 0.5 0.5 0.5 0.6 0.6 0.70.7 0.7 0.8 0.8 0.8 0.9 0.91.0 1.0 1.1 1.1 1.3 1.3 1.51.7
1.9 2.2 2.3 2.3 2.83.13.6 3.8 3.8 3.9 3.9
4.0 4.24.75.9
7.7
10.2
12.913.413.815.1
28.9
33.9
Average, 3.6
0.0
5.0
10.0
15.0
20.0
25.0
30.0
35.0
40.0
LiveWorld Inc.
Social Media Venures, Inc.
Uniserve Communications Corp.
NetDragon WebSoft, Inc.
Tree.Com, Inc.
Financial Media Group, Inc.
Northgate Technologies Limited
The Parent Company
IAC/InterActiveCorp.
CDC Corp.
ZipLocal Inc.
GameOn Co Ltd.
Shutterfly, Inc.
Ynk Korea Inc.
DXN Holdings Bhd
iseemedia Inc.
Gamania Digital Entertainment Co., Ltd.
HanbitSoft, Inc.
MOKO.mobi Limited
DADA SpA
Spark Networks, Inc.
Kaboose Inc.
Jumbuck Entertainment Pty Ltd.
Actoz Soft Co., Ltd.
Modern Times Group Mtg AB
GungHo Online Entertainment, Inc.
United Online Inc.
SNM Global Holdings
Eolith Co. Ltd.
GigaMedia Ltd.
SK Communications Co., Ltd.
YedangOnline Corp.
NEOWIZ Games Corporation
Fluid Music Canada, Inc.
GoFish Corporation
Frogster Interactive Pictures AG
Open Text Corp.
Kingsoft Co. Ltd.
Lingo Media Corporation
DigitalPost Interactive, Inc.
XING AG
PhotoChannel Networks Inc.
JumpTV Inc.
Mixi, Inc.
Accelerize New Media, Inc.
SNAP Interactive, Inc.
Wizzard Software Corporation
Chinese Gamer International
GeoSentric Oyj
Associated Media Holdings Inc.
Tencent Holdings Ltd.
Bright Things plc
CornerWorld Corporation
UOMO Media, Inc
Bigstring Corp.
Gree, Inc.
Figure 14. TEV/Revenue Ranking Source. Capital IQ
TEV/Revenue (LTM) by country/exchange: We have also calculated multiples based on where the companies are listed or domiciled. Figure 15 shows the average TEV/Revenue multiples by stock exchange. The OTCBB has the largest number of companies (20), trading at an average multiple of 8.0x (down from 9.5x from last week). On a geographic basis, the United States has the most companies (37), trading at an average of 3.9x revenue (down from 4.9x from last week) (Figure 16). Ten of the companies are Canadian (average 3.3x revenue).
Average TEV/LTM Revenue - By Exchange
0.20.20.50.7
0.80.91.01.01.11.62.22.32.83.03.3
5.3
7.78.0
12.7
13.4
0.0
2.0
4.0
6.0
8.0
10.0
12.0
14.0
16.0
AIM
TS
E
OT
CB
B
HLS
E
SE
HK
GT
SM
XT
RA
AM
EX
OT
CP
K
TS
X
TS
XV
KO
SE
OS
E
NasdaqG
S
OM
AS
X
CM
KLS
E
BS
E
NasdaqG
M
1 5 20 1 3 2 2 2 8 3 5 7 1 11 1 2 1 1 1 5
(x)
# Companies
Average TEV/LTM Revenue - By Country
0.3 0.20.50.70.80.9
1.1
2.63.03.33.9
5.3
7.7
9.8
13.4
0.0
2.0
4.0
6.0
8.0
10.0
12.0
14.0
16.0
Unite
d
Kin
gdom
Japan
Fin
land
Chin
a
Unite
d
Sta
tes
Canada
Germ
any
Taiw
an
South
Kore
a
Sw
eden
Austr
alia
Italy
Mala
ysia
Hong
Kong
India
1 6 1 8 37 10 2 3 9 1 2 1 1 1 1
(x)
# Companies
Figures 15 & 16. TEV/Revenue Ranking (Exchange, Country) Source. Capital IQ
TEV/EBITDA (LTM) averages 8.2x: The average multiple for the 31 companies with positive EBITDA (and multiples under 100x) is 8.2x LTM EBITDA (9.4x last week), led by SNAP Interactive’s (STVI-OTCBB) 41.2x multiple (Figure 17). Twenty of the companies have EBITDA multiples under 7x. The median multiple is 5.4x.

Page 14
TEV/LTM EB ITDA (x)
0.3 1.0 1.1 1.6 1.82.7 3.4 3.8 3.9 4.2 4.5 4.6 4.7 5.4 5.4 5.4
6.4 6.7 6.9 7.5 8.2 9.2 9.8 10.3 11.012.4
14.2
26.1
31.3
41.2
A verage, 8.2
0.0
5.0
10.0
15.0
20.0
25.0
30.0
35.0
40.0
45.0
NetDragon WebSoft, Inc.
Financial Media Group, Inc.
Northgate Technologies Limited
GameOn Co Ltd.
Jumbuck Entertainment Pty Ltd.
CornerWorld Corporation
Shutterfly, Inc.
Gamania Digital Entertainment Co., Ltd.
DXN Holdings Bhd
Spark Networks, Inc.
United Online Inc.
DADA SpA
Actoz Soft Co., Ltd.
GigaMedia Ltd.
IAC/InterActiveCorp.
Modern Times Group Mtg AB
NEOWIZ Games Corporation
YedangOnline Corp.
GungHo Online Entertainment, Inc.
CDC Corp.
Kingsoft Co. Ltd.
Open Text Corp.
XING AG
Mixi, Inc.
Kaboose Inc.
Chinese Gamer International
SK Communications Co., Ltd.
Tencent Holdings Ltd.
Uniserve Communications Corp.
SNAP Interactive, Inc.
Figure 17. TEV/EBITDA Ranking Source. Capital IQ
TEV/EBITDA (LTM) by country/exchange: Figure 18 shows the average TEV/EBITDA multiples by stock exchange. The OTCBB has the largest number of companies (20), trading at an average multiple of 15x, while companies on the TSXV have the highest multiples (31.3x). On a geographic basis, the United States has the most companies (37), trading at an average of 8.9x EBITDA (Figure 19). Ten of the companies are Canadian (average 17.2x EBITDA).
Average TEV/LTM EBITDA - By Exchange
0.11.11.83.94.24.6
5.45.96.06.98.08.19.811.011.6
15.0
31.3
0.0
5.0
10.0
15.0
20.0
25.0
30.0
35.0
TS
XV
OT
CB
B
SE
HK
TS
X
XT
RA
GT
SM
KO
SE
OS
E
TS
E
NasdaqG
S
OM
CM
AM
EX
KLS
E
AS
X
BS
E
RT
S
5 20 3 3 2 2 7 1 5 11 1 1 2 1 2 1 #N/A
(x)
# Companies
Average TEV/LTM EBITDA - By Country
1.81.1
3.94.6
5.46.37.27.58.08.99.8
11.6
17.2
0.0
2.0
4.0
6.0
8.0
10.0
12.0
14.0
16.0
18.0
20.0
Canada
Chin
a
Germ
any
Unite
d
Sta
tes
South
Kore
a
Hong
Kong
Taiw
an
Japan
Sw
eden
Italy
Mala
ysia
Austr
alia
India
10 8 2 37 9 1 3 6 1 1 1 2 1
(x)
# Companies
Figures 18 & 19. TEV/EBITDA Ranking (Exchange, Country) Source. Capital IQ
P/E (LTM) averages 14.6x: The average multiple for the 31 companies with positive earnings (and multiples under 100x) is 14.6x LTM EPS (unchanged), led again by TheStreet.com (TSCM-NASDAQ) 71.8x multiple (Figure 20). Eighteen of the companies have P/E multiples under 10x. The median is just 8.8x.

Page 15
P/E LTM (x)
1.1 1.3 1.7 1.8 2.0 2.6 3.1 3.4 3.9 5.4 5.4 6.3 7.1 7.2 8.8 9.1 9.6 11.0 11.313.3 13.7
15.7 16.820.5
27.6
33.9 35.4
42.3
59.1
71.8
Average, 14.6
0.0
10.0
20.0
30.0
40.0
50.0
60.0
70.0
80.0
Perfect World Co., Ltd.
Giant Interactive Group, Inc.
Netease.com Inc.
Northgate Technologies Limited
Shanda Interactive Entertainment Ltd.
Modern Times Group Mtg AB
LookSmart, Ltd.
Worlds.com Inc.
DXN Holdings Bhd
Spark Networks, Inc.
NetDragon WebSoft, Inc.
Ngi Group Inc.
Jumbuck Entertainment Pty Ltd.
DADA SpA
YedangOnline Corp.
GameOn Co Ltd.
GigaMedia Ltd.
Gamania Digital Entertainment Co., Ltd.
Kingsoft Co. Ltd.
NEOWIZ Games Corporation
Actoz Soft Co., Ltd.
IAC/InterActiveCorp.
Chinese Gamer International
XING AG
Mixi, Inc.
Open Text Corp.
Tencent Holdings Ltd.
Shutterfly, Inc.
SNAP Interactive, Inc.
TheStreet.com, Inc.
Figure 20. P/E Ranking Source. Capital IQ
P/E (LTM) by country/exchange: Figure 21 shows the average P/E multiples by stock exchange. The OTCBB has the largest number of companies (20), trading at an average multiple of 31.3x. On a geographic basis, the United States has the most companies (37), trading at an average of 28.7x earnings (Figure 22). Ten of the companies are Canadian (average 33.9x EPS).
Average P/E - By Exchange
1.82.6
3.95.47.17.211.9
13.413.914.417.4
20.5
31.3
37.5
0.0
5.0
10.0
15.0
20.0
25.0
30.0
35.0
40.0
NasdaqG
M
OT
CB
B
XT
RA
SE
HK
TS
E
GT
SM
NasdaqG
S
KO
SE
CM
AS
X
AM
EX
KLS
E
OM
BS
E
5 20 2 3 5 2 11 7 1 2 2 1 1 1
(x)
# Companies
Average P/E - By Country
2.63.9
7.17.27.4
11.912.5
14.420.5
28.7
33.9
0.0
5.0
10.0
15.0
20.0
25.0
30.0
35.0
40.0
Canada
Unite
d
Sta
tes
Germ
any
Japan
Taiw
an
South
Kore
a
Chin
a
Italy
Austr
alia
Mala
ysia
Sw
eden
10 37 2 6 3 9 8 1 2 1 1
(x)
# Companies
Figures 21 & 22. P/E Ranking (Exchange, Country) Source. Capital IQ

Page 16
UP CO MI NG EVE NTS
Upcoming EventsE vent Date Location Webs ite
Web 2.0 C anadian L eade rs hip S erie s - Ga ming Ma rch 3 T oronto http: //web2le aders hips eries . iglooevents .net/
E ngage! E xpo Ma rch 10-11 New Y ork www. enga geexpo.com
Me sh 200 9 April 7-8 T oronto www. mes hconference. com
Figure 23. Upcoming Events Source. Company reports
Earnings Calendar
C ompany Date & T ime Quarter Conf Call De tails
P hotoC ha nnel Ne tworks Inc. (T S X V :P N) W ednesda y, F ebrua ry 25 , 2009 4 :30 P M (E S T ) Q1 2009 888-300-0053
Netea se.com Inc. (NasdaqGS : NTE S ) W ednesda y, F ebrua ry 25 , 2009 8 :00 P M (E S T ) Q4 2008 800-218-0713
S handa Inte ra ctive E nterta inment L td. (Na sda qGS :S NDA ) T hursda y, F ebrua ry 26, 20 09 8: 00 AM (E S T ) Q4 2008 1-866-383-7989
P erfec t W orld Co. , Ltd. (NasdaqGS : PWR D) Monda y, March 02 , 2 009 8 :00 AM (E S T ) Q4 2008 1-866-519-4004
Figure 24. Earnings Calendar Source. Company reports

Page 17
C omparable C ompany Analys is > Web 2.0
P ric e P erformance
Company Name Currenc y Tic ker E xchange USD Market Cap ($m) Current Price 1 Wk 1 Mth 3 Mth 6 Mth 1 Yr 52 Week
Acce leri ze N ew Media, Inc. US D ACLZ OTCBB 8.3 0 .31 -11 .4% -11.4% -22. 5% -48. 3% -55. 7% -60 .3%
Actoz Soft Co. , Ltd. K R W A052790 K OS E 65. 2 11, 050 -13 .0% 4 .2% 25 . 6% 12 .1% 26.7% -21 .6%
AQ Inte ractive, Inc. J PY 3838 TS E 18. 3 31, 800 -2. 6% 10. 4% -9 .1% -75. 2% -89. 7% -90 .7%As sociated Media Holdings Inc. US D AS MH OTCPK 0.2 0 .01 -50 .0% -37.5% -37. 5% NM -87. 5% -93 .8%
Bigstring C orp. US D BS GC OTCBB 0.7 0 .01 -12 .5% -20.0% -39. 1% -81. 3% -93. 6% -94 .0%
Br ight Things plc G BP AIM:B G T AIM 3.3 0 .02 -12 .6% 10. 7% 82 . 4% -11. 5% -41. 5% -60 .9%
BroadWebAs ia Inc. US D BWB A OTCPK 85. 7 1 .01 -32 .7% 0 .0% 741 .7% -22. 3% NM -66 .3%
CDC Corp. US D CHIN.A Na sdaqGS 85. 2 0 .79 -10 .2% -5. 1% 3.9% -70. 1% -79. 3% -81 .2%
China G ateway Corpora tion US D CGW Y OTCBB 0.0 0 .00 -33 .3% -33.3% -80. 0% -94. 4% -99. 7% -99 .7%Chinese G amer International TW D GTS M: 3083 G TSM 271 .8 111 .00 -2. 6% 22. 9% 43 . 4% 31 .4% 16.1% -10 .5%
CornerW orld C orporation US D CWR L OTCBB 7.0 0 .15 -63 .4% -40.0% -25. 0% -76. 9% -89. 3% -89 .7%
DADA SpA E UR CM:DA CM 117 .7 5 .70 -8. 9% -8. 7% -11. 5% -51. 3% -57. 3% -64 .8%
DXN Holdings Bhd MYR DXN K LS E 20. 0 0 .32 -12 .5% -11.3% -13. 7% -19. 2% -33. 0% -43 .8%
Digita lP ost Interactive, Inc. US D DGLP OTCBB 0.5 0 .01 -38 .5% -66.7% -80. 0% -86. 7% -96. 9% -97 .6%Digita lTown, Inc. US D DGTW OTCBB 65. 2 2 .40 20. 0% 4 .3% 20 . 0% -40. 0% 4 .3% -60 .7%
Dolphin Digita l Media , Inc. US D DPDM OTCBB 24. 2 0 .50 -6. 0% -28.9% -41. 4% -44. 7% NM -55 .9%
Eolith Co. Ltd. K R W A041060 K OS E 18. 3 585 -0. 8% 13. 6% 20 . 6% -23. 5% -65. 2% -71 .3%
Extensions, Inc. US D EXT I OTCPK 14. 2 0 .15 -25 .0% 0 .0% 185 .7% 50 .0% 0 .0% -85 .1%
F inancia l Media Group, Inc. US D FNGP OTCBB 2.1 0 .03 113.3% 6 .7% -68. 0% -95. 4% -87. 2% -96 .7%
F luid Mus ic Canada , Inc. CAD TSX :FMN TS X 21. 0 0 .50 -16 .7% 58. 7% 66 . 7% -66. 2% NM -75 .5%F rogste r Inte ractive P ictures AG E UR FR G XTR A 12. 1 4 .03 -6. 7% -19.4% 7.5% -44. 7% -28. 3% -47 .3%
Gamania Digital E nterta inment Co. , L td. TW D 6180 G TSM 94. 3 21 .55 -7. 9% 0 .0% 70 . 4% -12. 6% -25. 7% -41 .7%
GameOn Co L td. J PY 3812 TS E 92. 9 91, 000 -20 .2% -25.5% -39. 3% -28. 3% -31. 6% -44 .3%
GeoS entric O yj E UR GE O1V HL SE 45. 6 0 .04 0 .0% 0 .0% 33 . 3% -33. 3% -50. 0% -55 .6%
Giant Inte ractive G roup, Inc. US D GA NY SE 1,438.1 6 .05 -2. 7% 3 .2% -1 .5% -37. 3% -41. 9% -64 .8%
GigaMedia L td. US D GIGM Na sdaqGS 325 .8 6 .03 -18 .3% -5. 9% 37 . 4% -47. 5% -69. 2% -71 .2%GoF ish Corporation US D GOFH OTCBB 3.2 0 .11 -45 .0% -52.2% -47. 6% -63. 3% -79. 2% -81 .4%
Gravity Co., Ltd US D GR V Y Na sdaqGM 19. 5 0 .70 -1. 4% -7. 9% 1.4% -51. 7% -58. 1% -67 .0%
Gree, Inc. J PY TSE :3632 TS E 1,116.5 4, 740 -11 .6% -17.6% NM NM NM -24 .8%
GungHo Online Entertainment, Inc. J PY 3765 OSE 135 .7 112, 400 11. 5% 14. 1% 10 . 6% -39. 4% -36. 9% -74 .2%
HanbitS oft, Inc. K R W A047080 K OS E 49. 4 3, 370 -17 .0% 9 .6% 13 . 5% 2.6% -45. 3% -52 .9%
IAC/Inte rActiveCorp. US D IAC I Na sdaqGS 2,102.2 14 .92 -0. 9% -0. 5% -0 .6% -13. 0% -62. 5% -70 .5%IAS E ne rgy, Inc. US D IASC .A OTCBB 1.5 0 .02 -16 .0% 0 .0% -58. 0% -89. 5% -94. 0% -94 .5%
IdeaE dge, Inc. US D OTCB B :IDAE OTCBB 16. 9 0 .40 -9. 1% -42.9% -77. 8% -83. 7% -62. 0% -85 .9%
is eemedia Inc. CAD IE E TS XV 3.3 0 .08 -33 .3% -11.1% 33 . 3% -52. 9% -81. 6% -82 .2%
J umbuck Entertainment P ty Ltd. AUD AS X: JMB ASX 12. 8 0 .40 0 .0% -16.7% 0.0% -35. 5% -44. 4% -48 .7%
J umpTV Inc. CAD TSX :J TV TS X 36. 4 0 .40 -9. 1% 33. 3% 14 . 3% -57. 9% -50. 0% -68 .8%
Kaboose Inc. CAD TSX :K AB TS X 42. 6 0 .38 0 .0% 8 .6% 40 . 7% -48. 6% -83. 0% -84 .1%
Kingsoft Co. Ltd. HK D 3888 S EHK 383 .5 2 .77 -4. 5% 4 .1% 32 . 5% -5 .1% 9 .9% -35 .7%Lingo Media Corpora tion CAD TSXV:LM TS XV 9.3 0 .90 0 .0% -8. 2% -23. 7% -51. 4% -30. 2% -59 .1%
LiveWorld Inc. US D LVWD OTCPK 1.2 0 .04 0 .0% 33. 3% -55. 6% -84. 0% -85. 7% -94 .7%
LookS mart, Ltd. US D LOOK Na sdaqGM 21. 6 1 .27 -7. 3% -5. 9% 0.8% -60. 4% -64. 8% -73 .5%
Magnitude Informa tion S ys tems Inc. US D MAG Y OTCBB 7.9 0 .02 -28 .0% -37.9% 5.9% 20 .0% 63.6% -48 .6%
Mixi, Inc. J PY 2121 TS E 594 .8 368, 000 -10 .9% -28.1% -37. 3% -56. 5% -70. 3% -71 .3%Modern T imes Group Mtg AB S EK MTG B OM 840 .3 112 .00 -15 .2% -16.1% -17. 8% -67. 8% -72. 4% -75 .4%
Moggle , Inc US D MMOG OTCBB 72. 6 2 .00 0 .0% 0 .0% 33 . 3% NM NM 0.0%
MOK O.mobi L imited AUD MKB ASX 2.1 0 .04 0 .0% -20.0% 0.0% 5.3% -27. 3% -43 .7%
NEOW IZ G ames Corpora tion K RW A095660 K OS E 217 .0 33, 750 0 .3% 46. 7% 108 .3% 62 .7% 11.0% -15 .6%
NetDra gon WebS oft, Inc. HK D 777 S EHK 190 .9 2 .80 -5. 1% 5 .7% 10 . 7% -47. 5% -76. 4% -79 .4%
Netea se. com Inc. US D NTES Na sdaqGS 2,292.5 18 .63 -3. 2% 4 .0% 6.5% -29. 8% -13. 1% -31 .4%NeXplore Corporation US D NXP C OTCPK 27. 9 0 .50 -36 .7% -23.1% -60. 6% -9 .1% NM -65 .5%
Ngi G roup Inc. J PY 2497 TS E 22. 4 17, 180 -34 .4% -64.7% -68. 9% -81. 5% -90. 7% -91 .4%
Northgate T echnologies L imited INR 590057 B SE 27. 0 38 .45 -17 .5% -17.5% -27. 2% -86. 8% -92. 1% -93 .0%
Open Text Corp. US D OTE X Na sdaqGS 1,657.7 31 .94 -10 .2% 0 .3% 23 . 1% -7 .0% -0.8% -18 .3%
Openwave S ys tems Inc. US D OPW V Na sdaqGS 68. 3 0 .82 -7. 9% 24. 2% 39 . 0% -43. 8% -60. 2% -71 .3%
Perfect W orld Co., Ltd. US D PWR D Na sdaqGS 696 .0 12 .20 -14 .7% -19.6% -25. 5% -51. 7% -54. 9% -63 .6%PhotoChannel Networks Inc. CAD TSXV:PN TS XV 52. 5 1 .96 10. 7% 24. 1% 63 . 3% -43. 0% -46. 4% -52 .8%
Quepasa Corp. US D QP SA Na sdaqCM 17. 7 1 .40 -2. 1% -24.3% -37. 2% -56. 9% -48. 1% -59 .5%
OAO R B C Informa tion S ys tems US D R BC I R TS 41. 6 0 .30 3 .4% -50.0% -80. 0% -96. 2% -97. 1% -97 .2%
Shanda Intera ctive Ente rtainment L td. US D SNDA Na sdaqGS 2,218.9 31 .98 4 .7% 15. 2% 37 . 7% 20 .1% -3.3% -16 .4%
Shutterfly, Inc. US D SFL Y Na sdaqGS 188 .0 7 .48 -11 .9% 19. 7% 6.9% -24. 0% -51. 1% -58 .4%
SK Communications Co. , Ltd. K R W A066270 K OS E 185 .1 6, 730 -17 .2% -4. 5% 60 . 2% -45. 5% -65. 9% -67 .9%SNAP Interactive, Inc. US D STV I OTCBB 10. 7 1 .00 1 .0% -1. 0% 34 . 0% 12 .4% 25.0% -9. 1%
SNM G lobal Holdings US D SNMN OTCPK 0.0 0 .00 -66 .7% 150.0% -99. 3% -99. 8% -100 .0% -100 .0%
Social Media V enures , Inc. US D SMV I OTCPK 0.0 1 .25 -12 .0% 17. 9% -12. 6% 400.0% NM -75 .0%
Spark Networks , Inc. US D LOV AMEX 53. 6 2 .50 -2. 0% 1 .6% -13. 8% -41. 5% -47. 0% -50 .5%
SpectrumDNA, Inc. US D SP XA OTCBB 4.9 0 .10 0 .0% -33.3% -58. 3% NM NM -83 .3%
Tencent Holdings Ltd. HK D 700 S EHK 10 ,814 .3 46 .65 -3. 4% 5 .4% 12 . 4% -27. 5% -5.4% -35 .3%The P arent Company US D KIDS .Q OTCPK 0.6 0 .02 -23 .3% -34.3% -97. 2% -98. 8% -99. 5% -99 .5%
The9 Limited US D NCTY Na sdaqGS 365 .0 13 .22 -8. 8% -15.8% 22 . 9% -29. 0% -38. 6% -53 .6%
TheS treet.com, Inc. US D TSCM Na sdaqGM 67. 7 2 .23 -14 .2% -23.4% -26. 4% -68. 6% -75. 4% -78 .7%
T ree .Com, Inc. US D TR EE Na sdaqGM 37. 3 3 .98 1 .8% -6. 4% 107 .3% -47. 6% NM -64 .1%
Unise rve Communications Corp. CAD TSXV:US S TS XV 1.0 0 .05 -37 .5% -9. 1% -72. 2% -80. 0% -87. 8% -88 .9%
United Online Inc. US D UNTD Na sdaqGS 390 .8 4 .76 -8. 3% -20.4% -21. 7% -55. 9% -52. 3% -61 .9%
UOMO Media, Inc US D UOMO OTCBB 6.8 0 .08 0 .0% -20.0% -44. 8% -78. 4% -88. 2% -90 .0%
VO IS , Inc. US D VO IS OTCBB 5.4 0 .75 87. 5% 150.0% 0.0% -81. 3% NM -86 .6%
W ebzen Inc. US D WZE N Na sdaqGM 13. 4 1 .13 -24 .8% -9. 8% 38 . 6% -56. 6% -66. 2% -74 .7%
W izza rd S oftwa re Corporation US D WZE AMEX 29. 3 0 .65 -11 .0% -6. 1% -35. 0% -52. 2% -76. 4% -77 .3%
W oozyF ly, Inc. US D WZY F OTCBB 2.6 0 .15 0 .0% 0 .0% NM NM NM -96 .3%
W orlds .com Inc. US D WDDD OTCBB 9.4 0 .18 -10 .0% 12. 5% 28 . 6% -37. 9% -45. 5% -60 .0%W ynds torm Corporation US D WY ND OTCBB 2.2 0 .12 -4. 0% 0 .0% -40. 0% -80. 0% NM -85 .9%
XING AG E UR O1BC XTR A 205 .5 31 .00 4 .2% 8 .4% 24 . 0% -10. 3% -23. 4% -33 .5%
YedangOnline Corp. K R W A052770 K OS E 69. 4 6, 630 -9. 2% -6. 5% 20 . 5% -25. 9% -29. 9% -47 .2%
Ynk K orea Inc. K R W A023770 K OS E 6.7 4, 100 -11 .4% 3 .8% -24. 2% -57. 9% -78. 4% -79 .4%
ZipL ocal Inc. CAD TSXV:ZIP T S XV 0.3 0 .01 -75 .0% -75.0% -75. 0% -95. 0% -96. 6% -97 .7%
High 113.3% 150.0% 741 .7% 400.0% 63.6% 0 .0%Low -75 .0% -75.0% -99. 3% -99. 8% -100 .0% -100 .0%
Average 333.1 -9.9% -3.7% 5.6% -38.8% -52.4% -65.8%
Median -9. 1% -5. 1% 0.0% -47. 6% -57. 3% -68 .8%
Figure 25. Price Performance Source. Capital IQ

Page 18
Comparable Company Analys is > Web 2.0Valuation Multiples
Company Name
P rimary
E xchange Ticker
USD Market
C ap ($m)
TE V/LTM
R evenue
TEV/ NTM
R evenue
TEV/LTM
EB ITDA
TE V/NTM
EB ITDA P /LTM E P S P /NTM E P S P /TangBV
Acce lerize N ew Media, Inc. OTCBB ACLZ 8 . 3 4 .0x - - - - - -
Actoz Soft Co. , Ltd. K OS E A052790 65 .2 0 .9x - 4 .7x - 13. 7x - 1. 4x
AQ Interactive, Inc. TS E 3838 18 .3 - - - - - - 0. 3x
As sociated Media Holdings Inc. OTCPK ASMH 0. 2 10. 2x - - - - - -
Bigs tring C orp. OTCBB B SGC 0. 7 28. 9x - - - - - -Br ight Things plc A IM AIM:B GT 3 . 3 13. 4x - - - - - -
BroadW ebAs ia Inc. OTCPK BWBA 85 .7 - - - - - - -CDC Corp. Na sdaqGS CHIN .A 85 .2 0 .3x 0. 4x 7 .5x 6 .1 x - 11 .1x -
China G ateway Corpora tion OTCBB CGWY 0. 0 0 .0x - - - - - -
Chinese G amer International G T SM G TSM:3083 271 .8 5 .9x - 12.4 x - 16. 8x - 5. 5xCornerW orld Corporation OTCBB CWR L 7 . 0 13. 8x - 2 .7x - - - -
DADA SpA CM CM:DA 117 .7 0 .7x - 4 .6x - 7.2x - -DXN Holdings Bhd K LS E DXN 20 .0 0 .5x - 3 .9x - 3.9x - 0. 4x
Digita lP os t Interactive, Inc. OTCBB DG LP 0 . 5 3 .6x - - - - - -
Digita lTown, Inc. OTCBB DG TW 65 .2 - - - - - - -Dolphin Digita l Media , Inc. OTCBB DP DM 24 .2 - - - - - - -
Eolith Co. Ltd. K OS E A041060 18 .3 1 .1x - - - - - -E xtensions, Inc. OTCPK E XT I 14 .2 - - - - - - -
F ina ncia l Media Group, Inc. OTCBB FNGP 2. 1 0 .2x - 1 .0x - - - -
F luid Mus ic Canada , Inc. TS X T S X: FMN 21 .0 1 .9x 1. 3x - - - - 1. 7xF rogs ter Interactive P ictures AG XTR A F R G 12 .1 2 .3x - - - - - 1. 2x
Gamania Digital E nterta inment Co. , L td. G T SM 6180 94 .3 0 .6x - 3 .8x - 11. 0x - 1. 5xGameOn Co L td. TS E 3812 92 .9 0 .4x - 1 .6x - 9.1x - 1. 2x
GeoS entric Oyj HL S E G E O1V 45 .6 7 .7x - - - - - 7. 0x
Giant Inte ractive G roup, Inc. NY SE G A 1 ,438 .1 - - - - 1.3x 12 .6x 0. 3xGigaMedia L td. Na sdaqGS G IGM 325 .8 1 .3x 1. 3x 5 .4x 5 .0 x 9.6x 8. 9x 3. 1x
GoF ish Corporation OTCBB G OFH 3. 2 2 .2x - - - - - -Gravity Co., Ltd Na sdaqGM G R V Y 19 .5 - - - - - - -
Gree, Inc. TS E T SE :3632 1 ,116 .5 33. 9x - - - - - 16 . 6x
GungHo Online E nte rtainment, Inc. OS E 3765 135 .7 1 .0x - 6 .9x - - - 40 . 3xHanbitS oft, Inc. K OS E A047080 49 .4 0 .7x - - - - - 1. 8x
IAC /Inte rActiveCorp. Na sdaqGS IAC I 2 ,102 .2 0 .2x 0. 3x 5 .4x 2 .1 x 15. 7x 24 .3x 1. 0xIAS E nergy, Inc. OTCBB IAS C .A 1 . 5 - - - - - - -
IdeaE dge, Inc. OTCBB OTCB B :IDAE 16 .9 - - - - - - 12 . 4x
is eemedia Inc. TS XV IE E 3 . 3 0 .6x - - - - - 1. 1xJ umbuck Entertainment P ty Ltd. ASX AS X: JMB 12 .8 0 .8x - 1 .8x - 7.1x - 1. 6x
J umpTV Inc. TS X T SX :J T V 36 .4 3 .9x - - - - - 2. 6x
Ka boose Inc. TS X T SX: K AB 42 .6 0 .8x 0. 7x 11.0 x 5 .5 x - - -
K ingsoft Co. Ltd. S EHK 3888 383 .5 2 .8x - 8 .2x - 11. 3x - 2. 5x
Lingo Media Corpora tion TS XV T SXV : LM 9. 3 3 .1x - - - - - -
LiveWorld Inc. OTCPK LVWD 1. 2 0 .0x - - - - - 0. 6xLookS mart, Ltd. Na sdaqGM LOOK 21 .6 - - - - 3.1x - 0. 7x
Magnitude Informa tion S ys tems Inc. OTCBB MAG Y 7. 9 - - - - - - -
Mixi, Inc. TS E 2121 594 .8 3 .9x - 10.3 x - 27. 6x - 4. 5x
Modern T imes Group Mtg AB OM MTG B 840 .3 0 .9x 0. 8x 5 .4x 5 .8 x 2.6x 5. 7x -
Moggle , Inc OTCBB MMOG 72 .6 - - - - - - -MOK O.mobi L imited ASX MKB 2 . 1 0 .7x - - - - - 1. 4x
NEOW IZ G ames Corpora tion K OS E A095660 217 .0 1 .7x - 6 .4x - 13. 3x - 7. 8xNetDragon WebS oft, Inc. S EHK 777 190 .9 0 .1x - 0 .3x - 5.4x - 1. 1x
Netea se. com Inc. Na sdaqGS NTE S 2 ,292 .5 - - - - 1.7x 10 .0x 0. 5x
NeXplore Corporation OTCPK NXP C 27 .9 - - - - - - -Ngi G roup Inc. TS E 2497 22 .4 - - - - 6.3x - 0. 3x
Northgate T echnologies L imited B SE 590057 27 .0 0 .2x - 1 .1x - 1.8x - -Open T ext Corp. Na sdaqGS OTEX 1 ,657 .7 2 .3x 2. 1x 9 .2x 8 .0 x 33. 9x 12 .5x -
Openwave S ys tems Inc. Na sdaqGS OPWV 68 .3 - - - - - 27 .3x 0. 9x
Pe rfect W orld Co., Ltd. Na sdaqGS PW R D 696 .0 - - - - 1.1x 5. 8x 0. 4xPhotoChannel Networks Inc. TS XV T S XV : PN 52 .5 3 .8x 2. 3x - 7 .0 x - 31 .1x 18 . 5x
Quepasa Corp. Na sdaqCM QP SA 17 .7 - - - - - - 7. 3xOAO R B C Informa tion S ys tems R TS R BC I 41 .6 0 .0x - 0 .1x - - - -
Shanda Intera ctive E nte rtainment L td. Na sdaqGS SNDA 2 ,218 .9 - - - - 2.0x 11 .5x 1. 0x
Shutterfly, Inc. Na sdaqGS S F LY 188 .0 0 .5x 0. 5x 3 .4x 3 .1 x 42. 3x - 1. 1xSK Communications Co. , Ltd. K OS E A066270 185 .1 1 .3x - 14.2 x - - - -
SNAP Interactive, Inc. OTCBB S TV I 10 .7 4 .2x - 41.2 x - 59. 1x - 7. 8xSNM G lobal Holdings OTCPK S NMN 0. 0 1 .1x - - - - - -
Social Media V enure s , Inc. OTCPK S MV I 0 . 0 0 .1x - - - - - -
Spark Networks , Inc. AMEX LOV 53 .6 0 .8x - 4 .2x - 5.4x - -SpectrumDNA, Inc. OTCBB S PXA 4. 9 - - - - - - 5. 2x
Tencent Holdings Ltd. S EHK 700 10 ,814 . 3 12. 9x - 26.1 x - 35. 4x - 14 . 0xThe P arent Company OTCPK KIDS .Q 0 . 6 0 .2x - - - - - -
The9 Limited Na sdaqGS NCTY 365 .0 - - - - 1.0x 6. 7x 0. 1x
TheS treet.com, Inc. Na sdaqGM T SCM 67 .7 - - - - 71. 8x - 0. 7xT ree .Com, Inc. Na sdaqGM TR E E 37 .3 0 .2x 0. 2x - - - - 0. 6x
Unis erve Communications Corp. TS XV TS XV :US S 1 . 0 0 .1x - 31.3 x - - - -United Online Inc. Na sdaqGS UNTD 390 .8 1 .0x 0. 7x 4 .5x 3 .0 x - 7. 3x -
UOMO Media, Inc OTCBB UOMO 6. 8 15. 1x - - - - - -
VO IS , Inc. OTCBB VO IS 5 . 4 - - - - - - -W ebzen Inc. Na sdaqGM WZE N 13 .4 - - - - - - 0. 0x
W izza rd S oftwa re Corporation AMEX W ZE 29 .3 4 .7x - - - - - -
W oozyF ly, Inc. OTCBB W ZYF 2 . 6 - - - - - - -
W orlds .com Inc. OTCBB WDDD 9. 4 - - - - 3.4x - -
W ynds torm Corporation OTCBB WYND 2. 2 - - - - - - -
XING AG XTR A O1B C 205 .5 3 .8x - 9 .8x - 20. 5x - 5. 6xYedangOnline Corp. K OS E A052770 69 .4 1 .5x - 6 .7x - 8.8x - 4. 1x
Ynk K orea Inc. K OS E A023770 6 . 7 0 .5x - - - - - -
ZipL ocal Inc. TS XV T SX V: ZIP 0 . 3 0 .3x - - - - - -
High 10 ,814 . 3 33. 9x 2. 3x 41.2 x 8 .0 x 71. 8x 31 .1x 40 . 3xLow 0. 0 0 .0x 0. 2x 0 .1x 2 .1 x 1.0x 5. 7x 0. 0x
Average 333.1 3.6x 1.0x 8.2x 5.1x 14.6x 13.4x 4.4x
Median 27 .0 1 .1x 0. 7x 5 .4x 5 .5 x 8.8x 11 .1x 1. 4x
Figure 26. Valuation Comparison Source. Capital IQ

Page 19
Comparable Company Analys is > Web 2.0S ummary by Country
Company Name US D Market Cap ($m) Avg US D Market Cap ($m ) US D LTM Total R ev ($m ) US D LTM Total EB ITDA ($m) E B ITDA %
United S tates 37 China 18 ,399 .2 C hina 2, 299. 9 United S ta tes 3 ,120 .5 C hina 1,38 3.5 C hina 49.9%
C anada 10 Unite d S tate s 3 ,371 .5 S weden 840. 3 C hina 2 ,691 .1 S weden 23 9.7 Aus tra lia 46.0%
S outh Kore a 9 J apan 1 ,980 .5 J apa n 330. 1 S weden 1 ,499 .2 C anada 18 4.5 T a iwan 29.3%
China 8 Ca nada 1 ,811 .3 T a iwan 230. 6 C ana da 885 .5 United S tates 13 2.9 J apan 25.7%
J apa n 6 S wede n 840 .3 C anada 181. 1 J apan 509 .1 J apan 13 2.0 Unite d S tate s 23.1%
T aiwan 3 T a iwan 691 .9 Ita ly 117. 7 S outh K orea 482 .0 T aiwan 8 3.6 I ndia 17.6%
Aus tra lia 2 S outh K orea 643 .8 G erma ny 108. 8 Hong K ong 428 .1 S outh K ore a 5 6.1 S wede n 16.0%
G erma ny 2 G ermany 217 .6 United S tates 91. 1 T aiwa n 344 .7 Ita ly 3 4.5 I ta ly 16.0%
Ma lays ia 1 I ta ly 117 .7 Hong K ong 85. 2 Italy 216 .0 India 2 3.8 Mala ys ia 13.3%
Hong K ong 1 Hong K ong 85 .2 S outh K ore a 71. 5 India 135 .5 Hong K ong 1 8.8 R uss ia 13.1%
F inla nd 1 F inland 45 .6 F inla nd 45. 6 R us s ia 131 .7 R us s ia 1 7.2 S outh K orea 5 .8%
Ita ly 1 R uss ia 41 .6 R us s ia 41. 6 Malaysia 76 .0 G erma ny 1 2.4 Hong K ong 4 .4%
United K ingdom 1 India 27 .0 India 27. 0 G ermany 45 .1 Malays ia 1 0.1 G ermany -10 .9%
India 1 Mala ys ia 20 .0 Ma lays ia 20. 0 Austra lia 11 .4 Aus tra lia 2.7 C a nada -19 .1%
S weden 1 Aus tralia 14 .9 Aus tralia 7. 4 F in land 5 .2 United K ingdom -1.6 Unite d K ingdom N/A
R us s ia 1 Unite d K ingdom 3 .3 United K ingdom 3. 3 United K ingdom 0 .2 F in land -1 2.0 F inland N/A
Grand Total 85 G rand Tota l 28,311.5 G rand Total 333.1 G rand Total 10,581.4 G rand Total 2,318.2 G rand Tota l 17.8%
Figure 27. Comparison by Country Source. Capital IQ
Comparable Company Analys is > Web 2.0S ummary by Exc hange
Company Name US D Market Cap ($m) Avg US D Market Cap ($m ) US D LTM Total R ev ($m ) US D LTM Total EB ITDA ($m) E B ITDA %
OT CB B 20 S E HK 11 ,388 .7 S E HK 3, 796. 2 OM 1 ,499 .2 Nas da qG S 1,19 7.7 OT CB B 69.0%
Nas da qG S 11 Na sdaqG S 10 ,390 .4 NY S E 1, 438. 1 Nas daqGS 478 .7 S E HK 53 0.1 NY S E 63.5%
OT CP K 8 T S E 1 ,844 .8 Nas da qG S 944. 6 S E HK 368 .6 OM 23 9.7 AS X 46.0%
K OS E 7 NY S E 1 ,438 .1 OM 840. 3 NY S E 245 .2 NY S E 15 5.7 S E HK 44.0%
T S E 5 OM 840 .3 T S E 369. 0 CM 216 .0 T S E 11 6.2 G T S M 32.0%
Nas da qGM 5 K O S E 611 .0 G T SM 183. 1 BS E 135 .5 K OS E 5 1.8 T S E 27.8%
T S XV 5 G T S M 366 .1 O S E 135. 7 R T S 131 .7 G T SM 35.6 Na sdaqG S 26.7%
S EHK 3 OTC B B 252 .2 CM 117. 7 OS E 107 .9 CM 34.5 AME X 19.5%
T S X 3 X T R A 217 .6 XT R A 108. 8 Nas daqGM 84 .4 B S E 2 3.8 B S E 17.6%
AME X 2 Na sdaqGM 159 .5 K OS E 87. 3 T S E 80 .2 R T S 1 7.2 OM 16.0%
XT R A 2 OS E 135 .7 HLS E 45. 6 K L S E 76 .0 OS E 1 5.8 CM 16.0%
ASX 2 OTC P K 129 .8 R T S 41. 6 G T SM 72 .1 XT R A 1 2.4 OS E 14.7%
G T SM 2 CM 117 .7 AME X 41. 5 KOS E 61 .5 K LS E 1 0.1 K LS E 13.3%
K LS E 1 T S X 100 .0 T S X 33. 3 AME X 33 .1 AME X 5.2 R T S 13.1%
HLS E 1 AME X 83 .0 Nas da qGM 31. 9 T S X 25 .0 AS X 2.7 K OS E 6 .2%
OS E 1 T S XV 66 .4 B S E 27. 0 XT R A 22 .5 A IM -1.6 Na sdaqGM 0 .9%
CM 1 HL S E 45 .6 K LS E 20. 0 OT C PK 21 .0 T S X -5.8 T S X -3 .9%
B S E 1 R T S 41 .6 Nas da qCM 17. 7 T S X V 9 .0 Nas da qCM -1 1.8 X T R A -10 .9%
Nas da qCM 1 B S E 27 .0 O TC P K 16. 2 AS X 5 .7 T S X V -1 1.9 T S XV -19 .9%
NY S E 1 K LS E 20 .0 T S XV 13. 3 HLS E 5 .2 HLS E -1 2.0 OT CP K -29 .4%
A IM 1 Na sdaqCM 17 .7 O TC B B 12. 6 OT C BB 1 .7 Nas da qGM -1 7.4 A IM N/A
OM 1 AS X 14 .9 AS X 7. 4 AIM 0 .2 OT C PK -2 7.2 Na sdaqCM N/A
R T S 1 A IM 3 .3 A IM 3. 3 Nas daqCM 0 .1 OT C BB -4 2.4 HL S E N/A
Grand Total 85 G rand Tota l 28,311.5 G rand Total 333.1 G rand Total 133.9 G rand Total 2,318.2 G rand Tota l 17.8%
Figure 28. Comparison by Exchange Source. Capital IQ

Page 20
Financing - Last Three Months (US$ m)Month Company Name Country Angel/Seed Debt financing PIPE Se ries A Series B Series C Series D Series E Grand Total
Dec-08 G oFish USA 22.5 22.5
NetShelter Canada 11.1 11.1
Blue Kai USA 10.5 10.5
Taptu UK 9.9 9.9
FooMojo USA 9.9 9.9
Scribd USA 9.0 9.0
Superfish I srael 5.3 5.3
Tagged USA 5.0 5.0
Snapmyl ife USA 5.0 5.0
Jackbe USA 5.0 5.0
ChakPak India 5.0 5.0
Tumblr USA 4.5 4.5
Playdo Sweden 4.3 4.3
O verlay.TV Canada 3.8 3.8
DotBlu USA 2.0 2.0
Angie's List USA 1.0 1.0
StockTwits USA 0.8 0.8
Dec-08 Total 5.0 22.5 31.9 49.2 1.0 5.0 114.6
Jan-09 Yodle USA 13.0 13.0
AdMob USA 12.5 12.5
Aster Data System s USA 12.0 12.0
VirtuOz France 11.4 11.4
Nurien Korea 10.0 10.0
IMVU USA 10.0 10.0
NewsG ator USA 10.0 10.0
DECA USA 10.0 10.0
G o Internet Media USA 10.0 10.0
RatePoint USA 10.0 10.0
O ne True Media USA 9.0 9.0
SundaySky I srael 8.0 8.0
Play Hard Sports USA 8.0 8.0
JibJab USA 7.5 7.5
Xobni USA 7.0 7.0
InsideView USA 6.5 6.5
Kewego France 6.2 6.2
Fl iqz USA 6.0 6.0
Motionbox USA 6.0 6.0
SocialMedia USA 6.0 6.0
Sportsblogs USA 5.0 5.0
G eni USA 5.0 5.0
AboutUs USA 5.0 5.0
G box USA 5.0 5.0
E-G lobal Sports Network USA 3.5 3.5
m Ego USA 2.5 2.5
Tripwolf Aust ria 2.5 2.5
Hubdub UK 1.2 1.2
Snooth USA 1.0 1.0
CoveritLive Canada 1.0 1.0
Identi.ca Canada 0.2 0.2
Meez USA
Jan-09 Total 4.7 45.2 68.9 82.2 10.0 211.0
Feb-09 Tw itter USA 35.0 35.0
Synthasi te South Af rica 20.0 20.0
Tremor Media USA 18.0 18.0
O fferpal Media USA 15.0 15.0
Emergent Game Technologies USA 12.5 12.5
O utbrain I srael 12.0 12.0
Tvtrip France 9.0 9.0
O odle USA 5.6 5.6
TextDigger USA 4.3 4.3
O neSpot USA 4.2 4.2
Mixpo Canada 4.0 4.0
FetchDog USA 4.0 4.0
Virtual Fairground Netherlands 4.0 4.0
7 Bill ion People USA 3.0 3.0
WhistleBox USA 2.3 2.3
O utright USA 2.0 2.0
Tvinci I srael 1.6 1.6
Fi ltrbox USA 1.4 1.4
Cake Financial USA 1.3 1.3
fav.or. it UK 0.7 0.7
Feb-09 Total 4.0 24.8 60.0 58.6 12.5 159.9
Grand Total 8.7 5.0 22.5 101.9 178.1 141.8 5.0 22.5 485.4
Figure 29. Financing, Last Three Months Source. Company reports
Page 21
RELEVANT DISCLOSURES APPLICABLE TO: NONE
L IST OF D IS CLOS URE TE RMS :
1. None applicable.
ANALYST CERTIFICATION
Each analyst of Research Capital Corporation whose name appears in this report hereby certif ies that (i) the
recommendations and opinions expressed in this research report accurately reflect the analyst’s personal views and (ii)
no part of the research analyst’s compensation was or will be directly or indirectly related to the specific conclusions or
recommendations expressed in this research report.
In format i on about Research Capi ta l Corpora t i on ’s Rat i ng Sys tem, the dis t r i bu t i on o f our research to c l ien ts and the percen tage o f recommendat i ons whi ch are in each o f our rat i ng ca tegor i es i s avai labl e on our web si te a t www. researchcapi ta l . com.
The in format i on con tai ned i n th i s report has been drawn f rom sources bel i eved to be re l i able but i t s accuracy o r comple teness is no t guaranteed , nor i n p rovi d i ng i t does Research Capi ta l Corpora t ion assume any responsib i l i ty o r l iabi l i ty . Research Capi ta l Corpora t ion , i t s d i recto rs , o f f i cers and o ther employees may, f rom t ime to t ime, have posi t ions i n the secur i t ies ment i oned herein . Conten ts o f th i s report cannot be reproduced i n who le or i n par t wi thou t the expressed permissi on o f Research Capi ta l Corporat i on. (U.S. Ins t i tu t ional Cl ien ts — Research Capi ta l U.S.A. Inc. (a whol l y owned subsid i ary o f Research Capi ta l Corpora t ion) accep ts responsib i l i t y fo r the contents o f th i s repor t sub jec t to the terms & l imi tat i ons se t out above . F i rms o r i ns t i tu t i ons recei v i ng th i s repor t should e f fect t ransact i ons in secur i t i es d i scussed i n the repor t through Research Capi ta l U.S.A. Inc. , a Broker-Dealer Regis te red wi th the Uni ted Sta tes Secur i t ies and Exchange Commissi on) .
Toronto 416.860.7600 Montreal 514.399.1500 Vancouver 604.662.1800 Calgary 403.265.7400 Regina 306.566.7550
www.researchcapital.com