09-02-12 Hitachi Construction Results Q1-1
16
7/31/2019 09-02-12 Hitachi Construction Results Q1-1 http://slidepdf.com/reader/full/09-02-12-hitachi-construction-results-q1-1 1/16
Transcript of 09-02-12 Hitachi Construction Results Q1-1

7/31/2019 09-02-12 Hitachi Construction Results Q1-1
http://slidepdf.com/reader/full/09-02-12-hitachi-construction-results-q1-1 1/16

7/31/2019 09-02-12 Hitachi Construction Results Q1-1
http://slidepdf.com/reader/full/09-02-12-hitachi-construction-results-q1-1 2/16

7/31/2019 09-02-12 Hitachi Construction Results Q1-1
http://slidepdf.com/reader/full/09-02-12-hitachi-construction-results-q1-1 3/16
●Net sales increased by 14% year-on-year, despite a substantial
decrease in China, which was offset by a sales increase in other Asiancountries. An increase in mining machinery sales also contributed to
sales growth as a whole.
●Operating income increased by 61% year-on-year.
●Net income was more than twice the figure of the previous year.

7/31/2019 09-02-12 Hitachi Construction Results Q1-1
http://slidepdf.com/reader/full/09-02-12-hitachi-construction-results-q1-1 4/16

7/31/2019 09-02-12 Hitachi Construction Results Q1-1
http://slidepdf.com/reader/full/09-02-12-hitachi-construction-results-q1-1 5/16
●The fall in sales in China was offset by an increase in Asia & Oceania
and The Americas. As a result, the overseas sales ratio was 79%,remaining at the previous year’s level.
7/31/2019 09-02-12 Hitachi Construction Results Q1-1
http://slidepdf.com/reader/full/09-02-12-hitachi-construction-results-q1-1 6/16
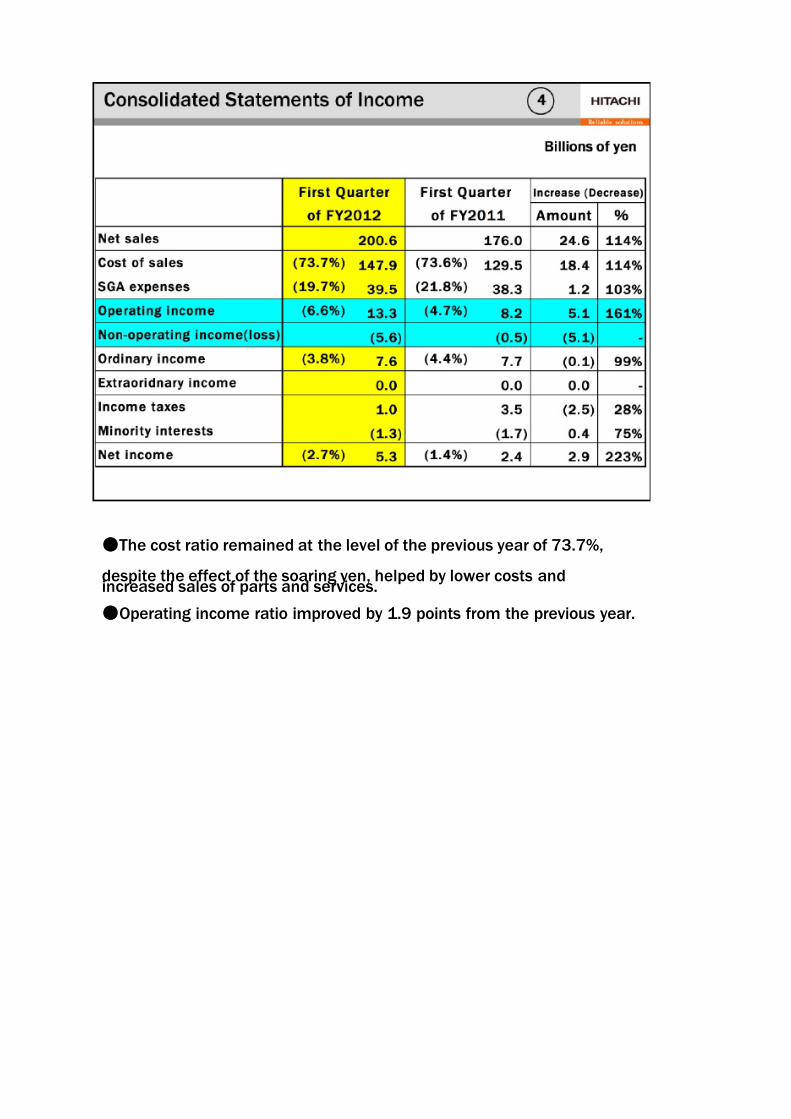
●The cost ratio remained at the level of the previous year of 73.7%,
despite the effect of the soaring yen, helped by lower costs andincreased sales of parts and services.
●Operating income ratio improved by 1.9 points from the previous year.

7/31/2019 09-02-12 Hitachi Construction Results Q1-1
http://slidepdf.com/reader/full/09-02-12-hitachi-construction-results-q1-1 7/16
●Foreign exchange gain declined by 3.7 billion yen from the previous
year, due to the effects of the highly appreciated yen against emergingnations’ currencies, such as the Indian rupee.

7/31/2019 09-02-12 Hitachi Construction Results Q1-1
http://slidepdf.com/reader/full/09-02-12-hitachi-construction-results-q1-1 8/16

7/31/2019 09-02-12 Hitachi Construction Results Q1-1
http://slidepdf.com/reader/full/09-02-12-hitachi-construction-results-q1-1 9/16
●The foreign exchange losses of 5.3 billion yen was offset by impacts
of both price increase and material cost decrease.
● Sales volume increase covered 2.7 billion yen of increase in
overheads and 8.3 billion yen of decrease in “others (mix account)”. The
decrease in “others (mix account)” was mainly due to a decline in sales
in China.

7/31/2019 09-02-12 Hitachi Construction Results Q1-1
http://slidepdf.com/reader/full/09-02-12-hitachi-construction-results-q1-1 10/16
●Total assets were reduced by 54.6 billion yen from the previous year
end. The major cause of this was a reduction in accounts receivable.

7/31/2019 09-02-12 Hitachi Construction Results Q1-1
http://slidepdf.com/reader/full/09-02-12-hitachi-construction-results-q1-1 11/16
●Free Cash Flows increased by 19.1 billion yen from the previous year,
which generated a positive cash flows.

7/31/2019 09-02-12 Hitachi Construction Results Q1-1
http://slidepdf.com/reader/full/09-02-12-hitachi-construction-results-q1-1 12/16
●Previous forecast for China and India were revised down by 17,000
units and 1,000 units, respectively. The global forecast was thus reviseddown by 17,000 units to 217,000 units.

7/31/2019 09-02-12 Hitachi Construction Results Q1-1
http://slidepdf.com/reader/full/09-02-12-hitachi-construction-results-q1-1 13/16
●The income forecast for FY12 reflected an extraordinary gain of
approximately 10 billion yen, the impact of TCM sell-off. Deferred trendreversal timing in China and a slowdown in market growth in India were
also factored in, which resulted in a total net sales forecast of 820
billion yen.
●Operating income increased by 31% year-on-year, with an increase in
price and reduction in costs.
●Assumed foreign exchange rates; USD: 78 yen, EUR: 100 yen, and
RMB: 12.3 yen.
(Previous assumptions; USD: 78 yen, EUR: 105 yen, and RMB: 12.5
yen) .
●Dividend per share is planned at 40 yen per year.
7/31/2019 09-02-12 Hitachi Construction Results Q1-1
http://slidepdf.com/reader/full/09-02-12-hitachi-construction-results-q1-1 14/16
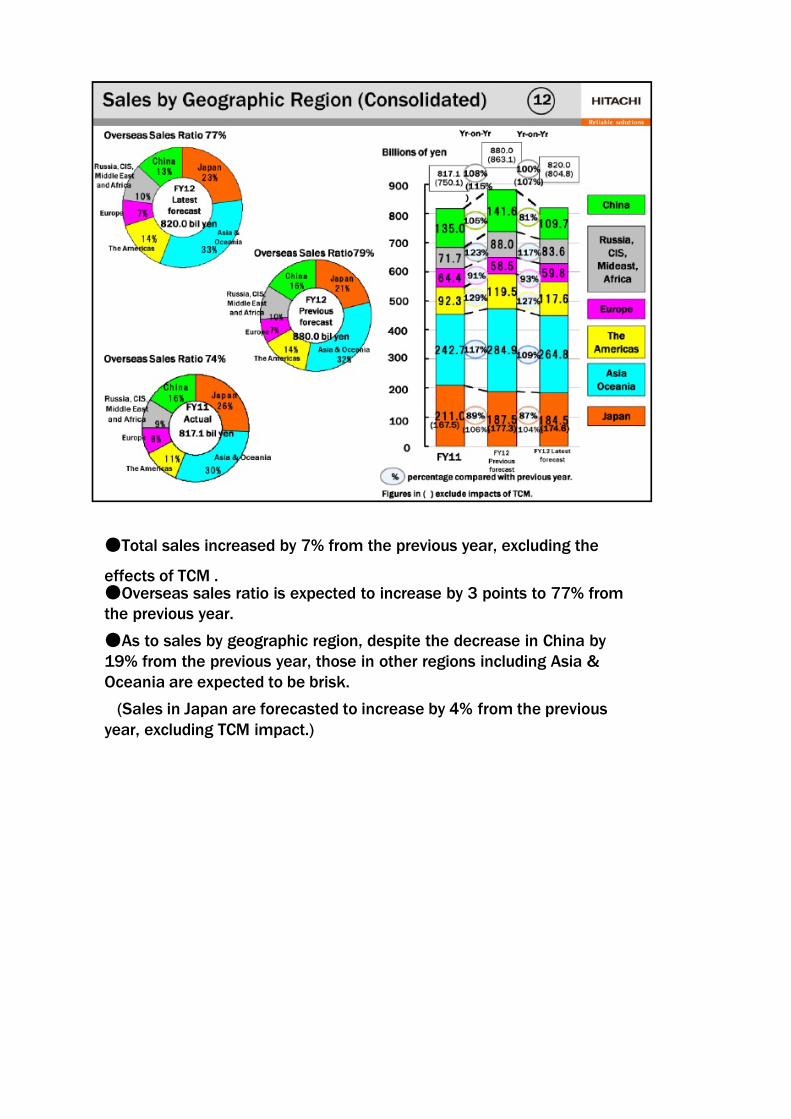
●Total sales increased by 7% from the previous year, excluding the
effects of TCM .●Overseas sales ratio is expected to increase by 3 points to 77% from
the previous year.
●As to sales by geographic region, despite the decrease in China by
19% from the previous year, those in other regions including Asia &
Oceania are expected to be brisk.
(Sales in Japan are forecasted to increase by 4% from the previous
year, excluding TCM impact.)

7/31/2019 09-02-12 Hitachi Construction Results Q1-1
http://slidepdf.com/reader/full/09-02-12-hitachi-construction-results-q1-1 15/16
●Sales volume increase of 27.3 billion yen will be mainly due to the
increased demand in Asia & Oceania and The Americas. Foreignexchange loss is expected to be 5.6 billion yen.
●Although overhead costs will increase to cover the sales growth, price
increase and reduced material costs will contribute to increase profits,
which will result in 62 billion yen of ordinary income, an increase of 10.3
billion yen from the previous year.

7/31/2019 09-02-12 Hitachi Construction Results Q1-1
http://slidepdf.com/reader/full/09-02-12-hitachi-construction-results-q1-1 16/16